84
Annual Report 2013

Annual Report 2013

Caring for the world, one person at a time…inspires and unites the people of
Johnson & Johnson.
ON THE COVER:Daniel shares a special moment with his teacher Dilshaad. Daniel and Dilshaadare together at the SOS Children’s Village in Cape Town, South Africa. For morethan 20 years, Johnson & Johnson has partnered with SOS Children’s Village, thelargest organization dedicated to orphaned and abandoned children with villagesaround the world. SOS Children’s Villages provides much needed medicalservices, financial resources and other programs that strengthen families, to fulfilltheir mission of giving every child a loving home. Learn more about our efforts toinspire a healthier, more caring world by partnering with SOS Children’s Villageand other non-profit organizations at www.jnj.com/our-giving.
Scan this QR code to viewa digital version of the 2013Johnson & Johnson Annual Report

2013 CHAIRMAN’S LETTER
To Our Shareholders
ALEX GORSKY
Chairman, Board of Directors, andChief Executive Officer
In 2013, we celebrated the 70th anniversary of Our Credo. The words written byGeneral Robert Wood Johnson are just as relevant today as they were in 1943 andremind us of the deep responsibility we have to the doctors, nurses, patients, mothersand fathers — and all those we are privileged to serve. It’s Our Credo that ignites ourpassion to strike out in new directions with boldness, with purpose, and with a senseof unlimited potential about what the future of health care might bring. Our Credoalso unites the employees of Johnson & Johnson in a common mission to makepositive, measurable differences and help people everywhere live longer, healthier andhappier lives.
For 70 years, Our Credo has also guided our decision-making through thechallenges and complexities that have confronted our world. No matter what uniquechallenges have come to each generation—whether it was global pandemics,economic uncertainty, world wars, population growth or technological advances—Johnson & Johnson has stayed focused on our mission. Over the years, we’veimproved patient care and the quality of life for millions of people worldwide bydelivering surgical innovations, breakthroughs in medicine and legendary productsthat have stood the test of time. For many of us, the simple scent of JOHNSON’S®Baby Powder or JOHNSON’S® Baby Shampoo brings happy memories, even while
they create new memories today for millions of parents, children and grandparents in nearly 200 countries around the world.Inspired by this legacy, all of us at Johnson & Johnson are also fully committed to addressing the challenges and opportunities that
surely lie ahead in health care. As I travel around the world and speak with leaders in health care, government, and business, I hear aconsistent theme of concern and uncertainty. In a world challenged by a growing number of diseases, aging populations, insufficienthealth care delivery and rising costs, stakeholders everywhere see the need to provide better outcomes and solutions for individuals,families, communities, countries and all stakeholders. This is a call to action for all of us at Johnson & Johnson to take a leadership rolein addressing these issues in an increasingly complex, connected, and demanding world.
I’m very proud to say that against this backdrop, our businesses delivered strong results in 2013, led by the outstandingperformance in our Pharmaceutical segment; the strength of key brands in our U.S. over-the-counter (OTC) medicines business; andcontinued progress in integrating Synthes, Inc. into our Medical Devices and Diagnostics business. We also advanced our longer-term growth drivers of bringing innovative solutions to the global health care market and executing with excellence.
A key goal for us has been to prioritize our product portfolios, be decisive, and focus our energies in areas where we have thegreatest opportunities to lead and meet the evolving needs of customers in markets around the world. We’ve made strong progress onthis front in each of our segments last year and made significant contributions to advancing patient and consumer care.
With this focus and our industry leadership, we delivered strong sales results:
• Pharmaceuticals accounted for 39 percent of our total sales on an outstanding operational growth of 12 percentcompared to 2012.
• Medical Devices and Diagnostics represented 40 percent of our sales with operational growth of 6.1 percent.
• Our Consumer segment generated the remaining 21 percent, up 2.8 percent on an operational basis versus 2012.
Our depth of leadership is reflected in the fact that approximately 70 percent of our sales come from products with the numberone or number two global market share position. With these strong sales results, we delivered adjusted earnings per share* growth of8.2 percent and strong free cash flow** of nearly $14 billion.
I am pleased with the progress we have made in the two years I have been honored to serve as the Chief Executive Officer ofJohnson & Johnson, and there remains so much more to do in the global health care space. Too many regions across the world—fromdeveloped to emerging markets—are still far from providing high-quality health care to the people who need it. As the world’s largesthealth care company, serving more than one billion patients and consumers around the world every day, we do not just consider itour responsibility to do all we can to reach the next billion, and the billion after that—we consider it a responsibility and privilege.
By bringing the values embodied in Our Credo to life while focusing on four long-term drivers of growth—creating value throughinnovation; expanding global reach with local focus; maintaining a laser focus on excellence in execution; and leading with purpose tomake a difference in the world—we have set our sights on achieving even greater progress in the years to come.
2013 CHAIRMAN’S LETTER

2013 BUSINESS HIGHLIGHTS
Johnson & Johnson exceeded our financial commitments for 2013.
• Innovating in Pharmaceuticals. The performance of our Pharmaceutical business segment was exceptional. We are thefastest growing top 10 pharmaceutical company in the U.S., Europe and Japan. Our success is driven by great science whichhas consistently delivered meaningful advancements for patients over existing therapies. The 13 new products we havelaunched since 2009, coupled with other core brands like PREZISTA® (darunavir) for HIV treatment and REMICADE®(infliximab), a treatment for a number of immune-mediated inflammatory diseases, greatly contributed to our growth. Weexpect our pharmaceutical pipeline to continue growing in 2014.
• Successfully Integrating Synthes. Integrating Synthes continues to be a priority and we have made good progress. DePuySynthes Companies is the world’s largest and most comprehensive orthopaedics company and it is primed to offer new,value-added solutions that will help transform health care delivery from the operating room to a patient’s mobility. Whilewe still have work to do, I am encouraged to see cross-selling initiatives we envisioned from the onset taking hold as well asrevenue and cost-saving synergies that will make the business even more competitive going forward.
• Driving Growth by Restoring Consumer Reliability. In our Consumer business segment, we made significant progress inrestoring a reliable supply of over-the-counter (OTC) products to the U.S. marketplace and we are starting to see them gaintraction, particularly TYLENOL® and MOTRIN®, which helped drive U.S. OTC growth of 19.7 percent. U.S. OTC brandsended 2013 with the number one and number two product SKUs in both the adult and pediatric pain product categories.We have also identified specific consumer need states and 12 major brands that will drive growth, includingNEUTROGENA®, LISTERINE® and JOHNSON’S® Baby.
• Rewarding our shareholders. Our shareholders were rewarded with a total return of almost 35 percent***, which outpacednearly every major index we benchmark ourselves against. Johnson & Johnson has delivered 30 consecutive years ofadjusted earnings* increases and we are one of only six companies in the S&P 100 to have delivered 51 consecutive years ofdividend increases.
More details are available about each of our three business segments in the 2013 Business Highlights section of this AnnualReport and in our 2013 Digital Annual Report, available at http://www.2013annualreport.jnj.com. You can also watchhighlights from my January 2014 speech at our Annual Business Review at:
http://www.youtube.com/watch?v=hdvHMmSot14
OUR FOUR DRIVERS OF LONG-TERM GROWTH
First, We are Creating Value Through Innovation
At Johnson & Johnson, everything we do begins with innovation. For the past five years, we’ve consistently invested about 11percent of sales to support our R&D efforts. That equated to over $8 billion enterprise-wide in 2013, and by leveraging the power of ourenterprise, we are increasing our overall effectiveness and efficiency in the global marketplace.
• Our research and development continues to deliver results. Our investments in R&D are helping us continually delivermeaningful innovations for our customers. About 25 percent of our sales have come from products we have introduced injust the past five years.
• We gained or held market share. In 2013, in 14—out of 18—key in-line product platforms, we gained or held market share.
• Our pharmaceutical pipeline was productive. Our Pharmaceutical business saw great productivity from our pipeline,including the launch of three new major medicines: INVOKANA® (canagliflozin) for the treatment of Type 2 diabetes,IMBRUVICA™ (ibrutinib) for mantle cell lymphoma, and OLYSIO™ (simeprevir) for the treatment of chronic hepatitis C.
• Important new medical devices were approved. Our Medical Devices and Diagnostics business saw the U. S. Food & DrugAdministration approve EVARREST™ Fibrin Sealant Patch, a novel product that rapidly and reliably aids in stoppingbleeding during surgery. The ENSEAL® G2 Articulating Tissue Sealer makes it easier for surgeons to access difficult-to-reach parts of the anatomy, and our THERMOCOOL® SMARTTOUCH® Catheter enhances the safety and efficacy ofablation procedures. These innovations have strengthened our worldwide leadership position in medical devices anddiagnostics, where 85 percent of our key platforms hold the number one or number two position in the market.
• We launched new consumer products globally. In our Consumer segment, we continue to expand globally with the acquisitionof Shanghai Elsker Mother & Baby Co., Ltd, a leading baby care products company for the Chinese market and by launchingLISTERINE® ADVANCED DEFENCE® Gum Treatment in the United Kingdom and Ireland.
JOHNSON & JOHNSON 2013 ANNUAL REPORT

• We created new Johnson & Johnson Innovation Centers. We announced the creation of the Johnson & Johnson InnovationCenters with locations in London, Shanghai, Boston, San Francisco and San Diego. These customized collaborations are partof our enterprise-wide strategy to support an international network of scientific entrepreneurs through access to best-in-class laboratory facilities and scientific expertise.
Second, We are Bringing To Life Our Global Reach with Local Focus
Johnson & Johnson is truly a global company, with more than 275 operating companies in 60 countries. While we are headquarteredin the United States, our mindset is global—we are focused on new products, new technologies and new business models that trulyconnect with the way our customers live. Today, 55 percent of Johnson & Johnson’s business comes from outside the United States, andthat number is growing—as 22 percent of our sales come from fast growing emerging markets such as Brazil, Russia, India and China.
• We created a unified business model in China. Johnson & Johnson was one of the first western companies to expand intoChina 28 years ago. Our locally based, broad range of businesses gives us unique insight into China’s health care challenges,including an aging population. That’s why we have created Johnson & Johnson China, a new model that unifies our corebusiness segments and allows us to identify and facilitate the creation of new opportunities in China’s rapidly growing healthcare system.
• We have taken a unified “go-to-market” approach in Southeast Asia. In Southeast Asia, we have aligned our operations andmanagement under a single business model called “One Johnson & Johnson” for nine countries, including Thailand,Indonesia and the Philippines. We believe this streamlined approach gives us a market advantage to operate more efficientlyand effectively in smaller and mid-sized markets.
Third, We are Maintaining a Laser Focus on Excellent Execution
Nowhere is the need for excellence in execution more critical than in health care. Strategy is only as good as the ability to executeflawlessly—focusing and setting priorities; doing the right thing and not just getting it done; meeting milestones and delivering on ourcommitments. Excellence in execution starts with quality, a top priority at Johnson & Johnson, and one embodied in Our Credo by acommitment that “everything we do must be of high quality.” In 2013:
• We restored more of our products to shelves. We met our objective of restoring approximately 75 percent of our plannedU.S. OTC products to store shelves.
• We have implemented a new quality and compliance operating model. We’ve taken important steps to ensure the qualityand safety of our products by adopting a single, global set of quality standards. We’ve also established a single Medical Safetyorganization focused on ensuring that our in-market products perform as intended.
• We’ve strengthened and streamlined our supply chain to ensure that we reliably meet demand for our products. We’veraised the bar and created a single global enterprise Supply Chain organization in order to ensure the development andproduction of high-quality products. This has helped us improve our customer service and reliability performance and willbetter position us for future growth.
Fourth, We are Leading with Purpose to Make a Difference
Guided by Our Credo, our citizenship and sustainability priorities focus on advancing human health and well-being, safeguardingthe planet, and leading a strong and responsible business:
• We are helping to advance the United Nations Millennium Development Goals. One example of this legacy is ourcommitment to the United Nations Millennium Development Goals focused on the well-being of mothers and childrenaround the world, including geographic locations where the needs are the greatest and the resources are most scarce. Ourcommitment focuses on five key areas where we have developed strong, innovative partnerships. First, making childbirthsafer. Second, treating and preventing intestinal worms in children. Third, using mobile phones to share vital healthinformation with new and expectant mothers. Fourth, eliminating mother-to-child transmission of HIV. Fifth, piloting andscaling therapeutic innovation through research and development to treat HIV, tuberculosis and neglected tropical diseases.
• We are supporting over 500 communities globally. We contributed about $1 billion in products and cash and supportedover 500 community programs in more than 60 countries.
• We are helping to fight tuberculosis by making medicine more available. We are committed to advancing global health tofight multi-drug resistant tuberculosis by working with health authorities to make SIRTURO® (bedaquiline) more availablein countries like Russia where outbreaks have become more prevalent.
2013 CHAIRMAN’S LETTER

• We created a novel donation program to increase access to our HIV medicines in Africa. The Janssen pharmaceuticalcompanies of Johnson & Johnson announced a first-of-its-kind pediatric HIV treatment donation program to improveaccess to the company’s approved HIV medicines PREZISTA® (darunavir) and INTELENCE® (etravirine) for childrenand adolescents failing HIV treatment in sub-Saharan Africa. Tragically, only a third of the three million children livingwith HIV today are receiving medicines. The donation program is part of our longstanding commitment to help peopleliving with HIV and enhance access to our medicines for those in need.
• We made progress reformulating our iconic baby products in response to the changing expectations of our customers.Following conversations with parents, advocacy groups and retailers, the Johnson & Johnson Family of ConsumerCompanies made a public pledge in 2011 to reduce or eliminate certain ingredients in our baby and beauty productsworldwide. We want our beauty and baby care products to reflect our customers’ current expectations, shifting behaviorsand concerns when it comes to certain ingredients, and we are proud to be the first major company to set and meet thistype of a public commitment. We will also continue to lead by working with our suppliers and partners to produce thevery best products for families as we work to meet our commitment to make further enhancements to our products by theend of 2015. You can learn more about our safety and care commitment at http://www.safetyandcarecommitment.com/.
• We set a new standard for data transparency. In early 2014, Johnson & Johnson announced, through its subsidiaryJanssen Research & Development LLC, a clinical trial data sharing agreement with Yale School of Medicine’s Open DataAccess (YODA) Project to extend its commitment to sharing clinical trials data to enhance public health and advancescience and medicine. This is the first time any company has collaborated with a completely independent third party toreview and make decisions regarding every request for pharmaceutical clinical data. This agreement will further ourunderstanding of diseases, new treatment opportunities and underscores Our Credo responsibilities.
More details are available about Our Giving and Our Citizenship & Sustainability on www.jnj.com and within many of the stories weare sharing at http://www.2013annualreport.jnj.com.
OUR COMMITMENT TO YOU
Today—and every day—our people and products will touch more than one out of every seven people globally. Our Credocompels us to act on the potential we have for reaching more people, in more places, and in more ways, as the largest, most broadly-based health care company in the world.
I have been privileged to work at Johnson & Johnson for more than two decades, and have seen up close the passion, persistence,creativity, and innovation of our people. I have seen that a commitment to doing the right thing and a commitment to leading byexample are qualities found in abundance at Johnson & Johnson.
In a world challenged by a growing number of diseases, aging populations, insufficient health care delivery and rising costs, ourrole to lead—to provide solutions and continue our quest to better serve the individuals, families, communities, countries andshareholders that depend on us—is as important and urgent today as ever.
Around the world we are doing extraordinary work to meet unmet needs by delivering life-saving medicine and devices, andforging new frontiers in the call for more personalized engagement in the world of consumer products.
By bringing the values embodied in Our Credo to our work, focusing on near-term priorities and long-term drivers of growth,we continue to set our sights on even greater health care progress in the years to come.
At Johnson & Johnson, we will continue to approach the future boldly and actively seek out new solutions that advance health,wellness and improve the quality of people’s lives. I’m so proud to be part of this organization and so excited about our potential inthe years to come.
Sincerely,
Alex GorskyChairman, Board of Directors, and Chief Executive OfficerMarch 12, 2014
* Excludes special items. See “Reconciliation of Non-GAAP Financial Measures” on page 72 of this Annual Report.** Free cash flow is defined as operating cash flow less capital spending.*** Including dividends.
JOHNSON & JOHNSON 2013 ANNUAL REPORT

2013 Business HighlightsJohnson & Johnson delivered strong results in 2013 led by the outstanding performance in our Pharmaceuticalbusiness, the re-launch and strength of key brands in our U.S. over-the-counter (OTC) and other Consumerbusinesses and continued progress in integrating Synthes, Inc. into our Medical Devices and Diagnostics (MD&D)segment. Results also included advances in our longer-term growth drivers including bringing innovativesolutions to the global health care market, executing with excellence, and leading with purpose to advance healthand well-being for patients and consumers around the world.
Pharmaceutical Sales by Therapeutic Area 2013 Sales: $28.1 billionSales Change: Total: 10.9% Operational*: 12.0%
Segment Sales (in billions of dollars)
* Operational excludes the impact of currency.** Rounded for visual accuracy.
INFECTIOUS DISEASES
$3.5**11.1%
ONCOLOGY
$3.843.5%
OTHER
$4.90.2%
NEUROSCIENCE
$6.7(0.8%)
IMMUNOLOGY
$9.216.7%
Medical Devices and DiagnosticsSales by Major Franchise2013 Sales: $28.5 billionSales Change:(1) Total: 3.9% Operational*: 6.1%
ORTHOPAEDICS(1)
$9.521.9%
SPECIALTY SURGERY
$2.62.6%
SURGICAL CARE
$6.3(3.3%)
VISION CARE
$2.9(2.0%)
DIABETES CARE
$2.3(11.7%)
CARDIOVASCULAR CARE
$2.14.6%
DIAGNOSTICS
$1.9(8.9%)
INFECTION PREVENTION/OTHER
$0.9(4.2%)
(1) Excluding the net impact of the Synthes acquisition, MD&D total change = (2.1%) and Orthopaedics total change = 0.7%
(2) Nutritionals is now included in “Wound Care/Other.”
ConsumerSales by Major Franchise2013 Sales: $14.7 billionSales Change: Total: 1.7% Operational*: 2.8%
OTC(2)
$4.07.0%
SKIN CARE
$3.72.4%
WOMEN’S HEALTH
$1.6(3.5%)
WOUND CARE/OTHER(2)
$1.5(5.1%)
BABY CARE
$2.31.8%
ORAL CARE
$1.6(0.1%)
PHARMACEUTICAL
With $28.1 billion in worldwide sales in 2013, we are the seventh-largest pharmaceuticals business* in the worldand the sixth-largest biotech business*. We’re the fastest-growing top 10 Pharmaceutical Company in the UnitedStates, Europe and Japan and recorded 15 consecutive quarters of operational sales growth in this segment.
Primary contributors to exceptional operational sales growth of 12 percent included REMICADE® (infliximab)and SIMPONI® (golimumab), biologics approved for the treatment of a number of immune-mediatedinflammatory diseases; STELARA® (ustekinumab), a biologic approved for the treatment of moderate to severeplaque psoriasis and active psoriatic arthritis; INVEGA® SUSTENNA®/XEPLION® (paliperidone palmitate), aonce-monthly, long-acting, injectable atypical antipsychotic for the treatment of schizophrenia in adults;PREZISTA® (darunavir), a treatment for HIV; VELCADE® (bortezomib), a treatment for multiple myeloma; andsales of new products.
The strong sales results of new products included ZYTIGA® (abiraterone acetate), an oral, once-dailymedication for use in combination with prednisone for the treatment of metastatic, castration-resistant prostatecancer; XARELTO® (rivaroxaban), an oral anticoagulant; the combined sales of COMPLERA®/EVIPLERA®(emtricitabine /rilpivirine/tenofovir disoproxil fumarate) and EDURANT® (rilpivirine) for the treatment of HIV;and INVOKANA® (canagliflozin) for the treatment of adults with Type 2 diabetes.
Sales results were negatively impacted by generic competition for ACIPHEX®/ PARIET® (rabeprazole), a protonpump inhibitor for gastrointestinal disorders and CONCERTA® (methylphenidate HCI) for the treatment ofattention deficit hyperactivity disorder.
During 2013, the company received several regulatory approvals including: U.S. Food and Drug Administration(FDA) approval of OLYSIO™ (simeprevir), an NS3/4A protease inhibitor, for the treatment of chronic hepatitis Cinfection as part of an antiviral treatment regimen in combination with pegylated interferon and ribavirin in
2013 BUSINESS HIGHLIGHTS

genotype 1 infected adults with compensated liver disease, including cirrhosis; FDA approval of IMBRUVICA™(ibrutinib) capsules for the treatment of patients with mantle cell lymphoma who have received at least one priortherapy; FDA and European Commission (EC) approval of INVOKANA® (canagliflozin), an oral, once-daily,selective sodium glucose co-transporter 2 inhibitor, for the treatment of adults with Type 2 diabetes; FDA approvalfor the use of STELARA® (ustekinumab) alone or in combination with methotrexate for the treatment of adultpatients with active psoriatic arthritis; EC approval of STELARA® (ustekinumab), alone or in combination withmethotrexate for active psoriatic arthritis in adults when the response to previous non-biological disease-modifying anti-rheumatic drug therapy has been inadequate; EC approval of an expanded indication forSIMPONI® (golimumab) for the treatment of moderately to severely active ulcerative colitis in adult patients whohave had an inadequate response to conventional therapy including corticosteroids and 6-mercaptopurine orazathioprine, or who are intolerant to or have medical contraindications for such therapies; FDA approval ofSIMPONI® (golimumab) for the treatment of moderately to severely active ulcerative colitis in adult patients whohave demonstrated corticosteroid dependence or who have had an inadequate response to or failed to tolerate oralaminosalicylates, oral corticosteroids, azathioprine, or 6-mercaptopurine; and FDA approval of SIMPONI® ARIA™(golimumab) for infusion for the treatment of adults with moderately to severely active rheumatoid arthritis incombination with methotrexate. The EC also approved the use of VELCADE® (bortezomib) as induction therapyin combination with dexamethasone or thalidomide and dexamethasone and applies to adult patients withpreviously-untreated multiple myeloma who are eligible for high-dose chemotherapy with hematological stem celltransplantation.
A Marketing Authorization Application was submitted to the European Medicines Agency (EMA) for ibrutinibfor the treatment of adult patients with relapsed or refractory chronic lymphocytic leukemia/small lymphocyticlymphoma or relapsed or refractory mantle cell lymphoma. Also filed with the EMA, was a once-daily single tabletfixed-dose antiretroviral combination product containing darunavir, a protease inhibitor developed by Janssen-Cilag International NV and marketed as PREZISTA®, with cobicistat, a pharmacokinetic boosting agent,developed by Gilead Sciences, Inc. for use in combination with other HIV medicines.
Looking to the future, we are pleased with our focused, deep and productive pharmaceutical pipeline, andexpect the growth of our recently launched products to continue. Furthermore, we will continue investing in R&Dthat’s focused on key unmet needs for patients. As we announced in May at the Pharmaceutical Business Review,we plan to file more than ten new molecular entities (NMEs) for approval between 2013 and 2017, and more than25 additional line extensions of our in-market products.
MEDICAL DEVICES AND DIAGNOSTICS
With $28.5 billion in worldwide Medical Devices and Diagnostics (MD&D) sales for 2013, our MD&D segment isthe largest medical devices and diagnostics business in the world. Operational sales growth of 6.1 percent includedthe impact of the acquisition of Synthes, net of the divestiture of the DePuy Trauma business. Excluding thisimpact, MD&D operational sales growth was 0.1 percent.
Primary contributors to operational growth were sales from the acquisition of Synthes and DePuy Synthes JointReconstruction products in the Orthopaedics business, Biosense Webster’s electrophysiology products in theCardiovascular Care business, the Vision Care business, as well as biosurgicals and international sales of energyproducts in the Specialty Surgery business.
Our MD&D business is anchored by 11 “billion-dollar-plus-platforms” including vision care, trauma, sutures,endoscopy, and electrophysiology. The FDA approved EVARREST™ Fibrin Sealant Patch, a novel product thatrapidly and reliably aids in stopping bleeding during surgery. In orthopaedics, the ATTUNE® Knee System,developed with innovative proprietary technology, is off to a great start with over 23,000 implants worldwide. TheENSEAL® G2 Articulating Tissue Sealer, the world’s first articulating advanced bipolar product, is making it easierfor surgeons around the world to access difficult-to-reach parts of the anatomy. Finally, our THERMOCOOL®SMARTTOUCH® Catheter enhances the safety and efficacy of an ablation procedure by measuring the force of thecatheter’s tip inside the heart. These are just a few of the innovations that continue to strengthen our worldwideleadership position in medical devices and diagnostics, where 85 percent of our key platforms hold the numberone or number two position in the market.
Integrating Synthes has been our priority and we’ve made good progress. DePuy Synthes Companies is theworld’s largest and most comprehensive orthopaedics company within a $44 billion market with strongfundamentals, and is primed to offer new, value-added solutions that will help transform health care delivery.
J O H N S O N & J O H N S O N 2 0 1 3 A N N U A L R E P O R T
In January 2014, we announced receipt of a binding offer from The Carlyle Group to acquire the Ortho-ClinicalDiagnostics business for approximately $4 billion. We are in an acceptance period that will end on March 31, 2014— and expect the transaction will close toward the middle of this year.
CONSUMER
With $14.7 billion in worldwide sales in 2013, our Consumer segment is the sixth-largest health care consumerbusiness in the world and achieved operational sales growth of 2.8 percent. Our near-term priority is to deliver areliable supply of OTC products to the U.S. marketplace. Last year, we met our objective of returningapproximately 75 percent of our planned portfolio to store shelves. We are investing in cross-channel marketingacross TV, print and social media to support their re-launch.
Positive contributors to operational results were U.S. sales of TYLENOL® and MOTRIN® analgesics; upperrespiratory OTC products; international sales of baby care products; sales of NEUTROGENA® and AVEENO®skin care products; and international sales of LISTERINE® oral care products.
In 2013, we took steps to strengthen our focus, divesting in certain areas such as our North American women’ssanitary protection business, and acquiring Shanghai Elsker Mother & Baby Co., Ltd, a well-regarded baby carecompany in China known for its position in the naturals segment.
We also continue to expand globally with the launch of LISTERINE® ADVANCED DEFENCE® GumTreatment in the United Kingdom and Ireland and our new JOHNSON’S® Baby TRIPLE BABY PROTECTION™product line, which we’ll be taking into global markets this year.
Finally, as we work to bring our plants fully back on line, we’ve executed all of the milestones to-date in ourFDA Consent Decree.
CITIZENSHIP & SUSTAINABILITY
Our Credo is the foundation for our Citizenship & Sustainability and informs our priorities to advance humanhealth and well-being, safeguard the planet, and lead a strong and responsible business. These priorities are centralto our aspiration that, by caring for the world, one person at a time, we will help billions of people live longer,healthier, happier lives.
As the world’s largest health care company, we continue to expand our efforts and engage in collaborativeprojects to advance global health on multiple levels. In 2010, we made a significant five-year commitment to theUnited Nations Millennium Development Goals to improve the lives of women and children worldwide, and weare on track to deliver our commitments by 2015.
Our newly formed Janssen Global Public Health (GPH) team combines the best of our innovative access modelswith our core business strategy to drive better outcomes, improve quality of life and sustainably advance healthcare. GPH’s work with the Stop TB Partnership to facilitate access to SIRTURO®, a tuberculosis therapy with a newmechanism of action, discovered and developed by Janssen scientists, will have a major impact on lives. We willcontinue these and other efforts in response to the world’s health challenges.
We are leading a strong and responsible business in many ways. As part of our longstanding practices andcommitment to citizenship and sustainability, we joined the U.N. Global Compact in 2013 and are committed toits principles, many of which have been embedded in our business practices for decades.
We are conscientious, too, of our impact on the environment, the health of which is inextricably linked to ourefforts in human health. In 2013, our energy and carbon reduction programs earned distinction from the CarbonDisclosure Project (CDP), naming us as the health care sector leader within the S&P 500 and maintaining ourmembership in the CDP Leadership Index for the fourth consecutive year.
NOTE REGARDING FORWARD-LOOKING STATEMENTS
This Annual Report contains forward-looking statements relating to, among other things, expectations for futureproduct development, regulatory filings and the sale of the Ortho-Clinical Diagnostics business. You shouldreview the section “Cautionary Factors That May Affect Future Results” on page 19 of this Annual Report forimportant information about these statements including the risks, uncertainties and other factors that could causeactual results to vary materially from the assumptions, expectations and projections expressed in our forward-looking statements.
* IMS MIDAS data as of Q3 2013 (growth versus previous year (moving annual total) in local currency dollars)
2013 BUSINESS HIGHLIGHTS

Board of Directors
ALEX GORSKYChairman, Board of Directors
MARY SUE COLEMANPresident, University of Michigan
JAMES G. CULLENRetired President and Chief Operating Officer,Bell Atlantic Corporation
IAN E. L. DAVISChairman, Rolls-Royce Holdings plc; Former Chairmanand Worldwide Managing Director, McKinsey &Company
MICHAEL M. E. JOHNSProfessor, Emory School of Medicine and RollinsSchool of Public Health; Chancellor and ExecutiveVice President of Health Affairs Emeritus, EmoryUniversity
SUSAN L. LINDQUISTMember and Former Director, Whitehead Institute forBiomedical Research; Professor of Biology,Massachusetts Institute of Technology
MARK B. McCLELLANSenior Fellow in Economic Studies andDirector of the Initiative on Value andInnovation in Health Care, Brookings Institution
ANNE M. MULCAHYFormer Chairman and Chief Executive Officer,Xerox Corporation
LEO F. MULLINRetired Chairman and Chief Executive Officer,Delta Air Lines, Inc.
WILLIAM D. PEREZSenior Advisor, Greenhill & Co., Inc.; Retired Presidentand Chief Executive Officer, Wm. Wrigley Jr. Company
CHARLES PRINCERetired Chairman and Chief Executive Officer,Citigroup Inc.
A. EUGENE WASHINGTONVice Chancellor of Health Sciences, Dean of the DavidGeffen School of Medicine at the University of California,Los Angeles (UCLA); Chief Executive Officer of theUCLA Health System
RONALD A. WILLIAMSFormer Chairman and Chief Executive Officer,Aetna Inc.
Senior ManagementALEX GORSKYChief Executive OfficerChairman, Executive Committee
DOMINIC J. CARUSOVice President, FinanceChief Financial OfficerMember, Executive Committee
DOUGLAS K. CHIACorporate SecretaryAssistant General Counsel
STEPHEN J. COSGROVECorporate ControllerChief Accounting Officer
JOAQUIN DUATOWorldwide Chairman, Pharmaceuticals Group
PETER M. FASOLOVice President, Global Human ResourcesMember, Executive Committee
MICHEL ORSINGERWorldwide Chairman, Global Orthopaedics Group
JOHN A. PAPATreasurer
SANDRA E. PETERSONGroup Worldwide ChairmanMember, Executive Committee
LYNN PENDERGRASSWorldwide Chairman, Consumer
GARY J. PRUDENWorldwide Chairman, Global Surgery Group
MICHAEL E. SNEEDVice President, Global Corporate Affairs
PAULUS STOFFELSChief Scientific OfficerWorldwide Chairman, Pharmaceuticals GroupMember, Executive Committee
MICHAEL H. ULLMANNVice President, General CounselMember, Executive Committee
KATHRYN WENGELVice President, Johnson & Johnson Supply Chain
JESSE J. WUChairman, Johnson & Johnson China
Johnson & Johnson 2013 Annual Report

MANAGEMENT’S DISCUSSION AND ANALYSIS OF RESULTSOF OPERATIONS AND FINANCIAL CONDITION
Organization and Business Segments 2Results of Operations 3Analysis of Sales by Business Segments 4Analysis of Consolidated Earnings Before Provision for Taxes on Income 8Liquidity and Capital Resources 11Other Information 14Cautionary Factors That May Affect Future Results 19
AUDITED CONSOLIDATED FINANCIAL STATEMENTS
Consolidated Balance Sheets 20Consolidated Statements of Earnings 21Consolidated Statements of Comprehensive Income 22Consolidated Statements of Equity 23Consolidated Statements of Cash Flows 24Notes to Consolidated Financial Statements 25Report of Independent Registered Public Accounting Firm 68Management’s Report on Internal Control Over Financial Reporting 69
SUPPORTING SCHEDULES
Summary of Operations and Statistical Data 2003 – 2013 70Shareholder Return Performance Graphs 71Reconciliation of Non-GAAP Financial Measures 72
Johnson & Johnson 2013 Annual Report • 1

Management’s Discussion and Analysis ofResults of Operations and Financial ConditionOrganization and Business Segments
Description of the Company and Business Segments
Johnson & Johnson and its subsidiaries (the Company) have approximately 128,100 employees worldwide engaged in theresearch and development, manufacture and sale of a broad range of products in the health care field. The Companyconducts business in virtually all countries of the world with the primary focus on products related to human health andwell-being.
The Company is organized into three business segments: Consumer, Pharmaceutical and Medical Devices andDiagnostics. The Consumer segment includes a broad range of products used in the baby care, skin care, oral care,wound care and women’s health fields, as well as nutritionals, over-the-counter pharmaceutical products and wellness andprevention platforms. These products are marketed to the general public and sold both to retail outlets and distributorsthroughout the world. The Pharmaceutical segment includes products in the following areas: anti-infective, antipsychotic,cardiovascular, contraceptive, gastrointestinal, hematology, immunology, infectious diseases, metabolic, neurology,oncology, pain management and vaccines. These products are distributed directly to retailers, wholesalers and health careprofessionals for prescription use. The Medical Devices and Diagnostics segment includes a broad range of productsdistributed to wholesalers, hospitals and retailers, used principally in the professional fields by physicians, nurses, hospitalsand clinics. These include products to treat cardiovascular disease; orthopaedic and neurological products; blood glucosemonitoring and insulin delivery products; general surgery, biosurgical, and energy products; professional diagnosticproducts; infection prevention products; and disposable contact lenses.
The Company’s structure is based upon the principle of decentralized management. The Executive Committee ofJohnson & Johnson is the principal management group responsible for the strategic operations and allocation of theresources of the Company. This Committee oversees and coordinates the activities of the Consumer, Pharmaceutical andMedical Devices and Diagnostics business segments.
In all of its product lines, the Company competes with companies both locally and globally, throughout the world.Competition exists in all product lines without regard to the number and size of the competing companies involved.Competition in research, involving the development and the improvement of new and existing products and processes, isparticularly significant. The development of new and innovative products is important to the Company’s success in allareas of its business. This also includes protecting the Company’s portfolio of intellectual property. The competitiveenvironment requires substantial investments in continuing research. In addition, the development and maintenance ofcustomer demand for the Company’s consumer products involves significant expenditures for advertising and promotion.
Management’s Objectives
The Company manages within a strategic framework with Our Credo as the foundation. The Company believes that ourstrategic operating principles; being broadly based in human health care, managing the business for the long term, adecentralized management approach and commitment to our people and values are required to successfully meet thedemands of the rapidly evolving markets in which we compete. To this end, management is focused on our growth drivers:creating value through innovation, expanding our global reach with a local focus, excellence in execution and leading withpurpose.
The Company engages in areas of human health care where there is an opportunity to make a meaningful difference, andis committed to creating value by developing broadly accessible, high quality, innovative products and services. Newproducts introduced within the past five years accounted for approximately 25% of 2013 sales. In 2013, $8.2 billion, or11.5% of sales, was invested in research and development, reflecting management’s commitment to delivering new anddifferentiated products and services to meet evolving health care needs and sustain the Company’s long-term growth.
Our diverse businesses with more than 275 operating companies located in 60 countries are the key drivers of theCompany’s success. Maintaining the Company’s decentralized management approach while at the same time leveragingthe extensive resources of the enterprise uniquely positions the Company to innovate, execute and reach markets globally,while focusing on the needs and challenges of the local markets.
2 • Johnson & Johnson 2013 Annual Report

In order to remain a leader in health care the Company strives to maintain a purpose-driven organization and is committedto developing global business leaders who can achieve these growth objectives. Businesses are managed for the long-term in order to sustain market leadership positions and enable growth, which provides an enduring source of value to ourshareholders.
Our Credo unifies all Johnson & Johnson employees in achieving these objectives, and provides a common set of valuesthat serve as the foundation of the Company’s responsibilities to its customers, employees, communities and shareholders.The Company believes that these basic principles and growth drivers, along with its overall mission of improving the qualityof life for people across the globe, will enable Johnson & Johnson to continue to be a leader in the health care industry.
Results of Operations
Analysis of Consolidated Sales
In 2013, worldwide sales increased 6.1% to $71.3 billion, compared to increases of 3.4% in 2012 and 5.6% in 2011.These sales changes consisted of the following:
Sales increase/(decrease) due to: 2013 2012 2011
Volume 7.6% 5.7 3.1
Price 0.1 0.4 (0.3)
Currency (1.6) (2.7) 2.8
Total 6.1% 3.4 5.6
Sales by U.S. companies were $31.9 billion in 2013, $29.8 billion in 2012 and $28.9 billion in 2011. This representsincreases of 7.0% in 2013 and 3.2% in 2012, and a decrease of 1.8% in 2011. Sales by international companies were$39.4 billion in 2013, $37.4 billion in 2012 and $36.1 billion in 2011. This represents increases of 5.4% in 2013, 3.5% in2012 and 12.4% in 2011. The acquisition of Synthes, Inc., net of the related divestiture, increased both total worldwidesales growth and operational growth by 2.5% and 3.1% in 2013 and 2012, respectively.
The five-year compound annual growth rates for worldwide, U.S. and international sales were 2.3%, (0.2)% and 4.6%,respectively. The ten-year compound annual growth rates for worldwide, U.S. and international sales were 5.5%, 2.4% and9.0%, respectively.
Sales in Europe achieved growth of 9.8% as compared to the prior year, including operational growth of 7.7% and apositive currency impact of 2.1%. Sales in the Western Hemisphere (excluding the U.S.) achieved growth of 3.0% ascompared to the prior year, including operational growth of 8.9% and a negative currency impact of 5.9%. Sales in theAsia-Pacific, Africa region achieved growth of 1.1% as compared to the prior year, including operational growth of 8.6%and a negative currency impact of 7.5%.
In 2013, 2012 and 2011, the Company did not have a customer that represented 10% or more of total consolidatedrevenues.
U.S. Health Care Reform
Under the provisions of the Patient Protection and Affordable Care Act and the Health Care and Education ReconciliationAct of 2010, beginning in 2013, the Company began paying a tax deductible 2.3% excise tax imposed on the sale ofcertain medical devices. The 2013 full-year impact of the excise tax was approximately $200 million.
Johnson & Johnson 2013 Annual Report • 3

Analysis of Sales by Business Segments
Consumer Segment
Consumer segment sales in 2013 were $14.7 billion, an increase of 1.7% from 2012, which included 2.8% operationalgrowth and a negative currency impact of 1.1%. U.S. Consumer segment sales were $5.2 billion, an increase of 2.3%.International sales were $9.5 billion, an increase of 1.4%, which included 3.1% operational growth and a negativecurrency impact of 1.7%.
Major Consumer Franchise Sales:*
% Change
(Dollars in Millions) 2013 2012 2011 ’13 vs. ’12 ’12 vs. ’11
OTC $4,028 3,766 3,740 7.0% 0.7
Skin Care 3,704 3,618 3,715 2.4 (2.6)
Baby Care 2,295 2,254 2,340 1.8 (3.7)
Oral Care 1,622 1,624 1,624 (0.1) 0.0
Women’s Health 1,568 1,625 1,792 (3.5) (9.3)
Wound Care/Other 1,480 1,560 1,672 (5.1) (6.7)
Total Consumer Sales $14,697 14,447 14,883 1.7% (2.9)
* Prior year amounts have been reclassified to conform to current year presentation. Nutritionals, previously included in OTC, is includedin Wound Care/Other.
The Over-the-Counter (OTC) franchise achieved sales of $4.0 billion, an increase of 7.0% from 2012. Strong U.S. salesgrowth of 19.7% was driven by analgesics and upper respiratory products, primarily due to continued progress inreturning a reliable supply of products to the marketplace.
McNEIL-PPC, Inc. continues to operate under a consent decree, signed in 2011 with the U.S. Food and DrugAdministration (FDA), which governs certain McNeil Consumer Healthcare manufacturing operations. McNeil continues tooperate the manufacturing facilities in Las Piedras, Puerto Rico and Lancaster, Pennsylvania and has made significantprogress; having met the remediation commitments at those facilities. The Company also successfully reintroduced manyproducts previously made in Fort Washington, Pennsylvania, from other sites. Plants operating under the consent decreewill continue to produce a simplified portfolio focused on key brands. The Fort Washington manufacturing site is not inoperation at this time and the Company recently made the decision to make further investments in that facility prior tocertification.
The Skin Care franchise achieved sales of $3.7 billion, an increase of 2.4% as compared to the prior year, primarily due tostrong results from the NEUTROGENA®, AVEENO® and Dabao product lines. The Baby Care franchise sales grew to$2.3 billion, an increase of 1.8% from 2012. Growth was primarily due to sales of haircare and baby cleansers outside theU.S. and newly acquired products from the acquisition of Shanghai Elsker Mother & Baby Co., Ltd. The Oral Carefranchise sales were flat as compared to the prior year. Increased sales of LISTERINE® outside the U.S. were partiallyoffset by the impact of the divestiture of the manual toothbrush product line in the U.S. The Women’s Health franchisesales were $1.6 billion, a decrease of 3.5% primarily due to the divestiture of women’s sanitary protection products in theU.S., Canada and Caribbean. The Wound Care/Other franchise sales were $1.5 billion in 2013, a decrease of 5.1% from2012 due to competitive pressures and the impact of divestitures.
Consumer segment sales in 2012 were $14.4 billion, a decrease of 2.9% from 2011, which included 0.5% operationalgrowth offset by a negative currency impact of 3.4%. U.S. Consumer segment sales were $5.0 billion, a decrease of2.0%. International sales were $9.4 billion, a decrease of 3.4%, which included 1.9% operational growth offset by anegative currency impact of 5.3%.
4 • Johnson & Johnson 2013 Annual Report
Pharmaceutical Segment
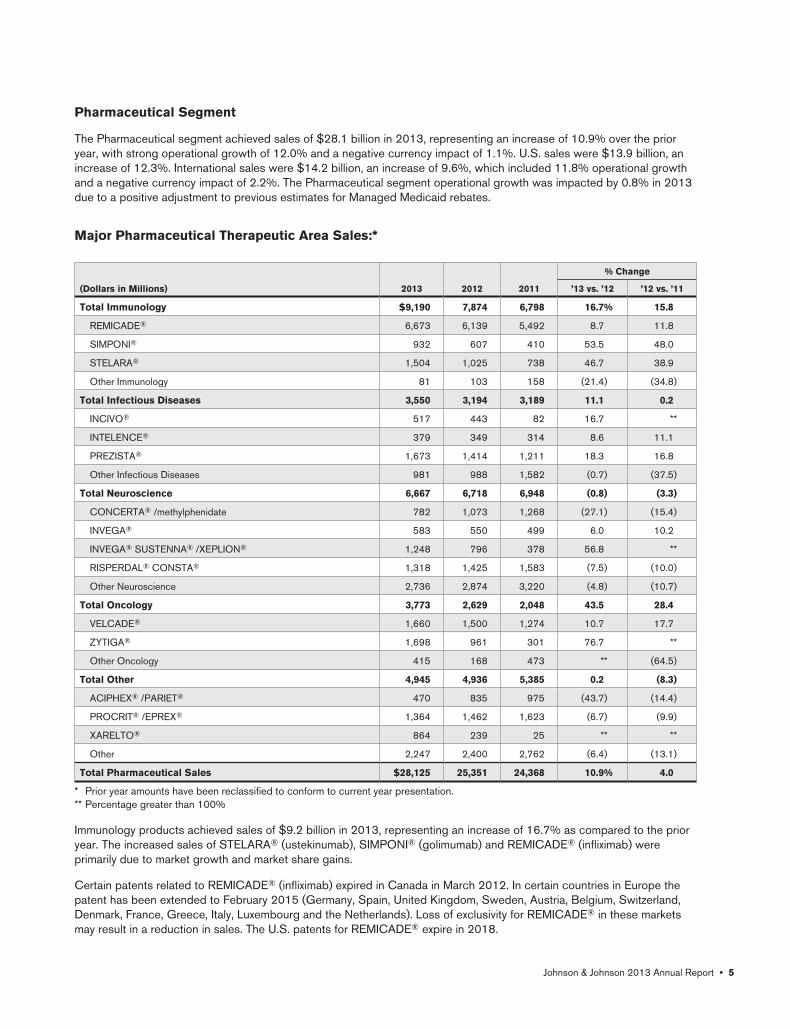
The Pharmaceutical segment achieved sales of $28.1 billion in 2013, representing an increase of 10.9% over the prioryear, with strong operational growth of 12.0% and a negative currency impact of 1.1%. U.S. sales were $13.9 billion, anincrease of 12.3%. International sales were $14.2 billion, an increase of 9.6%, which included 11.8% operational growthand a negative currency impact of 2.2%. The Pharmaceutical segment operational growth was impacted by 0.8% in 2013due to a positive adjustment to previous estimates for Managed Medicaid rebates.
Major Pharmaceutical Therapeutic Area Sales:*
% Change
(Dollars in Millions) 2013 2012 2011 ’13 vs. ’12 ’12 vs. ’11
Total Immunology $9,190 7,874 6,798 16.7% 15.8
REMICADE® 6,673 6,139 5,492 8.7 11.8
SIMPONI® 932 607 410 53.5 48.0
STELARA® 1,504 1,025 738 46.7 38.9
Other Immunology 81 103 158 (21.4) (34.8)
Total Infectious Diseases 3,550 3,194 3,189 11.1 0.2
INCIVO® 517 443 82 16.7 **
INTELENCE® 379 349 314 8.6 11.1
PREZISTA® 1,673 1,414 1,211 18.3 16.8
Other Infectious Diseases 981 988 1,582 (0.7) (37.5)
Total Neuroscience 6,667 6,718 6,948 (0.8) (3.3)
CONCERTA® /methylphenidate 782 1,073 1,268 (27.1) (15.4)
INVEGA® 583 550 499 6.0 10.2
INVEGA® SUSTENNA® /XEPLION® 1,248 796 378 56.8 **
RISPERDAL® CONSTA® 1,318 1,425 1,583 (7.5) (10.0)
Other Neuroscience 2,736 2,874 3,220 (4.8) (10.7)
Total Oncology 3,773 2,629 2,048 43.5 28.4
VELCADE® 1,660 1,500 1,274 10.7 17.7
ZYTIGA® 1,698 961 301 76.7 **
Other Oncology 415 168 473 ** (64.5)
Total Other 4,945 4,936 5,385 0.2 (8.3)
ACIPHEX® /PARIET® 470 835 975 (43.7) (14.4)
PROCRIT® /EPREX® 1,364 1,462 1,623 (6.7) (9.9)
XARELTO® 864 239 25 ** **
Other 2,247 2,400 2,762 (6.4) (13.1)
Total Pharmaceutical Sales $28,125 25,351 24,368 10.9% 4.0
* Prior year amounts have been reclassified to conform to current year presentation.** Percentage greater than 100%
Immunology products achieved sales of $9.2 billion in 2013, representing an increase of 16.7% as compared to the prioryear. The increased sales of STELARA® (ustekinumab), SIMPONI® (golimumab) and REMICADE® (infliximab) wereprimarily due to market growth and market share gains.
Certain patents related to REMICADE® (infliximab) expired in Canada in March 2012. In certain countries in Europe thepatent has been extended to February 2015 (Germany, Spain, United Kingdom, Sweden, Austria, Belgium, Switzerland,Denmark, France, Greece, Italy, Luxembourg and the Netherlands). Loss of exclusivity for REMICADE® in these marketsmay result in a reduction in sales. The U.S. patents for REMICADE® expire in 2018.
Johnson & Johnson 2013 Annual Report • 5
Infectious disease products achieved sales of $3.6 billion in 2013, representing an increase of 11.1% as compared to theprior year. Major contributors were PREZISTA® (darunavir), due to the continued momentum in market share growth,INCIVO® (telaprevir), EDURANT® (rilpivirine), INTELENCE® (etravirine) and the launch of OLYSIO™ (simeprevir).
Neuroscience products sales were $6.7 billion, a decline of 0.8% as compared to the prior year. Strong sales ofINVEGA® SUSTENNA® /XEPLION® (paliperidone palmitate) and INVEGA® (paliperidone palmitate) were partially offsetby lower sales of RISPERDAL® CONSTA® due to growth of INVEGA® SUSTENNA® /XEPLION®. Additionally, a declinein U.S. sales of CONCERTA® /methylphenidate and lower sales of DURAGESIC® /Fentanyl Transdermal (fentanyltransdermal system) and RISPERDAL® (risperidone) was due to continued generic competition.
Oncology products achieved sales of $3.8 billion in 2013, representing an increase of 43.5% as compared to the prioryear. This growth was primarily due to sales of ZYTIGA® (abiraterone acetate), VELCADE® (bortezomib) and DOXIL® /CAELYX® (pegylated liposomal doxorubicin hydrochloride), due to returning supply of CAELYX®.
Other Pharmaceutical sales were $4.9 billion, an increase of 0.2% as compared to the prior year. Strong sales ofXARELTO® (rivaroxaban) and the launch of INVOKANA® (canagliflozin) were partially offset by lower sales of ACIPHEX® /PARIET® (rabeprazole sodium) and EPREX® (Epoetin alfa) primarily due to generic competition.
During 2013, the company received several regulatory approvals including: The U.S. Food and Drug Administration (FDA)approval of OLYSIO™ (simeprevir), an NS3/4A inhibitor, for the treatment of chronic hepatitis C infection as part of anantiviral treatment regimen in combination with pegylated interferon and ribavirin in genotype 1 infected adults withcompensated liver disease, including cirrhosis; FDA approval for IMBRUVICA™ (ibrutinib) capsules for the treatment ofpatients with mantle cell lymphoma who have received at least one prior therapy; The FDA and European Commission(EC) approved INVOKANA® (canagliflozin), an oral, once-daily, selective sodium glucose co-transporter 2 inhibitor, for thetreatment of adults with type 2 diabetes; The FDA approved the use of STELARA® (ustekinumab) alone or in combinationwith methotrexate for the treatment of adult patients with active psoriatic arthritis; The EC also approved STELARA®
(ustekinumab), alone or in combination with methotrexate for active psoriatic arthritis in adults when the response toprevious non-biological disease-modifying anti-rheumatic drug therapy has been inadequate; The EC approved anexpanded indication for SIMPONI® (golimumab) for the treatment of moderately to severely active ulcerative colitis in adultpatients who have had an inadequate response to conventional therapy including corticosteroids and 6-mercaptopurine orazathioprine, or who are intolerant to or have medical contraindications for such therapies; SIMPONI® (golimumab) wasalso approved by the FDA for the treatment of moderately to severely active ulcerative colitis in adult patients who havedemonstrated corticosteroid dependence or who have had an inadequate response to or failed to tolerate oralaminosalicylates, oral corticosteroids, azathioprine, or 6-mercaptopurine; The FDA also approved SIMPONI® ARIATM
(golimumab) for infusion for the treatment of adults with moderately to severely active rheumatoid arthritis in combinationwith methotrexate. The EC approved the use of VELCADE® (bortezomib) as induction therapy in combination withdexamethasone or thalidomide and dexamethasone and applies to adult patients with previously-untreated multiplemyeloma who are eligible for high-dose chemotherapy with hematological stem cell transplantation.
The Company submitted several New Drug Applications, including a Marketing Authorization Application (MAA) to theEuropean Medicines Agency (EMA) and a New Drug Application (NDA) to the FDA seeking approval for the use ofibrutinib for the treatment of adult patients with relapsed or refractory chronic lymphocytic leukemia /small lymphocyticlymphoma, and an MAA for relapsed or refractory mantle cell lymphoma. An MAA was submitted to the EMA seekingapproval for a once-daily single tablet fixed-dose antiretroviral combination product containing darunavir, a proteaseinhibitor, with cobicistat, a pharmacokinetic enhancer or boosting agent, developed by Gilead Sciences, Inc. for use incombination with other human immunodeficiency virus medicines. A Biologic License Application to the FDA and an MAAto the EMA were simultaneously submitted for siltuximab for the treatment of patients with multicentric Castleman diseasewho are HIV-negative and human herpes virus-8 -negative. An MAA was submitted to the EMA for simeprevir for thetreatment of adult patients with chronic hepatitis C genotype 1 or genotype 4. Additionally, an MAA was submitted to theEMA for canagliflozin/metformin fixed-dose combination therapy to treat patients with type 2 diabetes.
The Pharmaceutical segment achieved sales of $25.4 billion in 2012, representing an increase of 4.0% over the prior year,with operational growth of 6.8% and a negative currency impact of 2.8%. U.S. sales were $12.4 billion, an increase of0.3%. International sales were $12.9 billion, an increase of 7.9%, which included 13.6% operational growth and anegative currency impact of 5.7%.
6 • Johnson & Johnson 2013 Annual Report

Medical Devices and Diagnostics Segment
The Medical Devices and Diagnostics segment achieved sales of $28.5 billion in 2013, representing an increase of 3.9%over the prior year, with operational growth of 6.1% and a negative currency impact of 2.2%. U.S. sales were $12.8 billion,an increase of 3.5% as compared to the prior year. International sales were $15.7 billion, an increase of 4.2% over theprior year, with operational growth of 8.3% and a negative currency impact of 4.1%. The acquisition of Synthes, Inc., net ofthe related trauma business divestiture, increased both total sales growth and operational growth for the Medical Devicesand Diagnostics segment by 6.0% and 7.9% in 2013 and 2012, respectively.
Major Medical Devices and Diagnostics Franchise Sales:
% Change
(Dollars in Millions) 2013 2012 2011 ’13 vs. ’12 ’12 vs. ’11
Orthopaedics $9,509 7,799 5,809 21.9% 34.3
Surgical Care 6,269 6,483 6,637 (3.3) (2.3)
Vision Care 2,937 2,996 2,916 (2.0) 2.7
Specialty Surgery 2,592 2,526 2,407 2.6 4.9
Diabetes Care 2,309 2,616 2,652 (11.7) (1.4)
Cardiovascular Care 2,077 1,985 2,288 4.6 (13.2)
Diagnostics 1,885 2,069 2,164 (8.9) (4.4)
Infection Prevention/Other 912 952 906 (4.2) 5.1
Total Medical Devices and Diagnostics Sales $28,490 27,426 25,779 3.9% 6.4
The Orthopaedics franchise achieved sales of $9.5 billion in 2013, a 21.9% increase over the prior year. Growth wasprimarily due to a full year of sales recorded from the acquisition of Synthes, Inc. and sales of joint reconstructionproducts. Sales were impacted by the divestiture of certain rights and assets related to the DePuy trauma business. Thepositive impact on the Orthopaedics franchise total sales growth and operational growth due to the newly acquiredproducts from Synthes, Inc. net of the related trauma business divestiture was 21.2% and 34.7% in 2013 and 2012,respectively.
The Surgical Care franchise sales were $6.3 billion in 2013, a decrease of 3.3% from the prior year. The decline wasprimarily due to lower sales of mechanical surgery, breast care and pelvic floor products. Outside the U.S. increased salesof sutures and endoscopy products, with the success of the ECHELON FLEX™ powered ENDOPATH® Stapler wereoffset by the negative impact from currency.
The Vision Care franchise achieved sales of $2.9 billion in 2013, a decrease of 2.0% from the prior year. The decline wasprimarily due to sales in Japan which were impacted by the devaluation of the Yen. The decline was partially offset bygrowth of ACUVUE® TruEye® and 1-DAY ACUVUE® MOIST® for Astigmatism.
The Specialty Surgery franchise achieved sales of $2.6 billion in 2013, a 2.6% increase over the prior year. Contributorsto the growth were strong sales from biosurgical products, sales of energy products outside the U.S. and Acclarentproducts in the U.S.
The Diabetes Care franchise sales were $2.3 billion, a decrease of 11.7% versus the prior year. Sales declined due to theimpact of lower prices primarily related to competitive bidding in the U.S. as well as pricing pressures outside the U.S.
The Cardiovascular Care franchise sales were $2.1 billion, a 4.6% increase from the prior year. The increased sales weredriven by strong growth in Biosense Webster’s electrophysiology business primarily due to the success of a number ofcatheter launches.
The Diagnostics franchise sales were $1.9 billion, a decline of 8.9% versus the prior year. The decline was primarily due tothe divestiture of the Therakos business and a sales decline in clinical laboratories. In January 2013, the Companyannounced it was exploring strategic alternatives for the Ortho-Clinical Diagnostics business (the Diagnostics franchise),including a possible divestiture. In January 2014, the Company received a binding offer from The Carlyle Group to acquirethe Ortho-Clinical Diagnostics business. For more details see Note 20 to the Consolidated Financial Statements.
The Infection Prevention/Other franchise sales were $0.9 billion in 2013, a decrease of 4.2% versus the prior yearprimarily due to a negative currency impact.
Johnson & Johnson 2013 Annual Report • 7

The Medical Devices and Diagnostics segment achieved sales of $27.4 billion in 2012, representing an increase of 6.4%over the prior year, with operational growth of 8.7% and a negative currency impact of 2.3%. U.S. sales were $12.4 billion,an increase of 8.7% as compared to the prior year. International sales were $15.1 billion, an increase of 4.5% over theprior year, with operational growth of 8.6% and a negative currency impact of 4.1%. The acquisition of Synthes, Inc., net ofthe related divestiture, increased both total sales growth and operational growth for the Medical Devices and Diagnosticssegment by 7.9%.
Analysis of Consolidated Earnings Before Provision for Taxes onIncomeConsolidated earnings before provision for taxes on income increased by $1.7 billion to $15.5 billion in 2013 ascompared to $13.8 billion in 2012, an increase of 12.3%. Earnings before provision for taxes on income were favorabledue to increased gross profit of $3.4 billion resulting from higher sales of higher margin products and cost containmentinitiatives and a $0.4 billion net gain on equity investment transactions, primarily from the sale of Elan American DepositaryShares. This was partially offset by higher litigation expenses of $1.1 billion and higher expenses of $0.1 billion related tothe DePuy ASR™ Hip program. The fiscal year 2012 included $1.5 billion of higher write-downs of intangible assets andin-process research and development and higher costs of $0.3 billion related to the Synthes acquisition partially offset byhigher gains of $0.8 billion related to divestitures.
The 2012 consolidated earnings before provision for taxes on income increased by $1.4 billion to $13.8 billion ascompared to $12.4 billion in 2011, an increase of 11.4%. Earnings before provision for taxes on income were favorabledue to increased gross profit of $0.9 billion, a $0.1 billion decrease in selling, marketing and administrative expenses dueto cost containment initiatives across many of the businesses, lower litigation expense of $2.1 billion and lower charges of$0.4 billion related to the DePuy ASR™ Hip program versus the prior year. This was partially offset by $2.1 billion ofcharges attributable to asset write-downs and impairment of in-process research and development, primarily related to theCrucell vaccine business and the discontinuation of the Phase III clinical development of bapineuzumab IV and $0.2 billionof integration and currency costs related to the acquisition of Synthes, Inc. versus the prior year. Included in 2011 was a$0.6 billion restructuring charge, net of inventory write-offs which are included in cost of products sold, related to theCardiovascular Care business. Additionally, 2011 included higher gains from divestitures and other items of $0.3 billion,recorded in other (income) expense, net.
As a percent to sales, consolidated earnings before provision for taxes on income in 2013 was 21.7% versus 20.5% in 2012.
Cost of Products Sold and Selling, Marketing and Administrative Expenses: Cost of products sold and selling,marketing and administrative expenses as a percent to sales were as follows:
% of Sales 2013 2012 2011
Cost of products sold 31.3% 32.2 31.3
Percent point (decrease)/increase over the prior year (0.9) 0.9 0.8
Selling, marketing and administrative expenses 30.6% 31.0 32.3
Percent point (decrease)/increase over the prior year (0.4) (1.3) 0.8
In 2013, cost of products sold as a percent to sales decreased compared to the prior year. This was primarily the result ofpositive mix resulting from higher sales of higher margin products, lower costs associated with strong volume growth in thePharmaceutical business and cost reduction efforts across many of the businesses. The decrease was partially offset byincremental intangible asset amortization expense primarily related to Synthes, the Medical Device Excise tax andincreased amortization expense as a result of the royalty buyout agreement with Vertex for INCIVO®. Intangible assetamortization expense for 2013 and 2012 was $1.4 billion and $1.1 billion, respectively. Additionally, 2012 included $0.2billion higher amortization of the inventory step-up charge related to the Synthes, Inc. acquisition. There was a decrease inthe percent to sales of selling, marketing and administrative expenses in 2013 compared to the prior year primarily due tocost containment initiatives across many of the businesses.
In 2012, cost of products sold as a percent to sales increased compared to the prior year. This was primarily the result ofthe amortization of the inventory step-up charge of $0.4 billion and amortization of intangible assets related to the Synthes,Inc. acquisition of $0.3 billion and ongoing remediation costs in the McNeil OTC business. There was a decrease in thepercent to sales of selling, marketing and administrative expenses in 2012 compared to the prior year primarily due to costcontainment initiatives across many of the businesses. The prior year period included higher investment spending in thePharmaceutical business for new products.
8 • Johnson & Johnson 2013 Annual Report

Research and Development Expense: Research and development expense by segment of business was as follows:
2013 2012 2011
(Dollars in Millions) Amount % of Sales* Amount % of Sales* Amount % of Sales*
Consumer $590 4.0% 622 4.3 659 4.4
Pharmaceutical 5,810 20.7 5,362 21.2 5,138 21.1
Medical Devices and Diagnostics 1,783 6.3 1,681 6.1 1,751 6.8
Total research and development expense $8,183 11.5% 7,665 11.4 7,548 11.6
Percent increase/(decrease) over the prioryear 6.8% 1.6 10.3
* As a percent to segment sales
Research and development activities represent a significant part of the Company’s business. These expenditures relate tothe processes of discovering, testing and developing new products, improving existing products, as well as ensuringproduct efficacy and regulatory compliance prior to launch. The Company remains committed to investing in research anddevelopment with the aim of delivering high quality and innovative products. In 2013, worldwide costs of research anddevelopment activities increased by 6.8% compared to 2012. The increase in the Pharmaceutical segment was primarilydue to higher levels of spending to advance the Company’s Pharmaceutical pipeline. In 2012, worldwide costs of researchand development activities increased by 1.6% compared to 2011. The 2012 decrease in the Medical Devices andDiagnostics segment was primarily due to the discontinuation of the clinical development program for the NEVO™Sirolimus-Eluting Coronary Stent.
In-Process Research and Development (IPR&D): In 2013, the Company recorded charges of $0.6 billion primarilyfor the impairment of various IPR&D projects related to Crucell, Corimmun and Acclarent for the delay or discontinuationof certain development projects. In 2012, the Company recorded charges of $1.2 billion, which included $0.7 billion forthe impairment of the IPR&D related to the discontinuation of the Phase III clinical development of bapineuzumab IV andthe partial impairment of the IPR&D related to the Crucell vaccine business in the amount of $0.4 billion. Of the $0.7billion impairment of the IPR&D related to the discontinuation of the Phase III clinical development of bapineuzumab IV,$0.3 billion is attributable to noncontrolling interest. These charges relate to development projects which have beenrecently discontinued or delayed.
Other (Income) Expense, Net: Other (income) expense, net includes royalty income; gains and losses related to thesale and write-down of certain investments in equity securities held by Johnson & Johnson Development Corporation;gains and losses on the disposal of property, plant and equipment; currency gains and losses; and litigation settlements.The change in other (income) expense, net for the fiscal year 2013, was an unfavorable change of $0.9 billion ascompared to the prior year. The fiscal year 2013 included a net gain of $0.4 billion on equity investment transactions,primarily the sale of Elan American Depositary Shares, offset by higher litigation expenses of $1.1 billion, higher expensesof $0.1 billion related to the DePuy ASR™ Hip program and higher currency losses of $0.1 billion. The fiscal year 2012included higher write-downs of intangible assets of $0.8 billion, primarily related to the Crucell vaccine business andhigher costs of $0.1 billion related to the Synthes acquisition. Additionally, 2012 included higher gains of $0.8 billionrelated to divestitures.
In 2012, the favorable change of $1.1 billion in other (income) expense, net, as compared to the prior year was primarilydue to lower expenses of $2.1 billion related to litigation, including product liability, and $0.4 billion for costs related to theDePuy ASR™ Hip program. This was partially offset by $0.9 billion attributed to asset write-downs, primarily related to theCrucell vaccine business, and $0.2 billion of higher integration/transaction and currency costs related to the acquisition ofSynthes, Inc.
Restructuring: In 2011, Cordis Corporation, a subsidiary of Johnson & Johnson, announced the discontinuation of itsclinical development program for the NEVO™ Sirolimus-Eluting Coronary Stent and cessation of the manufacture andmarketing of CYPHER® and CYPHER SELECT® Plus Sirolimus-Eluting Coronary Stents by the end of 2011. TheCompany recorded a pre-tax charge of $0.7 billion, of which $0.1 billion was included in cost of products sold. There wasno restructuring charge in 2012 and 2013.
Interest (Income) Expense: Interest income in 2013 increased by $10 million as compared to the prior year. Cash,cash equivalents and marketable securities totaled $29.2 billion at the end of 2013, and averaged $25.2 billion ascompared to the $26.7 billion average cash balance in 2012. The increase in the year end cash balance was due to cashgenerated from operating activities.
Johnson & Johnson 2013 Annual Report • 9

Interest expense in 2013 decreased by $50 million as compared to 2012 due to a lower average debt balance. Theaverage debt balance was $17.2 billion in 2013 versus $17.9 billion in 2012. The total debt balance at the end of 2013was $18.2 billion as compared to $16.2 billion at the end of 2012. The higher debt balance of approximately $2.0 billionwas due to increased borrowings in December 2013. The Company increased borrowings, capitalizing on favorable termsin the capital markets. The proceeds of the borrowings will be used for general corporate purposes.
Interest income in 2012 decreased by $27 million as compared to the prior year due to lower rates of interest earned andlower average cash balances. Cash, cash equivalents and marketable securities totaled $21.1 billion at the end of 2012,and averaged $26.7 billion as compared to the $30.0 billion average cash balance in 2011. The decline in the averagecash balance was due to the acquisition of Synthes, Inc. partially offset by cash generated from operating activities.
Interest expense in 2012 decreased by $39 million as compared to 2011 due to a lower average debt balance. Theaverage debt balance was $17.9 billion in 2012 versus $18.2 billion in 2011. The total debt balance at the end of 2012was $16.2 billion as compared to $19.6 billion at the end of 2011. The reduction in debt of approximately $3.4 billion wasprimarily due to a reduction in commercial paper.
Segment Pre-Tax Profit
Pre-tax profits by segment of business were as follows:
Percent ofSegment Sales
(Dollars in Millions) 2013 2012 2013 2012
Consumer $1,973 1,693 13.4% 11.7
Pharmaceutical 9,178 6,075 32.6 24.0
Medical Devices and Diagnostics 5,261 7,187 18.5 26.2
Total(1) 16,412 14,955 23.0 22.2
Less: Expenses not allocated to segments(2) 941 1,180
Earnings before provision for taxes on income $15,471 13,775 21.7% 20.5
(1) See Note 18 to the Consolidated Financial Statements for more details.(2) Amounts not allocated to segments include interest (income) expense, noncontrolling interests, and general corporate (income)
expense. A $0.2 billion currency related expense for the acquisition of Synthes, Inc. was not allocated to segments in 2012.
Consumer Segment: In 2013, Consumer segment pre-tax profit as a percent to sales was 13.4% versus 11.7% in2012. The favorable pre-tax profit was primarily due to a gain of $55 million on the sale of intangible and other assets aswell as cost containment initiatives. Included in 2012 were intangible asset write-downs of $0.3 billion. In addition, 2012included higher gains on divestitures of $0.1 billion. In 2012, Consumer segment pre-tax profit as a percent to sales was11.7% versus 14.1% in 2011. Pre-tax profit was unfavorably impacted by $0.3 billion attributed to intangible asset write-downs and approximately $0.3 billion due to unfavorable product mix and remediation costs associated with the McNEIL-PPC, Inc. consent decree. This was partially offset by cost containment initiatives realized in selling, marketing andadministrative expenses. In addition, 2011 included higher gains on divestitures.
Pharmaceutical Segment: In 2013, Pharmaceutical segment pre-tax profit as a percent to sales was 32.6% versus24.0% in 2012. The favorable pre-tax profit was attributable to positive sales mix of higher margin products, lower costsassociated with strong volume growth, a net gain of $0.4 billion on equity investment transactions, primarily the sale ofElan American Depositary Shares, a positive adjustment of approximately $0.2 billion to previous estimates for ManagedMedicaid rebates and cost containment initiatives. This was partially offset by increased amortization expense as a result ofthe royalty buyout agreement with Vertex for INCIVO®. Additionally, 2012 included higher net litigation expense of $0.4billion and higher write-downs of intangible assets and in-process research and development of $0.9 billion. This waspartially offset by higher gains on divestitures of $0.3 billion. In 2012, Pharmaceutical segment pre-tax profit as a percentto sales was 24.0% versus 26.3% in 2011. Pre-tax profit was unfavorably impacted by charges of $1.6 billion attributed tothe write-down of assets and impairment of in-process research and development assets, related to the Crucell vaccinebusiness, and to the discontinuation of the Phase III clinical development of bapineuzumab IV. This was partially offset bylower litigation expense of $1.1 billion versus the prior year and favorable operating expenses of $0.3 billion. Additionally,2012 included the gain on the divestiture of BYSTOLIC® (nebivolol) IP rights.
10 • Johnson & Johnson 2013 Annual Report

Medical Devices and Diagnostics Segment: In 2013, Medical Devices and Diagnostics segment pre-tax profit as apercent to sales was 18.5% versus 26.2% in 2012. The Medical Devices and Diagnostics segment pre-tax profit wasunfavorably impacted by higher costs of $1.4 billion for litigation expense and $0.1 billion related to the DePuy ASR™ Hipprogram as well as the Medical Device Excise tax. In addition, 2012 included higher gains of $0.4 billion on divestiturespartially offset by higher write-downs of intangible assets and in-process research and development of $0.1 billion andhigher costs of $0.1 billion related to the Synthes acquisition. In 2012, Medical Devices and Diagnostics segment pre-taxprofit as a percent to sales was 26.2% versus 20.4% in 2011. The Medical Devices and Diagnostics segment pre-taxprofit was favorably impacted by profits from Synthes sales, lower expenses of $1.4 billion for litigation and the DePuyASR™ Hip program and $0.1 billion for research & development primarily due to the discontinuation of its clinicaldevelopment program for the NEVO™ Sirolimus-Eluting Coronary Stent. This was partially offset by an increase inintegration costs and amortization of the inventory step-up of $0.8 billion associated with the acquisition of Synthes, Inc.and $0.1 billion attributed to the write-down of intangible assets. In addition, 2012 included higher gains on divestituresversus the prior year due to the divestitures of the Therakos business and RhoGAM®. Included in 2011 was a $0.7 billionrestructuring charge related to the discontinuation of the clinical development program for the NEVO™ Sirolimus-ElutingCoronary Stent.
Provision for Taxes on Income: The worldwide effective income tax rate was 10.6% in 2013, 23.7% in 2012 and21.8% in 2011. The decrease in the 2013 effective tax rate of 13.1% as compared to 2012 was attributable to a taxbenefit associated with the write-off of assets for tax purposes associated with Scios Inc., increased taxable income inlower tax jurisdictions relative to higher tax jurisdictions and the inclusion of two years of benefit of the U.S. Research andDevelopment (R&D) tax credit and the Controlled Foreign Corporation (CFC) look-through provisions. The R&D tax creditand the CFC look-through provisions were enacted into law in January 2013 and were retroactive to January 1, 2012.
During 2013, the Company reached a settlement agreement related to certain issues regarding the U.S. Internal RevenueService audit related to tax years 2006-2009. As a result of this settlement, the Company adjusted the unrecognized taxbenefits relating to these matters which lowered tax expense. In addition, the Company recorded additional U.S. taxexpense related to increased dividends of foreign earnings. The above items resulted in a net gain of $180 million. Alsoincluded in 2013 results were incremental tax expenses associated with the establishment of a valuation allowance of$187 million related to the Company’s Belgian foreign affiliate. The above items had no net impact on the effective incometax rate for the fiscal year ended 2013.
The increase in the 2012 effective tax rate of 1.9% as compared to 2011 was due to lower tax benefits on the impairmentof in-process research and development intangible assets in low tax jurisdictions, increases in taxable income in higher taxjurisdictions relative to lower tax jurisdictions and the exclusion of the benefit of the U.S. R&D tax credit and the CFC look-through provisions from the 2012 fiscal year financial results.
Noncontrolling Interest: A charge of $0.7 billion for the impairment of the IPR&D related to the discontinuation of thePhase III clinical development of bapineuzumab IV was recorded in 2012. Of the $0.7 billion impairment, $0.3 billion wasattributable to noncontrolling interest.
Liquidity and Capital Resources
Liquidity & Cash Flows
Cash and cash equivalents were $20.9 billion at the end of 2013 as compared with $14.9 billion at the end of 2012. Theprimary sources of cash that contributed to the $6.0 billion increase versus the prior year were approximately $17.4 billionof cash generated from operating activities partially offset by $5.1 billion net cash used by investing activities and $6.1billion net cash used by financing activities.
Cash flow from operations of $17.4 billion was the result of $13.8 billion of net earnings and $4.5 billion of non-cashcharges and other adjustments related to depreciation and amortization, stock-based compensation, the Venezuelacurrency devaluation, asset write-downs (primarily in-process research and development), net gain on equity investmenttransactions and deferred tax provision reduced by $0.9 billion related to changes in assets and liabilities, net of effectsfrom acquisitions.
Investing activities use of $5.1 billion was primarily for net purchases of investments in marketable securities of $0.9billion, additions to property, plant and equipment of $3.6 billion, acquisitions, net of cash acquired of $0.8 billion andother, primarily intangibles of $0.3 billion partially offset by $0.5 billion of proceeds from the disposal of assets.
Johnson & Johnson 2013 Annual Report • 11

Financing activities use of $6.1 billion was primarily for dividends to shareholders of $7.3 billion and $3.5 billion for therepurchase of common stock, of which $2.9 billion was used to settle the accelerated share repurchase (ASR)agreements in connection with the Synthes transaction. Financing activities also included a source of $2.0 billion from netproceeds of short and long-term debt and $2.7 billion of net proceeds from stock options exercised and associated taxbenefits.
In 2013, the Company continued to have access to liquidity through the commercial paper market. For additional detailson borrowings, see Note 7 to the Consolidated Financial Statements.
The Company anticipates that operating cash flows, existing credit facilities and access to the commercial paper marketswill provide sufficient resources to fund operating needs in 2014.
Concentration of Credit Risk
Global concentration of credit risk with respect to trade accounts receivables continues to be limited due to the largenumber of customers globally and adherence to internal credit policies and credit limits. Economic challenges in Italy,Spain, Greece and Portugal (the Southern European Region) have impacted certain payment patterns, which havehistorically been longer than those experienced in the U.S. and other international markets. The total net trade accountsreceivable balance in the Southern European Region was approximately $2.3 billion as of December 29, 2013 and $2.1billion as of December 30, 2012. Approximately $1.3 billion as of December 29, 2013 and approximately $1.2 billion as ofDecember 30, 2012 of the Southern European Region net trade accounts receivable balance related to the Company’sConsumer, Vision Care and Diabetes Care businesses as well as certain Pharmaceutical and Medical Devices andDiagnostics customers which are in line with historical collection patterns.
The remaining balance of net trade accounts receivable in the Southern European Region has been negatively impactedby the timing of payments from certain government owned or supported health care customers as well as certaindistributors of the Pharmaceutical and Medical Devices and Diagnostics local affiliates. The total net trade accountsreceivable balance for these customers were approximately $1.0 billion at December 29, 2013 and $0.9 billion atDecember 30, 2012. The Company continues to receive payments from these customers and in some cases late paymentpremiums. For customers where payment is expected over periods of time longer than one year, revenue and tradereceivables have been discounted over the estimated period of time for collection. Allowances for doubtful accounts havebeen increased for these customers, but have been immaterial to date. The Company will continue to work closely withthese customers on payment plans, monitor the economic situation and take appropriate actions as necessary.
Financing and Market Risk
The Company uses financial instruments to manage the impact of foreign exchange rate changes on cash flows.Accordingly, the Company enters into forward foreign exchange contracts to protect the value of certain foreign currencyassets and liabilities and to hedge future foreign currency transactions primarily related to product costs. Gains or losseson these contracts are offset by the gains or losses on the underlying transactions. A 10% appreciation of the U.S. Dollarfrom the December 29, 2013 market rates would increase the unrealized value of the Company’s forward contracts by$46 million. Conversely, a 10% depreciation of the U.S. Dollar from the December 29, 2013 market rates would decreasethe unrealized value of the Company’s forward contracts by $56 million. In either scenario, the gain or loss on the forwardcontract would be offset by the gain or loss on the underlying transaction, and therefore, would have no impact on futureanticipated earnings and cash flows.
The Company hedges the exposure to fluctuations in currency exchange rates, and the effect on certain assets andliabilities in foreign currency, by entering into currency swap contracts. A 1% change in the spread between U.S. andforeign interest rates on the Company’s interest rate sensitive financial instruments would either increase or decrease theunrealized value of the Company’s swap contracts by approximately $163 million. In either scenario, at maturity, the gain orloss on the swap contract would be offset by the gain or loss on the underlying transaction, and therefore, would have noimpact on future anticipated cash flows.
The Company does not enter into financial instruments for trading or speculative purposes. Further, the Company has apolicy of only entering into contracts with parties that have at least an “A” (or equivalent) credit rating. The counter-partiesto these contracts are major financial institutions and there is no significant concentration of exposure with any onecounter-party. Management believes the risk of loss is remote.
12 • Johnson & Johnson 2013 Annual Report

The Company has access to substantial sources of funds at numerous banks worldwide. In September 2013, theCompany secured a new 364-day Credit Facility. Total credit available to the Company approximates $10 billion, whichexpires on September 18, 2014. Interest charged on borrowings under the credit line agreement is based on either bidsprovided by banks, the prime rate or London Interbank Offered Rates (LIBOR), plus applicable margins. Commitment feesunder the agreement are not material.
Total borrowings at the end of 2013 and 2012 were $18.2 billion and $16.2 billion, respectively. The increase inborrowings between 2013 and 2012 was a result of financing for general corporate purposes. In 2013, net cash (cashand current marketable securities, net of debt) was $11.0 billion compared to net cash of $4.9 billion in 2012. Total debtrepresented 19.7% of total capital (shareholders’ equity and total debt) in 2013 and 20.0% of total capital in 2012.Shareholders’ equity per share at the end of 2013 was $26.25 compared to $23.33 at year-end 2012, an increase of12.5%.
A summary of borrowings can be found in Note 7 to the Consolidated Financial Statements.
Contractual Obligations and Commitments
The Company’s contractual obligations are primarily for leases, debt and unfunded retirement plans. There are no othersignificant obligations. To satisfy these obligations, the Company will use cash from operations. The following tablesummarizes the Company’s contractual obligations and their aggregate maturities as of December 29, 2013 (see Notes 7,10 and 16 to the Consolidated Financial Statements for further details):
(Dollars in Millions)
Long-TermDebt
Obligations
Interest onDebt
Obligations
UnfundedRetirement
PlansOperating
Leases Total
2014 $1,769 568 74 286 2,697
2015 76 562 73 238 949
2016 2,096 556 78 186 2,916
2017 1,007 516 95 110 1,728
2018 1,526 460 89 85 2,160
After 2018 8,623 4,938 524 87 14,172
Total $15,097 7,600 933 992 24,622
For tax matters, see Note 8 to the Consolidated Financial Statements.
Dividends
The Company increased its dividend in 2013 for the 51st consecutive year. Cash dividends paid were $2.59 per share in2013 compared with dividends of $2.40 per share in 2012, and $2.25 per share in 2011. The dividends were distributedas follows:
2013 2012 2011
First quarter $0.61 $0.57 0.54
Second quarter 0.66 0.61 0.57
Third quarter 0.66 0.61 0.57
Fourth quarter 0.66 0.61 0.57
Total $2.59 $2.40 2.25
On January 2, 2014, the Board of Directors declared a regular quarterly cash dividend of $0.66 per share, payable onMarch 11, 2014, to shareholders of record as of February 25, 2014. The Company expects to continue the practice ofpaying regular cash dividends.
Johnson & Johnson 2013 Annual Report • 13
Other Information
Critical Accounting Policies and Estimates
Management’s discussion and analysis of results of operations and financial condition are based on the Company’sconsolidated financial statements that have been prepared in accordance with accounting principles generally accepted inthe U.S. (GAAP). The preparation of these financial statements requires that management make estimates andassumptions that affect the amounts reported for revenues, expenses, assets, liabilities and other related disclosures.Actual results may or may not differ from these estimates. The Company believes that the understanding of certain keyaccounting policies and estimates are essential in achieving more insight into the Company’s operating results andfinancial condition. These key accounting policies include revenue recognition, income taxes, legal and self-insurancecontingencies, valuation of long-lived assets, assumptions used to determine the amounts recorded for pensions and otheremployee benefit plans and accounting for stock options.
Revenue Recognition: The Company recognizes revenue from product sales when goods are shipped or delivered, andtitle and risk of loss pass to the customer. Provisions for certain rebates, sales incentives, trade promotions, coupons,product returns and discounts to customers are accounted for as reductions in sales in the same period the related salesare recorded.
Product discounts granted are based on the terms of arrangements with direct, indirect and other market participants, aswell as market conditions, including prices charged by competitors. Rebates, the largest being the Medicaid rebateprovision, are estimated based on contractual terms, historical experience, trend analysis and projected market conditionsin the various markets served. The Company evaluates market conditions for products or groups of products primarilythrough the analysis of wholesaler and other third-party sell-through and market research data, as well as internallygenerated information.
Sales returns are generally estimated and recorded based on historical sales and returns information. Products that exhibitunusual sales or return patterns due to dating, competition or other marketing matters are specifically investigated andanalyzed as part of the accounting for sales return accruals.
Sales returns allowances represent a reserve for products that may be returned due to expiration, destruction in the field,or in specific areas, product recall. The returns reserve is based on historical return trends by product and by market as apercent to gross sales. In accordance with the Company’s accounting policies, the Company generally issues credit tocustomers for returned goods. The Company’s sales returns reserves are accounted for in accordance with theU.S. GAAP guidance for revenue recognition when right of return exists. Sales returns reserves are recorded at full salesvalue. Sales returns in the Consumer and Pharmaceutical segments are almost exclusively not resalable. Sales returns forcertain franchises in the Medical Devices and Diagnostics segment are typically resalable but are not material. TheCompany rarely exchanges products from inventory for returned products. The sales returns reserve for the total Companyhas been approximately 1.0% of annual net trade sales during the fiscal reporting years 2013, 2012 and 2011.
Promotional programs, such as product listing allowances and cooperative advertising arrangements, are recorded in theyear incurred. Continuing promotional programs include coupons and volume-based sales incentive programs. Theredemption cost of consumer coupons is based on historical redemption experience by product and value. Volume-basedincentive programs are based on estimated sales volumes for the incentive period and are recorded as products are sold.The Company also earns service revenue for co-promotion of certain products. For all years presented, service revenueswere less than 2% of total revenues and are included in sales to customers. These arrangements are evaluated todetermine the appropriate amounts to be deferred.
In addition, the Company enters into collaboration arrangements that contain multiple revenue generating activities.Amounts due from collaborative partners for these arrangements are recognized as each activity is performed or delivered,based on the relative fair value. Upfront fees received as part of these arrangements are deferred and recognized over theperformance period. See Note 1 to the Consolidated Financial Statements for additional disclosures on collaborations.
Reasonably likely changes to assumptions used to calculate the accruals for rebates, returns and promotions are notanticipated to have a material effect on the financial statements. The Company currently discloses the impact of changesto assumptions in the quarterly or annual filing in which there is a material financial statement impact.
14 • Johnson & Johnson 2013 Annual Report

Below are tables that show the progression of accrued rebates, returns, promotions, reserve for doubtful accounts andreserve for cash discounts by segment of business for the fiscal years ended December 29, 2013 and December 30,2012.
Consumer Segment
(Dollars in Millions)
Balance atBeginning of
Period AccrualsPayments/
Credits
Balance atEnd ofPeriod
2013
Accrued rebates(1) $132 524 (519) 137
Accrued returns 108 94 (122) 80
Accrued promotions 281 1,478 (1,438) 321
Subtotal $521 2,096 (2,079) 538
Reserve for doubtful accounts 38 8 (21) 25
Reserve for cash discounts 21 232 (229) 24
Total $580 2,336 (2,329) 587
2012
Accrued rebates(1) $127 438 (433) 132
Accrued returns 114 131 (137) 108
Accrued promotions 240 1,392 (1,351) 281
Subtotal $481 1,961 (1,921) 521
Reserve for doubtful accounts 43 6 (11) 38
Reserve for cash discounts 22 214 (215) 21
Total $546 2,181 (2,147) 580
(1) Includes reserve for customer rebates of $32 million at December 29, 2013 and $33 million at December 30, 2012, recorded as acontra asset.
Pharmaceutical Segment
(Dollars in Millions)
Balance atBeginning of
Period AccrualsPayments/
Credits
Balance atEnd ofPeriod
2013
Accrued rebates(1) $1,767 5,774 (5,556) 1,985
Accrued returns 397 30 (55) 372
Accrued promotions 94 89 (87) 96
Subtotal $2,258 5,893 (5,698) 2,453
Reserve for doubtful accounts 191 26 (122) 95
Reserve for cash discounts 62 471 (472) 61
Total $2,511 6,390 (6,292) 2,609
2012
Accrued rebates(1) $1,591 4,732 (4,556) 1,767
Accrued returns 384 49 (36) 397
Accrued promotions 83 142 (131) 94
Subtotal $2,058 4,923 (4,723) 2,258
Reserve for doubtful accounts 157 47 (13) 191
Reserve for cash discounts 45 425 (408) 62
Total $2,260 5,395 (5,144) 2,511
(1) Includes reserve for customer rebates of $295 million at December 29, 2013 and $269 million at December 30, 2012, recorded as acontra asset.
Johnson & Johnson 2013 Annual Report • 15

Medical Devices and Diagnostics Segment
(Dollars in Millions)
Balance atBeginning of
Period AccrualsPayments/
Credits
Balance atEnd ofPeriod
2013
Accrued rebates(1) $567 4,261 (4,027) 801
Accrued returns 205 356 (381) 180
Accrued promotions 60 52 (46) 66
Subtotal $832 4,669 (4,454) 1,047
Reserve for doubtful accounts 237 19 (43) 213
Reserve for cash discounts 22 394 (398) 18
Total $1,091 5,082 (4,895) 1,278
2012
Accrued rebates(1) $497 3,803 (3,733) 567
Accrued returns 184 369 (348) 205
Accrued promotions 73 49 (62) 60
Subtotal $754 4,221 (4,143) 832
Reserve for doubtful accounts 161 74 2 237
Reserve for cash discounts 32 371 (381) 22
Total $947 4,666 (4,522) 1,091
(1) Includes reserve for customer rebates of $403 million at December 29, 2013 and $340 million at December 30, 2012, recorded as acontra asset.
Income Taxes: Income taxes are recorded based on amounts refundable or payable for the current year and include theresults of any difference between U.S. GAAP accounting and tax reporting, recorded as deferred tax assets or liabilities.The Company estimates deferred tax assets and liabilities based on current tax regulations and rates. Changes in tax lawsand rates may affect recorded deferred tax assets and liabilities in the future.
The Company has unrecognized tax benefits for uncertain tax positions. The Company follows U.S. GAAP whichprescribes a recognition threshold and measurement attribute for the financial statement recognition and measurement ofa tax position taken or expected to be taken in a tax return. Management believes that changes in these estimates wouldnot have a material effect on the Company’s results of operations, cash flows or financial position.
At December 29, 2013 and December 30, 2012, the cumulative amounts of undistributed international earnings wereapproximately $50.9 billion and $49.0 billion, respectively. At December 29, 2013 and December 30, 2012, theCompany’s foreign subsidiaries held balances of cash and cash equivalents in the amounts of $18.6 billion and $14.8billion, respectively. The Company has not provided deferred taxes on the undistributed earnings from certain internationalsubsidiaries where the earnings are considered to be permanently reinvested. The Company intends to continue toreinvest these earnings in international operations. If the Company decided at a later date to repatriate these earnings tothe U.S., the Company would be required to provide for the net tax effects on these amounts. The Company does notdetermine the deferred tax liability associated with these undistributed earnings, as such determination is not practical.
See Note 8 to the Consolidated Financial Statements for further information regarding income taxes.
Legal and Self Insurance Contingencies: The Company records accruals for various contingencies including legalproceedings and product liability claims as these arise in the normal course of business. The accruals are based onmanagement’s judgment as to the probability of losses and, where applicable, actuarially determined estimates. TheCompany has self insurance through a wholly-owned captive insurance company. In addition to accruals in the selfinsurance program, claims that exceed the insurance coverage are accrued when losses are probable and amounts can bereasonably estimated. Additionally, the Company records insurance receivable amounts from third-party insurers whenrecovery is probable. As appropriate, reserves against these receivables are recorded for estimated amounts that may notbe collected from third-party insurers.
The Company follows the provisions of U.S. GAAP when recording litigation related contingencies. A liability is recordedwhen a loss is probable and can be reasonably estimated. The best estimate of a loss within a range is accrued; however,if no estimate in the range is better than any other, the minimum amount is accrued.
16 • Johnson & Johnson 2013 Annual Report

Long-Lived and Intangible Assets: The Company assesses changes in economic conditions and makes assumptionsregarding estimated future cash flows in evaluating the value of the Company’s property, plant and equipment, goodwilland intangible assets. As these assumptions and estimates may change over time, it may or may not be necessary for theCompany to record impairment charges.
Employee Benefit Plans: The Company sponsors various retirement and pension plans, including defined benefit,defined contribution and termination indemnity plans, which cover most employees worldwide. These plans are based onassumptions for the discount rate, expected return on plan assets, expected salary increases and health care cost trendrates. See Note 10 to the Consolidated Financial Statements for further details on these rates and the effect a rate changewould have on the Company’s results of operations.
Stock Based Compensation: The Company recognizes compensation expense associated with the issuance of equityinstruments to employees for their services. The fair value of each award is estimated on the date of grant using the Black-Scholes option valuation model and is expensed in the financial statements over the vesting period. The input assumptionsused in determining fair value are the expected life, expected volatility, risk-free rate and the dividend yield. See Note 17 tothe Consolidated Financial Statements for additional information.
New Accounting Pronouncements
Refer to Note 1 to the Consolidated Financial Statements for recently adopted accounting pronouncements and recentlyissued accounting pronouncements not yet adopted as of December 29, 2013.
Economic and Market Factors
The Company is aware that its products are used in an environment where, for more than a decade, policymakers, consumersand businesses have expressed concerns about the rising cost of health care. In response to these concerns, the Companyhas a long-standing policy of pricing products responsibly. For the period 2003 – 2013, in the United States, the weightedaverage compound annual growth rate of the Company’s net price increases for health care products (prescription and over-the-counter drugs, hospital and professional products) was below the U.S. Consumer Price Index (CPI).
Inflation rates continue to have an effect on worldwide economies and, consequently, on the way companies operate. TheCompany has accounted for operations in Venezuela as highly inflationary in 2011, 2012 and 2013, as the prior three-yearcumulative inflation rate surpassed 100%. In the face of increasing costs, the Company strives to maintain its profitmargins through cost reduction programs, productivity improvements and periodic price increases.
The Company is exposed to fluctuations in currency exchange rates. A 1% change in the value of the U.S. Dollar ascompared to all foreign currencies in which the Company had sales, income or expense in 2013 would have increased ordecreased the translation of foreign sales by approximately $385 million and income by $80 million.
The Company faces various worldwide health care changes that may continue to result in pricing pressures that includehealth care cost containment and government legislation relating to sales, promotions and reimbursement of health careproducts.
Changes in the behavior and spending patterns of purchasers of health care products and services, including delayingmedical procedures, rationing prescription medications, reducing the frequency of physician visits and foregoing healthcare insurance coverage, as a result of the current global economic downturn, may continue to impact the Company’sbusinesses.
The Company also operates in an environment which has become increasingly hostile to intellectual property rights.Generic drug firms have filed Abbreviated New Drug Applications (ANDAs) seeking to market generic forms of most of theCompany’s key pharmaceutical products, prior to expiration of the applicable patents covering those products. In the eventthe Company is not successful in defending the patent claims challenged in ANDA filings, the generic firms will thenintroduce generic versions of the product at issue, resulting in the potential for substantial market share and revenuelosses for that product. For further information, see the discussion on “Litigation Against Filers of Abbreviated New DrugApplications” in Note 21 to the Consolidated Financial Statements.
Legal Proceedings
Johnson & Johnson and certain of its subsidiaries are involved in various lawsuits and claims regarding product liability,intellectual property, commercial and other matters; governmental investigations; and other legal proceedings that arisefrom time to time in the ordinary course of business.
Johnson & Johnson 2013 Annual Report • 17

The Company records accruals for such contingencies when it is probable that a liability will be incurred and the amountof the loss can be reasonably estimated. The Company has accrued for certain litigation matters and continues to monitoreach related legal issue and adjust accruals for new information and further developments in accordance with AccountingStandards Codification (ASC) 450-20-25. For these and other litigation and regulatory matters currently disclosed forwhich a loss is probable or reasonably possible, the Company is unable to determine an estimate of the possible loss orrange of loss beyond the amounts already accrued. These matters can be affected by various factors, including whetherdamages sought in the proceedings are unsubstantiated or indeterminate; scientific and legal discovery has notcommenced or is not complete; proceedings are in early stages; matters present legal uncertainties; there are significantfacts in dispute; or there are numerous parties involved.
In the Company’s opinion, based on its examination of these matters, its experience to date and discussions with counsel,the ultimate outcome of legal proceedings, net of liabilities accrued in the Company’s balance sheet, is not expected tohave a material adverse effect on the Company’s financial position. However, the resolution in any reporting period of oneor more of these matters, either alone or in the aggregate, may have a material adverse effect on the Company’s results ofoperations and cash flows for that period.
See Note 21 to the Consolidated Financial Statements for further information regarding legal proceedings.
Common Stock Market Prices
The Company’s Common Stock is listed on the New York Stock Exchange under the symbol JNJ. As of February 18,2014, there were 165,304 record holders of Common Stock of the Company. The composite market price ranges forJohnson & Johnson Common Stock during 2013 and 2012 were:
2013 2012
High Low High Low
First quarter $81.59 69.18 66.32 64.02
Second quarter 89.99 80.31 67.70 61.71
Third quarter 94.42 85.50 69.75 66.85
Fourth quarter 95.99 85.50 72.74 67.80
Year-end close $92.35 69.48
18 • Johnson & Johnson 2013 Annual Report

Cautionary Factors That May Affect Future ResultsThis Annual Report contains forward-looking statements. Forward-looking statements do not relate strictly to historical orcurrent facts and anticipate results based on management’s plans that are subject to uncertainty. Forward-lookingstatements may be identified by the use of words such as “plans,” “expects,” “will,” “anticipates,” “estimates” and otherwords of similar meaning in conjunction with, among other things, discussions of future operations, financial performance,the Company’s strategy for growth, product development, regulatory approval, market position and expenditures.
Forward-looking statements are based on current expectations of future events. The Company cannot guarantee that anyforward-looking statement will be accurate, although the Company believes that it has been reasonable in its expectationsand assumptions. Investors should realize that if underlying assumptions prove inaccurate or that unknown risks oruncertainties materialize, actual results could vary materially from the Company’s expectations and projections. Investorsare therefore cautioned not to place undue reliance on any forward-looking statements. The Company does not undertaketo update any forward-looking statements as a result of new information or future events or developments.
Risks and uncertainties include, but are not limited to, general industry conditions and competition; economic factors, suchas interest rate and currency exchange rate fluctuations; technological advances, new products and patents attained bycompetitors; challenges inherent in new product development, including obtaining regulatory approvals; challenges topatents; significant litigation or government action adverse to the Company; impact of business combinations; financialdistress and bankruptcies experienced by significant customers and suppliers; changes to governmental laws andregulations and U.S. and foreign health care reforms; trends toward health care cost containment; increased scrutiny ofthe health care industry by government agencies; changes in behavior and spending patterns of purchasers of health careproducts and services; financial instability of international economies and sovereign risk; disruptions due to naturaldisasters; manufacturing difficulties or delays; complex global supply chains with increasing regulatory requirements; andproduct efficacy or safety concerns resulting in product recalls or regulatory action.
The Company’s report on Form 10-K for the year ended December 29, 2013 includes, in Exhibit 99, a discussion ofadditional factors that could cause actual results to differ from expectations. The Company notes these factors aspermitted by the Private Securities Litigation Reform Act of 1995.
Johnson & Johnson 2013 Annual Report • 19

JOHNSON & JOHNSON AND SUBSIDIARIES
CONSOLIDATED BALANCE SHEETSAt December 29, 2013 and December 30, 2012(Dollars in Millions Except Share and Per Share Amounts) (Note 1)
2013 2012
Assets
Current assets
Cash and cash equivalents (Notes 1 and 2) $20,927 14,911
Marketable securities (Notes 1 and 2) 8,279 6,178
Accounts receivable trade, less allowances for doubtful accounts $333 (2012, $466) 11,713 11,309
Inventories (Notes 1 and 3) 7,878 7,495
Deferred taxes on income (Note 8) 3,607 3,139
Prepaid expenses and other receivables 4,003 3,084
Total current assets 56,407 46,116
Property, plant and equipment, net (Notes 1 and 4) 16,710 16,097
Intangible assets, net (Notes 1 and 5) 27,947 28,752
Goodwill (Notes 1 and 5) 22,798 22,424
Deferred taxes on income (Note 8) 3,872 4,541
Other assets 4,949 3,417
Total assets $132,683 121,347
Liabilities and Shareholders’ Equity
Current liabilities
Loans and notes payable (Note 7) $4,852 4,676
Accounts payable 6,266 5,831
Accrued liabilities 7,685 7,299
Accrued rebates, returns and promotions 3,308 2,969
Accrued compensation and employee related obligations 2,794 2,423
Accrued taxes on income 770 1,064
Total current liabilities 25,675 24,262
Long-term debt (Note 7) 13,328 11,489
Deferred taxes on income (Note 8) 3,989 3,136
Employee related obligations (Notes 9 and 10) 7,784 9,082
Other liabilities 7,854 8,552
Total liabilities 58,630 56,521
Shareholders’ equity
Preferred stock – without par value (authorized and unissued 2,000,000 shares) – –
Common stock – par value $1.00 per share (Note 12) (authorized 4,320,000,000 shares; issued3,119,843,000 shares) 3,120 3,120
Accumulated other comprehensive income (Note 13) (2,860) (5,810)
Retained earnings 89,493 85,992
89,753 83,302
Less: common stock held in treasury, at cost (Note 12) (299,215,000 shares and 341,354,000 shares) 15,700 18,476
Total shareholders’ equity 74,053 64,826
Total liabilities and shareholders’ equity $132,683 121,347
See Notes to Consolidated Financial Statements
20 • Johnson & Johnson 2013 Annual Report

JOHNSON & JOHNSON AND SUBSIDIARIES
CONSOLIDATED STATEMENTS OF EARNINGS(Dollars and Shares in Millions Except Per Share Amounts) (Note 1)
2013 2012 2011
Sales to customers $71,312 67,224 65,030
Cost of products sold 22,342 21,658 20,360
Gross profit 48,970 45,566 44,670
Selling, marketing and administrative expenses 21,830 20,869 20,969
Research and development expense 8,183 7,665 7,548
In-process research and development 580 1,163 –
Interest income (74) (64) (91)
Interest expense, net of portion capitalized (Note 4) 482 532 571
Other (income) expense, net 2,498 1,626 2,743
Restructuring (Note 22) – – 569
Earnings before provision for taxes on income 15,471 13,775 12,361
Provision for taxes on income (Note 8) 1,640 3,261 2,689
Net earnings 13,831 10,514 9,672
Add: Net loss attributable to noncontrolling interest – 339 –
Net earnings attributable to Johnson & Johnson $13,831 10,853 9,672
Net earnings per share attributable to Johnson & Johnson (Notes 1 and 15)
Basic $4.92 3.94 3.54
Diluted $4.81 3.86 3.49
Cash dividends per share $2.59 2.40 2.25
Average shares outstanding (Notes 1 and 15)
Basic 2,809.2 2,753.3 2,736.0
Diluted 2,877.0 2,812.6 2,775.3
See Notes to Consolidated Financial Statements
Johnson & Johnson 2013 Annual Report • 21

JOHNSON & JOHNSON AND SUBSIDIARIES
CONSOLIDATED STATEMENTS OF COMPREHENSIVE INCOME(Dollars in Millions) (Note 1)
2013 2012 2011
Net earnings $13,831 10,514 9,672
Other comprehensive income (loss), net of tax
Foreign currency translation 94 1,230 (557)
Securities:
Unrealized holding gain (loss) arising during period 225 (248) 565
Reclassifications to earnings (314) (5) (141)
Net change (89) (253) 424
Employee benefit plans:
Prior service cost amortization during period 9 2 5
Prior service cost – current year (27) (8) 15
Gain amortization during period 515 370 246
Gain (loss) – current year 2,203 (1,643) (1,984)
Effect of exchange rates 8 (52) 18
Net change 2,708 (1,331) (1,700)
Derivatives & hedges:
Unrealized gain (loss) arising during period 344 52 (500)
Reclassifications to earnings (107) 124 232
Net change 237 176 (268)
Other comprehensive income (loss) 2,950 (178) (2,101)
Comprehensive income $16,781 10,336 7,571
Comprehensive loss attributable to noncontrolling interest, net of tax – 339 –
Comprehensive income attributable to Johnson & Johnson $16,781 10,675 7,571
The tax effects in other comprehensive income for the fiscal years ended 2013, 2012 and 2011 respectively: Securities;$48 million, $136 million and $228 million, Employee Benefit Plans; $1,421 million, $653 million and $915 million,Derivatives & Hedges; $128 million, $95 million and $144 million.
See Notes to Consolidated Financial Statements
22 • Johnson & Johnson 2013 Annual Report

JOHNSON & JOHNSON AND SUBSIDIARIES
CONSOLIDATED STATEMENTS OF EQUITY(Dollars in Millions) (Note 1)
TotalRetainedEarnings
AccumulatedOther
ComprehensiveIncome
Common StockIssued Amount
TreasuryStock
Amount
Balance, January 2, 2011 $56,579 77,773 (3,531) 3,120 (20,783)
Net earnings attributable to Johnson & Johnson 9,672 9,672
Cash dividends paid (6,156) (6,156)
Employee compensation and stock option plans 1,760 111 1,649
Repurchase of common stock (2,525) (2,525)
Other (149) (149)
Other comprehensive income, net of tax (2,101) (2,101)
Balance, January 1, 2012 $57,080 81,251 (5,632) 3,120 (21,659)
Net earnings attributable to Johnson & Johnson 10,853 10,853
Cash dividends paid (6,614) (6,614)
Employee compensation and stock option plans 3,269 19 3,250
Issuance of common stock associated with theacquisition of Synthes, Inc. 13,335 483 12,852
Repurchase of common stock(1) (12,919) (12,919)
Other comprehensive income, net of tax (178) (178)
Balance, December 30, 2012 $64,826 85,992 (5,810) 3,120 (18,476)
Net earnings attributable to Johnson & Johnson 13,831 13,831
Cash dividends paid (7,286) (7,286)
Employee compensation and stock option plans 3,285 (82) 3,367
Repurchase of common stock (3,538) (2,947) (591)
Other (15) (15)
Other comprehensive income, net of tax 2,950 2,950
Balance, December 29, 2013 $74,053 89,493 (2,860) 3,120 (15,700)
(1) Includes repurchase of common stock associated with the acquisition of Synthes, Inc.
See Notes to Consolidated Financial Statements
Johnson & Johnson 2013 Annual Report • 23

JOHNSON & JOHNSON AND SUBSIDIARIES
CONSOLIDATED STATEMENTS OF CASH FLOWS(Dollars in Millions) (Note 1)
2013 2012 2011
Cash flows from operating activitiesNet earnings $13,831 10,514 9,672Adjustments to reconcile net earnings to cash flows from operating activities:
Depreciation and amortization of property and intangibles 4,104 3,666 3,158Stock based compensation 728 662 621Noncontrolling interest – 339 –Venezuela currency devaluation 108 – –Asset write-downs 739 2,131 160Net gain on equity investment transactions (417) – –Deferred tax provision (607) (39) (836)Accounts receivable allowances (131) 92 32
Changes in assets and liabilities, net of effects from acquisitions:Increase in accounts receivable (632) (9) (915)Increase in inventories (622) (1) (715)Increase in accounts payable and accrued liabilities 1,821 2,768 493Increase in other current and non-current assets (1,806) (2,172) (1,785)Increase/(decrease) in other current and non-current liabilities 298 (2,555) 4,413
Net cash flows from operating activities 17,414 15,396 14,298Cash flows from investing activitiesAdditions to property, plant and equipment (3,595) (2,934) (2,893)Proceeds from the disposal of assets 458 1,509 1,342Acquisitions, net of cash acquired (Note 20) (835) (4,486) (2,797)Purchases of investments (18,923) (13,434) (29,882)Sales of investments 18,058 14,797 30,396Other (primarily intangibles) (266) 38 (778)Net cash used by investing activities (5,103) (4,510) (4,612)Cash flows from financing activitiesDividends to shareholders (7,286) (6,614) (6,156)Repurchase of common stock (3,538) (12,919) (2,525)Proceeds from short-term debt 1,411 3,268 9,729Retirement of short-term debt (1,397) (6,175) (11,200)Proceeds from long-term debt 3,607 45 4,470Retirement of long-term debt (1,593) (804) (16)Proceeds from the exercise of stock options/excess tax benefits 2,649 2,720 1,246Other 56 (83) –Net cash used by financing activities (6,091) (20,562) (4,452)
Effect of exchange rate changes on cash and cash equivalents (204) 45 (47)Increase/(decrease) in cash and cash equivalents 6,016 (9,631) 5,187Cash and cash equivalents, beginning of year (Note 1) 14,911 24,542 19,355Cash and cash equivalents, end of year (Note 1) $20,927 14,911 24,542
Supplemental cash flow dataCash paid during the year for:
Interest $596 616 576Interest, net of amount capitalized 491 501 492Income taxes 3,155 2,507 2,970
Supplemental schedule of non-cash investing and financing activitiesIssuance of common stock associated with the acquisition of Synthes, Inc. – 13,335 –Treasury stock issued for employee compensation and stock option plans, net of cash proceeds 743 615 433Conversion of debt 22 – 1
AcquisitionsFair value of assets acquired $1,028 19,025 3,025Fair value of liabilities assumed and noncontrolling interests (193) (1,204) (228)Net fair value of acquisitions 835 17,821 2,797Less: Issuance of common stock associated with the acquisition of Synthes, Inc. – 13,335 –Net cash paid for acquisitions $835 4,486 2,797
See Notes to Consolidated Financial Statements
24 • Johnson & Johnson 2013 Annual Report
Notes to Consolidated Financial Statements1. Summary of Significant Accounting Policies
Principles of Consolidation
The consolidated financial statements include the accounts of Johnson & Johnson and its subsidiaries (the Company).Intercompany accounts and transactions are eliminated.
Description of the Company And Business Segments
The Company has approximately 128,100 employees worldwide engaged in the research and development, manufactureand sale of a broad range of products in the health care field. The Company conducts business in virtually all countries ofthe world and its primary focus is on products related to human health and well-being.
The Company is organized into three business segments: Consumer, Pharmaceutical and Medical Devices andDiagnostics. The Consumer segment includes a broad range of products used in the baby care, skin care, oral care,wound care and women’s health fields, as well as nutritionals, over-the-counter pharmaceutical products and wellness andprevention platforms. These products are marketed to the general public and sold both to retail outlets and distributorsthroughout the world. The Pharmaceutical segment includes products in the following areas: anti-infective, antipsychotic,contraceptive, gastrointestinal, hematology, immunology, infectious diseases, neurology, oncology, pain management,thrombosis and vaccines. These products are distributed directly to retailers, wholesalers and health care professionals forprescription use. The Medical Devices and Diagnostics segment includes a broad range of products distributed towholesalers, hospitals and retailers, used principally in the professional fields by physicians, nurses, hospitals and clinics.These include products to treat cardiovascular disease; orthopaedic and neurological products; blood glucose monitoringand insulin delivery products; general surgery, biosurgical, and energy products; professional diagnostic products;infection prevention products; and disposable contact lenses.
New Accounting PronouncementsRecently Adopted Accounting Pronouncements
During the fiscal first quarter of 2013, the Company adopted the Financial Accounting Standards Board (FASB) guidanceand amendments related to testing indefinite-lived intangible assets for impairment. Under the amendments in this update,an entity has the option to first assess qualitative factors to determine whether the existence of events or circumstancesindicates that it is more likely than not that the indefinite-lived intangible asset is impaired. If, after assessing the totality ofevents and circumstances, an entity concludes that it is not more likely than not that the indefinite-lived intangible asset isimpaired, then the entity is not required to determine the fair value. However, if an entity concludes otherwise, then it isrequired to determine the fair value of the indefinite-lived intangible asset and perform the quantitative impairment test. Anentity also has the option to bypass the qualitative assessment for any indefinite-lived intangible asset in any period andproceed directly to performing the quantitative impairment test. This update became effective for annual and interimimpairment tests performed for fiscal years beginning after September 15, 2012. The adoption of this standard did nothave a material impact on the Company’s results of operations, cash flows or financial position.
During the fiscal first quarter of 2013, the Company adopted the FASB guidance related to additional reporting anddisclosure of amounts reclassified out of accumulated other comprehensive income (AOCI). Under this new guidance,companies are required to disclose the effect of significant reclassifications out of AOCI on the respective line items onthe income statement if the amount being reclassified is required under U.S. generally accepted accounting principles(GAAP) to be reclassified in its entirety to net income. For other amounts that are not required under GAAP to bereclassified in their entirety to net income in the same reporting period, an entity is required to cross-reference otherdisclosures required under GAAP that provide additional details about those amounts. This update became effective forannual and interim reporting periods for fiscal years beginning after December 15, 2012. The Company has disclosed thereclassification details in Note 13 to the Consolidated Financial Statements.
Johnson & Johnson 2013 Annual Report • 25

Recently Issued Accounting StandardsNot Adopted as of December 29, 2013
During the fiscal first quarter of 2013, the FASB issued amended guidance clarifying the release of accumulated ForeignCurrency Translation from other comprehensive income (OCI) into current year Net Earnings. The amendment requiresthat when the parent company ceases to have a controlling interest in a subsidiary or a business within a foreign entity theparent is to release accumulated Foreign Currency Translation from OCI. This update is required to be adopted for allannual periods and interim reporting periods beginning after December 15, 2013, with early adoption permitted. Theadoption of this standard is not expected to have a material impact on the Company’s results of operations, cash flows orfinancial position.
During the fiscal third quarter of 2013, the FASB issued clarifying guidance on the presentation of unrecognized taxbenefits when various qualifying tax credits exist. The amendment requires that unrecognized tax benefits be presented onthe Consolidated Balance Sheet as a reduction to deferred tax assets created by net operating losses or other tax creditsfrom prior periods that occur in the same taxing jurisdiction. To the extent that the unrecognized tax benefit exceeds thesecredits, it shall be presented as a liability. This update is required to be adopted for all annual periods and interim reportingperiods beginning after December 15, 2013, with early adoption permitted. The adoption of this standard is not expectedto have a material impact on the presentation of the Company’s financial position.
Cash Equivalents
The Company classifies all highly liquid investments with stated maturities of three months or less from date of purchaseas cash equivalents and all highly liquid investments with stated maturities of greater than three months from the date ofpurchase as current marketable securities. The Company has a policy of making investments only with commercialinstitutions that have at least an “A” (or equivalent) credit rating. The Company invests its cash primarily in reverserepurchase agreements (RRAs), government securities and obligations, corporate debt securities and money marketfunds.
RRAs are collateralized by deposits in the form of ‘Government Securities and Obligations’ for an amount not less than102% of their value. The Company does not record an asset or liability as the Company is not permitted to sell orrepledge the associated collateral. The Company has a policy that the collateral has at least an A (or equivalent) creditrating. The Company utilizes a third party custodian to manage the exchange of funds and ensure that collateral received ismaintained at 102% of the value of the RRAs on a daily basis. RRAs with stated maturities of greater than three monthsfrom the date of purchase are classified as marketable securities.
Investments
Short-term marketable securities are carried at cost, which approximates fair value. Investments classified as available-for-sale are carried at estimated fair value with unrealized gains and losses recorded as a component of accumulated othercomprehensive income. Long-term debt securities that the Company has the ability and intent to hold until maturity arecarried at amortized cost. Management determines the appropriate classification of its investment in debt and equitysecurities at the time of purchase and re-evaluates such determination at each balance sheet date. The Companyperiodically reviews its investments in equity securities for impairment and adjusts these investments to their fair valuewhen a decline in market value is deemed to be other than temporary. If losses on these securities are considered to beother than temporary, the loss is recognized in earnings.
Property, Plant and Equipment and Depreciation
Property, plant and equipment are stated at cost. The Company utilizes the straight-line method of depreciation over theestimated useful lives of the assets:
Building and building equipment 20 - 30 years
Land and leasehold improvements 10 - 20 years
Machinery and equipment 2 - 13 years
The Company capitalizes certain computer software and development costs, included in machinery and equipment, whenincurred in connection with developing or obtaining computer software for internal use. Capitalized software costs areamortized over the estimated useful lives of the software, which generally range from 3 to 8 years.
26 • Johnson & Johnson 2013 Annual Report

The Company reviews long-lived assets to assess recoverability using undiscounted cash flows. When certain events orchanges in operating or economic conditions occur, an impairment assessment may be performed on the recoverability ofthe carrying value of these assets. If the asset is determined to be impaired, the loss is measured based on the differencebetween the asset’s fair value and its carrying value. If quoted market prices are not available, the Company will estimatefair value using a discounted value of estimated future cash flows.
Revenue Recognition
The Company recognizes revenue from product sales when the goods are shipped or delivered and title and risk of losspass to the customer. Provisions for certain rebates, sales incentives, trade promotions, coupons, product returns anddiscounts to customers are accounted for as reductions in sales in the same period the related sales are recorded.
Product discounts granted are based on the terms of arrangements with direct, indirect and other market participants, aswell as market conditions, including prices charged by competitors. Rebates, the largest being the Medicaid rebateprovision, are estimated based on contractual terms, historical experience, trend analysis and projected market conditionsin the various markets served. The Company evaluates market conditions for products or groups of products primarilythrough the analysis of wholesaler and other third-party sell-through and market research data, as well as internallygenerated information.
Sales returns are generally estimated and recorded based on historical sales and returns information. Products that exhibitunusual sales or return patterns due to dating, competition or other marketing matters are specifically investigated andanalyzed as part of the accounting for sales returns accruals.
Sales returns allowances represent a reserve for products that may be returned due to expiration, destruction in the field,or in specific areas, product recall. The returns reserve is based on historical return trends by product and by market as apercent to gross sales. In accordance with the Company’s accounting policies, the Company generally issues credit tocustomers for returned goods. The Company’s sales returns reserves are accounted for in accordance with U.S. GAAPguidance for revenue recognition when right of return exists. Sales returns reserves are recorded at full sales value. Salesreturns in the Consumer and Pharmaceutical segments are almost exclusively not resalable. Sales returns for certainfranchises in the Medical Devices and Diagnostics segment are typically resalable but are not material. The Companyrarely exchanges products from inventory for returned products. The sales returns reserve for the total Company has beenapproximately 1.0% of annual sales to customers during the fiscal reporting years 2013, 2012 and 2011.
Promotional programs, such as product listing allowances and cooperative advertising arrangements, are recorded in theyear incurred. Continuing promotional programs include coupons and volume-based sales incentive programs. Theredemption cost of consumer coupons is based on historical redemption experience by product and value. Volume-basedincentive programs are based on the estimated sales volumes for the incentive period and are recorded as products aresold. The Company also earns service revenue for co-promotion of certain products and includes it in sales to customers.These arrangements are evaluated to determine the appropriate amounts to be deferred.
Shipping and Handling
Shipping and handling costs incurred were $1,128 million, $1,051 million and $1,022 million in 2013, 2012 and 2011,respectively, and are included in selling, marketing and administrative expense. The amount of revenue received forshipping and handling is less than 0.5% of sales to customers for all periods presented.
Inventories
Inventories are stated at the lower of cost or market determined by the first-in, first-out method.
Intangible Assets and Goodwill
The authoritative literature on U.S. GAAP requires that goodwill and intangible assets with indefinite lives be assessedannually for impairment. The Company completed the annual impairment test for 2013 in the fiscal fourth quarter. Futureimpairment tests will be performed annually in the fiscal fourth quarter, or sooner if warranted. Purchased in-processresearch and development is accounted for as an indefinite lived intangible asset until the underlying project is completed,at which point the intangible asset will be accounted for as a definite lived intangible asset, or abandoned, at which pointthe intangible asset will be written off or partially impaired.
Intangible assets that have finite useful lives continue to be amortized over their useful lives, and are reviewed forimpairment when warranted by economic conditions. See Note 5 for further details on Intangible Assets and Goodwill.
Johnson & Johnson 2013 Annual Report • 27

Financial Instruments
As required by U.S. GAAP, all derivative instruments are recorded on the balance sheet at fair value. Fair value is the exitprice that would be received to sell an asset or paid to transfer a liability. Fair value is a market-based measurementdetermined using assumptions that market participants would use in pricing an asset or liability. The authoritative literatureestablishes a three-level hierarchy to prioritize the inputs used in measuring fair value, with Level 1 having the highestpriority and Level 3 having the lowest. Changes in the fair value of derivatives are recorded each period in current earningsor other comprehensive income, depending on whether the derivative is designated as part of a hedge transaction, and ifso, the type of hedge transaction.
The Company documents all relationships between hedged items and derivatives. The overall risk management strategyincludes reasons for undertaking hedge transactions and entering into derivatives. The objectives of this strategy are:(1) minimize foreign currency exposure’s impact on the Company’s financial performance; (2) protect the Company’s cashflow from adverse movements in foreign exchange rates; (3) ensure the appropriateness of financial instruments; and(4) manage the enterprise risk associated with financial institutions. See Note 6 for additional information on FinancialInstruments.
Product Liability
Accruals for product liability claims are recorded, on an undiscounted basis, when it is probable that a liability has beenincurred and the amount of the liability can be reasonably estimated based on existing information. The accruals areadjusted periodically as additional information becomes available.
As a result of cost and availability factors, effective November 1, 2005, the Company ceased purchasing third-partyproduct liability insurance. The Company has self insurance through a wholly-owned captive insurance company. Inaddition to accruals in the self insurance program, claims that exceed the insurance coverage are accrued when losses areprobable and amounts can be reasonably estimated. Based on the availability of prior coverage, receivables for insurancerecoveries related to product liability claims are recorded on an undiscounted basis, when it is probable that a recovery willbe realized. As appropriate, reserves against these receivables are recorded for estimated amounts that may not becollected from third-party insurers.
Concentration of Credit Risk
Global concentration of credit risk with respect to trade accounts receivables continues to be limited due to the largenumber of customers globally and adherence to internal credit policies and credit limits. Recent economic challenges inItaly, Spain, Greece and Portugal (the Southern European Region) have impacted certain payment patterns, which havehistorically been longer than those experienced in the U.S. and other international markets. The total net trade accountsreceivable balance in the Southern European Region was approximately $2.3 billion as of December 29, 2013 andapproximately $2.1 billion as of December 30, 2012. Approximately $1.3 billion as of December 29, 2013 andapproximately $1.2 billion as of December 30, 2012 of the Southern European Region net trade accounts receivablebalance related to the Company’s Consumer, Vision Care and Diabetes Care businesses as well as certainPharmaceutical and Medical Devices and Diagnostics customers which are in line with historical collection patterns.
The remaining balance of net trade accounts receivable in the Southern European Region has been negatively impactedby the timing of payments from certain government owned or supported health care customers as well as certaindistributors of the Pharmaceutical and Medical Devices and Diagnostics local affiliates. The total net trade accountsreceivable balance for these customers were approximately $1.0 billion at December 29, 2013 and $0.9 billion atDecember 30, 2012. The Company continues to receive payments from these customers and in some cases late paymentpremiums. For customers where payment is expected over periods of time longer than one year, revenue and tradereceivables have been discounted over the estimated period of time for collection. Allowances for doubtful accounts havebeen increased for these customers, but have been immaterial to date. The Company will continue to work closely withthese customers on payment plans, monitor the economic situation and take appropriate actions as necessary.
Research and Development
Research and development expenses are expensed as incurred. Upfront and milestone payments made to third parties inconnection with research and development collaborations are expensed as incurred up to the point of regulatory approval.Payments made to third parties subsequent to regulatory approval are capitalized and amortized over the remaining usefullife of the related product. Amounts capitalized for such payments are included in other intangibles, net of accumulatedamortization.
28 • Johnson & Johnson 2013 Annual Report

The Company enters into collaborative arrangements, typically with other pharmaceutical or biotechnology companies, todevelop and commercialize drug candidates or intellectual property. These arrangements typically involve two (or more)parties who are active participants in the collaboration and are exposed to significant risks and rewards dependent on thecommercial success of the activities. These collaborations usually involve various activities by one or more parties,including research and development, marketing and selling and distribution. Often, these collaborations require upfront,milestone and royalty or profit share payments, contingent upon the occurrence of certain future events linked to thesuccess of the asset in development. Amounts due from collaborative partners related to development activities aregenerally reflected as a reduction of research and development expense because the performance of contractdevelopment services is not central to the Company’s operations. In general, the income statement presentation for thesecollaborations is as follows:
Nature/Type of Collaboration Statement of Earnings Presentation
Third-party sale of product Sales to customers
Royalties/milestones paid to collaborative partner(post-regulatory approval)*
Cost of goods sold
Royalties received from collaborative partner Other income (expense), net
Upfront payments & milestones paid to collaborative partner(pre-regulatory approval)
Research and development expense
Research and development payments to collaborativepartner
Research and development expense
Research and development payments received fromcollaborative partner
Reduction of Research and development expense
* Milestones are capitalized as intangible assets and amortized to cost of goods sold over the useful life.
For all years presented, there was no individual project that represented greater than 5% of the total annual consolidatedresearch and development expense.
Advertising
Costs associated with advertising are expensed in the year incurred and are included in selling, marketing andadministrative expenses. Advertising expenses worldwide, which comprised television, radio, print media and Internetadvertising, were $2.5 billion, $2.3 billion and $2.6 billion in 2013, 2012 and 2011, respectively.
Income Taxes
Income taxes are recorded based on amounts refundable or payable for the current year and include the results of anydifference between U.S. GAAP accounting and tax reporting, recorded as deferred tax assets or liabilities. The Companyestimates deferred tax assets and liabilities based on current tax regulations and rates. Changes in tax laws and rates mayaffect recorded deferred tax assets and liabilities in the future.
The Company has unrecognized tax benefits for uncertain tax positions. The Company follows U.S. GAAP whichprescribes a recognition threshold and measurement attribute for the financial statement recognition and measurement ofa tax position taken or expected to be taken in a tax return. Management believes that changes in these estimates wouldnot have a material effect on the Company’s results of operations, cash flows or financial position.
At December 29, 2013 and December 30, 2012, the cumulative amounts of undistributed international earnings wereapproximately $50.9 billion and $49.0 billion, respectively. At December 29, 2013 and December 30, 2012, theCompany’s foreign subsidiaries held balances of cash and cash equivalents in the amounts of $18.6 billion and $14.8billion, respectively. The Company has not provided deferred taxes on the undistributed earnings from certain internationalsubsidiaries where the earnings are considered to be permanently reinvested. The Company intends to continue toreinvest these earnings in international operations. If the Company decided at a later date to repatriate these earnings tothe U.S., the Company would be required to provide for the net tax effects on these amounts. The Company does notdetermine the deferred tax liability associated with these undistributed earnings, as such determination is not practical.
See Note 8 to the Consolidated Financial Statements for further information regarding income taxes.
Johnson & Johnson 2013 Annual Report • 29

Net Earnings Per Share
Basic earnings per share is computed by dividing net earnings available to common shareholders by the weighted averagenumber of common shares outstanding for the period. Diluted earnings per share reflects the potential dilution that couldoccur if securities were exercised or converted into common stock using the treasury stock method.
Use of Estimates
The preparation of consolidated financial statements in conformity with accounting principles generally accepted in theU.S. requires management to make estimates and assumptions that affect the amounts reported. Estimates are used whenaccounting for sales discounts, rebates, allowances and incentives, product liabilities, income taxes, depreciation,amortization, employee benefits, contingencies and intangible asset and liability valuations. Actual results may or may notdiffer from those estimates.
The Company follows the provisions of U.S. GAAP when recording litigation related contingencies. A liability is recordedwhen a loss is probable and can be reasonably estimated. The best estimate of a loss within a range is accrued; however,if no estimate in the range is better than any other, the minimum amount is accrued.
Annual Closing Date
The Company follows the concept of a fiscal year, which ends on the Sunday nearest to the end of the month ofDecember. Normally each fiscal year consists of 52 weeks, but every five or six years the fiscal year consists of 53 weeks,as was the case in 2009, and will be the case again in 2015.
Reclassification
Certain prior period amounts have been reclassified to conform to current year presentation.
2. Cash, Cash Equivalents and Current Marketable Securities
At the end of 2013 and 2012, cash, cash equivalents and current marketable securities were comprised of:
(Dollars in Millions) 2013 2012
Cash $2,789 3,032
Government securities and obligations 7,632 7,622
Reverse repurchase agreements 15,006 7,701
Corporate debt securities 1,467 622
Money market funds 1,886 1,406
Time deposits 426 706
Total cash, cash equivalents and current marketable securities $29,206 21,089
The estimated fair value was the same as the amortized cost as of December 29, 2013 and December 30, 2012.
As of December 29, 2013, current marketable securities consisted of $6,160 million, $1,100 million and $1,019 million ofgovernment securities and obligations, reverse repurchase agreements and corporate debt securities, respectively.
As of December 30, 2012, current marketable securities consisted of $5,226 million, $500 million and $452 million ofgovernment securities and obligations, reverse repurchase agreements and corporate debt securities, respectively.
Fair value of government securities and obligations and corporate debt securities were estimated using quoted brokerprices and significant other observable inputs.
The Company invests its excess cash in both deposits with major banks throughout the world and other high-qualitymoney market instruments. The Company has a policy of making investments only with commercial institutions that have atleast an “A” (or equivalent) credit rating.
30 • Johnson & Johnson 2013 Annual Report
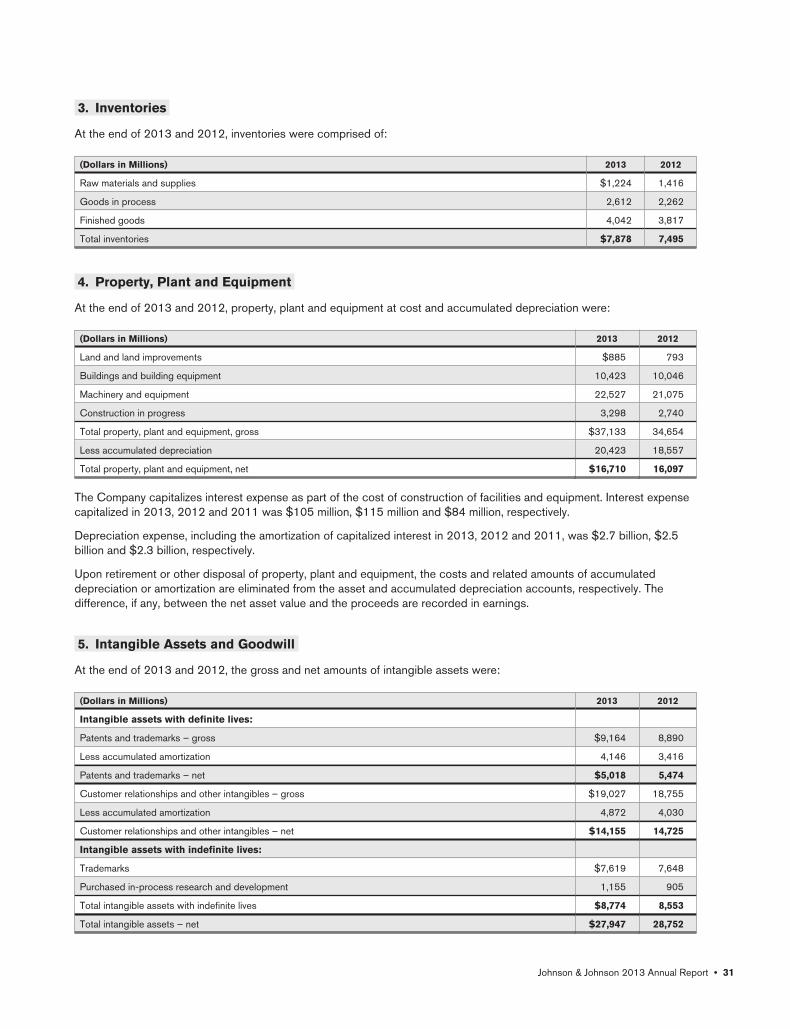
3. Inventories
At the end of 2013 and 2012, inventories were comprised of:
(Dollars in Millions) 2013 2012
Raw materials and supplies $1,224 1,416
Goods in process 2,612 2,262
Finished goods 4,042 3,817
Total inventories $7,878 7,495
4. Property, Plant and Equipment
At the end of 2013 and 2012, property, plant and equipment at cost and accumulated depreciation were:
(Dollars in Millions) 2013 2012
Land and land improvements $885 793
Buildings and building equipment 10,423 10,046
Machinery and equipment 22,527 21,075
Construction in progress 3,298 2,740
Total property, plant and equipment, gross $37,133 34,654
Less accumulated depreciation 20,423 18,557
Total property, plant and equipment, net $16,710 16,097
The Company capitalizes interest expense as part of the cost of construction of facilities and equipment. Interest expensecapitalized in 2013, 2012 and 2011 was $105 million, $115 million and $84 million, respectively.
Depreciation expense, including the amortization of capitalized interest in 2013, 2012 and 2011, was $2.7 billion, $2.5billion and $2.3 billion, respectively.
Upon retirement or other disposal of property, plant and equipment, the costs and related amounts of accumulateddepreciation or amortization are eliminated from the asset and accumulated depreciation accounts, respectively. Thedifference, if any, between the net asset value and the proceeds are recorded in earnings.
5. Intangible Assets and Goodwill
At the end of 2013 and 2012, the gross and net amounts of intangible assets were:
(Dollars in Millions) 2013 2012
Intangible assets with definite lives:
Patents and trademarks – gross $9,164 8,890
Less accumulated amortization 4,146 3,416
Patents and trademarks – net $5,018 5,474
Customer relationships and other intangibles – gross $19,027 18,755
Less accumulated amortization 4,872 4,030
Customer relationships and other intangibles – net $14,155 14,725
Intangible assets with indefinite lives:
Trademarks $7,619 7,648
Purchased in-process research and development 1,155 905
Total intangible assets with indefinite lives $8,774 8,553
Total intangible assets – net $27,947 28,752
Johnson & Johnson 2013 Annual Report • 31
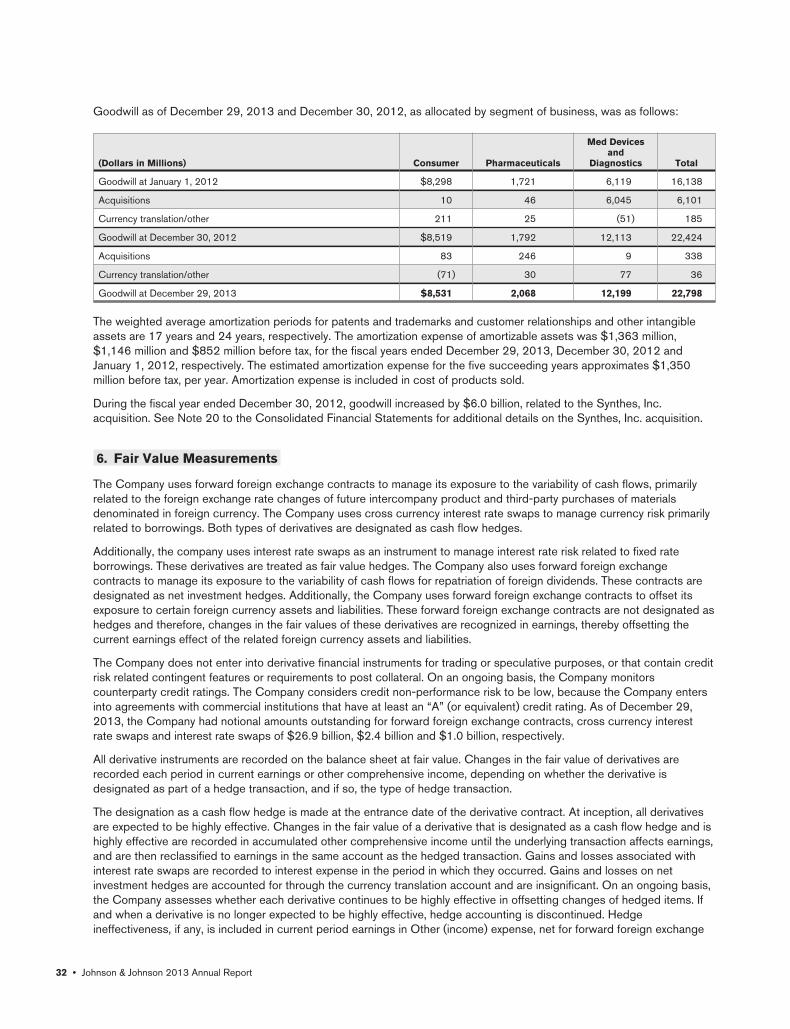
Goodwill as of December 29, 2013 and December 30, 2012, as allocated by segment of business, was as follows:
(Dollars in Millions) Consumer Pharmaceuticals
Med Devicesand
Diagnostics Total
Goodwill at January 1, 2012 $8,298 1,721 6,119 16,138
Acquisitions 10 46 6,045 6,101
Currency translation/other 211 25 (51) 185
Goodwill at December 30, 2012 $8,519 1,792 12,113 22,424
Acquisitions 83 246 9 338
Currency translation/other (71) 30 77 36
Goodwill at December 29, 2013 $8,531 2,068 12,199 22,798
The weighted average amortization periods for patents and trademarks and customer relationships and other intangibleassets are 17 years and 24 years, respectively. The amortization expense of amortizable assets was $1,363 million,$1,146 million and $852 million before tax, for the fiscal years ended December 29, 2013, December 30, 2012 andJanuary 1, 2012, respectively. The estimated amortization expense for the five succeeding years approximates $1,350million before tax, per year. Amortization expense is included in cost of products sold.
During the fiscal year ended December 30, 2012, goodwill increased by $6.0 billion, related to the Synthes, Inc.acquisition. See Note 20 to the Consolidated Financial Statements for additional details on the Synthes, Inc. acquisition.
6. Fair Value Measurements
The Company uses forward foreign exchange contracts to manage its exposure to the variability of cash flows, primarilyrelated to the foreign exchange rate changes of future intercompany product and third-party purchases of materialsdenominated in foreign currency. The Company uses cross currency interest rate swaps to manage currency risk primarilyrelated to borrowings. Both types of derivatives are designated as cash flow hedges.
Additionally, the company uses interest rate swaps as an instrument to manage interest rate risk related to fixed rateborrowings. These derivatives are treated as fair value hedges. The Company also uses forward foreign exchangecontracts to manage its exposure to the variability of cash flows for repatriation of foreign dividends. These contracts aredesignated as net investment hedges. Additionally, the Company uses forward foreign exchange contracts to offset itsexposure to certain foreign currency assets and liabilities. These forward foreign exchange contracts are not designated ashedges and therefore, changes in the fair values of these derivatives are recognized in earnings, thereby offsetting thecurrent earnings effect of the related foreign currency assets and liabilities.
The Company does not enter into derivative financial instruments for trading or speculative purposes, or that contain creditrisk related contingent features or requirements to post collateral. On an ongoing basis, the Company monitorscounterparty credit ratings. The Company considers credit non-performance risk to be low, because the Company entersinto agreements with commercial institutions that have at least an “A” (or equivalent) credit rating. As of December 29,2013, the Company had notional amounts outstanding for forward foreign exchange contracts, cross currency interestrate swaps and interest rate swaps of $26.9 billion, $2.4 billion and $1.0 billion, respectively.
All derivative instruments are recorded on the balance sheet at fair value. Changes in the fair value of derivatives arerecorded each period in current earnings or other comprehensive income, depending on whether the derivative isdesignated as part of a hedge transaction, and if so, the type of hedge transaction.
The designation as a cash flow hedge is made at the entrance date of the derivative contract. At inception, all derivativesare expected to be highly effective. Changes in the fair value of a derivative that is designated as a cash flow hedge and ishighly effective are recorded in accumulated other comprehensive income until the underlying transaction affects earnings,and are then reclassified to earnings in the same account as the hedged transaction. Gains and losses associated withinterest rate swaps are recorded to interest expense in the period in which they occurred. Gains and losses on netinvestment hedges are accounted for through the currency translation account and are insignificant. On an ongoing basis,the Company assesses whether each derivative continues to be highly effective in offsetting changes of hedged items. Ifand when a derivative is no longer expected to be highly effective, hedge accounting is discontinued. Hedgeineffectiveness, if any, is included in current period earnings in Other (income) expense, net for forward foreign exchange
32 • Johnson & Johnson 2013 Annual Report

contracts and cross currency interest rate swaps. For interest rate swaps designated as fair value hedges, hedgeineffectiveness, if any, is included in current period earnings within interest expense. For the current reporting period,hedge ineffectiveness associated with interest rate swaps are not material.
As of December 29, 2013, the balance of deferred net gains on derivatives included in accumulated other comprehensiveincome was $245 million after-tax. For additional information, see the Consolidated Statements of Comprehensive Incomeand Note 13. The Company expects that substantially all of the amounts related to forward foreign exchange contracts willbe reclassified into earnings over the next 12 months as a result of transactions that are expected to occur over thatperiod. The maximum length of time over which the Company is hedging transaction exposure is 18 months, excludinginterest rate contracts. The amount ultimately realized in earnings will differ as foreign exchange rates change. Realizedgains and losses are ultimately determined by actual exchange rates at maturity of the derivative.
The following table is a summary of the activity related to derivatives designated as cash flow hedges for the fiscal yearsended December 29, 2013 and December 30, 2012:
(Dollars in Millions)
Gain/(Loss)Recognized in
Accumulated OCI(1)
Gain/(Loss)Reclassified fromAccumulated OCI
Into Income(1)
Gain/(Loss)Recognized in
OtherIncome/Expense(2)
Cash Flow Hedges by Income Statement Caption 2013 2012 2013 2012 2013 2012
Sales to customers(3) $45 45 49 (58) 2 (1)
Cost of products sold(3) 271 103 69 (98) 23 (4)
Research and development expense(3) 24 (42) 16 19 (4) (1)
Interest (income)/Interest expense, net(4) 17 11 (10) (16) – –
Other (income) expense, net(3) (13) (65) (17) 29 (4) –
Total $344 52 107 (124) 17 (6)
All amounts shown in the table above are net of tax.
(1) Effective portion
(2) Ineffective portion
(3) Forward foreign exchange contracts
(4) Cross currency interest rate swaps
For the fiscal years ended December 29, 2013 and December 30, 2012, a gain of $32 million and a gain of $48 million,respectively, was recognized in Other (income) expense, net, relating to forward foreign exchange contracts notdesignated as hedging instruments.
Fair value is the exit price that would be received to sell an asset or paid to transfer a liability. Fair value is a market-basedmeasurement determined using assumptions that market participants would use in pricing an asset or liability. Theauthoritative literature establishes a three-level hierarchy to prioritize the inputs used in measuring fair value. The levelswithin the hierarchy are described below with Level 1 having the highest priority and Level 3 having the lowest.
The fair value of a derivative financial instrument (i.e., forward foreign exchange contracts, interest rate contracts) is theaggregation by currency of all future cash flows discounted to its present value at the prevailing market interest rates andsubsequently converted to the U.S. Dollar at the current spot foreign exchange rate. The Company does not believe thatfair values of these derivative instruments materially differ from the amounts that could be realized upon settlement ormaturity, or that the changes in fair value will have a material effect on the Company’s results of operations, cash flows orfinancial position. The Company also holds equity investments which are classified as Level 1 because they are traded inan active exchange market. The Company did not have any other significant financial assets or liabilities which wouldrequire revised valuations under this standard that are recognized at fair value.
The following three levels of inputs are used to measure fair value:
Level 1 — Quoted prices in active markets for identical assets and liabilities.
Level 2 — Significant other observable inputs.
Level 3 — Significant unobservable inputs.
Johnson & Johnson 2013 Annual Report • 33
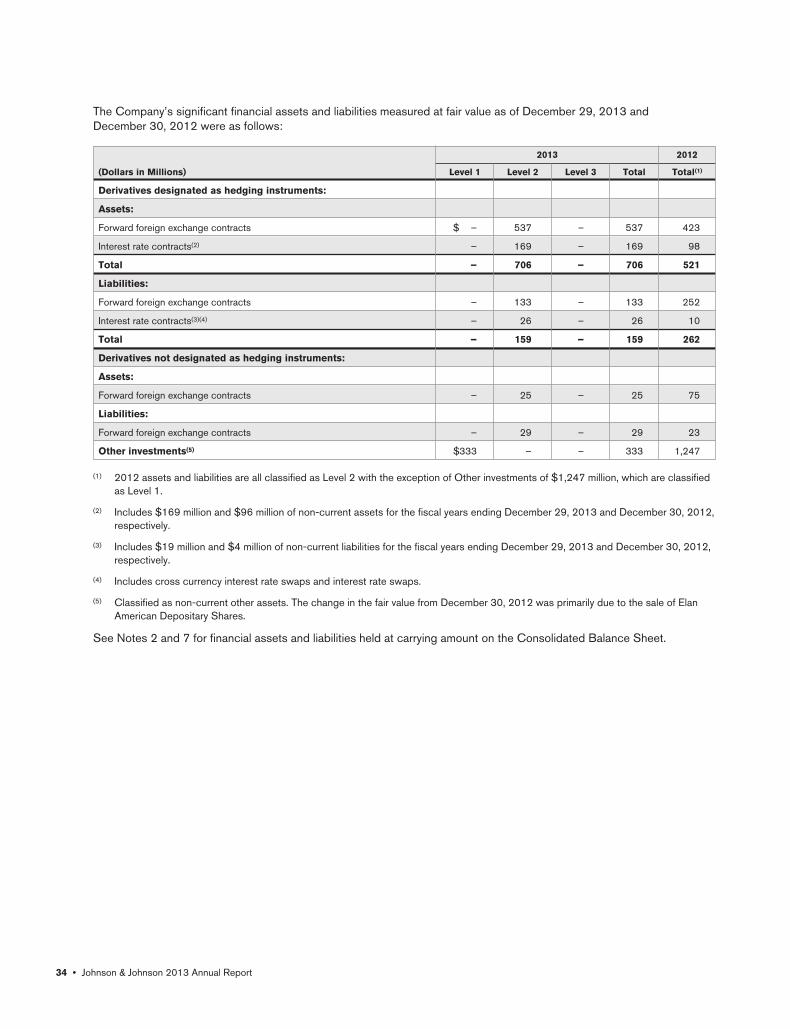
The Company’s significant financial assets and liabilities measured at fair value as of December 29, 2013 andDecember 30, 2012 were as follows:
2013 2012
(Dollars in Millions) Level 1 Level 2 Level 3 Total Total(1)
Derivatives designated as hedging instruments:
Assets:
Forward foreign exchange contracts $ – 537 – 537 423
Interest rate contracts(2) – 169 – 169 98
Total – 706 – 706 521
Liabilities:
Forward foreign exchange contracts – 133 – 133 252
Interest rate contracts(3)(4) – 26 – 26 10
Total – 159 – 159 262
Derivatives not designated as hedging instruments:
Assets:
Forward foreign exchange contracts – 25 – 25 75
Liabilities:
Forward foreign exchange contracts – 29 – 29 23
Other investments(5) $333 – – 333 1,247
(1) 2012 assets and liabilities are all classified as Level 2 with the exception of Other investments of $1,247 million, which are classifiedas Level 1.
(2) Includes $169 million and $96 million of non-current assets for the fiscal years ending December 29, 2013 and December 30, 2012,respectively.
(3) Includes $19 million and $4 million of non-current liabilities for the fiscal years ending December 29, 2013 and December 30, 2012,respectively.
(4) Includes cross currency interest rate swaps and interest rate swaps.
(5) Classified as non-current other assets. The change in the fair value from December 30, 2012 was primarily due to the sale of ElanAmerican Depositary Shares.
See Notes 2 and 7 for financial assets and liabilities held at carrying amount on the Consolidated Balance Sheet.
34 • Johnson & Johnson 2013 Annual Report

7. Borrowings
The components of long-term debt are as follows:
(Dollars in Millions) 2013EffectiveRate % 2012
EffectiveRate %
0.70% Notes due 2013 $ – –% 500 0.75
3.80% Debentures due 2013 – – 500 3.82
3 month LIBOR+0% FRN due 2013 – – 500 0.31
3 month LIBOR+0.09% FRN due 2014 750 0.33 750 0.40
1.20% Notes due 2014 999 1.24 999 1.24
2.15% Notes due 2016 898 2.22 898 2.22
3 month LIBOR+0.07% FRN due 2016 800 0.31 – –
0.70% Notes due 2016 397 0.74 – –
5.55% Debentures due 2017 1,000 5.55 1,000 5.55
5.15% Debentures due 2018 898 5.15 898 5.15
1.65% Notes due 2018 589 1.70 – –
4.75% Notes due 2019 (1B Euro 1.3683)(2)/(1B Euro 1.3275)(3) 1,363(2) 5.83 1,321(3) 5.83
3% Zero Coupon Convertible Subordinated Debentures due 2020 179 3.00 205 3.00
2.95% Debentures due 2020 542 3.15 542 3.15
3.55% Notes due 2021 446 3.67 446 3.67
6.73% Debentures due 2023 250 6.73 250 6.73
3.375% Notes due 2023 550 3.38 – –
5.50% Notes due 2024 (500MM GBP 1.6414)(2)/(500MM GBP 1.6169)(3) 816(2) 6.75 803(3) 6.75
6.95% Notes due 2029 296 7.14 296 7.14
4.95% Debentures due 2033 500 4.95 500 4.95
4.375% Notes due 2033 646 4.42 – –
5.95% Notes due 2037 995 5.99 995 5.99
5.85% Debentures due 2038 700 5.86 700 5.86
4.50% Debentures due 2040 539 4.63 539 4.63
4.85% Notes due 2041 298 4.89 298 4.89
4.50% Notes due 2043 499 4.52 – –
Other 147 – 61 –
15,097(4) 4.00(1) 13,001(4) 4.14(1)
Less current portion 1,769 1,512
$13,328 11,489
(1) Weighted average effective rate.(2) Translation rate at December 29, 2013.(3) Translation rate at December 30, 2012.(4) The excess of the fair value over the carrying value of debt was $1.4 billion in 2013 and $2.2 billion in 2012.
Fair value of the non-current debt was estimated using market prices, which were corroborated by quoted broker pricesand significant other observable inputs.
The Company has access to substantial sources of funds at numerous banks worldwide. In September 2013, theCompany secured a new 364-day Credit Facility. Total credit available to the Company approximates $10 billion, whichexpires on September 18, 2014. Interest charged on borrowings under the credit line agreements is based on either bidsprovided by banks, the prime rate or London Interbank Offered Rates (LIBOR), plus applicable margins. Commitment feesunder the agreements are not material.
Johnson & Johnson 2013 Annual Report • 35

Throughout 2013, the Company continued to have access to liquidity through the commercial paper market. Short-termborrowings and the current portion of long-term debt amounted to approximately $4.9 billion at the end of 2013, of which$2.5 billion was borrowed under the Commercial Paper Program. The remainder principally represents local borrowing byinternational subsidiaries.
The Company has a shelf registration with the U.S. Securities and Exchange Commission that enables the Company toissue debt securities and warrants to purchase debt securities on a timely basis. The Company issued bonds in December2013 for a total of $3.5 billion for general corporate purposes.
Aggregate maturities of long-term obligations commencing in 2014 are:
(Dollars in Millions)
2014 2015 2016 2017 2018After2018
$1,769 76 2,096 1,007 1,526 8,623
8. Income Taxes
The provision for taxes on income consists of:
(Dollars in Millions) 2013 2012 2011
Currently payable:
U.S. taxes $594 2,023 2,392
International taxes 1,653 1,277 1,133
Total currently payable 2,247 3,300 3,525
Deferred:
U.S. taxes (251) (120) (690)
International taxes (356) 81 (146)
Total deferred (607) (39) (836)
Provision for taxes on income $1,640 3,261 2,689
A comparison of income tax expense at the U.S. statutory rate of 35% in 2013, 2012 and 2011, to the Company’seffective tax rate is as follows:
(Dollars in Millions) 2013 2012 2011
U.S. $4,261 4,664 3,634
International 11,210 9,111 8,727
Earnings before taxes on income: $15,471 13,775 12,361
Tax rates:
U.S. statutory rate 35.0% 35.0 35.0
International operations excluding Ireland (10.6) (9.8) (14.0)
Ireland and Puerto Rico operations (9.0) (3.9) (1.8)
Research and orphan drug tax credits (0.8) – (0.8)
U.S. state and local 0.4 1.3 2.1
U.S. manufacturing deduction (0.8) (0.9) (0.8)
U.S. tax on international income 1.7 1.1 (0.4)
U.S. tax benefit on asset write-offs (5.1) – –
All other (0.2) 0.9 2.5
Effective tax rate 10.6% 23.7 21.8
36 • Johnson & Johnson 2013 Annual Report

The decrease in the 2013 effective tax rate as compared to 2012 was attributable to a tax benefit associated with thewrite-off of assets for tax purposes associated with Scios Inc., increased taxable income in lower tax jurisdictions relativeto higher tax jurisdictions and the inclusion of two years of benefit of the U.S. Research and Development (R&D) tax creditand the Controlled Foreign Corporation (CFC) look-through provisions. The R&D tax credit and the CFC look-throughprovisions were enacted into law in January 2013 and were retroactive to January 1, 2012.
During 2013, the Company reached a settlement agreement related to certain issues regarding the U.S. Internal RevenueService (IRS) audit related to tax years 2006-2009. As a result of this settlement, the Company adjusted the unrecognizedtax benefits relating to these matters which lowered tax expense. In addition, the Company recorded additional U.S. taxexpense related to increased dividends of foreign earnings. The above items resulted in a net gain of $180 million. Alsoincluded in the 2013 results were incremental tax expenses associated with the establishment of a valuation allowance of$187 million related to the Company’s Belgian foreign affiliate.
The increase in the 2012 effective tax rate as compared to 2011 was due to lower tax benefits on the impairment of in-process research and development intangible assets in low tax jurisdictions, increases in taxable income in higher taxjurisdictions relative to lower tax jurisdictions and the exclusion of the benefit of the U.S. R&D tax credit and the CFC look-through provisions from the 2012 fiscal year financial results.
Temporary differences and carryforwards for 2013 and 2012 were as follows:
2013Deferred Tax
2012Deferred Tax
(Dollars in Millions) Asset Liability Asset Liability
Employee related obligations $1,908 3,343
Stock based compensation 1,121 1,199
Depreciation (772) (933)
Non-deductible intangibles (6,250) (6,261)
International R&D capitalized for tax 1,656 1,599
Reserves & liabilities 1,587 1,908
Income reported for tax purposes 1,043 726
Net operating loss carryforward international 1,090 1,117
Miscellaneous international(1) 1,508 (361) 1,291 (371)
Miscellaneous U.S. 927 915
Total deferred income taxes $10,840 (7,383) 12,098 (7,565)
(1) The $1,508 million is net of a valuation allowance related to Belgium of $187 million.
The difference between the net deferred tax on income per the balance sheet and the net deferred tax above is included intaxes on income on the balance sheet. The Company has wholly-owned international subsidiaries that have cumulative netlosses. The Company believes that it is more likely than not that these subsidiaries will realize future taxable incomesufficient to utilize these deferred tax assets.
The following table summarizes the activity related to unrecognized tax benefits:
(Dollars in Millions) 2013 2012 2011
Beginning of year $3,054 2,699 2,307
Increases related to current year tax positions 643 538 402
Increases related to prior period tax positions 80 57 87
Decreases related to prior period tax positions (574) (41) (77)
Settlements (418) (120) (16)
Lapse of statute of limitations (56) (79) (4)
End of year $2,729 3,054 2,699
Johnson & Johnson 2013 Annual Report • 37
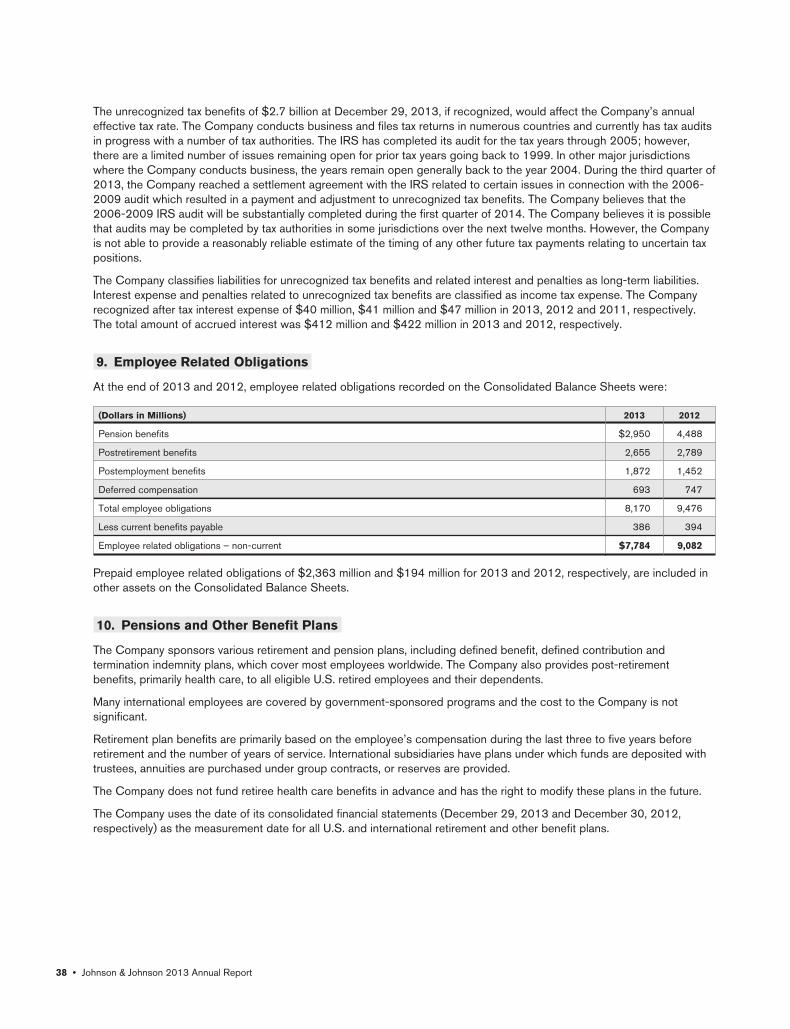
The unrecognized tax benefits of $2.7 billion at December 29, 2013, if recognized, would affect the Company’s annualeffective tax rate. The Company conducts business and files tax returns in numerous countries and currently has tax auditsin progress with a number of tax authorities. The IRS has completed its audit for the tax years through 2005; however,there are a limited number of issues remaining open for prior tax years going back to 1999. In other major jurisdictionswhere the Company conducts business, the years remain open generally back to the year 2004. During the third quarter of2013, the Company reached a settlement agreement with the IRS related to certain issues in connection with the 2006-2009 audit which resulted in a payment and adjustment to unrecognized tax benefits. The Company believes that the2006-2009 IRS audit will be substantially completed during the first quarter of 2014. The Company believes it is possiblethat audits may be completed by tax authorities in some jurisdictions over the next twelve months. However, the Companyis not able to provide a reasonably reliable estimate of the timing of any other future tax payments relating to uncertain taxpositions.
The Company classifies liabilities for unrecognized tax benefits and related interest and penalties as long-term liabilities.Interest expense and penalties related to unrecognized tax benefits are classified as income tax expense. The Companyrecognized after tax interest expense of $40 million, $41 million and $47 million in 2013, 2012 and 2011, respectively.The total amount of accrued interest was $412 million and $422 million in 2013 and 2012, respectively.
9. Employee Related Obligations
At the end of 2013 and 2012, employee related obligations recorded on the Consolidated Balance Sheets were:
(Dollars in Millions) 2013 2012
Pension benefits $2,950 4,488
Postretirement benefits 2,655 2,789
Postemployment benefits 1,872 1,452
Deferred compensation 693 747
Total employee obligations 8,170 9,476
Less current benefits payable 386 394
Employee related obligations – non-current $7,784 9,082
Prepaid employee related obligations of $2,363 million and $194 million for 2013 and 2012, respectively, are included inother assets on the Consolidated Balance Sheets.
10. Pensions and Other Benefit Plans
The Company sponsors various retirement and pension plans, including defined benefit, defined contribution andtermination indemnity plans, which cover most employees worldwide. The Company also provides post-retirementbenefits, primarily health care, to all eligible U.S. retired employees and their dependents.
Many international employees are covered by government-sponsored programs and the cost to the Company is notsignificant.
Retirement plan benefits are primarily based on the employee’s compensation during the last three to five years beforeretirement and the number of years of service. International subsidiaries have plans under which funds are deposited withtrustees, annuities are purchased under group contracts, or reserves are provided.
The Company does not fund retiree health care benefits in advance and has the right to modify these plans in the future.
The Company uses the date of its consolidated financial statements (December 29, 2013 and December 30, 2012,respectively) as the measurement date for all U.S. and international retirement and other benefit plans.
38 • Johnson & Johnson 2013 Annual Report
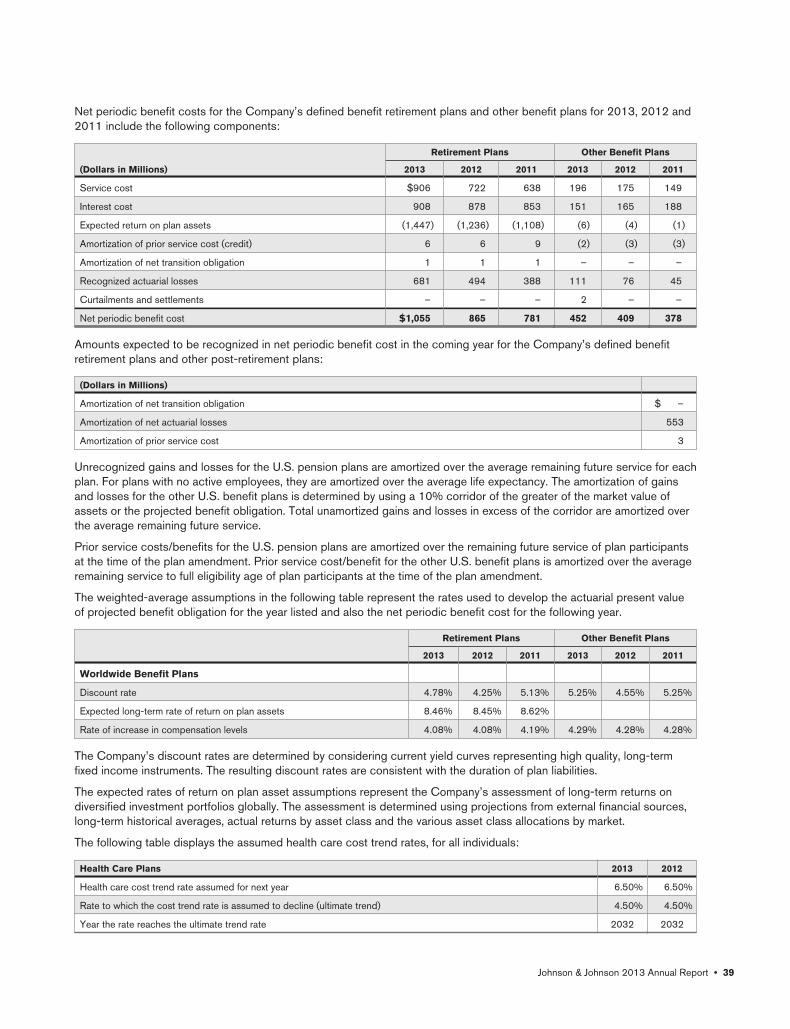
Net periodic benefit costs for the Company’s defined benefit retirement plans and other benefit plans for 2013, 2012 and2011 include the following components:
Retirement Plans Other Benefit Plans
(Dollars in Millions) 2013 2012 2011 2013 2012 2011
Service cost $906 722 638 196 175 149
Interest cost 908 878 853 151 165 188
Expected return on plan assets (1,447) (1,236) (1,108) (6) (4) (1)
Amortization of prior service cost (credit) 6 6 9 (2) (3) (3)
Amortization of net transition obligation 1 1 1 – – –
Recognized actuarial losses 681 494 388 111 76 45
Curtailments and settlements – – – 2 – –
Net periodic benefit cost $1,055 865 781 452 409 378
Amounts expected to be recognized in net periodic benefit cost in the coming year for the Company’s defined benefitretirement plans and other post-retirement plans:
(Dollars in Millions)
Amortization of net transition obligation $ –
Amortization of net actuarial losses 553
Amortization of prior service cost 3
Unrecognized gains and losses for the U.S. pension plans are amortized over the average remaining future service for eachplan. For plans with no active employees, they are amortized over the average life expectancy. The amortization of gainsand losses for the other U.S. benefit plans is determined by using a 10% corridor of the greater of the market value ofassets or the projected benefit obligation. Total unamortized gains and losses in excess of the corridor are amortized overthe average remaining future service.
Prior service costs/benefits for the U.S. pension plans are amortized over the remaining future service of plan participantsat the time of the plan amendment. Prior service cost/benefit for the other U.S. benefit plans is amortized over the averageremaining service to full eligibility age of plan participants at the time of the plan amendment.
The weighted-average assumptions in the following table represent the rates used to develop the actuarial present valueof projected benefit obligation for the year listed and also the net periodic benefit cost for the following year.
Retirement Plans Other Benefit Plans
2013 2012 2011 2013 2012 2011
Worldwide Benefit Plans
Discount rate 4.78% 4.25% 5.13% 5.25% 4.55% 5.25%
Expected long-term rate of return on plan assets 8.46% 8.45% 8.62%
Rate of increase in compensation levels 4.08% 4.08% 4.19% 4.29% 4.28% 4.28%
The Company’s discount rates are determined by considering current yield curves representing high quality, long-termfixed income instruments. The resulting discount rates are consistent with the duration of plan liabilities.
The expected rates of return on plan asset assumptions represent the Company’s assessment of long-term returns ondiversified investment portfolios globally. The assessment is determined using projections from external financial sources,long-term historical averages, actual returns by asset class and the various asset class allocations by market.
The following table displays the assumed health care cost trend rates, for all individuals:
Health Care Plans 2013 2012
Health care cost trend rate assumed for next year 6.50% 6.50%
Rate to which the cost trend rate is assumed to decline (ultimate trend) 4.50% 4.50%
Year the rate reaches the ultimate trend rate 2032 2032
Johnson & Johnson 2013 Annual Report • 39

A one-percentage-point change in assumed health care cost trend rates would have the following effect:
(Dollars in Millions)One-Percentage-
Point IncreaseOne-Percentage-Point Decrease
Health Care Plans
Total interest and service cost $45 $(34)
Post-retirement benefit obligation 432 (347)
The following table sets forth information related to the benefit obligation and the fair value of plan assets at year-end2013 and 2012 for the Company’s defined benefit retirement plans and other post-retirement plans:
Retirement PlansOther Benefit
Plans
(Dollars in Millions) 2013 2012 2013 2012
Change in Benefit Obligation
Projected benefit obligation – beginning of year $21,829 17,424 4,159 3,790
Service cost 906 722 196 175
Interest cost 908 878 151 165
Plan participant contributions 54 35 – –
Amendments 35 12 7 –
Actuarial (gains) losses (1,432) 2,662 296 459
Divestitures & acquisitions 8 629 – –
Curtailments, settlements & restructuring (15) (6) (11) –
Benefits paid from plan (751) (697) (373) (432)
Effect of exchange rates (54) 170 (18) 2
Projected benefit obligation – end of year $21,488 21,829 4,407 4,159
Change in Plan Assets
Plan assets at fair value – beginning of year $17,536 13,736 122 8
Actual return on plan assets 3,573 1,926 15 3
Company contributions 565 1,838 323 543
Plan participant contributions 54 35 – –
Settlements (4) (2) – –
Divestitures & acquisitions 9 593 – –
Benefits paid from plan assets (751) (697) (373) (432)
Effect of exchange rates (81) 107 – –
Plan assets at fair value – end of year $20,901 17,536 87 122
Funded status – end of year $(587) (4,293) (4,320) (4,037)
Amounts Recognized in the Company’s Balance Sheet consist of the following:
Non-current assets $2,363 194 – –
Current liabilities (71) (65) (302) (307)
Non-current liabilities (2,879) (4,422) (4,018) (3,730)
Total recognized in the consolidated balance sheet – end of year $(587) (4,293) (4,320) (4,037)
Amounts Recognized in Accumulated Other Comprehensive Income consist ofthe following:
Net actuarial loss $3,344 7,586 1,732 1,601
Prior service cost (credit) 26 9 (6) (14)
Unrecognized net transition obligation 2 2 – —
Total before tax effects $3,372 7,597 1,726 1,587
Accumulated Benefit Obligations – end of year $19,203 19,267
40 • Johnson & Johnson 2013 Annual Report

Retirement PlansOther Benefit
Plans
(Dollars in Millions) 2013 2012 2013 2012
Changes in Plan Assets and Benefit Obligations Recognized in OtherComprehensive Income
Net periodic benefit cost $1,055 865 452 409
Net actuarial (gain) loss (3,559) 2,007 248 458
Amortization of net actuarial loss (681) (494) (111) (76)
Prior service cost 34 12 8 –
Amortization of prior service (cost) credit (13) (6) – 3
Effect of exchange rates (6) 79 (6) 1
Total recognized in other comprehensive income, before tax $(4,225) 1,598 139 386
Total recognized in net periodic benefit cost and other comprehensive income $(3,170) 2,463 591 795
The Company plans to continue to fund its U.S. Qualified Plans to comply with the Pension Protection Act of 2006.International Plans are funded in accordance with local regulations. Additional discretionary contributions are made whendeemed appropriate to meet the long-term obligations of the plans. For certain plans, funding is not a common practice, asfunding provides no economic benefit. Consequently, the Company has several pension plans that are not funded.
In 2013, the Company contributed $58 million and $507 million to its U.S. and international pension plans, respectively.
The following table displays the funded status of the Company’s U.S. Qualified & Non-Qualified pension plans andinternational funded and unfunded pension plans at December 29, 2013 and December 30, 2012, respectively:
U.S. Plans International Plans
Qualified Plans Non-Qualified Plans Funded Plans Unfunded Plans
(Dollars in Millions) 2013 2012 2013 2012 2013 2012 2013 2012
Plan Assets $13,990 11,464 – – 6,911 6,072 – –
Projected Benefit Obligation 11,921 12,420 1,296 1,343 7,797 7,586 474 480
Accumulated Benefit Obligation 10,745 11,001 1,065 1,070 6,974 6,774 419 422
Over (Under) Funded Status
Projected Benefit Obligation $2,069 (956) (1,296) (1,343) (886) (1,514) (474) (480)
Accumulated Benefit Obligation 3,245 463 (1,065) (1,070) (63) (702) (419) (422)
Plans with accumulated benefit obligations in excess of plan assets have an accumulated benefit obligation, projectedbenefit obligation and plan assets of $5.4 billion, $5.8 billion and $3.3 billion, respectively, at the end of 2013, and $6.5billion, $7.4 billion and $4.0 billion, respectively, at the end of 2012.
The following table displays the projected future benefit payments from the Company’s retirement and other benefit plans:
(Dollars in Millions) 2014 2015 2016 2017 2018 2019-2023
Projected future benefit payments
Retirement plans $778 794 840 890 933 6,071
Other benefit plans $313 309 305 302 299 1,469
The following table displays the projected future minimum contributions to the unfunded retirement plans. These amountsdo not include any discretionary contributions that the Company may elect to make in the future.
(Dollars in Millions) 2014 2015 2016 2017 2018 2019-2023
Projected future contributions $74 73 78 95 89 524
Each pension plan is overseen by a local committee or board that is responsible for the overall administration andinvestment of the pension plans. In determining investment policies, strategies and goals, each committee or boardconsiders factors including, local pension rules and regulations; local tax regulations; availability of investment vehicles(separate accounts, commingled accounts, insurance funds, etc.); funded status of the plans; ratio of actives to retirees;
Johnson & Johnson 2013 Annual Report • 41

duration of liabilities; and other relevant factors including: diversification, liquidity of local markets and liquidity of basecurrency. A majority of the Company’s pension funds are open to new entrants and are expected to be on-going plans.Permitted investments are primarily liquid and/or listed, with little reliance on illiquid and non-traditional investments suchas hedge funds.
The Company’s retirement plan asset allocation at the end of 2013 and 2012 and target allocations for 2014 are asfollows:
Percent ofPlan Assets
TargetAllocation
2013 2012 2014
Worldwide Retirement Plans
Equity securities 76% 75% 71%
Debt securities 24 25 29
Total plan assets 100% 100% 100%
Determination of Fair Value of Plan Assets
The Plan has an established and well-documented process for determining fair values. Fair value is based upon quotedmarket prices, where available. If listed prices or quotes are not available, fair value is based upon models that primarilyuse, as inputs, market-based or independently sourced market parameters, including yield curves, interest rates, volatilities,equity or debt prices, foreign exchange rates and credit curves.
While the Plan believes its valuation methods are appropriate and consistent with other market participants, the use ofdifferent methodologies or assumptions to determine the fair value of certain financial instruments could result in a differentestimate of fair value at the reporting date.
Valuation Hierarchy
The authoritative literature establishes a three-level hierarchy to prioritize the inputs used in measuring fair value. The levelswithin the hierarchy are described in the table below with Level 1 having the highest priority and Level 3 having the lowest.
A financial instrument’s categorization within the valuation hierarchy is based upon the lowest level of input that issignificant to the fair value measurement.
Following is a description of the valuation methodologies used for the investments measured at fair value.
• Short-term investments – Cash and quoted short-term instruments are valued at the closing price or the amount heldon deposit by the custodian bank. Other investments are through investment vehicles valued using the Net Asset Value(NAV) provided by the administrator of the fund. The NAV is based on the value of the underlying assets owned by thefund, minus its liabilities, and then divided by the number of shares outstanding. The NAV is a quoted price in a marketthat is not active and classified as Level 2.
• Government and agency securities – A limited number of these investments are valued at the closing price reported onthe major market on which the individual securities are traded. Where quoted prices are available in an active market,the investments are classified within Level 1 of the valuation hierarchy. If quoted market prices are not available for thespecific security, then fair values are estimated by using pricing models, quoted prices of securities with similarcharacteristics or discounted cash flows. When quoted market prices for a security are not available in an active market,they are classified as Level 2.
• Debt instruments – A limited number of these investments are valued at the closing price reported on the major marketon which the individual securities are traded. Where quoted prices are available in an active market, the investments areclassified as Level 1. If quoted market prices are not available for the specific security, then fair values are estimated byusing pricing models, quoted prices of securities with similar characteristics or discounted cash flows and are classifiedas Level 2. Level 3 debt instruments are priced based on unobservable inputs.
• Equity securities – Common stocks are valued at the closing price reported on the major market on which the individualsecurities are traded. Substantially all common stock is classified within Level 1 of the valuation hierarchy.
• Commingled funds – These investment vehicles are valued using the NAV provided by the fund administrator. The NAVis based on the value of the underlying assets owned by the fund, minus its liabilities, and then divided by the number ofshares outstanding. Assets in the Level 2 category have a quoted market price in a market that is not active.
42 • Johnson & Johnson 2013 Annual Report
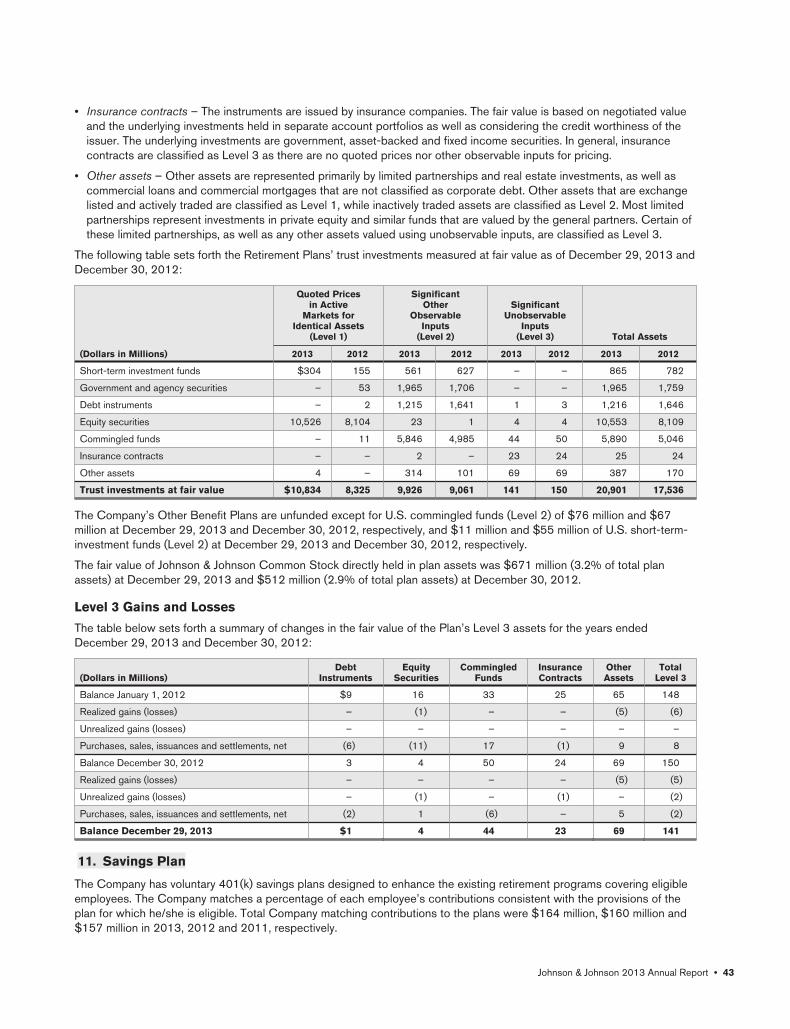
• Insurance contracts – The instruments are issued by insurance companies. The fair value is based on negotiated valueand the underlying investments held in separate account portfolios as well as considering the credit worthiness of theissuer. The underlying investments are government, asset-backed and fixed income securities. In general, insurancecontracts are classified as Level 3 as there are no quoted prices nor other observable inputs for pricing.
• Other assets – Other assets are represented primarily by limited partnerships and real estate investments, as well ascommercial loans and commercial mortgages that are not classified as corporate debt. Other assets that are exchangelisted and actively traded are classified as Level 1, while inactively traded assets are classified as Level 2. Most limitedpartnerships represent investments in private equity and similar funds that are valued by the general partners. Certain ofthese limited partnerships, as well as any other assets valued using unobservable inputs, are classified as Level 3.
The following table sets forth the Retirement Plans’ trust investments measured at fair value as of December 29, 2013 andDecember 30, 2012:
Quoted Pricesin Active
Markets forIdentical Assets
(Level 1)
SignificantOther
ObservableInputs
(Level 2)
SignificantUnobservable
Inputs(Level 3) Total Assets
(Dollars in Millions) 2013 2012 2013 2012 2013 2012 2013 2012
Short-term investment funds $304 155 561 627 – – 865 782
Government and agency securities – 53 1,965 1,706 – – 1,965 1,759
Debt instruments – 2 1,215 1,641 1 3 1,216 1,646
Equity securities 10,526 8,104 23 1 4 4 10,553 8,109
Commingled funds – 11 5,846 4,985 44 50 5,890 5,046
Insurance contracts – – 2 – 23 24 25 24
Other assets 4 – 314 101 69 69 387 170
Trust investments at fair value $10,834 8,325 9,926 9,061 141 150 20,901 17,536
The Company’s Other Benefit Plans are unfunded except for U.S. commingled funds (Level 2) of $76 million and $67million at December 29, 2013 and December 30, 2012, respectively, and $11 million and $55 million of U.S. short-term-investment funds (Level 2) at December 29, 2013 and December 30, 2012, respectively.
The fair value of Johnson & Johnson Common Stock directly held in plan assets was $671 million (3.2% of total planassets) at December 29, 2013 and $512 million (2.9% of total plan assets) at December 30, 2012.
Level 3 Gains and Losses
The table below sets forth a summary of changes in the fair value of the Plan’s Level 3 assets for the years endedDecember 29, 2013 and December 30, 2012:
(Dollars in Millions)Debt
InstrumentsEquity
SecuritiesCommingled
FundsInsuranceContracts
OtherAssets
TotalLevel 3
Balance January 1, 2012 $9 16 33 25 65 148
Realized gains (losses) – (1) – – (5) (6)
Unrealized gains (losses) – – – – – –
Purchases, sales, issuances and settlements, net (6) (11) 17 (1) 9 8
Balance December 30, 2012 3 4 50 24 69 150
Realized gains (losses) – – – – (5) (5)
Unrealized gains (losses) – (1) – (1) – (2)
Purchases, sales, issuances and settlements, net (2) 1 (6) – 5 (2)
Balance December 29, 2013 $1 4 44 23 69 141
11. Savings Plan
The Company has voluntary 401(k) savings plans designed to enhance the existing retirement programs covering eligibleemployees. The Company matches a percentage of each employee’s contributions consistent with the provisions of theplan for which he/she is eligible. Total Company matching contributions to the plans were $164 million, $160 million and$157 million in 2013, 2012 and 2011, respectively.
Johnson & Johnson 2013 Annual Report • 43
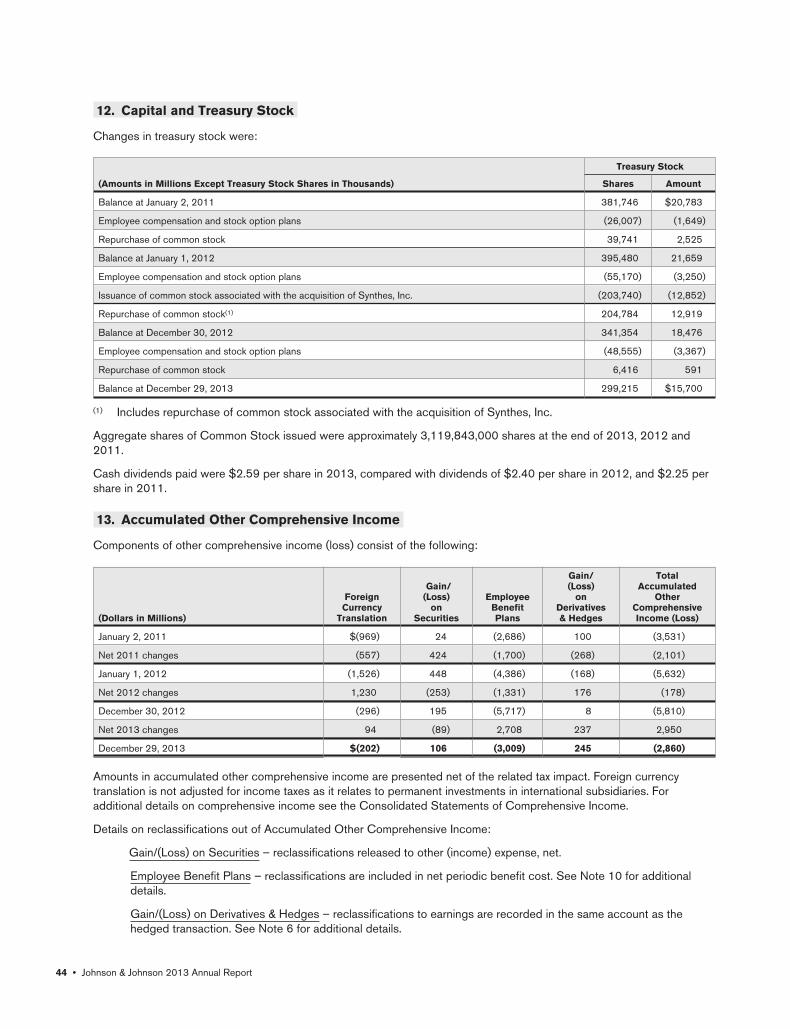
12. Capital and Treasury Stock
Changes in treasury stock were:
Treasury Stock
(Amounts in Millions Except Treasury Stock Shares in Thousands) Shares Amount
Balance at January 2, 2011 381,746 $20,783
Employee compensation and stock option plans (26,007) (1,649)
Repurchase of common stock 39,741 2,525
Balance at January 1, 2012 395,480 21,659
Employee compensation and stock option plans (55,170) (3,250)
Issuance of common stock associated with the acquisition of Synthes, Inc. (203,740) (12,852)
Repurchase of common stock(1) 204,784 12,919
Balance at December 30, 2012 341,354 18,476
Employee compensation and stock option plans (48,555) (3,367)
Repurchase of common stock 6,416 591
Balance at December 29, 2013 299,215 $15,700
(1) Includes repurchase of common stock associated with the acquisition of Synthes, Inc.
Aggregate shares of Common Stock issued were approximately 3,119,843,000 shares at the end of 2013, 2012 and2011.
Cash dividends paid were $2.59 per share in 2013, compared with dividends of $2.40 per share in 2012, and $2.25 pershare in 2011.
13. Accumulated Other Comprehensive Income
Components of other comprehensive income (loss) consist of the following:
(Dollars in Millions)
ForeignCurrency
Translation
Gain/(Loss)
onSecurities
EmployeeBenefitPlans
Gain/(Loss)
onDerivatives& Hedges
TotalAccumulated
OtherComprehensiveIncome (Loss)
January 2, 2011 $(969) 24 (2,686) 100 (3,531)
Net 2011 changes (557) 424 (1,700) (268) (2,101)
January 1, 2012 (1,526) 448 (4,386) (168) (5,632)
Net 2012 changes 1,230 (253) (1,331) 176 (178)
December 30, 2012 (296) 195 (5,717) 8 (5,810)
Net 2013 changes 94 (89) 2,708 237 2,950
December 29, 2013 $(202) 106 (3,009) 245 (2,860)
Amounts in accumulated other comprehensive income are presented net of the related tax impact. Foreign currencytranslation is not adjusted for income taxes as it relates to permanent investments in international subsidiaries. Foradditional details on comprehensive income see the Consolidated Statements of Comprehensive Income.
Details on reclassifications out of Accumulated Other Comprehensive Income:
Gain/(Loss) on Securities – reclassifications released to other (income) expense, net.
Employee Benefit Plans – reclassifications are included in net periodic benefit cost. See Note 10 for additionaldetails.
Gain/(Loss) on Derivatives & Hedges – reclassifications to earnings are recorded in the same account as thehedged transaction. See Note 6 for additional details.
44 • Johnson & Johnson 2013 Annual Report

14. International Currency Translation
For translation of its subsidiaries operating in non-U.S. Dollar currencies, the Company has determined that the localcurrencies of its international subsidiaries are the functional currencies except those in highly inflationary economies, whichare defined as those which have had compound cumulative rates of inflation of 100% or more during the past three years,or where a substantial portion of its cash flows are not in the local currency.
In consolidating international subsidiaries, balance sheet currency effects are recorded as a component of accumulatedother comprehensive income. This equity account includes the results of translating certain balance sheet assets andliabilities at current exchange rates and some accounts at historical rates, except for those located in highly inflationaryeconomies. The translation of balance sheet accounts for highly inflationary economies are reflected in the operatingresults.
A rollforward of the changes during 2013, 2012 and 2011 for foreign currency translation adjustments is included inNote 13.
Net currency transaction gains and losses included in Other (income) expense were losses of $186 million, $58 millionand $10 million in 2013, 2012 and 2011, respectively.
15. Earnings Per Share
The following is a reconciliation of basic net earnings per share to diluted net earnings per share for the fiscal years endedDecember 29, 2013, December 30, 2012 and January 1, 2012:
(In Millions Except Per Share Amounts) 2013 2012 2011
Basic net earnings per share attributable to Johnson & Johnson $4.92 3.94 3.54
Average shares outstanding – basic 2,809.2 2,753.3 2,736.0
Potential shares exercisable under stock option plans 148.5 164.6 158.3
Less: shares repurchased under treasury stock method (103.3) (128.2) (122.6)
Convertible debt shares 3.0 3.6 3.6
Accelerated share repurchase program 19.6 19.3 –
Adjusted average shares outstanding – diluted 2,877.0 2,812.6 2,775.3
Diluted net earnings per share attributable to Johnson & Johnson $4.81 3.86 3.49
The diluted net earnings per share calculation included the dilutive effect of convertible debt that is offset by the relatedreduction in interest expense of $4 million after-tax for years 2013, 2012 and 2011.
The diluted earnings per share calculation for 2013 included all shares related to stock options, as the exercise price of alloptions was less than the average market value of the Company’s stock. Diluted net earnings per share for 2012 and2011 excluded 0.2 million and 50.7 million shares, respectively, related to stock options, as the exercise price of theseoptions was greater than their average market value, which would result in an anti-dilutive effect on diluted earnings pershare.
The diluted earnings per share calculation for the fiscal years ended December 29, 2013 and December 30, 2012included the dilutive effect of 19.6 million shares and 19.3 million shares, respectively, related to the accelerated sharerepurchase program, associated with the acquisition of Synthes, Inc. See Note 20 to the Consolidated FinancialStatements for additional details.
16. Rental Expense and Lease Commitments
Rentals of space, vehicles, manufacturing equipment and office and data processing equipment under operating leaseswere approximately $363 million, $375 million and $313 million in 2013, 2012 and 2011, respectively.
The approximate minimum rental payments required under operating leases that have initial or remaining non-cancelablelease terms in excess of one year at December 29, 2013 are:
(Dollars in Millions)
2014 2015 2016 2017 2018After2018 Total
$286 238 186 110 85 87 992
Commitments under capital leases are not significant.
Johnson & Johnson 2013 Annual Report • 45
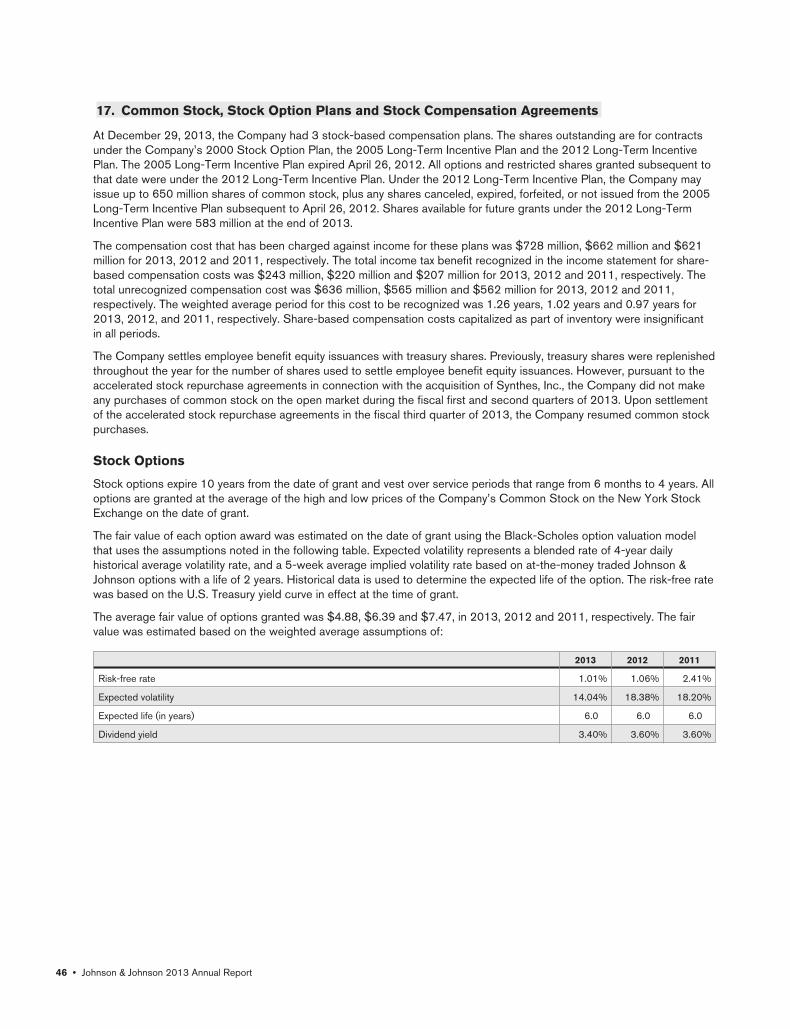
17. Common Stock, Stock Option Plans and Stock Compensation Agreements
At December 29, 2013, the Company had 3 stock-based compensation plans. The shares outstanding are for contractsunder the Company’s 2000 Stock Option Plan, the 2005 Long-Term Incentive Plan and the 2012 Long-Term IncentivePlan. The 2005 Long-Term Incentive Plan expired April 26, 2012. All options and restricted shares granted subsequent tothat date were under the 2012 Long-Term Incentive Plan. Under the 2012 Long-Term Incentive Plan, the Company mayissue up to 650 million shares of common stock, plus any shares canceled, expired, forfeited, or not issued from the 2005Long-Term Incentive Plan subsequent to April 26, 2012. Shares available for future grants under the 2012 Long-TermIncentive Plan were 583 million at the end of 2013.
The compensation cost that has been charged against income for these plans was $728 million, $662 million and $621million for 2013, 2012 and 2011, respectively. The total income tax benefit recognized in the income statement for share-based compensation costs was $243 million, $220 million and $207 million for 2013, 2012 and 2011, respectively. Thetotal unrecognized compensation cost was $636 million, $565 million and $562 million for 2013, 2012 and 2011,respectively. The weighted average period for this cost to be recognized was 1.26 years, 1.02 years and 0.97 years for2013, 2012, and 2011, respectively. Share-based compensation costs capitalized as part of inventory were insignificantin all periods.
The Company settles employee benefit equity issuances with treasury shares. Previously, treasury shares were replenishedthroughout the year for the number of shares used to settle employee benefit equity issuances. However, pursuant to theaccelerated stock repurchase agreements in connection with the acquisition of Synthes, Inc., the Company did not makeany purchases of common stock on the open market during the fiscal first and second quarters of 2013. Upon settlementof the accelerated stock repurchase agreements in the fiscal third quarter of 2013, the Company resumed common stockpurchases.
Stock Options
Stock options expire 10 years from the date of grant and vest over service periods that range from 6 months to 4 years. Alloptions are granted at the average of the high and low prices of the Company’s Common Stock on the New York StockExchange on the date of grant.
The fair value of each option award was estimated on the date of grant using the Black-Scholes option valuation modelthat uses the assumptions noted in the following table. Expected volatility represents a blended rate of 4-year dailyhistorical average volatility rate, and a 5-week average implied volatility rate based on at-the-money traded Johnson &Johnson options with a life of 2 years. Historical data is used to determine the expected life of the option. The risk-free ratewas based on the U.S. Treasury yield curve in effect at the time of grant.
The average fair value of options granted was $4.88, $6.39 and $7.47, in 2013, 2012 and 2011, respectively. The fairvalue was estimated based on the weighted average assumptions of:
2013 2012 2011
Risk-free rate 1.01% 1.06% 2.41%
Expected volatility 14.04% 18.38% 18.20%
Expected life (in years) 6.0 6.0 6.0
Dividend yield 3.40% 3.60% 3.60%
46 • Johnson & Johnson 2013 Annual Report

A summary of option activity under the Plan as of December 29, 2013, December 30, 2012 and January 1, 2012, andchanges during the years ending on those dates is presented below:
(Shares in Thousands)Outstanding
Shares
WeightedAverage
Exercise Price
AggregateIntrinsic
Value(Dollars inMillions)
Shares at January 2, 2011 193,690 $59.68 $648
Options granted 9,530 62.21
Options exercised (20,160) 56.65
Options canceled/forfeited (3,601) 62.38
Shares at January 1, 2012 179,459 60.10 1,004
Options granted 8,661 65.36
Options exercised (49,388) 56.73
Options canceled/forfeited (4,381) 62.97
Shares at December 30, 2012 134,351 61.58 1,061
Options granted 29,010 72.54
Options exercised (41,357) 59.99
Options canceled/forfeited (2,448) 65.89
Shares at December 29, 2013 119,556 $64.70 $3,306
The total intrinsic value of options exercised was $941 million, $547 million and $167 million in 2013, 2012 and 2011,respectively.
The following table summarizes stock options outstanding and exercisable at December 29, 2013:
(Shares in Thousands) Outstanding Exercisable
Exercise Price Range OptionsAverage
Life(1)
AverageExercise
Price Options
AverageExercise
Price
$52.13-$53.93 4,175 0.1 $53.92 4,175 $53.92
$54.89-$58.33 11,539 5.1 $58.33 11,539 $58.33
$58.34-$62.20 30,119 4.1 $60.65 22,122 $60.10
$62.62-$65.62 29,818 5.3 $64.62 21,438 $64.42
$65.80-$72.54 43,905 6.1 $70.23 15,936 $66.19
119,556 5.1 $64.70 75,210 $62.01
(1) Average contractual life remaining in years.
Stock options exercisable at December 30, 2012 and January 1, 2012 were 104,860 at an average price of $61.15 andan average life of 4.3 years and 138,126 at an average price of $59.94 and an average life of 4.2 years, respectively.
Restricted Share Units and Performance Share Units
The Company grants restricted share units which vest over service periods that range from 6 months to 3 years. TheCompany also grants performance share units, which are paid in shares of Johnson & Johnson Common Stock after theend of a three-year performance period. Whether any performance share units vest, and the amount that does vest, is tiedto the completion of service periods that range from 6 months to 3 years and the achievement, over a three-year period, ofthree equally-weighted goals that directly align with or help drive long-term total shareholder return: sales, adjustedoperational earnings per share, and relative total shareholder return. The number of shares actually earned at the end ofthe three-year period will vary, based only on actual performance, from 0% to 200% of the target number of performanceshare units granted.
Johnson & Johnson 2013 Annual Report • 47
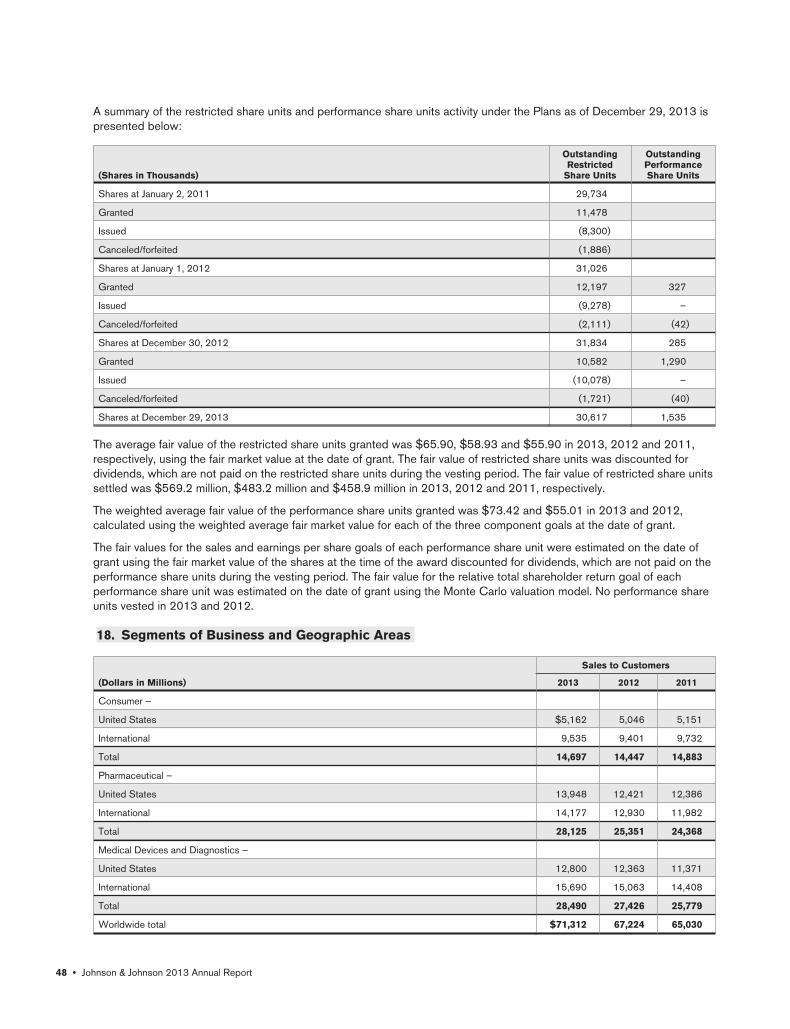
A summary of the restricted share units and performance share units activity under the Plans as of December 29, 2013 ispresented below:
(Shares in Thousands)
OutstandingRestricted
Share Units
OutstandingPerformanceShare Units
Shares at January 2, 2011 29,734
Granted 11,478
Issued (8,300)
Canceled/forfeited (1,886)
Shares at January 1, 2012 31,026
Granted 12,197 327
Issued (9,278) –
Canceled/forfeited (2,111) (42)
Shares at December 30, 2012 31,834 285
Granted 10,582 1,290
Issued (10,078) –
Canceled/forfeited (1,721) (40)
Shares at December 29, 2013 30,617 1,535
The average fair value of the restricted share units granted was $65.90, $58.93 and $55.90 in 2013, 2012 and 2011,respectively, using the fair market value at the date of grant. The fair value of restricted share units was discounted fordividends, which are not paid on the restricted share units during the vesting period. The fair value of restricted share unitssettled was $569.2 million, $483.2 million and $458.9 million in 2013, 2012 and 2011, respectively.
The weighted average fair value of the performance share units granted was $73.42 and $55.01 in 2013 and 2012,calculated using the weighted average fair market value for each of the three component goals at the date of grant.
The fair values for the sales and earnings per share goals of each performance share unit were estimated on the date ofgrant using the fair market value of the shares at the time of the award discounted for dividends, which are not paid on theperformance share units during the vesting period. The fair value for the relative total shareholder return goal of eachperformance share unit was estimated on the date of grant using the Monte Carlo valuation model. No performance shareunits vested in 2013 and 2012.
18. Segments of Business and Geographic Areas
Sales to Customers
(Dollars in Millions) 2013 2012 2011
Consumer –
United States $5,162 5,046 5,151
International 9,535 9,401 9,732
Total 14,697 14,447 14,883
Pharmaceutical –
United States 13,948 12,421 12,386
International 14,177 12,930 11,982
Total 28,125 25,351 24,368
Medical Devices and Diagnostics –
United States 12,800 12,363 11,371
International 15,690 15,063 14,408
Total 28,490 27,426 25,779
Worldwide total $71,312 67,224 65,030
48 • Johnson & Johnson 2013 Annual Report
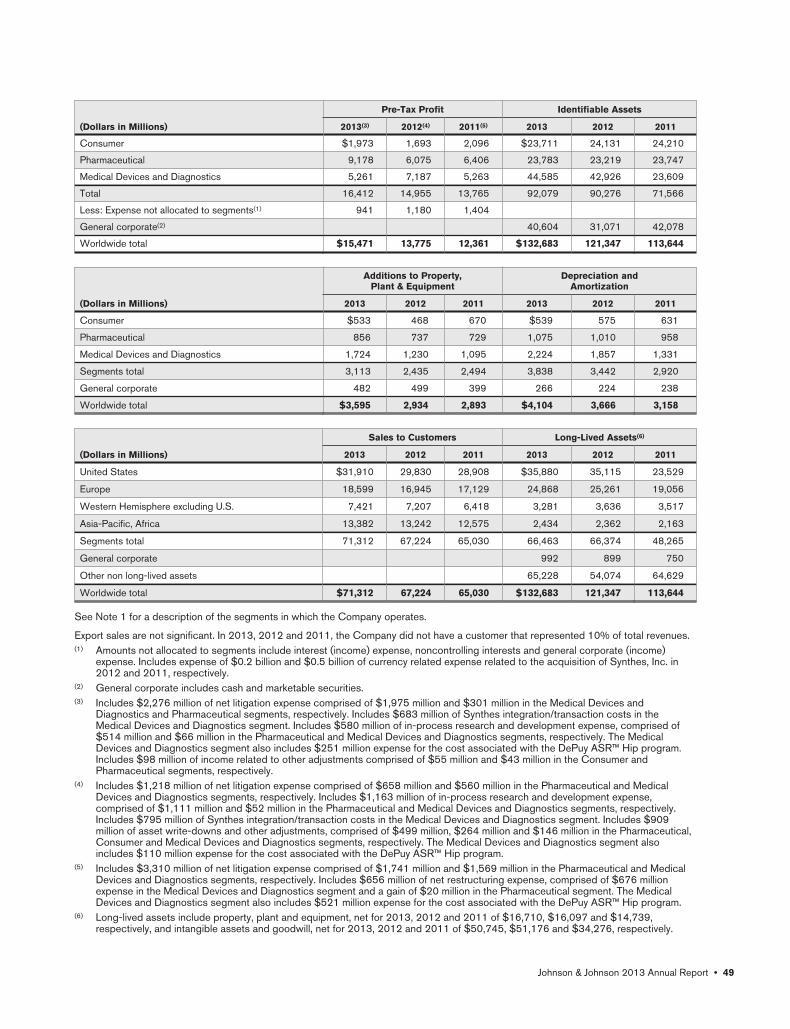
Pre-Tax Profit Identifiable Assets
(Dollars in Millions) 2013(3) 2012(4) 2011(5) 2013 2012 2011
Consumer $1,973 1,693 2,096 $23,711 24,131 24,210
Pharmaceutical 9,178 6,075 6,406 23,783 23,219 23,747
Medical Devices and Diagnostics 5,261 7,187 5,263 44,585 42,926 23,609
Total 16,412 14,955 13,765 92,079 90,276 71,566
Less: Expense not allocated to segments(1) 941 1,180 1,404
General corporate(2) 40,604 31,071 42,078
Worldwide total $15,471 13,775 12,361 $132,683 121,347 113,644
Additions to Property,Plant & Equipment
Depreciation andAmortization
(Dollars in Millions) 2013 2012 2011 2013 2012 2011
Consumer $533 468 670 $539 575 631
Pharmaceutical 856 737 729 1,075 1,010 958
Medical Devices and Diagnostics 1,724 1,230 1,095 2,224 1,857 1,331
Segments total 3,113 2,435 2,494 3,838 3,442 2,920
General corporate 482 499 399 266 224 238
Worldwide total $3,595 2,934 2,893 $4,104 3,666 3,158
Sales to Customers Long-Lived Assets(6)
(Dollars in Millions) 2013 2012 2011 2013 2012 2011
United States $31,910 29,830 28,908 $35,880 35,115 23,529
Europe 18,599 16,945 17,129 24,868 25,261 19,056
Western Hemisphere excluding U.S. 7,421 7,207 6,418 3,281 3,636 3,517
Asia-Pacific, Africa 13,382 13,242 12,575 2,434 2,362 2,163
Segments total 71,312 67,224 65,030 66,463 66,374 48,265
General corporate 992 899 750
Other non long-lived assets 65,228 54,074 64,629
Worldwide total $71,312 67,224 65,030 $132,683 121,347 113,644
See Note 1 for a description of the segments in which the Company operates.
Export sales are not significant. In 2013, 2012 and 2011, the Company did not have a customer that represented 10% of total revenues.(1) Amounts not allocated to segments include interest (income) expense, noncontrolling interests and general corporate (income)
expense. Includes expense of $0.2 billion and $0.5 billion of currency related expense related to the acquisition of Synthes, Inc. in2012 and 2011, respectively.
(2) General corporate includes cash and marketable securities.(3) Includes $2,276 million of net litigation expense comprised of $1,975 million and $301 million in the Medical Devices and
Diagnostics and Pharmaceutical segments, respectively. Includes $683 million of Synthes integration/transaction costs in theMedical Devices and Diagnostics segment. Includes $580 million of in-process research and development expense, comprised of$514 million and $66 million in the Pharmaceutical and Medical Devices and Diagnostics segments, respectively. The MedicalDevices and Diagnostics segment also includes $251 million expense for the cost associated with the DePuy ASR™ Hip program.Includes $98 million of income related to other adjustments comprised of $55 million and $43 million in the Consumer andPharmaceutical segments, respectively.
(4) Includes $1,218 million of net litigation expense comprised of $658 million and $560 million in the Pharmaceutical and MedicalDevices and Diagnostics segments, respectively. Includes $1,163 million of in-process research and development expense,comprised of $1,111 million and $52 million in the Pharmaceutical and Medical Devices and Diagnostics segments, respectively.Includes $795 million of Synthes integration/transaction costs in the Medical Devices and Diagnostics segment. Includes $909million of asset write-downs and other adjustments, comprised of $499 million, $264 million and $146 million in the Pharmaceutical,Consumer and Medical Devices and Diagnostics segments, respectively. The Medical Devices and Diagnostics segment alsoincludes $110 million expense for the cost associated with the DePuy ASR™ Hip program.
(5) Includes $3,310 million of net litigation expense comprised of $1,741 million and $1,569 million in the Pharmaceutical and MedicalDevices and Diagnostics segments, respectively. Includes $656 million of net restructuring expense, comprised of $676 millionexpense in the Medical Devices and Diagnostics segment and a gain of $20 million in the Pharmaceutical segment. The MedicalDevices and Diagnostics segment also includes $521 million expense for the cost associated with the DePuy ASR™ Hip program.
(6) Long-lived assets include property, plant and equipment, net for 2013, 2012 and 2011 of $16,710, $16,097 and $14,739,respectively, and intangible assets and goodwill, net for 2013, 2012 and 2011 of $50,745, $51,176 and $34,276, respectively.
Johnson & Johnson 2013 Annual Report • 49

19. Selected Quarterly Financial Data (unaudited)
Selected unaudited quarterly financial data for the years 2013 and 2012 are summarized below:
2013 2012
(Dollars in Millions Except Per ShareData)
FirstQuarter(1)
SecondQuarter(2)
ThirdQuarter(3)
FourthQuarter(4)
FirstQuarter(5)
SecondQuarter(6)
ThirdQuarter(7)
FourthQuarter(8)
Segment sales to customers
Consumer $3,675 3,658 3,611 3,753 3,595 3,619 3,581 3,652
Pharmaceutical 6,768 7,025 7,036 7,296 6,133 6,291 6,402 6,525
Med Devices & Diagnostics 7,062 7,194 6,928 7,306 6,411 6,565 7,069 7,381
Total sales 17,505 17,877 17,575 18,355 16,139 16,475 17,052 17,558
Gross profit 11,951 12,388 12,231 12,400 11,224 11,332 11,455 11,555
Earnings before provision for taxes onincome 4,261 4,793 3,667 2,750 5,045 2,035 3,595 3,100
Net earnings attributable to Johnson &Johnson 3,497 3,833 2,982 3,519 3,910 1,408 2,968 2,567
Basic net earnings per shareattributable to Johnson & Johnson $1.25 1.36 1.06 1.25 1.43 0.51 1.08 0.93
Diluted net earnings per shareattributable to Johnson & Johnson $1.22 1.33 1.04 1.23 1.41 0.50 1.05 0.91
(1) The first quarter of 2013 includes after-tax charges of $183 million from Synthes integration/transaction costs, $391 million from netlitigation expense and $42 million from impairment of in-process research and development, and $30 million associated with theDePuy ASR™ Hip program.
(2) The second quarter of 2013 includes after-tax charges of $308 million from net litigation expense, $87 million from Synthesintegration/transaction costs and $61 million associated with the DePuy ASR™ Hip program.
(3) The third quarter of 2013 includes after-tax charges of $720 million from net litigation expense, $103 million from Synthesintegration/transaction costs, $126 million from impairment of in-process research and development and $31 million associated withthe DePuy ASR™ Hip program.
(4) The fourth quarter of 2013 includes after-tax charges of $227 million from net litigation expense, $110 million from Synthesintegration/transaction costs, $294 million from impairment of in-process research and development, $118 million associated withthe DePuy ASR™ Hip program and a $707 million tax benefit associated with Scios Inc.
(5) The first quarter of 2012 includes an after-tax gain of $106 million from currency and costs associated with the acquisition ofSynthes, Inc.
(6) The second quarter of 2012 includes after-tax charges of $717 million for asset write-downs, $611 million from net litigationexpense, $564 million associated with the acquisition of Synthes, Inc. and $344 million from impairment of in-process research anddevelopment.
(7) The third quarter of 2012 includes after-tax charges of $135 million associated with the acquisition of Synthes, Inc., $340 millionfrom impairment of in-process research and development, $70 million associated with net litigation expense, and $24 millionassociated with the DePuy ASR™ Hip program.
(8) The fourth quarter of 2012 includes after-tax charges of $371 million from net litigation expense, $306 million associated with theacquisition of Synthes, Inc., $73 million associated with the DePuy ASR™ Hip program and $59 million from impairment of in-processresearch and development.
20. Business Combinations and Divestitures
Certain businesses were acquired for $835 million in cash and $193 million of liabilities assumed during 2013. Theseacquisitions were accounted for using the acquisition method and, accordingly, results of operations have been includedin the financial statements from their respective dates of acquisition.
The assumed liabilities primarily represent the fair value of the contingent consideration which may be payable related tothe acquisition of Aragon Pharmaceuticals, Inc. As per terms of the agreement, additional payments of up to $350 millionmay be paid in the future based on reaching predetermined milestones.
The 2013 acquisitions included: Flexible Stenting Solutions, Inc., a leading developer of innovative flexible peripheralarterial, venous and biliary stents; Shanghai Elsker Mother & Baby Co., Ltd, a baby care company in China and AragonPharmaceuticals, Inc., a privately-held, pharmaceutical discovery and development company focused on drugs to treathormonally-driven cancers.
50 • Johnson & Johnson 2013 Annual Report

The excess of purchase price over the estimated fair value of tangible assets acquired amounted to $941 million and hasbeen assigned to identifiable intangible assets, with any residual recorded to goodwill. Of this amount, approximately $831million has been identified as the value of IPR&D associated with the acquisitions of Aragon Pharmaceuticals, Inc. andFlexible Stenting Solutions, Inc.
The IPR&D related to the acquisition of Aragon Pharmaceuticals, Inc. of $810 million is associated with Aragon’sandrogen receptor antagonist program for treatment of hormonally-driven cancers. The value of the IPR&D was calculatedusing cash flow projections discounted for the inherent risk in such projects. Probability of success factors ranging from37% – 52.0% were used to reflect inherent clinical and regulatory risk. The discount rate applied was 15.5%. The IPR&Drelated to the acquisition of Flexible Stenting Solutions, Inc. of $21 million is associated with the approval for peripheralvascular indications, including the superficial femoral artery indication. A probability of success factor of 100% was usedand a discount rate ranging between 16.5% – 17.5% was applied.
Certain businesses were acquired for $17,821 million in cash and stock and $1,204 million of liabilities assumed during2012. These acquisitions were accounted for using the acquisition method and, accordingly, results of operations havebeen included in the financial statements from their respective dates of acquisition.
The 2012 acquisitions included: Synthes, Inc., a global developer and manufacturer of orthopaedics devices; GuangzhouBioseal Biotech Co., Ltd. a developer of biologic combinations addressing moderate to severe hemostasis; AngiotechPharmaceuticals, Inc., intellectual property and know how related to the QuillTM Knotless Tissue-Closure Device;Corimmun GmbH, a developer of a phase II treatment for CHF; Calibra Medical, Inc., a developer of a unique, wearablethree-day insulin patch for convenient and discreet mealtime dosing for people with diabetes who take multiple dailyinjections of insulin; Spectrum Vision LLC, a full service distributor of contact lenses serving Russia with facilities in theUkraine and Kazakhstan; and marketing authorizations, trademarks, and patents extending ZYRTEC® related market rightsin Australia and Canada.
The excess of purchase price over the estimated fair value of tangible assets acquired amounted to $15,785 million and hasbeen assigned to identifiable intangible assets, with any residual recorded to goodwill. Of this amount, approximately $208million has been identified as the value of IPR&D associated with the acquisitions of Corimmun GmbH and Synthes, Inc.
The IPR&D related to the acquisition of Synthes, Inc. of $63 million is associated with orthopaedic devices, and the IPR&Dassociated with Corimmun of $145 million is related to a CHF treatment. These IPR&D values were calculated using thecash flow projections discounted for the risk inherent in such projects. Synthes, Inc. had a probability of success factor of100%, discounted using a 14% rate. Corimmun had a probability of success factor of 38%, discounted using a 25% rate.During 2013, the Company recorded a charge of $0.2 billion for the impairment of the in-process research anddevelopment associated with Corimmun.
During the fiscal second quarter of 2012, the Company completed the acquisition of Synthes, Inc., a global developer andmanufacturer of orthopaedics devices, for a purchase price of $20.2 billion in cash and stock. The net acquisition cost ofthe transaction is $17.5 billion based on cash on hand at closing of $2.7 billion.
Under the terms of the agreement, each share of Synthes, Inc. common stock was exchanged for CHF 55.65 in cash and1.717 shares of Johnson & Johnson common stock, based on the calculated exchange ratio. The exchange ratio wascalculated on June 12, 2012 and based on the relevant exchange rate and closing price of Johnson & Johnson commonstock on that date, the total fair value of consideration transferred was $19.7 billion. When the acquisition was completedon June 14, 2012, based on the relevant exchange rate and closing price of Johnson & Johnson common stock on thatdate, the total fair value of the consideration transferred was $20.2 billion. Janssen Pharmaceutical, a company organizedunder the laws of Ireland and a wholly-owned subsidiary of Johnson & Johnson, used cash on hand to satisfy the cashportion of the merger consideration.
The stock portion of the merger consideration consisted of shares of Johnson & Johnson common stock purchased byJanssen Pharmaceutical from two banks, pursuant to two accelerated share repurchase (ASR) agreements dated June 12,2012. On June 13, 2012, Janssen Pharmaceutical purchased an aggregate of approximately 203.7 million shares ofJohnson & Johnson common stock at an initial purchase price of $12.9 billion under the ASR agreements, with all of theshares delivered to Janssen Pharmaceutical on June 13, 2012. During the fiscal third quarter of 2013, the Company settledthe remaining liabilities under the ASR agreements for $2.9 billion in cash which was recorded as a reduction to equity.
In addition, while the Company believes that the transactions under each ASR agreement and a series of related internaltransactions were consummated in a tax efficient manner in accordance with applicable law, it is possible that the InternalRevenue Service could assert one or more contrary positions to challenge the transactions from a tax perspective. Ifchallenged, an amount up to the total purchase price for the Synthes shares could be treated as subject to applicable U.S.tax at approximately the statutory rate to the Company, plus interest.
Johnson & Johnson 2013 Annual Report • 51

The following table summarizes the consideration transferred to acquire Synthes, Inc. valued on the acquisition date ofJune 14, 2012:
(Dollars in Millions)
Cash (multiply 55.65CHF by shares of Synthes common stock outstanding by the exchange rate)(A) $6,902
Common Stock (multiply 1.717 by shares of Synthes common stock outstanding by J&J stock price)(B) $13,335
Total fair value of consideration transferred $20,237
(A) Synthes common stock outstanding of 118.7 million shares as of the acquisition date and CHF/USD exchange rate of .95674.(B) Johnson & Johnson closing stock price on the New York Stock Exchange as of acquisition date of $65.45 per share.
During the fiscal second quarter of 2013, the Company finalized the purchase price allocation to the individual assetsacquired and liabilities assumed using the acquisition method. The following table presents the amounts recognized forassets acquired and liabilities assumed as of the acquisition date with adjustments made through June 30, 2013:
(Dollars in Millions)
Cash & Cash equivalents $2,749
Inventory 1,194
Accounts Receivable, net 738
Other current assets 238
Property, plant and equipment 1,253
Goodwill 6,074
Intangible assets 12,861
Other non-current assets 46
Total Assets Acquired 25,153
Current liabilities 1,081
Deferred Taxes 3,506
Other non-current liabilities 329
Total Liabilities Assumed 4,916
Net Assets Acquired $20,237
The adjustments made since the date of acquisition were to account for changes to inventory, based on the results of thephysical inventory counts and deferred taxes, to reflect the statutory tax rate that is being applied to the intangible assets.The revisions to the purchase price allocation were not material to the Statements of Consolidated Earnings or theConsolidated Balance Sheet for the fiscal second quarter of 2013 and prior fiscal quarters.
The assets acquired are recorded in the Medical Devices and Diagnostics segment. The acquisition of Synthes, Inc.resulted in $6.1 billion of goodwill. The goodwill is primarily attributable to synergies expected to arise from the acquisitionof Synthes, Inc. The goodwill is not deductible for tax purposes.
The purchase price allocation to the identifiable intangible assets before the effect of any amortization included in thecurrent period balance sheet is as follows:
(Dollars in Millions)
Intangible assets with definite lives:
Customer relationships $9,870
Patents and technology 1,508
Total amortizable intangibles 11,378
Trademark and Trade name 1,420
In-process research and development 63
Total intangible assets $12,861
52 • Johnson & Johnson 2013 Annual Report

The Customer Relationship intangible lives were determined using the projected customer retention period based onhistorical experience. Synthes has a broad product portfolio, including trauma, spine, cranio-maxillofacial, biomaterials andpower tools. An analysis was performed to determine the lives for each of the Customer Relationship assets in the distinctproduct areas. The calculations to determine useful lives included attrition rates and discounted future cash flows byproduct area. This analysis resulted in a weighted average life of 22 years for the Customer Relationship assets.
The Patents and Technology intangible lives were derived based on technology obsolescence rates that arecommensurate with the nature of the Synthes businesses. New product introductions are predominantly incrementalenhancements to existing platforms and are infrequently transformational. An analysis was performed to determine the livesfor each of the Patents and Technology assets in each distinct product area. The calculations to determine useful livesincluded assumptions on technology obsolescence and discounted future cash flows by product area. This analysisresulted in a weighted average life of 18 years for the Patents and Technology assets.
A weighted average of the values and lives ascribed to the Customer Relationship and Patents and Technology intangibleassets results in a 21 year weighted average life.
The Trademark and Trade name asset values were determined to have an indefinite life based on a number of factors,including trade name history, the competitive environment, market share and future operating plans. Additionally, in-process research and development intangible assets were valued for technology programs for unapproved products.
The value of the IPR&D was calculated using cash flow projections discounted for the risk inherent in such projects. Thediscount rate applied was 14%.
The Company is in the process of executing the integration plans to combine businesses, sales organizations, systemsand locations as a result of which the Company has and will continue to incur integration costs.
The operating results of Synthes were reported in the Company’s financial statements beginning on June 14, 2012. Totalsales and net earnings for Synthes for the fiscal year ended December 30, 2012 were $2,159 million and $324 million,respectively.
The following table provides pro forma results of operations for the fiscal year ended December 30, 2012 and January 1,2012, as if Synthes, Inc. had been acquired as of January 3, 2011. The pro forma results include the effect of divestituresand certain purchase accounting adjustments such as the estimated changes in depreciation and amortization expense onthe acquired tangible and intangible assets. However, pro forma results do not include any anticipated cost savings orother effects of the integration of Synthes, Inc. Accordingly, such amounts are not necessarily indicative of the results if theacquisition had occurred on the dates indicated or which may occur in the future.
Unaudited Pro formaconsolidated results
(Dollars in Millions Except Per Share Amounts) 2012 2011
Net Sales $68,894 68,741
Net Earnings attributable to Johnson & Johnson $11,564 9,427
Diluted Net Earnings per share attributable to Johnson & Johnson $4.11 3.40
The Company recorded acquisition related costs before tax of $683 million and $1,028 million in 2013 and 2012,respectively, which were recorded in Cost of products sold and Other (income) expense.
In connection with the Synthes acquisition, DePuy Orthopaedics, Inc. agreed to divest certain rights and assets related toits trauma business to Biomet, Inc. and completed the initial closing for this transaction in the fiscal second quarter of2012, including those countries that represented the majority of sales. As of December 30, 2012, the transaction hadclosed worldwide.
Certain businesses were acquired for $2,797 million in cash and $228 million of liabilities assumed during 2011. Theseacquisitions were accounted for using the acquisition method and, accordingly, results of operations have been includedin the financial statements from their respective dates of acquisition.
The 2011 acquisitions included: Crucell N.V., a global biopharmaceutical company focused on the research &development, production and marketing of vaccines and antibodies against infectious disease worldwide; the over-the-counter brands of J.B. Chemicals & Pharmaceuticals Limited, including RINZA®, Russia’s leading multi-symptom coughand cold brand, and DOKTOR MOM®, Russia’s number two selling cough brand, as well as several other brands; fullownership of the Johnson & Johnson-Merck Consumer Pharmaceuticals Co. joint venture in the U.S. from Merck Sharp &Dohme Corp; and SterilMed, Inc., a leader in the reprocessing and remanufacturing of medical devices in the U.S.
Johnson & Johnson 2013 Annual Report • 53

The excess of purchase price over the estimated fair value of tangible assets acquired amounted to $2,657 million and hasbeen assigned to identifiable intangible assets, with any residual recorded to goodwill. Of this amount, approximately $982million has been identified as the value of IPR&D associated with the acquisition of Crucell N.V.
The IPR&D related to the acquisition of Crucell N.V. of $982 million is associated with vaccines and antibodies thatprevent and/or treat infectious diseases. The value of the IPR&D was calculated using cash flow projections discountedfor the risk inherent in such projects. Probability of success factors ranging from 14% – 81% were used to reflect inherentclinical and regulatory risk. The discount rate applied was 16%. During 2012, the Company recorded a charge of $0.5billion for the intangible asset write-down and $0.4 billion for the impairment of the in-process research and developmentrelated to the Crucell business. During 2013, the Company recorded a charge of $0.4 billion for the impairment of the in-process research and development related to the Crucell business.
With the exception of the Synthes, Inc. acquisition, supplemental pro forma information for 2013, 2012 and 2011 inaccordance with U.S. GAAP standards related to business combinations, and goodwill and other intangible assets, is notprovided, as the impact of the aforementioned acquisitions did not have a material effect on the Company’s results ofoperations, cash flows or financial position.
During 2013, the Company divestitures included: women’s sanitary protection products in the U.S., Canada and theCaribbean to Energizer Holdings, Inc.; Rolaids® to Chattem, Inc.; DORIBAX® rights to Shionogi; and the sale of certainconsumer brands and certain pharmaceutical products. In 2013, the gains on the divestitures of businesses were $0.1billion. During 2012, the Company divestitures included: BYSTOLIC® (nebivolol) IP rights to Forest Laboratories, Inc.; thetrauma business of Depuy Orthopaedics, Inc. to Biomet, Inc.; the Therakos business to an affiliate of Gores CapitalPartners III, L.P.; the sale of certain consumer brands; and the RhoGAM® business. In 2012, the gains on the divestituresof businesses were $0.9 billion. During 2011, the Company divestitures included the Animal Health Business to Elanco, aDivision of Eli Lilly; MONISTAT® in Canada, the U.S. and its territories (including Puerto Rico); assets of the OrthoDermatologics division in the U.S. to subsidiaries of Valeant Pharmaceuticals International, Inc.; and the SurgicalInstruments Business of Codman & Shurtleff, Inc. In 2011, the gains on the divestitures of businesses were $1.0 billion.
In January 2014, the Company received a binding offer from The Carlyle Group to acquire the Ortho-Clinical Diagnosticsbusiness for $4.15 billion. The purchase price will be reduced at closing by approximately $0.2 billion, primarily for certainretained working capital, and will be subject to other customary adjustments. The Company expects this transaction toclose sometime during the middle of 2014, pending fulfillment of certain conditions, including, but not limited to, thereceipt of applicable anti-trust clearances and other customary closing requirements.
21. Legal Proceedings
Johnson & Johnson and certain of its subsidiaries are involved in various lawsuits and claims regarding product liability,intellectual property, commercial and other matters; governmental investigations; and other legal proceedings that arisefrom time to time in the ordinary course of their business.
The Company records accruals for such contingencies when it is probable that a liability will be incurred and the amountof the loss can be reasonably estimated. As of December 29, 2013, the Company has determined that the liabilitiesassociated with certain litigation matters are probable and can be reasonably estimated. The Company has accrued forthese matters and will continue to monitor each related legal issue and adjust accruals as might be warranted based onnew information and further developments in accordance with ASC 450-20-25. For these and other litigation andregulatory matters discussed below for which a loss is probable or reasonably possible, the Company is unable todetermine an estimate of the possible loss or range of loss beyond the amounts already accrued. These matters can beaffected by various factors, including whether damages sought in the proceedings are unsubstantiated or indeterminate;scientific and legal discovery has not commenced or is not complete; proceedings are in early stages; matters presentlegal uncertainties; there are significant facts in dispute; or there are numerous parties involved.
In the Company’s opinion, based on its examination of these matters, its experience to date and discussions with counsel,the ultimate outcome of legal proceedings, net of liabilities accrued in the Company’s balance sheet, is not expected tohave a material adverse effect on the Company’s financial position. However, the resolution in any reporting period of oneor more of these matters, either alone or in the aggregate, may have a material adverse effect on the Company’s results ofoperations and cash flows for that period.
PRODUCT LIABILITY
Certain subsidiaries of Johnson & Johnson are involved in numerous product liability claims and lawsuits involving multipleproducts. Claimants in these cases seek substantial compensatory and, where available, punitive damages. While these
54 • Johnson & Johnson 2013 Annual Report

subsidiaries believe they have substantial defenses, it is not feasible to predict the ultimate outcome of litigation. TheCompany has established product liability accruals in compliance with ASC 450-20 based on currently availableinformation, which in some cases may be limited. Changes to the accruals may be required in the future as additionalinformation becomes available.
The most significant of these cases include LEVAQUIN®, the ASR™ XL Acetabular System and DePuy ASR™ HipResurfacing System, the PINNACLE® Acetabular Cup System, RISPERDAL®, pelvic meshes, DURAGESIC® /fentanylpatches and TOPAMAX®. As of December 29, 2013, in the U.S. there were approximately 1,165 plaintiffs with directclaims in pending lawsuits regarding injuries allegedly due to LEVAQUIN®, 12,340 with respect to the ASR™ XLAcetabular System and DePuy ASR™ Hip Resurfacing System, 5,560 with respect to the PINNACLE® Acetabular CupSystem, 500 with respect to RISPERDAL®, 28,810 with respect to pelvic meshes, 22 with respect to DURAGESIC®/fentanyl patches and 140 with respect to TOPAMAX®.
In August 2010, DePuy Orthopaedics, Inc. (DePuy) announced a worldwide voluntary recall of its ASR™ XL AcetabularSystem and DePuy ASR™ Hip Resurfacing System used in hip replacement surgery. Claims for personal injury have beenmade against DePuy and Johnson & Johnson, and the number of pending lawsuits continues to increase. Cases filed inFederal courts in the United States have been organized as a multi-district litigation in the United States District Court forthe Northern District of Ohio. Litigation has also been filed in countries outside of the United States, primarily in the UnitedKingdom, Canada and Australia. In November 2013, DePuy reached an agreement with a Court-appointed committee oflawyers representing ASR™ Hip System plaintiffs to establish a program to settle claims with eligible ASR patients in theUnited States who had surgery to replace their ASR hip, known as revision surgery, as of August 31, 2013. The U.S.settlement is valued at approximately $2.5 billion, based on an estimate of 8,000 patients participating in the program. Thissettlement program is expected to bring to a close significant ASR litigation activity in the U.S. However, many lawsuits inthe U.S. will remain; and the settlement program does not address litigation outside of the U.S. The Company continues toreceive information with respect to potential costs associated with this recall on a worldwide basis. Updates to existingaccruals associated with the ASR may be required in the future as additional information becomes available.
Claims for personal injury have also been made against DePuy and Johnson & Johnson relating to DePuy’s PINNACLE®
Acetabular Cup System used in hip replacement surgery. The number of pending product liability lawsuits continues toincrease, and the Company continues to receive information with respect to potential costs and the anticipated number ofcases. Cases filed in Federal courts in the United States have been organized as a multi-district litigation in the UnitedStates District Court for the Northern District of Texas. The Company has established a product liability accrual inanticipation of product liability litigation associated with DePuy’s PINNACLE® Acetabular Cup System. Changes to thisaccrual may be required in the future as additional information becomes available.
Claims for personal injury have been made against Ethicon, Inc. (Ethicon) and Johnson & Johnson arising out of Ethicon’spelvic mesh devices used to treat stress urinary incontinence and pelvic organ prolapse. The number of pending productliability lawsuits continues to increase, and the Company continues to receive information with respect to potential costsand the anticipated number of cases. Cases filed in Federal courts in the United States have been organized as a multi-district litigation in the United States District Court for the Southern District of West Virginia. In addition, class actions andindividual personal injury cases or claims have been commenced in Australia, Belgium, Canada, England, Israel, Italy, theNetherlands, Scotland and Venezuela, seeking damages for alleged injury resulting from Ethicon’s pelvic mesh devices.The Company has established a product liability accrual in anticipation of product liability litigation associated withEthicon’s pelvic mesh products. Changes to this accrual may be required in the future as additional information becomesavailable.
INTELLECTUAL PROPERTY
Certain subsidiaries of Johnson & Johnson are subject, from time to time, to legal proceedings and claims related topatent, trademark and other intellectual property matters arising out of their business. The most significant of these mattersare described below.
PATENT INFRINGEMENT
Certain subsidiaries of Johnson & Johnson are involved in lawsuits challenging the coverage and/or validity of the patentson their products. Although these subsidiaries believe that they have substantial defenses to these challenges with respectto all material patents, there can be no assurance as to the outcome of these matters, and a loss in any of these casescould potentially adversely affect the ability of these subsidiaries to sell their products, or require the payment of pastdamages and future royalties.
Johnson & Johnson 2013 Annual Report • 55

Medical Devices and Diagnostics
In January 2010, Tyco Healthcare Group, LP (Tyco) and U.S. Surgical Corporation (now Covidien plc) filed a lawsuitagainst Ethicon Endo-Surgery, Inc. (EES) in the United States District Court for the District of Connecticut alleging thatseveral features of EES’s HARMONIC® Scalpel infringed three Tyco patents. Tyco is seeking monetary damages andinjunctive relief. The case was tried in July 2012, and in March 2013, the Court ruled that EES’s HARMONIC Scalpelinfringed Tyco’s patents and ordered EES to pay damages of approximately $176 million. EES has appealed the decisionto the United States Court of Appeals for the Federal Circuit. The Company believes EES has strong argumentssupporting its appeal. Because the Company believes that the potential for an unfavorable outcome is not probable, it hasnot established an accrual with respect to the case.
In October 2007, Bruce Saffran (Saffran) filed a patent infringement lawsuit against Johnson & Johnson and CordisCorporation (Cordis) in the United States District Court for the Eastern District of Texas alleging that Cordis’s sales of itsCYPHER® Stent willfully infringed the U.S. Patent No. 5,653,760. In January 2011, the jury awarded Saffran $482 million.In March 2011, the Court entered judgment against Cordis in the amount of $593 million, representing the jury verdict,plus $111 million in pre-judgment interest. In April 2013, the United States Court of Appeals for the Federal Circuitreversed the judgment and held that Cordis did not infringe Plaintiff’s patent as a matter of law. Plaintiff filed a Petition forCertiorari with the United States Supreme Court, which was denied in January 2014.
In November 2007, Roche Diagnostics Operations, Inc., et al. (Roche) filed a patent infringement lawsuit against LifeScan,Inc. (LifeScan) in the United States District Court for the District of Delaware, alleging LifeScan’s OneTouch® line of bloodglucose monitoring systems infringe two patents related to the use of microelectrode sensors. In September 2009,LifeScan obtained a favorable ruling on claim construction that precluded a finding of infringement. The Court enteredjudgment against Roche in July 2010 and Roche appealed. The Court of Appeals reversed the District Court’s ruling onclaim construction and remanded the case to the District Court for new findings on the issue. Roche is seeking monetarydamages and injunctive relief.
In June 2009, Rembrandt Vision Technologies, L.P. (Rembrandt) filed a patent infringement lawsuit against Johnson &Johnson Vision Care, Inc. (JJVC) in the United States District Court for the Eastern District of Texas alleging that JJVC’smanufacture and sale of its ACUVUE® ADVANCE® and ACUVUE® OASYS® Hydrogel Contact Lenses infringe their U.S.Patent No. 5,712,327 (the Chang patent). Rembrandt is seeking monetary relief. The case was transferred to the UnitedStates District Court for the Middle District of Florida. In May 2012, the jury returned a verdict holding that neither of theaccused lenses infringes the ‘327 patent. Rembrandt appealed, and in August 2013, the United States Court of Appealsfor the Federal Circuit affirmed the District Court’s judgment. Rembrandt has asked the District Court to grant it a new trialbased on alleged new evidence, and the Court’s decision on that motion is pending.
In September 2011, LifeScan, Inc. (LifeScan) filed a lawsuit against Shasta Technologies, Instacare Corp and ConductiveTechnologies (collectively, Shasta) in the United States District Court for the Northern District of California for patentinfringement for the making and marketing of a strip for use in LifeScan’s OneTouch® Blood Glucose Meters. In November2012, Shasta got a limited approval from the United States Food and Drug Administration (FDA) for its strips. InDecember 2012, LifeScan filed an additional lawsuit in the same court alleging violation of the Lanham Act based onShasta’s packaging. LifeScan moved for, and the District Court granted, a preliminary injunction prohibiting Shasta frommarketing their strips. Shasta appealed, and in November 2013, the Court of Appeals for the Federal Circuit reversed thegrant of the preliminary injunction. A preliminary injunction prohibiting Shasta from marketing their strips with objectionablelabeling also was granted in the Lanham Act case and was affirmed on appeal in January 2014. The defendantschallenged the validity of the asserted patents in the U.S. Patent and Trademark Office (USPTO) and the patentinfringement case has been stayed pending the outcome of the validity proceedings. The validity of two of the patents wasconfirmed by the USPTO and a decision regarding the validity of the third patent is pending. In April 2013 defendantsbrought counterclaims for antitrust violations and false advertising and those claims have been stayed pending resolutionof the patent infringement case.
In November 2011, Howmedica Osteonics Corp. (Howmedica) and Stryker Ireland Ltd. (Stryker) filed a patentinfringement lawsuit against DePuy Orthopaedics, Inc. (DePuy) in the United States District Court for the District ofNew Jersey alleging infringement by DePuy’s PINNACLE® Acetabular Cup System and DURALOC® Acetabular CupSystem of a patent relating to a dual-locking mechanism feature in an acetabular cup system. Howmedica and Stryker areseeking monetary damages and injunctive relief. DePuy filed its answer in February 2012 and filed a counterclaimasserting that Stryker’s Trident Acetabular Hip System infringes DePuy’s U.S. Patent No. 6,610,097. DePuy is seekingdamages and injunctive relief from Howmedica and Stryker.
In May 2012, Medtronic MiniMed, Inc., Medtronic Puerto Rico Operations Co. and MiniMed Distribution Corp.(collectively, Medtronic MiniMed) filed a patent infringement lawsuit against Animas Corporation in the United States
56 • Johnson & Johnson 2013 Annual Report
District Court for the Central District of California alleging that Animas’ OneTouch® Ping® Glucose Management Systemand the IR 1250, IR 2020 and IR 2000 insulin pumps infringe nine of their patents. Medtronic MiniMed is seekingmonetary damages and injunctive relief.
In March 2013, Medinol Ltd. (Medinol) filed a patent infringement lawsuit against Cordis Corporation (Cordis) andJohnson & Johnson in the United States District Court for the Southern District of New York alleging that all of Cordis’ssales of the CYPHER® and CYPHER SELECT® Stents made in the United States since 2005 willfully infringed four ofMedinol’s patents directed to the geometry of articulated stents. Medinol is seeking damages and attorney’s fees.
Pharmaceutical
In May 2009, Abbott Biotechnology Ltd. (Abbott) filed a patent infringement lawsuit against Centocor, Inc. (Centocor)(now Janssen Biotech, Inc. (JBI)) in the United States District Court for the District of Massachusetts alleging thatSIMPONI® infringes Abbott’s U.S. Patent Nos. 7,223,394 and 7,541,031 (the Salfeld patents). Abbott is seekingmonetary damages and injunctive relief. Oral argument on summary judgment motions was held in December 2013. Theparties are awaiting a decision.
In August 2009, Abbott GmbH & Co. (Abbott GmbH) and Abbott Bioresearch Center filed a patent infringement lawsuitagainst Centocor (now JBI) in the United States District Court for the District of Massachusetts alleging that STELARA®
infringes two United States patents assigned to Abbott GmbH. JBI filed a complaint in the United States District Court forthe District of Columbia for a declaratory judgment of non-infringement and invalidity of the Abbott GmbH patents, as wellas a Complaint for Review of a Patent Interference Decision that granted priority of invention on one of the two assertedpatents to Abbott GmbH. The cases have been transferred from the District of Columbia to the District of Massachusetts.Trial was held in September 2012 with a jury verdict in favor of JBI, invalidating Abbott’s patent claims. In March 2013, theCourt denied Abbott’s post-trial motions challenging the outcome and granted JBI’s motion on the appeal of theinterference decision. Abbott filed its notice of appeal in April 2013. Oral argument is scheduled for March 2014 in theCourt of Appeals for the Federal Circuit. Also in August 2009, Abbott GmbH and Abbott Laboratories Limited brought apatent infringement lawsuit in The Federal Court of Canada alleging that STELARA® infringes Abbott GmbH’s Canadianpatent. A trial was held in December 2013 in the Canadian Case. In January 2014, the Court ruled in favor of Abbott,finding that the asserted claims were valid and infringed by STELARA®. Janssen will appeal that decision. The Companybelieves Janssen has strong arguments supporting its appeal. In addition to the U.S. and Canadian litigations, in August2012, Abbott filed patent infringement lawsuits in the Netherlands, Switzerland and Germany. In each of the above cases,Abbott is seeking monetary damages and injunctive relief.
LITIGATION AGAINST FILERS OF ABBREVIATED NEW DRUG APPLICATIONS (ANDAs)
The following summarizes lawsuits pending against generic companies that filed Abbreviated New Drug Applications(ANDAs) seeking to market generic forms of products sold by various subsidiaries of Johnson & Johnson prior to expirationof the applicable patents covering those products. These ANDAs typically include allegations of non-infringement,invalidity and unenforceability of the applicable patents. In the event the subsidiaries are not successful in these actions, orthe statutory 30-month stays of the ANDAs expire before the United States District Court rulings are obtained, the third-party companies involved will have the ability, upon approval of the FDA, to introduce generic versions of the products atissue, resulting in very substantial market share and revenue losses for those products.
ORTHO TRI-CYCLEN® LO
A number of generic companies filed ANDAs seeking approval to market generic versions of ORTHO TRI-CYCLEN® LO.Janssen Pharmaceuticals, Inc. (JPI) filed patent infringement lawsuits against these generic companies seeking an Orderenjoining them from marketing their generic versions of ORTHO TRI-CYCLEN® LO prior to the expiration of JPI’s patentrelating to ORTHO TRI-CYCLEN® LO (the OTCLO patent). In 2012, JPI entered into settlement agreements with certain ofthese generic companies. The two remaining cases were concluded in the fiscal first quarter of 2013, as described below.
In January 2010, Ortho-McNeil-Janssen Pharmaceuticals, Inc. (OMJPI) (now JPI) filed a patent infringement lawsuit againstLupin Ltd. and Lupin Pharmaceuticals, Inc. (collectively, Lupin) in the United States District Court for the District ofNew Jersey in response to Lupin’s ANDA seeking approval to market a generic version of ORTHO TRI-CYCLEN® LOprior to the expiration of the OTCLO patent. Lupin filed a counterclaim alleging invalidity of the patent. In September 2012,the Court issued a decision in favor of JPI upholding the validity of the patent and ordering that the effective date of theapproval of Lupin’s ANDA (which had previously been approved) be not earlier than the expiration of the OTCLO patent.Lupin appealed the decision and in March 2013, JPI and Lupin entered into a settlement agreement pursuant to which
Johnson & Johnson 2013 Annual Report • 57

Lupin was granted a license under the OTCLO patent to market its generic version of ORTHO TRI-CYCLEN® LO startingDecember 31, 2015 (or earlier under certain circumstances).
In October 2011, JPI filed a patent infringement lawsuit against Sun Pharma Global FZE and Sun PharmaceuticalIndustries (collectively, Sun) in the United States District Court for the District of New Jersey in response to Sun’s ANDAseeking approval to market a generic version of ORTHO TRI-CYCLEN® LO prior to the expiration of the OTCLO patent.In February 2013, JPI and Sun entered into a settlement agreement pursuant to which Sun was granted a license underthe OTCLO patent to market its generic version of ORTHO TRI-CYCLEN® LO starting December 31, 2015 (or earlierunder certain circumstances), if and when they obtain FDA approval.
PREZISTA®
A number of generic companies have filed ANDAs seeking approval to market generic versions of PREZISTA®. InNovember 2010, Tibotec, Inc. (now Tibotec, LLC) and Tibotec Pharmaceuticals (now Janssen R&D Ireland) (collectively,Tibotec) filed a patent infringement lawsuit against Lupin, Ltd., Lupin Pharmaceuticals, Inc. (collectively, Lupin), Mylan, Inc.and Mylan Pharmaceuticals, Inc. (collectively, Mylan) in the United States District Court for the District of New Jersey inresponse to Lupin’s and Mylan’s respective ANDAs seeking approval to market generic versions of Tibotec’s PREZISTA®
product before the expiration of Tibotec’s patent relating to PREZISTA®. Lupin and Mylan each filed counterclaimsalleging non-infringement and invalidity. In July 2011, Tibotec filed another patent infringement lawsuit against Lupin in theUnited States District Court for the District of New Jersey in response to Lupin’s supplement to its ANDA to add newdosage strengths for its proposed product. In August 2011, Tibotec and G.D. Searle & Company (G.D. Searle) filed apatent infringement lawsuit against Lupin and Mylan in response to their notice letters advising that their ANDAs areseeking approval to market generic versions of Tibotec’s PREZISTA® product before the expiration of two patents relatingto PREZISTA® that Tibotec exclusively licenses from G.D. Searle.
In March 2011, Tibotec and G.D. Searle filed a patent infringement lawsuit against Teva Pharmaceuticals USA, Inc. andTeva Pharmaceuticals, Ltd. (collectively, Teva) in the United States District Court for the District of New Jersey in responseto Teva’s ANDA seeking approval to market a generic version of PREZISTA® before the expiration of certain patentsrelating to PREZISTA® that Tibotec either owns or exclusively licenses from G.D. Searle.
In March 2011, Tibotec filed a patent infringement lawsuit against Hetero Drugs, Ltd. Unit III and Hetero USA Inc.(collectively, Hetero) in the United States District Court for the District of New Jersey in response to Hetero’s ANDAseeking approval to market a generic version of PREZISTA® before the expiration of certain patents relating toPREZISTA® that Tibotec exclusively licenses from G.D. Searle. In July 2011, upon agreement by the parties, the Courtentered a stay of the lawsuit pending a final decision in the lawsuit against Teva with respect to the validity and/orenforceability of the patents that Tibotec licenses from G.D. Searle, with Hetero agreeing to be bound by such finaldecision. In September 2013, the lawsuit against Hetero was dismissed because Hetero is no longer seeking FDAapproval to market its generic version of PREZISTA® before the expiration of the relevant patents.
In September 2011, the Court consolidated the above lawsuits, as well as lawsuits brought by the United StatesGovernment against each of the defendants for infringement of a United States Government-owned patent relating toPREZISTA®, for purposes of pre-trial discovery and trial, with the proviso that after discovery is completed, any party canmove to have the cases de-consolidated for trial.
In May and June 2012, Janssen Products, LP and Janssen R&D Ireland (collectively, Janssen) and G.D. Searle filed apatent infringement lawsuit against Lupin, Teva and Mylan in the United States District Court for the District of New Jersey,alleging infringement of newly issued United States Reissue Patent No. Re42,889, which Janssen exclusively licensesfrom G.D. Searle. In August 2012, Janssen and G.D. Searle filed a patent infringement lawsuit against Lupin, Teva andMylan in the United States District Court for the District of New Jersey, alleging infringement of newly issued United StatesReissue Patent No. Re43,596, which Janssen exclusively licenses from G.D. Searle. These cases have been consolidatedwith the above lawsuits. In October 2012, Janssen filed a motion to file a Supplemental Complaint against Lupin, Teva andMylan in the United States District Court for the District of New Jersey, alleging infringement of United States Patent Nos.7,772,411 (Mylan only), 7,126,015 (Lupin and Teva only) and 7,595,408 (Lupin and Teva only). In January 2013, theCourt permitted these three additional patents to be added to the consolidated action. In March 2013, Janssen filed apatent infringement lawsuit against Hetero in the United States District Court for the District of New Jersey, alleginginfringement of United States Patent Nos. 7,126,015 and 7,595,408.
In May 2013, Lupin notified Janssen that it filed an ANDA seeking approval to market a new dosage strength of its genericversion of PREZISTA®. In response, Janssen filed a patent infringement lawsuit in the United States District Court for theDistrict of New Jersey, alleging that Lupin’s new dosage strength would infringe the same patents that Janssen is assertingagainst Lupin in the original action.
58 • Johnson & Johnson 2013 Annual Report

In June 2013, Janssen and G.D. Searle dismissed their claims relating to the patents owned by G.D. Searle against Lupinand Mylan, and in July 2013, Janssen and G.D. Searle dismissed their claims relating to those patents against Teva. A trialon the remaining patents has been scheduled for March 2014.
In November 2013, Janssen filed a patent infringement lawsuit against Teva in the United States District Court for theDistrict of New Jersey, alleging infringement of newly issued United States Patent No. 8,518,987.
In each of the above lawsuits, Tibotec and Janssen are seeking an Order enjoining the defendants from marketing theirgeneric versions of PREZISTA® before the expiration of the relevant patents.
CONCERTA®
In June 2013, ALZA Corporation and Janssen Pharmaceuticals, Inc. (collectively, Janssen) filed patent infringementlawsuits in the District Court for the District of Delaware against (1) Par Pharmaceuticals, Inc., Actavis Elizabeth LLC andActavis, Inc. (collectively, Par) and (2) Osmotica Kereskedelmies Szolgaltato Kft (Osmotica) and Norwich Pharmaceuticals,Inc. (Norwich) in response to those parties’ ANDAs seeking approval to market a generic version of CONCERTA® beforethe expiration of United States Patent No. 8,163,798 (the ‘798 patent). In each of the above lawsuits, Janssen is seekingan Order enjoining the defendants from marketing their generic versions of CONCERTA® before the expiration of the ‘798patent. In September 2013, Janssen dismissed Actavis Elizabeth LLC and Actavis, Inc. from the case. The claims againstPar Pharmaceuticals, Inc., Osmotica and Norwich remain. In addition, in September 2013, Par and Osmotica filedcounterclaims against Janssen seeking declarations of invalidity and noninfringement of the patent-in-suit, and Norwichfiled a motion to dismiss.
NUCYNTA® AND NUCYNTA® ER
In July 2013, Janssen Pharmaceuticals, Inc. (JPI) filed patent infringement lawsuits in the United States District Court forthe District of New Jersey against Actavis Elizabeth LLC, Actavis Inc. and Actavis LLC (collectively, Actavis), as well asAlkem Laboratories Limited and Ascend Laboratories, LLC (collectively, Alkem). The patent infringement claims againstActavis and Alkem relate to their respective ANDAs seeking approval to market a generic version of NUCYNTA® ERbefore the expiration of United States Reissue Patent No. 39,593 (the ‘593 patent), United States Patent No. 7,994,364(the ‘364 patent) and, as to Actavis only, United States Patent No. 8,309,060 (the ‘060 patent). The lawsuit also includesa patent infringement claim against Alkem in response to its ANDA seeking approval to market a generic version ofNUCYNTA® before the expiration of the ‘593 and ‘364 patents. JPI is seeking an Order enjoining the defendants frommarketing their generic versions of NUCYNTA® ER and NUCYNTA® before the expiration of the asserted patents. InOctober 2013, JPI received a Paragraph IV Notice from Sandoz, Inc. with respect to NUCYNTA® related to the ‘364patent, and a Paragraph IV Notice from Roxane Laboratories, Inc. (Roxane) with respect to NUCYNTA® related to the ‘593and ‘364 patents and United States Patent No. 6,071,970. In response to those notices, JPI filed an additional complaintin the United States District Court for the District of New Jersey against Roxane and Sandoz asserting the ‘364 patentagainst Sandoz and the ‘364 and ‘593 patents against Roxane. In December 2013, JPI filed an additional complaint in theDistrict Court of New Jersey against Alkem asserting United States Patent No. 8,536,130 related to its ANDA seekingapproval to market a generic version of NUCYNTA® ER.
OTHER INTELLECTUAL PROPERTY MATTERS
In December 2009, the State of Israel filed a lawsuit in the District Court in Tel Aviv Jaffa against OmrixBiopharmaceuticals, Inc. and various affiliates (Omrix). In the lawsuit, the State claims that an employee of a government-owned hospital was the inventor on several patents related to fibrin glue technology that the employee developed while hewas a government employee. The State claims that he had no right to transfer any intellectual property to Omrix because itbelongs to the State. The State is seeking damages plus royalties on QUIXIL™ and EVICEL™ products, or alternatively,transfer of the patents to the State.
In March 2012, Noramco, Inc. (Noramco) moved to intervene in three patent infringement lawsuits filed in theUnited States District Court for the Southern District of New York (SDNY) by Purdue Pharma L.P. and others (Purdue)against Noramco oxycodone customers, Impax Laboratories, Inc. (Impax), Teva Pharmaceuticals USA, Inc. (Teva) andAmneal Pharmaceuticals, LLC (Amneal). In February 2013, Noramco appeared on behalf of Noramco customers WatsonLaboratories, Inc. – Florida and Andrx Labs, LLC (collectively, Watson/Andrx) in a similar lawsuit filed by Purdue in theSDNY. The lawsuits are in response to the defendants’ respective ANDAs seeking approval to market generic extendedrelease oxycodone products before the expiration of certain Purdue patents. Three of the asserted patents relate tooxycodone and processes for making oxycodone, and Noramco has agreed to defend the lawsuits on behalf of Impax,
Johnson & Johnson 2013 Annual Report • 59

Teva, Amneal and Watson/Andrx. Although Noramco did not participate, in November 2012, a trial in a lawsuit brought byPurdue against another Noramco customer, Actavis Elizabeth, LLC (Actavis), took place. In April 2013, Actavis andWatson/Andrx entered into confidential settlements with Purdue. Subsequently, the Court dismissed the Actavis lawsuitas moot. The trial against Impax and Teva (as well as two parties not defended by Noramco) took place in September2013 and as discussed above, Noramco defended Teva and Impax. In November 2013, Impax entered into a confidentialsettlement with Purdue. In January 2014, the Court issued a decision invalidating the relevant Purdue patents.
In May 2012, Hospira UK Limited (Hospira) filed a revocation proceeding against The Kennedy Institute of Rheumatology(Kennedy) challenging the validity of European Patent (UK) Nos. 0914157, 1593393 and 1941904, which relate toREMICADE®. Janssen Biotech, Inc. (JBI) licenses those patents, as well as their foreign counterparts, from Kennedy.Hospira was also seeking a declaration of non-infringement of those patents. In July 2013, the parties entered into aconfidential settlement resolving this proceeding.
In March, May and June 2013, Hospira affiliates filed impeachment/revocation proceedings against Kennedy’s Canadian,Finnish and Hong Kong counterpart patents, respectively; however, the revocation proceedings in Finland and Hong Kongwere withdrawn in July 2013. In the proceeding in Canada, in October 2013, Kennedy, along with JBI, Janssen Inc. andCilag GmbH International, filed a counterclaim for infringement against Hospira Healthcare Corporation, CelltrionHealthcare Co. Ltd and Celltrion Inc. The counterclaim alleges that the products described in Celltrion’s and Hospira’smarketing application to Health Canada for their subsequent entry biologics (SEB) to REMICADE® would infringe theKennedy patents. In January 2014, Health Canada approved Celltrion’s and Hospira’s SEBs to REMICADE®.
In August 2012, Dr. James M. Swanson filed a lawsuit against ALZA Corporation (ALZA) in the Northern District ofCalifornia seeking to be added as an inventor on three ALZA-owned patents relating to CONCERTA®. Alternatively,Dr. Swanson has alleged, among other things, that the patents-in-suit are invalid and/or unenforceable as a result ofALZA’s alleged omission of Dr. Swanson as a named inventor on the patents. Dr. Swanson is seeking damages and anaward of unjust enrichment. ALZA filed a motion to dismiss Dr. Swanson’s claims. The Court granted the motion in part,and denied it in part. Discovery in the case is ongoing.
In September 2013, Janssen Biotech, Inc. (JBI) and NYU Medical Center received an Office Action from the United StatesPatent Office rejecting the claims in a co-owned patent relating to REMICADE® in a reexamination proceeding institutedby a third party. Currently, the affected patent in the United States expires in September 2018. If, as a result of thereexamination, it is finally concluded that the patent is invalid, the patent could not be relied upon to prevent theintroduction of biosimilar versions of REMICADE® in the United States. The remaining Janssen/NYU REMICADE®
patents, the latest to expire in December 2014, remain in full force and effect. The timing of the possible introduction of abiosimilar version of REMICADE® would be subject to approval by the FDA. If a biosimilar version of REMICADE® were tobe approved, and introduced to the market, loss of exclusivity would likely result in a reduction in sales. JBI believes theREMICADE® patent in question is valid and has responded to the Office Action to defend the patent, and if necessary, willpursue available appeals.
GOVERNMENT PROCEEDINGS
Like other companies in the pharmaceutical and medical devices and diagnostics industries, Johnson & Johnson andcertain of its subsidiaries are subject to extensive regulation by national, state and local government agencies in theUnited States and other countries in which they operate. As a result, interaction with government agencies is ongoing. Themost significant litigation brought by, and investigations conducted by, government agencies are listed below. It is possiblethat criminal charges and substantial fines and/or civil penalties or damages could result from government investigations orlitigation.
AVERAGE WHOLESALE PRICE (AWP) LITIGATION
Johnson & Johnson and several of its pharmaceutical subsidiaries (the J&J AWP Defendants), along with numerous otherpharmaceutical companies, are defendants in a series of lawsuits in state and federal courts involving allegations that thepricing and marketing of certain pharmaceutical products amounted to fraudulent and otherwise actionable conductbecause, among other things, the companies allegedly reported an inflated Average Wholesale Price (AWP) for the drugsat issue. Payors alleged that they used those AWPs in calculating provider reimbursement levels. Many of these cases,both federal actions and state actions removed to federal court, were consolidated for pre-trial purposes in a Multi-DistrictLitigation (MDL) in the United States District Court for the District of Massachusetts.
The plaintiffs in these cases included three classes of private persons or entities that paid for any portion of the purchaseof the drugs at issue based on AWP, and state government entities that made Medicaid payments for the drugs at issue
60 • Johnson & Johnson 2013 Annual Report

based on AWP. In June 2007, after a trial on the merits, the MDL Court dismissed the claims of two of the plaintiff classesagainst the J&J AWP Defendants. In March 2011, the Court dismissed the claims of the third class against the J&J AWPDefendants without prejudice.
AWP cases brought by various Attorneys General have proceeded to trial against other manufacturers. Several statecases against certain subsidiaries of Johnson & Johnson have been settled, including those filed by Kentucky, Kansas,Mississippi and Louisiana. The case filed by Illinois is set for trial in May 2014, and the Alaska case is set for trial in July2014. Other state cases are likely to be set for trial in due course. In addition, an AWP case against the J&J AWPDefendants brought by the Commonwealth of Pennsylvania was tried in Commonwealth Court in October andNovember 2010. The Court found in the Commonwealth’s favor with regard to certain of its claims under the PennsylvaniaUnfair Trade Practices and Consumer Protection Law (“UTPL”), entered an injunction, and awarded $45 million inrestitution and $6.5 million in civil penalties. The Court found in the J&J AWP Defendants’ favor on the Commonwealth’sclaims of unjust enrichment, misrepresentation/fraud, civil conspiracy, and on certain of the Commonwealth’s claims underthe UTPL. The J&J AWP Defendants have appealed the Commonwealth Court’s UTPL ruling to the Pennsylvania SupremeCourt. The Company believes that the J&J AWP Defendants have strong arguments supporting their appeal. Because theCompany believes that the potential for an unfavorable outcome is not probable, it has not established an accrual withrespect to the verdict.
RISPERDAL®
Beginning in January 2004, Janssen Pharmaceutica Inc. (Janssen Pharmaceutica) (now Janssen Pharmaceuticals, Inc.(JPI)) received subpoenas from the Office of the Inspector General of the United States Office of Personnel Management,the Department of Justice and the United States Attorney’s Office for the Eastern District of Pennsylvania seekingdocuments concerning sales and marketing of, payments to physicians in connection with sales and marketing of, andclinical trials for, RISPERDAL®. Numerous subpoenas seeking testimony from various witnesses before a grand jury werealso received. JPI cooperated in responding to these requests for documents and witnesses. The United StatesDepartment of Justice and the United States Attorney’s Office for the Eastern District of Pennsylvania (the Government)were pursuing both criminal and civil actions concerning these matters. In February 2010, the Government served CivilInvestigative Demands seeking additional information relating to sales and marketing of RISPERDAL® and sales andmarketing of INVEGA®. The focus of these matters was the alleged promotion of RISPERDAL® and INVEGA® for off-labeluses. The Government had also notified JPI that there were pending qui tam actions alleging off-label promotion ofRISPERDAL® in which the Government planned to intervene.
In 2011, discussions to resolve criminal penalties under the Food, Drug, and Cosmetic Act related to the promotion ofRISPERDAL® resulted in an agreement in principle with the United States Attorney’s Office for the Eastern District ofPennsylvania on key issues relevant to a disposition of criminal charges pursuant to a single misdemeanor violation of theFood, Drug, and Cosmetic Act. The settlement agreement was finalized in November 2013. Under its terms, JPI pled guiltyto a single misdemeanor violation of the Food, Drug, and Cosmetic Act and paid $400 million.
In 2012, the Company reached an agreement in principle with the United States Department of Justice to settle three civilFalse Claims Act matters pending in (1) the Eastern District of Pennsylvania concerning sales and marketing ofRISPERDAL® and INVEGA®; (2) the Northern District of California regarding the sales and marketing of NATRECOR®,discussed separately below; and (3) the District of Massachusetts alleging that the defendants provided the Omnicare,Inc. (Omnicare) long-term care pharmacy with rebates and other payments regarding RISPERDAL® and other products,discussed separately below. These settlement agreements were finalized in November 2013. Under the terms of thesettlements, the Company paid an amount of approximately $1.6 billion. The Company also entered into a five-yearcorporate integrity agreement with the Office of Inspector General of the Department of Health and Human Services.These civil settlements resolved the federal government’s claims under the federal False Claims Act, resolved all pendingstate and federal government litigation regarding Omnicare and NATRECOR® (described below), and settled theRISPERDAL® Medicaid-related claims for the states that participated in the relevant settlement. To the extent any statehas an outstanding Medicaid-related claim not resolved by these settlements, the Company has accrued an amountapproximately equal to what that state would have received if it had participated in the relevant federal settlement.
In addition to the federal actions, the Attorneys General of several states brought actions against Janssen Pharmaceutica(now JPI), related to the sale and marketing of RISPERDAL®, seeking one or more of the following remedies:reimbursement of Medicaid or other public funds for RISPERDAL® prescriptions written for off-label use, compensationfor treating their citizens for alleged adverse reactions to RISPERDAL®, civil fines or penalties, for violations of state falseclaims acts or consumer fraud statutes, punitive damages, or other relief relating to alleged unfair business practices.Certain of these actions also sought injunctive relief relating to the promotion of RISPERDAL®. The Attorneys General of
Johnson & Johnson 2013 Annual Report • 61

multiple other states and the District of Columbia were pursuing investigations and potentially similar litigation against JPI.Many of the actions and claims brought by the state Attorneys General have been settled, either individually or as part ofthe federal settlements described above.
Following the federal and state settlements described above, as of year-end 2013, five states had remaining claims inlitigation related to RISPERDAL®. Three of these (Arkansas, Louisiana, and South Carolina) are on appeal, and two(Kentucky and Mississippi) have not progressed to trial. The Company has not accrued amounts equal to the judgmentsobtained in the three cases on appeal. State cases that went to judgment after trial are discussed below.
In 2004, the Attorney General of West Virginia commenced a lawsuit against Janssen Pharmaceutica (now JPI) based onclaims of alleged consumer fraud as to DURAGESIC®, as well as RISPERDAL®. JPI was found liable and damages wereassessed at $4.5 million. JPI filed an appeal, and in November 2010, the West Virginia Supreme Court of Appealsreversed the trial court’s decision. In December 2010, the Attorney General of West Virginia dismissed the case as itrelated to RISPERDAL® without any payment. Thereafter, JPI settled the case insofar as it related to DURAGESIC®.
In 2004, the Attorney General of Louisiana filed a multi-count Complaint against Janssen Pharmaceutica (now JPI).Johnson & Johnson was later added as a defendant. The case was tried in October 2010. The issue tried to the jury waswhether Johnson & Johnson or JPI had violated the State’s Medical Assistance Program Integrity Law (the Act) throughmisrepresentations allegedly made in the mailing of a November 2003 Dear Health Care Professional letter regardingRISPERDAL®. The jury returned a verdict that JPI and Johnson & Johnson had violated the Act and awarded $257.7million in damages. The trial judge subsequently awarded the Attorney General counsel fees and expenses in the amountof $73 million. In August 2012, an intermediate appellate court affirmed the judgment. This judgment was appealed, and inJanuary 2014, the Louisiana Supreme Court reversed the district court’s judgment in favor of the Attorney General, andrendered judgment in favor of Johnson & Johnson and JPI. The Attorney General has filed a petition seeking a rehearing ofthe appellate arguments.
In 2007, the Office of General Counsel of the Commonwealth of Pennsylvania filed a lawsuit against JanssenPharmaceutica (now JPI) on a multi-Count Complaint related to Janssen Pharmaceutica’s sale of RISPERDAL® to theCommonwealth’s Medicaid program. The trial occurred in June 2010. The trial judge dismissed the case after the close ofthe plaintiff’s evidence. The Commonwealth filed an appeal and in July 2012, the Pennsylvania Appeals Court upheld thedismissal of the Commonwealth’s case.
In 2007, the Attorney General of South Carolina filed a lawsuit against Johnson & Johnson and Janssen Pharmaceutica(now JPI) on several counts. In March 2011, the matter was tried to a jury on liability only, at which time the lawsuit waslimited to claims of violation of the South Carolina Unfair Trade Practices Act, including, among others, questions ofwhether Johnson & Johnson or JPI engaged in unfair or deceptive acts or practices in the conduct of any trade orcommerce by distributing the November 2003 Dear Health Care Professional letter regarding RISPERDAL® or in their useof the product’s FDA-approved label. The jury found in favor of Johnson & Johnson and against JPI. In June 2011, theCourt awarded civil penalties of approximately $327.1 million against JPI. JPI has appealed this judgment and theCompany believes it has strong arguments supporting the appeal. Oral argument on the appeal took place before theSouth Carolina Supreme Court in March 2013 and the parties are awaiting a decision.
In April 2012, in the lawsuit brought by the Attorney General of Arkansas, the jury found against both JPI and Johnson &Johnson, and the Court imposed penalties in the amount of approximately $1.2 billion. In January 2013, the trial courtawarded attorney fees of approximately $181 million. JPI and Johnson & Johnson have filed appeals from both awards andbelieve they have strong arguments in support of the appeals. Oral argument on the appeal has been scheduled forFebruary 2014.
OMNICARE
In September 2005, Johnson & Johnson received a subpoena from the United States Attorney’s Office for the District ofMassachusetts, seeking documents related to the sales and marketing of eight drugs to Omnicare, Inc. (Omnicare), amanager of pharmaceutical benefits for long-term care facilities. In April 2009, Johnson & Johnson and certain of itspharmaceutical subsidiaries were served in two civil qui tam cases asserting claims under the Federal False Claims Actand related state law claims alleging that the defendants provided Omnicare with rebates and other alleged kickbacks,causing Omnicare to file false claims with Medicaid and other government programs. In January 2010, the governmentintervened in both of these cases, naming Johnson & Johnson, Ortho-McNeil-Janssen Pharmaceuticals, Inc. (now JanssenPharmaceuticals, Inc. (JPI)), and Johnson & Johnson Health Care Systems Inc. as defendants. Subsequently, theCommonwealths of Massachusetts, Virginia, and Kentucky, and the States of California and Indiana intervened in theaction. In February 2011, the United States District Court for the District of Massachusetts dismissed one qui tam case
62 • Johnson & Johnson 2013 Annual Report
entirely and dismissed the other case in part, rejecting allegations that the defendants had violated their obligation toreport their “best price” to health care program officials. The remaining claims of the United States and intervening stateswere resolved in November 2013 as part of the federal civil settlements discussed in the RISPERDAL® section above.
NATRECOR®
In July 2005, Scios Inc. (Scios) received a subpoena from the United States Attorney’s Office for the District ofMassachusetts, seeking documents related to the sales and marketing of NATRECOR®. In August 2005, Scios wasadvised that the investigation would be handled by the United States Attorney’s Office for the Northern District ofCalifornia in San Francisco. In February 2009, two qui tam complaints were unsealed in the United States District Courtfor the Northern District of California, alleging, among other things, improper activities in the promotion of NATRECOR®. InJune 2009, the United States government intervened in one of the qui tam actions, and filed a complaint against Scios andJohnson & Johnson seeking relief under the Federal False Claims Act and asserting a claim of unjust enrichment. InOctober 2011, a criminal matter related to NATRECOR® was resolved. The remaining civil case was resolved inNovember 2013 as part of the federal civil settlements discussed in the RISPERDAL® section above.
MCNEIL CONSUMER HEALTHCARE
Starting in June 2010, McNeil Consumer Healthcare Division of McNEIL-PPC, Inc. (McNeil Consumer Healthcare) andcertain affiliates, including Johnson & Johnson (the Companies), received grand jury subpoenas from the United StatesAttorney’s Office for the Eastern District of Pennsylvania requesting documents broadly relating to recalls of variousproducts of McNeil Consumer Healthcare, and the FDA inspections of the Fort Washington, Pennsylvania and Lancaster,Pennsylvania manufacturing facilities, as well as certain documents relating to recalls of a small number of products ofother subsidiaries. In addition, in February 2011, the government served McNEIL-PPC, Inc. (McNEIL-PPC) with a CivilInvestigative Demand seeking records relevant to its investigation to determine if there was a violation of the Federal FalseClaims Act. The grand jury and False Claims investigations are continuing. The Companies are cooperating with theUnited States Attorney’s Office in responding to these investigations.
The Companies have also received Civil Investigative Demands from multiple State Attorneys General Offices broadlyrelating to the McNeil recall issues. The Companies continue to cooperate with these inquiries, which are beingcoordinated through a multi-state coalition. If a resolution cannot be reached with this multi-state coalition, it is possiblethat individual State Attorneys General Offices may file civil money claims against the Companies. In January 2011, theOregon Attorney General filed a civil complaint against Johnson & Johnson, McNEIL-PPC and McNeil Healthcare LLC instate court alleging civil violations of the Oregon Unlawful Trade Practices Act relating to an earlier recall of a McNeil OTCproduct. In November 2012, the state court granted a motion by the Companies to dismiss Oregon’s complaint in itsentirety, with prejudice. In December 2012, Oregon filed a Notice of Appeal in the Court of Appeals of the State ofOregon. Briefing on the appeal has concluded and the Court has not set a hearing date.
In March 2011, the United States filed a complaint for injunctive relief in the United States District Court for the EasternDistrict of Pennsylvania against McNEIL-PPC and two of its employees, alleging that McNEIL-PPC is in violation of FDAregulations regarding the manufacture of drugs at the facilities it operates in Lancaster, Pennsylvania, Fort Washington,Pennsylvania, and Las Piedras, Puerto Rico. On the same day, the parties filed a consent decree of permanent injunctionresolving the claims set forth in the complaint. The Court approved and entered the consent decree on March 16, 2011.
The consent decree, which is subject to ongoing enforcement by the Court, requires McNEIL-PPC to take enhancedmeasures to remediate the three facilities. The Fort Washington facility, which was voluntarily shut down in April 2010, willremain shut down until a third-party consultant certifies that its operations will be in compliance with applicable law, andthe FDA concurs with the third-party certification. The Lancaster and Las Piedras facilities may continue to manufactureand distribute drugs, provided that a third party reviews manufacturing records for selected batches of drugs releasedfrom the facilities, and certifies that any deviations reviewed do not adversely affect the quality of the selected batches.McNEIL-PPC submitted a workplan to the FDA for remediation of the Lancaster and Las Piedras facilities, and that planwas approved by the FDA in October 2012. Third-party batch record review may cease if the FDA has stated that thefacilities appear to be in compliance with applicable law. Each facility is subject to a five-year audit period by a third partyafter the facility has been deemed by the FDA to be in apparent compliance with applicable law.
OTHER
In June 2008, Johnson & Johnson received a subpoena from the United States Attorney’s Office for the District ofMassachusetts relating to the marketing of biliary stents by Cordis Corporation (Cordis). In February 2012, the
Johnson & Johnson 2013 Annual Report • 63

government informed Cordis that it was closing its investigation. In addition, in January 2010, a complaint was unsealed inthe United States District Court for the Northern District of Texas, filed by Kevin Colquitt, seeking damages against Cordisand other parties for alleged violations of the Federal False Claims Act and several similar state laws in connection with themarketing of biliary stents. The United States Department of Justice and several states declined to intervene. In January2013, the Court granted Cordis’s motion to dismiss the claims against Cordis, with prejudice. Plaintiff appealed, and inMay 2013, Plaintiff dismissed his appeal, concluding the matter.
In September 2011, Synthes, Inc. (Synthes) received a Civil Investigative Demand issued pursuant to the False Claims Actfrom the United States Attorney’s Office for the Eastern District of Pennsylvania. The Demand sought informationregarding allegations that fellowships had been offered to hospitals in exchange for agreements to purchase products.Synthes has produced documents and information in response to the Demand and is cooperating with the inquiry.
In October 2011, the European Commission (EC) announced that it opened an investigation concerning an agreementbetween Janssen-Cilag B.V. (Janssen-Cilag) and Sandoz B.V. relating to the supply of fentanyl patches in the Netherlandsand whether the agreement infringes European competition law. In January 2013, the EC issued a Statement ofObjections setting out facts regarding a potential violation of EU antitrust laws. Janssen-Cilag has submitted its responseto the Statement of Objections. In December 2013, the EC issued its decision imposing a fine of approximately€10.8 million on Janssen-Cilag. Janssen-Cilag will not appeal the decision.
In April 2012, Janssen Pharmaceuticals, Inc. (JPI) received a letter requesting certain documents from the United StatesDepartment of Justice relating to the marketing and promotion of DORIBAX®. In 2012, JPI provided documents and willcontinue to cooperate with any further inquiries if and when they are received.
In May 2012, Acclarent, Inc. (Acclarent) received a subpoena from the United States Attorney’s Office for the District ofMassachusetts requesting documents broadly relating to the sales, marketing and promotion by Acclarent of RELIEVASTRATUS™ MicroFlow Spacer products. Acclarent is cooperating with the United States Attorney’s Office in respondingto the subpoena.
In August 2012, DePuy Orthopaedics, Inc., DePuy, Inc. (now DePuy Synthes, Inc. (DePuy Synthes)), and Johnson &Johnson Services, Inc. received an informal request from the United States Attorney’s Office for the District ofMassachusetts and the Civil Division of the United States Department of Justice for the production of materials relating tothe ASR™ XL Hip device. The government has since made additional informal requests for the production of documents asto the device. The government is investigating whether any person or entity submitted or caused to be submitted falseclaims or false statements affecting federal health care programs in connection with the marketing and use of the ASR™XL Hip device. DePuy Orthopaedics, Inc., DePuy Synthes, and Johnson & Johnson Services, Inc. have voluntarily produceddocuments in response to the government’s informal requests and are fully cooperating with the government’s civilinvestigation. In addition, the Company has received Civil Investigative Demands from a group of state Attorneys Generalrelating to the development, sales and marketing of several of DePuy Orthopaedics, Inc.’s hip products. At least one stateAttorney General has informed the Company of the intention to investigate these matters independently of the multi-stategroup. The Company is responding to these demands.
In October 2012, Johnson & Johnson was contacted by the California Attorney General’s office regarding a multi-stateAttorney General investigation of the marketing of surgical mesh products for hernia and urogynecological purposes byJohnson & Johnson’s subsidiary, Ethicon, Inc. (Ethicon). Johnson & Johnson and Ethicon have since entered into a tollingagreement with the 44 states participating in the multi-state investigation and are in the process of responding to CivilInvestigative Demands served by certain of the participating states.
In December 2012, Therakos, Inc. (Therakos), formerly a subsidiary of Johnson & Johnson and part of the Ortho-ClinicalDiagnostics, Inc. (OCD) franchise, received a letter from the civil division of the United States Attorney’s Office for theEastern District of Pennsylvania informing Therakos that the United States Attorney’s Office was investigating the salesand marketing of UVADEX® (methoxsalen) and the UVAR XTS® System during the period 2000 to the present. TheUnited States Attorney’s Office requested that OCD and Johnson & Johnson preserve documents that could relate to theinvestigation. Therakos was subsequently acquired by an affiliate of Gores Capital Partners III, L.P. OCD and Johnson &Johnson retain certain liabilities that may result from the investigation for activity that occurred prior to the sale of Therakos,and have taken appropriate steps to retain potentially relevant documents and will cooperate with the United StatesAttorney’s Office’s investigation with respect to such activity.
In May 2013, Janssen Pharmaceuticals, Inc. (JPI) received a subpoena from the Atlanta Regional Office of the Departmentof Health and Human Services, Office of Inspector General, seeking production of documents and information regarding:(1) the sales, marketing and promotional practices, including the remuneration of healthcare providers, related to
64 • Johnson & Johnson 2013 Annual Report

NUCYNTA® IR and NUCYNTA® ER; and (2) any studies, reports and/or complaints regarding the safety and/or actual orpotential side effects of NUCYNTA® IR and NUCYNTA® ER. JPI is in the process of responding to the subpoena.
In recent years, Johnson & Johnson has received numerous requests from a variety of United States CongressionalCommittees to produce information relevant to ongoing congressional inquiries. It is the policy of Johnson & Johnson tocooperate with these inquiries by producing the requested information.
GENERAL LITIGATION
In June 2009, following the public announcement that Ortho-Clinical Diagnostics, Inc. (OCD) had received a grand jurysubpoena from the United States Department of Justice, Antitrust Division, in connection with an investigation that hassince been closed, multiple class action complaints were filed against OCD by direct purchasers seeking damages foralleged price fixing. These cases were consolidated for pre-trial purposes in the United States District Court for theEastern District of Pennsylvania as In re Blood Reagent Antitrust Litigation. In August 2012, the District Court granted amotion filed by Plaintiffs for class certification. In October 2012, the United States Court of Appeals for the Third Circuitgranted OCD’s petition for interlocutory review of the class certification ruling. Oral argument on the appeal was held inFebruary 2014 and the parties are awaiting a decision.
In September 2010, a shareholder, Ronald Monk, filed a lawsuit in the United States District Court for the District ofNew Jersey seeking class certification and alleging that Johnson & Johnson and certain individuals, including executiveofficers and employees of Johnson & Johnson, failed to disclose that a number of manufacturing facilities failed to maintaincurrent good manufacturing practices, and that as a result, the price of the Company’s stock declined significantly. Plaintiffsought to pursue remedies under the Securities Exchange Act of 1934 to recover his alleged economic losses. InDecember 2011, a motion by Johnson & Johnson to dismiss was granted in part and denied in part. Plaintiff moved theCourt to reconsider part of the December 2011 ruling. In May 2012, the Court denied Plaintiff’s motion for reconsideration.In September 2012, Plaintiff filed a Second Amended Complaint and Johnson & Johnson and the individual defendantsmoved to dismiss Plaintiff’s Second Amended Complaint in part. Following mediation, the parties reached an agreement inprinciple to settle the case, and in July 2013, filed for preliminary approval of the proposed settlement. In November 2013,the Court approved the settlement. Three parties that had objected to the settlement have appealed the Court’s approvalorders.
In April 2011, OMJ Pharmaceuticals, Inc. (OMJ PR) filed a lawsuit against the United States in United States District Courtfor the District of Puerto Rico alleging overpayment of federal income taxes for the tax years ended November 30, 1999and November 30, 2000. If OMJ PR loses this lawsuit, it may face liability for subsequent tax years. OMJ PR alleges thatthe Internal Revenue Service erroneously calculated OMJ PR’s tax credits under Section 936 of the Tax Code. OMJ PRfiled a motion for summary judgment, and the United States filed a cross motion for summary judgment. In October 2012,the Court granted a motion by the United States for summary judgment and denied a motion by OMJ PR for summaryjudgment. OMJ PR has appealed this decision. Oral argument was held in November 2013.
In August 2011, an arbitration panel ruled that Mitsubishi Tanabe Pharma Corporation (Tanabe), Janssen Biotech, Inc.’s(JBI’s) distributor of REMICADE® in Japan, could seek to modify the proportion of net sales revenue that Tanabe mustremit to JBI in exchange for distribution rights and commercial supply of REMICADE® (the Supply Price). Tanabecommenced the arbitration against Centocor Ortho Biotech, Inc. (now JBI) in 2009 pursuant to the parties’ distributionagreement, which grants Tanabe the right to distribute REMICADE® in Japan and certain other parts of Asia. JBIcounterclaimed for an increase in the Supply Price. A hearing was held in November 2011 to determine the appropriatesplit of revenue. In February 2013, the arbitration panel determined that the Supply Price should be modified in favor ofTanabe, and in July 2013 issued its Final Award. The Company previously accrued an amount to cover the impact of thearbitration decision.
In September 2011, Johnson & Johnson, Johnson & Johnson Inc. and McNeil Consumer Healthcare Division of Johnson &Johnson Inc. received a Notice of Civil Claim filed by Nick Field in the Supreme Court of British Columbia, Canada (theBC Civil Claim). The BC Civil Claim is a putative class action brought on behalf of persons who reside in British Columbiaand who purchased during the period between September 20, 2001 and the present one or more various McNeil infants’or children’s over-the-counter medicines that were manufactured at the Fort Washington facility. The BC Civil Claimalleges that the defendants violated the BC Business Practices and Consumer Protection Act, and other Canadianstatutes and common laws, by selling medicines that were allegedly not safe and/or effective or did not comply withCanadian Good Manufacturing Practices. The class certification hearing is scheduled for April 2014.
Johnson & Johnson or its subsidiaries are also parties to a number of proceedings brought under the ComprehensiveEnvironmental Response, Compensation, and Liability Act, commonly known as Superfund, and comparable state, local orforeign laws in which the primary relief sought is the cost of past and/or future remediation.
Johnson & Johnson 2013 Annual Report • 65

SHAREHOLDER DERIVATIVE ACTIONS
Starting in April 2010, a number of shareholder derivative lawsuits were filed in the United States District Court for theDistrict of New Jersey against certain current and former directors and officers of Johnson & Johnson. Johnson & Johnsonis named as a nominal defendant. These actions were consolidated in August 2010 into In re Johnson & JohnsonDerivative Litigation. Additionally, in September 2010, another shareholder derivative lawsuit was filed by Michael Wolin inNew Jersey Superior Court against certain current and former directors and officers of Johnson & Johnson. Johnson &Johnson is named as a nominal defendant in this action as well. The parties to this action have stipulated that it shall bestayed until the In re Johnson & Johnson Derivative Litigation is completely resolved.
Collectively, these shareholder derivative actions assert a variety of alleged breaches of fiduciary duties, including, amongother things, that the defendants allegedly engaged in, approved of, or failed to remedy or prevent defective medicaldevices, improper pharmaceutical rebates, improper off-label marketing of pharmaceutical and medical device products,violations of current good manufacturing practice regulations that resulted in product recalls, and that the defendantsfailed to disclose the aforementioned alleged misconduct in the Company’s filings under the Securities Exchange Act of1934. Each complaint seeks a variety of relief, including monetary damages and corporate governance reforms. Johnson &Johnson moved to dismiss these actions on the grounds, inter alia, that the plaintiffs failed to make a demand upon theBoard of Directors. In September 2011, In re Johnson & Johnson Derivative Litigation was dismissed without prejudiceand with leave to file an amended complaint.
Johnson & Johnson filed a report in the In re Johnson & Johnson Derivative Litigation matter in July 2011, prepared by aSpecial Committee of the Board of Directors of Johnson & Johnson (the Special Committee), which investigated theallegations contained in the derivative actions and in a number of shareholder demand letters that the Board of Directorsof Johnson & Johnson (the Board) received in 2010 raising similar issues. The Special Committee was assisted in itsinvestigation by independent counsel. The Special Committee’s report recommended: i) that Johnson & Johnson reject theshareholder demands and take whatever steps are necessary or appropriate to secure dismissal of the derivative litigation,and ii) that the Board create a new Regulatory and Compliance Committee charged with responsibility for monitoring andoversight of the Company’s Health Care Compliance and Quality & Compliance systems and issues. The Boardunanimously adopted the Special Committee’s recommendations, and in April 2012, the Board created the Regulatory,Compliance & Government Affairs Committee.
In August 2011, two shareholders who had submitted shareholder demand letters in 2010 filed shareholder derivativelawsuits in the United States District Court for the District of New Jersey naming various current and former officers anddirectors as defendants and challenging the Board’s rejection of their demands. In November 2011, the Courtconsolidated these two cases into Copeland v. Prince.
Two additional shareholder derivative lawsuits were filed in May 2011 in the United States District Court for the District ofNew Jersey, and two other shareholder derivative lawsuits were filed in New Jersey Superior Court in May 2011 andAugust 2011, all naming current directors of Johnson & Johnson as defendants and Johnson & Johnson as the nominaldefendant. The complaints allege breaches of fiduciary duties related to the Company’s compliance with the ForeignCorrupt Practices Act and participation in the United Nations Iraq Oil For Food Program, that the Company has suffereddamages as a result of those alleged breaches, and that the defendants failed to disclose the alleged misconduct in theCompany’s filings under the Securities Exchange Act of 1934. Plaintiffs seek monetary damages, and the state courtplaintiffs also seek corporate governance reforms. The federal lawsuits were consolidated in July 2011 into In re J&JFCPA Derivative Shareholder Litigation. The state lawsuits were consolidated in November 2011 into In re J&JShareholder Derivative Litigation. In May 2012, the Court granted a motion by Johnson & Johnson to stay the statelawsuits pending resolution of In re J&J FCPA Derivative Shareholder Litigation.
In July 2012, the parties in each of the shareholder derivative cases pending in federal court discussed above (specifically,In re Johnson & Johnson Derivative Litigation, Copeland v. Prince, and In re J&J FCPA Derivative Shareholder Litigation)filed a Stipulation of Settlement (the Settlement) to permanently resolve all of the actions in their entirety. In October 2012,the Settlement was approved by the United States District Court for the District of New Jersey. In November 2012, anotice of appeal was filed in the United States Court of Appeals for the Third Circuit by a shareholder who objected to theapproval of the Settlement in the District Court on the grounds that the lawsuit and the Settlement did not provide anybenefit to the Company, and that plaintiffs’ counsel had requested an excessive fee award. The appellant requested a stayof the proceeding pending a decision from the District Court concerning the fee award. The Third Circuit granted a stay ofthe proceedings. In November 2013, the District Court entered its order concerning the fee award. In January 2014, theappellant moved to voluntarily dismiss the appeal with prejudice and the Third Circuit dismissed the appeal.
66 • Johnson & Johnson 2013 Annual Report

In September 2011, two additional shareholder derivative lawsuits were filed in the United States District Court for theDistrict of New Jersey by Donovan Spamer and The George Leon Family Trust naming current and former directors ofJohnson & Johnson as defendants and Johnson & Johnson as the nominal defendant. These lawsuits allege that thedefendants breached their fiduciary duties in their decisions with respect to the compensation of the Chief ExecutiveOfficer during the period from 2008 through 2011, and that the defendants made misleading statements in theCompany’s annual proxy statements. Both of these lawsuits were voluntarily dismissed without prejudice, but a similarlawsuit, The George Leon Family Trust v. Coleman, was refiled in July 2012. That lawsuit seeks a variety of relief, includingmonetary damages, injunctive relief, and corporate governance reforms. The Settlement, described above, does notresolve these potential claims. In June 2013, the Board of Directors of Johnson & Johnson (the Board) received a reportprepared by special, independent counsel to the Board, which investigated the allegations contained in the derivativeactions filed by Donovan Spamer and by The George Leon Family Trust, and in several shareholder demand letters thatthe Board received in 2011 and 2012 raising similar issues. The report recommended that Johnson & Johnson reject theshareholder demands and take whatever steps are necessary or appropriate to secure dismissal of the derivative litigation.The Board unanimously adopted the report’s recommendations.
In September 2013, Johnson & Johnson moved to dismiss or, in the alternative, for summary judgment in The GeorgeLeon Family Trust v. Coleman, based upon the Board’s determination. In October 2013 the plaintiff in the Leon litigationfiled an amended complaint. In November 2013, Johnson & Johnson moved to dismiss the amended complaint or, in thealternative, for summary judgment, based upon the Board’s determination.
22. Restructuring
In 2011, Cordis Corporation, a subsidiary of Johnson & Johnson, announced the discontinuation of its clinical developmentprogram for the NEVO™ Sirolimus-Eluting Coronary Stent and cessation of the manufacture and marketing of CYPHER®
and CYPHER SELECT® Plus Sirolimus-Eluting Coronary Stents by the end of 2011. The Company recorded a pre-taxcharge of $0.7 billion, of which $0.1 billion was included in cost of products sold. The Cordis restructuring program hasbeen substantially completed. The restructuring charge was recorded in the Medical Devices and Diagnostics segment.
Johnson & Johnson 2013 Annual Report • 67

Report of Independent Registered PublicAccounting FirmTo the Shareholders and Board of Directors of Johnson & Johnson:
In our opinion, the accompanying consolidated balance sheets and the related consolidated statements of earnings,statements of comprehensive income, statements of equity, and statements of cash flows present fairly, in all materialrespects, the financial position of Johnson & Johnson and its subsidiaries at December 29, 2013 and December 30, 2012,and the results of their operations and their cash flows for each of the three years in the period ended December 29, 2013in conformity with accounting principles generally accepted in the United States of America. Also in our opinion, theCompany maintained, in all material respects, effective internal control over financial reporting as of December 29, 2013,based on criteria established in Internal Control – Integrated Framework (1992) issued by the Committee of SponsoringOrganizations of the Treadway Commission (COSO). The Company’s management is responsible for these financialstatements, for maintaining effective internal control over financial reporting and for its assessment of the effectiveness ofinternal control over financial reporting, included in the accompanying “Management’s Report on Internal Control overFinancial Reporting.” Our responsibility is to express opinions on these financial statements and on the Company’s internalcontrol over financial reporting based on our integrated audits. We conducted our audits in accordance with the standardsof the Public Company Accounting Oversight Board (United States). Those standards require that we plan and performthe audits to obtain reasonable assurance about whether the financial statements are free of material misstatement andwhether effective internal control over financial reporting was maintained in all material respects. Our audits of the financialstatements included examining, on a test basis, evidence supporting the amounts and disclosures in the financialstatements, assessing the accounting principles used and significant estimates made by management, and evaluating theoverall financial statement presentation. Our audit of internal control over financial reporting included obtaining anunderstanding of internal control over financial reporting, assessing the risk that a material weakness exists, and testingand evaluating the design and operating effectiveness of internal control based on the assessed risk. Our audits alsoincluded performing such other procedures as we considered necessary in the circumstances. We believe that our auditsprovide a reasonable basis for our opinions.
A company’s internal control over financial reporting is a process designed to provide reasonable assurance regarding thereliability of financial reporting and the preparation of financial statements for external purposes in accordance withgenerally accepted accounting principles. A company’s internal control over financial reporting includes those policies andprocedures that (i) pertain to the maintenance of records that, in reasonable detail, accurately and fairly reflect thetransactions and dispositions of the assets of the company; (ii) provide reasonable assurance that transactions arerecorded as necessary to permit preparation of financial statements in accordance with generally accepted accountingprinciples, and that receipts and expenditures of the company are being made only in accordance with authorizations ofmanagement and directors of the company; and (iii) provide reasonable assurance regarding prevention or timely detectionof unauthorized acquisition, use, or disposition of the company’s assets that could have a material effect on the financialstatements.
Because of its inherent limitations, internal control over financial reporting may not prevent or detect misstatements. Also,projections of any evaluation of effectiveness to future periods are subject to the risk that controls may become inadequatebecause of changes in conditions, or that the degree of compliance with the policies or procedures may deteriorate.
PricewaterhouseCoopers LLP
New York, New YorkFebruary 21, 2014
68 • Johnson & Johnson 2013 Annual Report
Management’s Report on Internal ControlOver Financial ReportingUnder Section 404 of the Sarbanes-Oxley Act of 2002, management is required to assess the effectiveness of theCompany’s internal control over financial reporting as of the end of each fiscal year and report, based on that assessment,whether the Company’s internal control over financial reporting is effective.
Management of the Company is responsible for establishing and maintaining adequate internal control over financialreporting. The Company’s internal control over financial reporting is designed to provide reasonable assurance as to thereliability of the Company’s financial reporting and the preparation of external financial statements in accordance withgenerally accepted accounting principles.
Internal controls over financial reporting, no matter how well designed, have inherent limitations. Therefore, internal controlover financial reporting determined to be effective can provide only reasonable assurance with respect to financialstatement preparation and may not prevent or detect all misstatements. Moreover, projections of any evaluation ofeffectiveness to future periods are subject to the risk that controls may become inadequate because of changes inconditions, or that the degree of compliance with the policies or procedures may deteriorate.
The Company’s management has assessed the effectiveness of the Company’s internal control over financial reporting asof December 29, 2013. In making this assessment, the Company used the criteria established by the Committee ofSponsoring Organizations of the Treadway Commission (COSO) in “Internal Control-Integrated Framework (1992).”These criteria are in the areas of control environment, risk assessment, control activities, information and communication,and monitoring. The Company’s assessment included extensive documenting, evaluating and testing the design andoperating effectiveness of its internal controls over financial reporting.
Based on the Company’s processes and assessment, as described above, management has concluded that, as ofDecember 29, 2013, the Company’s internal control over financial reporting was effective.
The effectiveness of the Company’s internal control over financial reporting as of December 29, 2013 has been audited byPricewaterhouseCoopers LLP, an independent registered public accounting firm, as stated in their report, which appearsherein.
Alex Gorsky Dominic J. CarusoChairman, Board of Directors Vice President, FinanceChief Executive Officer Chief Financial Officer
Johnson & Johnson 2013 Annual Report • 69

Summary of Operations and Statistical Data2003-2013(Dollars in Millions Except Per ShareAmounts) 2013 2012 2011 2010 2009 2008 2007 2006 2005 2004 2003
Sales to customers – U.S. $31,910 29,830 28,908 29,450 30,889 32,309 32,444 29,775 28,377 27,770 25,274
Sales to customers – International 39,402 37,394 36,122 32,137 31,008 31,438 28,651 23,549 22,137 19,578 16,588
Total sales 71,312 67,224 65,030 61,587 61,897 63,747 61,095 53,324 50,514 47,348 41,862
Cost of products sold 22,342 21,658 20,360 18,792 18,447 18,511 17,751 15,057 14,010 13,474 12,231
Selling, marketing and administrative expenses 21,830 20,869 20,969 19,424 19,801 21,490 20,451 17,433 17,211 16,174 14,463
Research and development expense 8,183 7,665 7,548 6,844 6,986 7,577 7,680 7,125 6,462 5,344 4,834
In-process research and development 580 1,163 – – – 181 807 559 362 18 918
Interest income (74) (64) (91) (107) (90) (361) (452) (829) (487) (195) (177)
Interest expense, net of portion capitalized 482 532 571 455 451 435 296 63 54 187 207
Other (income) expense, net 2,498 1,626 2,743 (768) (526) (1,015) 534 (671) (214) 15 (385)
Restructuring – – 569 – 1,073 – 745 – – – –
55,841 53,449 52,669 44,640 46,142 46,818 47,812 38,737 37,398 35,017 32,091
Earnings before provision for taxes on income $15,471 13,775 12,361 16,947 15,755 16,929 13,283 14,587 13,116 12,331 9,771
Provision for taxes on income 1,640 3,261 2,689 3,613 3,489 3,980 2,707 3,534 3,056 4,151 2,923
Net earnings 13,831 10,514 9,672 13,334 12,266 12,949 10,576 11,053 10,060 8,180 6,848
Add: Net loss attributable to noncontrollinginterest – 339 – – – – – – – – –
Net earnings attributable to Johnson &Johnson 13,831 10,853 9,672 13,334 12,266 12,949 10,576 11,053 10,060 8,180 6,848
Percent of sales to customers 19.4% 16.1 14.9 21.7 19.8 20.3 17.3 20.7 19.9 17.3 16.4
Diluted net earnings per share of common stock(1) $4.81 3.86 3.49 4.78 4.40 4.57 3.63 3.73 3.35 2.74 2.29
Percent return on average shareholders’ equity 19.9% 17.8 17.0 24.9 26.4 30.2 25.6 28.3 28.2 27.3 27.1
Percent increase (decrease) over previousyear:
Sales to customers 6.1% 3.4 5.6 (0.5) (2.9) 4.3 14.6 5.6 6.7 13.1 15.3
Diluted net earnings per share 24.6% 10.6 (27.0) 8.6 (3.7) 25.9 (2.7) 11.3 22.3 19.7 11.2
Supplementary balance sheet data:
Property, plant and equipment, net 16,710 16,097 14,739 14,553 14,759 14,365 14,185 13,044 10,830 10,436 9,846
Additions to property, plant and equipment 3,595 2,934 2,893 2,384 2,365 3,066 2,942 2,666 2,632 2,175 2,262
Total assets 132,683 121,347 113,644 102,908 94,682 84,912 80,954 70,556 58,864 54,039 48,858
Long-term debt 13,328 11,489 12,969 9,156 8,223 8,120 7,074 2,014 2,017 2,565 2,955
Operating cash flow 17,414 15,396 14,298 16,385 16,571 14,972 15,022 14,248 11,799 11,089 10,571
Common stock information
Dividends paid per share $2.590 2.400 2.250 2.110 1.930 1.795 1.620 1.455 1.275 1.095 0.925
Shareholders’ equity per share 26.25 23.33 20.95 20.66 18.37 15.35 15.25 13.59 13.01 10.95 9.25
Market price per share (year-end close) $92.35 69.48 65.58 61.85 64.41 58.56 67.38 66.02 60.10 63.42 50.62
Average shares outstanding (millions)
– basic 2,809.2 2,753.3 2,736.0 2,751.4 2,759.5 2,802.5 2,882.9 2,936.4 2,973.9 2,968.4 2,968.1
– diluted 2,877.0 2,812.6 2,775.3 2,788.8 2,789.1 2,835.6 2,910.7 2,961.0 3,002.8 2,992.7 2,995.1
Employees (thousands) 128.1 127.6 117.9 114.0 115.5 118.7 119.2 122.2 115.6 109.9 110.6
(1) Attributable to Johnson & Johnson.
70 • Johnson & Johnson 2013 Annual Report

Shareholder Return Performance GraphsSet forth below are line graphs comparing the cumulative total shareholder return on the Company’s Common Stock forperiods of five years and ten years ending December 31, 2013, against the cumulative total return of the Standard &Poor’s 500 Stock Index, the Standard & Poor’s Pharmaceutical Index and the Standard & Poor’s Health Care EquipmentIndex. The graphs and tables assume that $100 was invested on December 31, 2008 and December 31, 2003 in each ofthe Company’s Common Stock, the Standard & Poor’s 500 Stock Index, the Standard & Poor’s Pharmaceutical Index andthe Standard & Poor’s Health Care Equipment Index and that all dividends were reinvested.
5-Year Cumulative Total Shareholder Return
$235
$205
$175
$145
Johnson & Johnson
S&P 500 Index
S&P Pharmaceu�cal Index
$115
S&P Healthcare EquipmentIndex
5-Year CAGR
$852008 2009 2010 2011 2012 2013
J&JS&P 500S&P PharmS&P H/C Equip
12.6%17.9%16.8%13.2%
2008 2009 2010 2011 2012 2013
Johnson & Johnson $100.00 111.28 110.63 121.57 134.70 181.33
S&P 500 Index $100.00 126.47 145.52 148.59 172.37 228.17
S&P 500 Pharmaceutical Index $100.00 118.61 119.53 140.76 161.06 217.80
S&P 500 Healthcare Equipment Index $100.00 128.78 125.29 124.29 145.76 186.11
10-Year Cumulative Total Shareholder Return
$240
$220
$200
$180
$160
$140
Johnson & Johnson
S&P 500 Index
S&P Pharmaceu�cal Index
$120
S&P Healthcare EquipmentIndex
10-Year CAGR
$802003 2004 2005 2006 2007 2008 2009 2010 2011 2012 2013
J&JS&P 500S&P PharmS&P H/C Equip
8.9%7.4%6.8%5.2%
$100
2003 2004 2005 2006 2007 2008 2009 2010 2011 2012 2013
Johnson & Johnson $100.00 125.17 120.96 136.02 140.93 129.98 144.64 143.79 158.02 175.08 235.59
S&P 500 Index $100.00 110.88 116.32 134.69 142.09 89.52 113.21 130.27 133.02 154.30 204.26
S&P 500 Pharmaceutical Index $100.00 92.57 89.46 103.64 108.46 88.73 105.24 106.05 124.89 142.91 193.25
S&P 500 Healthcare Equipment Index $100.00 112.62 112.68 117.33 123.35 89.25 114.94 111.82 110.93 130.09 166.10
Johnson & Johnson 2013 Annual Report • 71

Reconciliation of Non-GAAP Financial Measures
The tables below are provided to reconcile certain financial disclosures in the 2013 Chairman’s Letter.% Change
(Dollars in Millions Except Per Share Data) 2013 2012 2011 ’13 vs. ’12 ’12 vs. ’11Earnings before provision for taxes on income – as reported $15,471 13,775 12,361 12.3% 11.4Litigation expenses 2,282 1,229 3,310In-process research and development 580 1,163 14Synthes integration/transaction costs and currency related 683 1,028 491Intangible asset write-downs – 939 –DePuy ASR™ Hip program 251 110 521Restructuring expense – – 656Other (98) (30) –Earnings before provision for taxes on income – as adjusted $19,169 18,214 17,353 5.2% 5.0Net Earnings attributable to Johnson & Johnson – as reported $13,831 10,853 9,672 27.4% 12.2Litigation expenses 1,646 1,052 2,745In-process research and development 462 743(1) 11Synthes integration/transaction costs and currency related 483 899 477Intangible asset write-downs – 717 –DePuy ASR™ Hip program 240 97 426Restructuring expense – – 536Scios tax benefit (707) – –Other (79) (16) –Net Earnings attributable to Johnson & Johnson – as adjusted $15,876 14,345 13,867 10.7% 3.4Diluted Net Earnings per share attributable to Johnson & Johnson – as reported $4.81 3.86 3.49 24.6% 10.6Litigation expenses 0.57 0.37 0.99In-process research and development 0.16 0.27 –Synthes integration/transaction costs and currency related 0.17 0.32 0.17Intangible asset write-downs – 0.26 –DePuy ASR™ Hip program 0.08 0.03 0.16Restructuring expense – – 0.19Scios tax benefit (0.25) – –Other (0.02) (0.01) –Diluted Net Earnings per share attributable to Johnson & Johnson – as adjusted $5.52 5.10 5.00 8.2% 2.0
(1) Amount includes third quarter in-process research and development charge of $679 million related to bapineuzumab lV offset by $339 million reportedas net loss attributable to noncontrolling interest
% Change
(Dollars in Millions) 2013 2012 2011 ’13 vs. ’12 ’12 vs. ’11Net cash flows from operating activities $17,414 15,396 14,298Additions to property, plant and equipment (3,595) (2,934) (2,893)Free Cash Flow $13,819 12,462 11,405 10.9% 9.3
The Company provides earnings before provision for taxes on income, net earnings attributable to Johnson & Johnson, netearnings per share attributable to Johnson & Johnson (diluted) and net cash flows from operating activities on an adjustedbasis because management believes that these measures provide useful information to investors. Among other things,these measures may assist investors in evaluating the Company's results of operations period over period. In variousperiods, these measures may exclude such items as significant costs associated with acquisitions, restructuring, litigation,and changes in applicable laws and regulations (including significant accounting or tax matters). These special items maybe highly variable, difficult to predict, and of a size that sometimes has substantial impact on the Company's reportedresults of operations for a period. Management uses these measures internally for planning, forecasting and evaluating theperformances of the Company's businesses, including allocating resources and evaluating results relative to employeeperformance compensation targets. Unlike earnings before provision for taxes on income, net earnings attributable toJohnson & Johnson, net earnings per share attributable to Johnson & Johnson (diluted) and cash flows from operatingactivities prepared in accordance with GAAP, adjusted earnings before provision for taxes on income, adjusted netearnings attributable to Johnson & Johnson, adjusted net earnings per share attributable to Johnson & Johnson (diluted)and free cash flow may not be comparable with the calculation of similar measures for other companies. These non-GAAPfinancial measures are presented solely to permit investors to more fully understand how management assesses theperformance of the Company. The limitations of using these non-GAAP financial measures as performance measures arethat they provide a view of the Company's results of operations without including all events during a period, such as theeffects of an acquisition, restructuring, litigation, and changes in applicable laws and regulations (including significantaccounting or tax matters) and do not provide a comparable view of the Company's performance to other companies inthe health care industry. Investors should consider non-GAAP financial measures in addition to, and not as replacementsfor, or superior to, measures of financial performance prepared in accordance with GAAP.
72 • Johnson & Johnson 2013 Annual Report
PRINCIPAL OFFICE COMMON STOCK JOHNSON & JOHNSON ONLINE
One Johnson & Johnson PlazaNew Brunswick, New Jersey 08933(732) 524-0400
ANNUAL MEETING
The Annual Meeting of Shareholders will takeplace on Thursday, April 24, 2014, at theHyatt Regency Hotel, Two Albany Street, NewBrunswick, New Jersey. The meeting willconvene at 10 a.m. (Eastern). All shareholdersas of the record date of February 25, 2014 arecordially invited to attend. A formal Notice ofAnnual Meeting, Proxy Statement and Proxyhave been sent to shareholders.
CORPORATE GOVERNANCE
Copies of our 2013 Annual Report onForm 10-K, Quarterly Reports on Form 10-Q,and Current Reports on Form 8-K to theSecurities and Exchange Commission, ProxyStatement, and this Annual Report areavailable online at www.investor.jnj.com/sec-filings.cfm, or to shareholders withoutcharge, upon written request to the Office ofthe Corporate Secretary at our principaladdress, or by calling (800) 950-5089.
In addition, on the Corporate Governancesection of our website, www.investor.jnj.com,shareholders can view our Restated Certificateof Incorporation; By-Laws; Principles ofCorporate Governance; Charters of the AuditCommittee, Compensation & BenefitsCommittee, Nominating & CorporateGovernance Committee, Regulatory,Compliance & Government AffairsCommittee, and Science, Technology &Sustainability Committee; Policy on BusinessConduct (for employees); Code of BusinessConduct & Ethics for Members of the Boardof Directors and Executive Officers; and othercorporate governance materials. Copies ofthese documents are available to shareholderswithout charge upon written request to theSecretary at our principal address.
Under Section 302 of the Sarbanes-Oxley Act,we are required to file certifications signed bythe Chief Executive Officer and the ChiefFinancial Officer as Exhibits to our Form 10-Kor Form 10-Q for each fiscal year or quarter.In addition, we are required to submit acertification signed by the Chief ExecutiveOfficer to the New York Stock Exchangewithin 30 days following the Annual Meetingof Shareholders. Copies of the certificationsfiled for previous years are posted on theCorporate Governance section of our website,and future certifications will be postedpromptly upon filing.
Listed on New York Stock ExchangeStock Symbol: JNJ
SHAREHOLDER RELATIONS CONTACT
Douglas K. ChiaCorporate Secretary(732) 524-2455
INVESTOR RELATIONS CONTACT
Louise MehrotraVice President, Investor Relations(800) 950-5089(732) 524-6492
TRANSFER AGENT AND REGISTRAR
Questions regarding stock holdings, certificate replace-ment/transfer, dividends and address changes shouldbe directed to:
Our website: www.jnj.com
http://www.jnj.com/our-news-center
http://www.blogjnj.com/
www.facebook.com/jnj
www.twitter.com/JNJCareswww.twitter.com/JNJNewshttps://twitter.com/JNJInnovation
www.youtube.com/jnj
http://www.linkedin.com/company/johnson-&-johnson
ComputershareP.O. BOX 30170College Station, TX 77842-3170
Overnight correspondence should be sent to:Computershare211 Quality Circle, Suite 210College Station, TX 77845
Shareholder websitewww.computershare.com/investor
Shareholder online inquirieshttps://www-us.computershare.com/investor/Contact
DIVIDEND REINVESTMENT PLAN
The Plan allows for full or partial dividendreinvestment and additional monthly cash investmentsup to $50,000 per year in Johnson & JohnsonCommon Stock without brokerage commissions orservice charges on stock purchases. If you areinterested in participating in the Plan and need anauthorization form and/or more information, pleasecall Computershare Trust Company, N.A. at(800) 328-9033 or (781) 575-2718 (outside the U.S.).
HEARING IMPAIRED
Shareholders who have inquiries regarding stock-related matters can communicate directly withComputershare Trust Company, N.A. via atelecommunications device (TDD). The telephonenumber for this service is (800) 952-9245 or (781) 575-2692 (outside the U.S.).
ELECTRONIC DELIVERY NOTIFICATION
The Proxy Statement and our 2013 Annual Report areavailable on our website at www.investor.jnj.com/annual-reports.cfm. Shareholders who are stillreceiving paper copies of our Proxy Statement andAnnual Report by mail can elect to receive instead ane-mail message that will provide a link to thosedocuments on the Internet. Shareholders who holdtheir shares in their own name may enroll in theelectronic proxy and Annual Report access service forfuture Annual Meetings of Shareholders online at:www.computershare-na.com/green.
Shareholders that hold their shares beneficially in“street name” (that is, in the name of a bank, broker orother holder of record) who wish to enroll forelectronic access may register for online delivery ofmaterials by going to: enroll.icsdeliver.com/jnj.
To view the 2013 Johnson & Johnson AnnualReport,please go to www.2013annualreport.jnj.comor scan this QR code.
The Johnson & Johnson Annual Reportcontains many of the valuable trademarks andtrade names owned and used by the Johnson &Johnson Family of Companies in the UnitedStates and internationally to distinguishproducts and services of outstanding quality.©Johnson & Johnson 2014
S H A R E H O L D E R I N F O R M A T I O N

Our Credo
We believe our first responsibility is to the doctors, nurses and patients,
to mothers and fathers and all others who use our products and
services. In meeting their needs everything we do must be of high
quality. We must constantly strive to reduce our costs in order to
maintain reasonable prices. Customers’ orders must be serviced
promptly and accurately. Our suppliers and distributors must have an
opportunity to make a fair profit.
We are responsible to our employees, the men and women who work
with us throughout the world. Everyone must be considered as an
individual. We must respect their dignity and recognize their merit. They
must have a sense of security in their jobs. Compensation must be fair
and adequate, and working conditions clean, orderly and safe. We must
be mindful of ways to help our employees fulfill their family
responsibilities. Employees must feel free to make suggestions and
complaints. There must be equal opportunity for employment,
development and advancement for those qualified. We must provide
competent management, and their actions must be just and ethical.
We are responsible to the communities in which we live and work and
to the world community as well. We must be good citizens — support
good works and charities and bear our fair share of taxes. We must
encourage civic improvements and better health and education. We
must maintain in good order the property we are privileged to use,
protecting the environment and natural resources.
Our final responsibility is to our stockholders. Business must make a
sound profit. We must experiment with new ideas. Research must be
carried on, innovative programs developed and mistakes paid for. New
equipment must be purchased, new facilities provided and new
products launched. Reserves must be created to provide for adverse
times. When we operate according to these principles, the
stockholders should realize a fair return.
One Johnson & Johnson Plaza, New Brunswick, New Jersey 08933


