Today, more than one in three American households live in rental housing—an increase of some 4 million since 2007 as homeownership has dropped amid the foreclosure crisis, ongoing affordability problems, and longer-term demographic factors. While renters represent a broad cross-section of the population, they tend to have lower incomes than owners. And going forward, growing shares of renters will be made up of younger single-parent and older single-person families—house- holds that often have the limited income- earning capacity that makes it difficult to secure decent housing. Like the families that live in rental units, multifamily properties come in a variety of configurations, from smaller buildings with fewer than 10 apartments to complexes of several commonly financed buildings with 50 or more units. Ownership of these prop- erties is also diverse, and includes individu- als, institutions, and public entities, includ- ing local public housing agencies. PRE-RECESSION SHIFTS IN INDUSTRY STRUCTURE In the period leading up to the Great Recession, innovation in mortgage finance and the rise of a host of new and sophis- ticated nonbank lenders and institutional investors helped to spark a surge in mul- tifamily lending. In combination, the stan- dardization of underwriting criteria and the growing share of multifamily mort- gage debt held in mortgage-backed securi- ties (MBS), along with favorable tax treat- ment of commercial and multifamily real estate, spurred the emergence of a num- ber of mortgage lending giants, expanded access to a less expensive supply of capital for multifamily developers, and provided better diversification for investors. Once the domain of smaller community- based banks and thrifts, the multifam- ily lending industry became increasingly concentrated during this period (Figure 1). Combining Home Mortgage Disclosure Act (HMDA) data with results from its own surveys of large capital providers, the Mortgage Bankers Association (MBA) found that 2,761 lenders originated 50,959 multi- family loans in 2006, with a total value of $138.0 billion and an average loan size of $2.7 million. Measured by volume, the 10 largest insti- tutions collectively originated $63.0 billion in multifamily loans, or more than 45 per- cent of the total. On a dollar basis, the top 51 firms provided more than three-quar- AMERICA’S RENTAL HOUSING The nation’s multifamily rental inventory—consisting of 20 million privately owned apartments in buildings with five or more units— is financed under a set of rules, regulations, and institutional arrangements referred to as the multifamily finance market. This report assesses recent trends in both equity and debt financing of this valuable housing resource in the wake of the Great Recession. In particular, the following sections examine the diversity of investors in multifamily projects, the growing dominance of large lenders, the reforms under discussion to redefine the government’s role in housing markets, and the risks that tax reform poses to affordable housing initiatives. The Changing Landscape for Multifamily Finance WILLIAM C. APGAR AND ELIZABETH LA JEUNESSE RESEARCH BRIEF 13–1 | DECEMBER 2013 JOINT CENTER FOR HOUSING STUDIES OF HARVARD UNIVERSITY 1
Transcript
Today, more than one in three American
households live in rental housing—an
increase of some 4 million since 2007 as
homeownership has dropped amid the
foreclosure crisis, ongoing affordability
problems, and longer-term demographic
factors. While renters represent a broad
cross-section of the population, they tend
to have lower incomes than owners. And
going forward, growing shares of renters
will be made up of younger single-parent
and older single-person families—house-
holds that often have the limited income-
earning capacity that makes it difficult to
secure decent housing.
Like the families that live in rental units,
multifamily properties come in a variety of
configurations, from smaller buildings with
fewer than 10 apartments to complexes of
several commonly financed buildings with
50 or more units. Ownership of these prop-
erties is also diverse, and includes individu-
als, institutions, and public entities, includ-
ing local public housing agencies.
PRE-RECESSION SHIFTS IN INDUSTRY STRUCTUREIn the period leading up to the Great
Recession, innovation in mortgage finance
and the rise of a host of new and sophis-
ticated nonbank lenders and institutional
investors helped to spark a surge in mul-
tifamily lending. In combination, the stan-
dardization of underwriting criteria and
the growing share of multifamily mort-
gage debt held in mortgage-backed securi-
ties (MBS), along with favorable tax treat-
ment of commercial and multifamily real
estate, spurred the emergence of a num-
ber of mortgage lending giants, expanded
access to a less expensive supply of capital
for multifamily developers, and provided
better diversification for investors.
Once the domain of smaller community-
based banks and thrifts, the multifam-
ily lending industry became increasingly
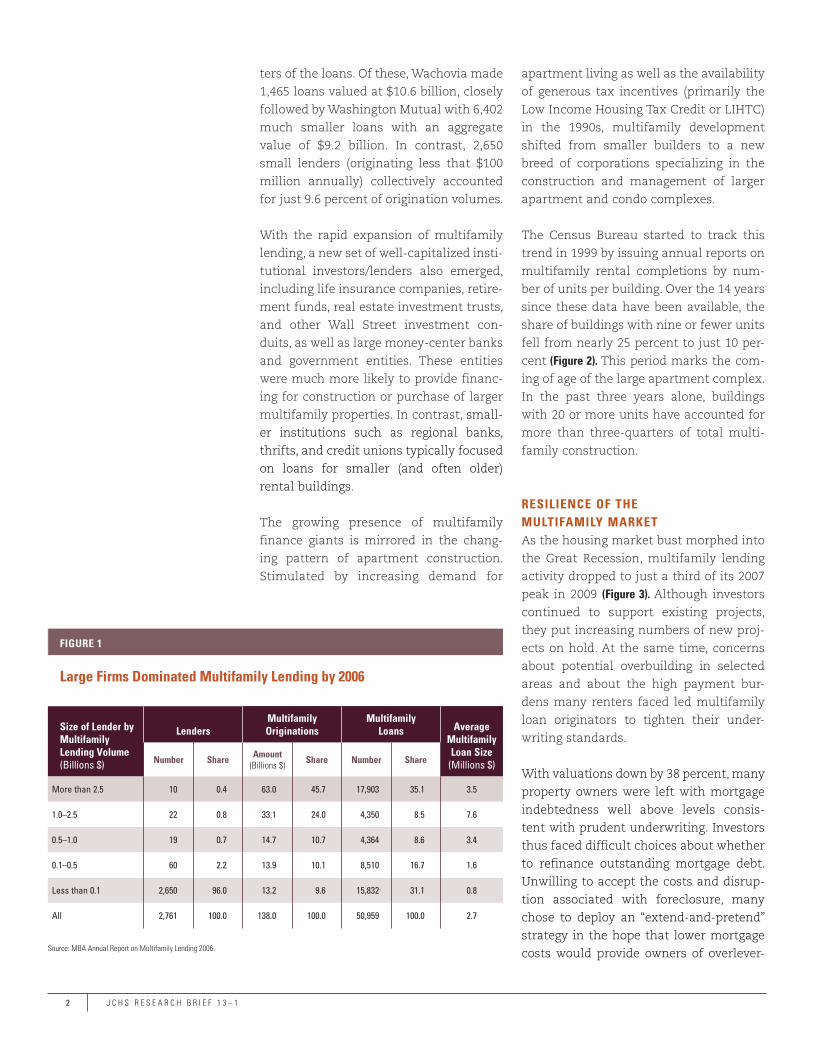
concentrated during this period (Figure 1). Combining Home Mortgage Disclosure
Act (HMDA) data with results from its
own surveys of large capital providers, the
Mortgage Bankers Association (MBA) found
that 2,761 lenders originated 50,959 multi-
family loans in 2006, with a total value of
$138.0 billion and an average loan size of
$2.7 million.
Measured by volume, the 10 largest insti-
tutions collectively originated $63.0 billion
in multifamily loans, or more than 45 per-
cent of the total. On a dollar basis, the top
51 firms provided more than three-quar-
AMERICA’S RENTAL HOUSING
The nation’s multifamily rental
inventory—consisting of 20 million
privately owned apartments in
buildings with five or more units—
is financed under a set of rules,
regulations, and institutional
arrangements referred to as the
multifamily finance market. This
report assesses recent trends in
both equity and debt financing of
this valuable housing resource in
the wake of the Great Recession.
In particular, the following
sections examine the diversity
of investors in multifamily
projects, the growing dominance
of large lenders, the reforms
under discussion to redefine the
government’s role in housing
markets, and the risks that tax
reform poses to affordable
housing initiatives.
The Changing Landscape for Multifamily Finance WILLIAM C. APGAR AND ELIZABETH LA JEUNESSE
R E S E A R C H B R I E F 1 3 – 1 | D E C E M B E R 2 0 1 3
J O I N T C E N T E R F O R H O U S I N G S T U D I E S O F H A R V A R D U N I V E R S I T Y
1
ters of the loans. Of these, Wachovia made
1,465 loans valued at $10.6 billion, closely
followed by Washington Mutual with 6,402
much smaller loans with an aggregate
value of $9.2 billion. In contrast, 2,650
small lenders (originating less that $100
million annually) collectively accounted
for just 9.6 percent of origination volumes.
With the rapid expansion of multifamily
lending, a new set of well-capitalized insti-
tutional investors/lenders also emerged,
including life insurance companies, retire-
ment funds, real estate investment trusts,
and other Wall Street investment con-
duits, as well as large money-center banks
and government entities. These entities
were much more likely to provide financ-
ing for construction or purchase of larger
multifamily properties. In contrast, small-
er institutions such as regional banks,
thrifts, and credit unions typically focused
on loans for smaller (and often older)
rental buildings.
The growing presence of multifamily
finance giants is mirrored in the chang-
ing pattern of apartment construction.
Stimulated by increasing demand for
apartment living as well as the availability
of generous tax incentives (primarily the
Low Income Housing Tax Credit or LIHTC)
in the 1990s, multifamily development
shifted from smaller builders to a new
breed of corporations specializing in the
construction and management of larger
apartment and condo complexes.
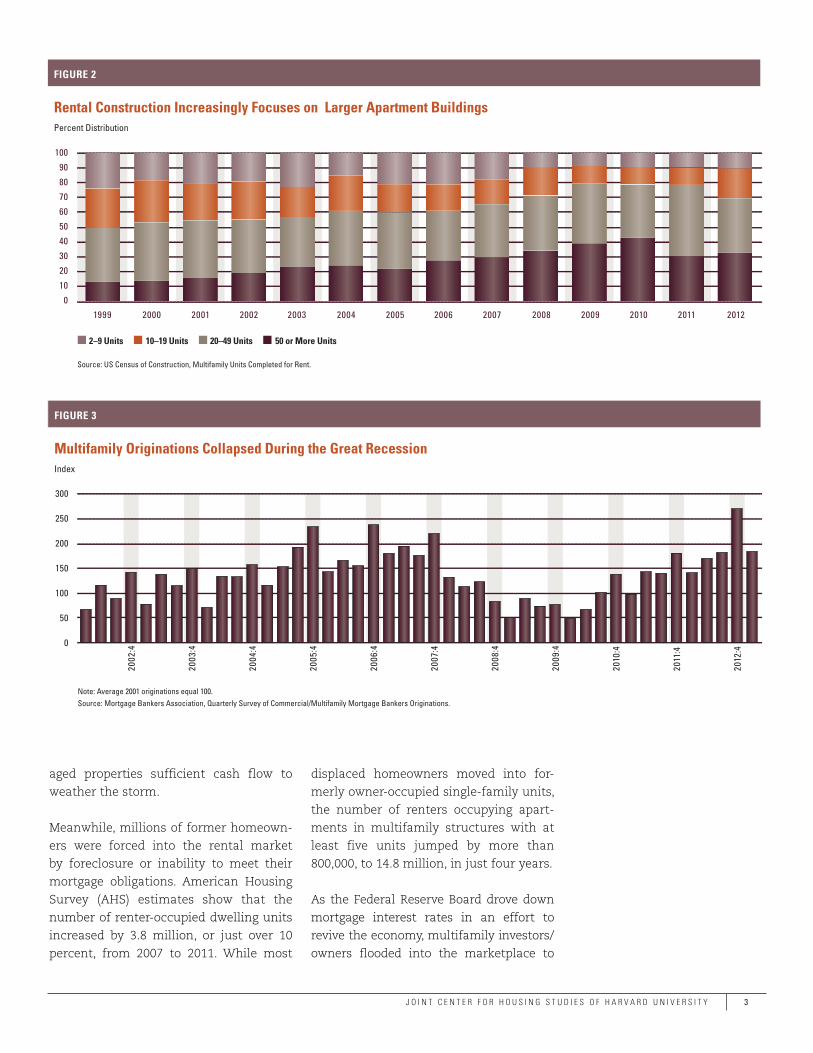
The Census Bureau started to track this
trend in 1999 by issuing annual reports on
multifamily rental completions by num-
ber of units per building. Over the 14 years
since these data have been available, the
share of buildings with nine or fewer units
fell from nearly 25 percent to just 10 per-
cent (Figure 2). This period marks the com-
ing of age of the large apartment complex.
In the past three years alone, buildings
with 20 or more units have accounted for
more than three-quarters of total multi-
family construction.
RESILIENCE OF THE MULTIFAMILY MARKETAs the housing market bust morphed into
the Great Recession, multifamily lending
activity dropped to just a third of its 2007
peak in 2009 (Figure 3). Although investors
continued to support existing projects,
they put increasing numbers of new proj-
ects on hold. At the same time, concerns
about potential overbuilding in selected
areas and about the high payment bur-
dens many renters faced led multifamily
loan originators to tighten their under-
writing standards.
With valuations down by 38 percent, many
property owners were left with mortgage
indebtedness well above levels consis-
tent with prudent underwriting. Investors
thus faced difficult choices about whether
to refinance outstanding mortgage debt.
Unwilling to accept the costs and disrup-
tion associated with foreclosure, many
chose to deploy an “extend-and-pretend”
strategy in the hope that lower mortgage
costs would provide owners of overlever-
Size of Lender by Multifamily Lending Volume (Billions $)
LendersMultifamily Originations
Multifamily Loans Average
Multifamily Loan Size
(Millions $)Number Share Amount (Billions $) Share Number Share
More than 2.5 10 0.4 63.0 45.7 17,903 35.1 3.5
1.0–2.5 22 0.8 33.1 24.0 4,350 8.5 7.6
0.5–1.0 19 0.7 14.7 10.7 4,364 8.6 3.4
0.1–0.5 60 2.2 13.9 10.1 8,510 16.7 1.6
Less than 0.1 2,650 96.0 13.2 9.6 15,832 31.1 0.8
All 2,761 100.0 138.0 100.0 50,959 100.0 2.7
Source: MBA Annual Report on Multifamily Lending 2006.
2 J C H S R E S E A R C H B R I E F 1 3 – 1Notes: Children are the householders’ own children under the age of 18. Income quartiles are equal fourths of all households sorted by pre-tax household income. Other family/non-family includes unmarried partner households.Source: JCHS tabulations of US Census Bureau, 2010 Current Population Survey.
25M and Over 289 342 18.3 126 177 40.5 69 167 142.0
All 39,869 26,644 -33.2 8,649 2,346 -72.9 2,163 1,765 -18.4
Source: JCHS tabulations of Home Mortgage Disclosure Act data.
Notes: Children are the householders’ own children under the age of 18. Income quartiles are equal fourths of all households sorted by pre-tax household income. Other family/non-family includes unmarried partner households.Source: JCHS tabulations of US Census Bureau, 2010 Current Population Survey.
� Married With Children � Single Parent� Married Without Children � Single Person� Other Family/Non-Family
Household Income Quartile
� Top � Lower Middle� Upper Middle � Bottom
Renters All Households
1009080706050403020100
Renters All Households
1009080706050403020100
Renters All Households
1009080706050403020100
Recovery in the Small-Loan Segment Continues to Lag Share of Households (Percent)
FIGURE 6
Notes: Agency and Fed include the GSEs, GSE pools, and the federal government. Banks include US charter depositories and foreign banking offices in the US. State and local includes state and local government. MBS issuers include ABS Issuers. Life/retirement includes life insurance companies, private pension funds, and state and local government retirement funds. REITS and others include the household sector, nonfinancial corporations, and nonfinancial non-corporations.Source: Federal Reserve Board, Flow of Funds Accounts.
� REITS and Others � MBS Issuers � State and Local � Banks � Life/Retirement � Agency and Fed
2005 2006 2007 2008 2009 2010 2011 2012
1,000
900
800
700
600
500
400
300
200
100
0
Government Support Helped the Market Weather the Storm Total Debt Outstanding (Billions of nominal dollars)
FIGURE 5
1
2
3
4
5
6
6 J C H S R E S E A R C H B R I E F 1 3 – 1
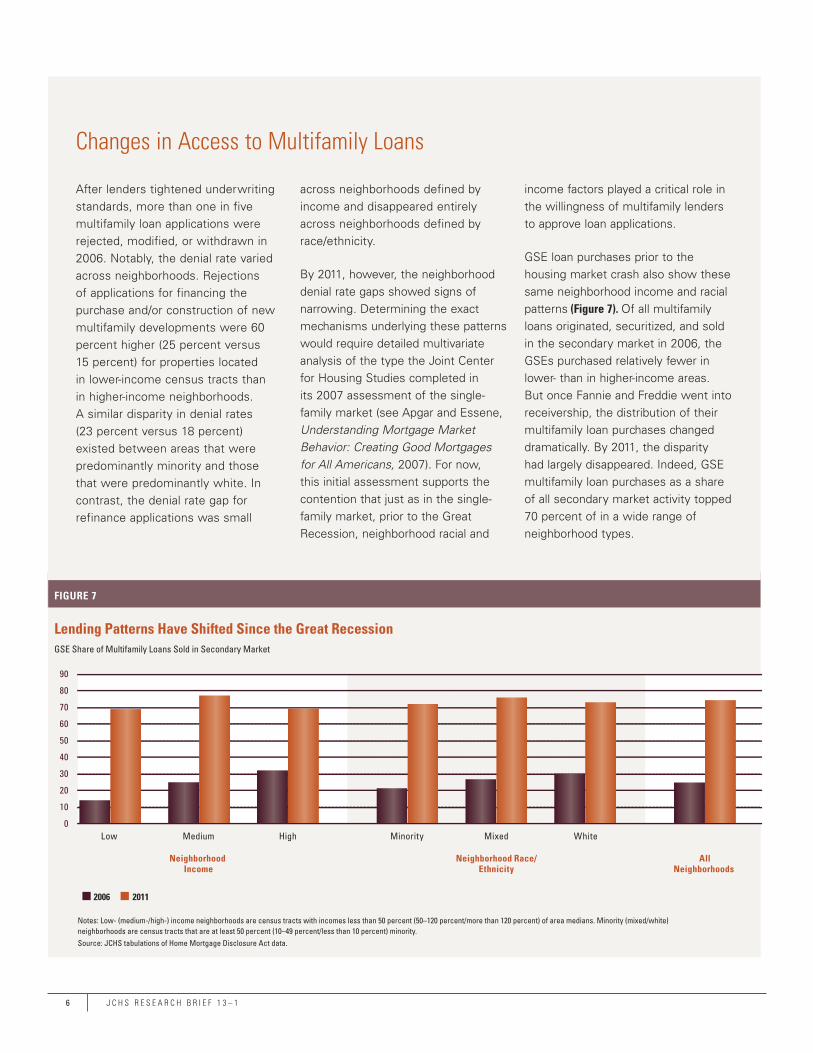
Notes: Low- (medium-/high-) income neighborhoods are census tracts with incomes less than 50 percent (50–120 percent/more than 120 percent) of area medians. Minority (mixed/white) neighborhoods are census tracts that are at least 50 percent (10–49 percent/less than 10 percent) minority.Source: JCHS tabulations of Home Mortgage Disclosure Act data.
� 2006 � 2011
Low Medium
Neighborhood Income
Neighborhood Race/Ethnicity
AllNeighborhoods
High Minority Mixed White
90
80
70
60
50
40
30
20
10
0
Lending Patterns Have Shifted Since the Great Recession GSE Share of Multifamily Loans Sold in Secondary Market
FIGURE 7
Changes in Access to Multifamily Loans
After lenders tightened underwriting standards, more than one in five multifamily loan applications were rejected, modified, or withdrawn in 2006. Notably, the denial rate varied across neighborhoods. Rejections of applications for financing the purchase and/or construction of new multifamily developments were 60 percent higher (25 percent versus 15 percent) for properties located in lower-income census tracts than in higher-income neighborhoods. A similar disparity in denial rates (23 percent versus 18 percent) existed between areas that were predominantly minority and those that were predominantly white. In contrast, the denial rate gap for refinance applications was small
across neighborhoods defined by income and disappeared entirely across neighborhoods defined by race/ethnicity.
By 2011, however, the neighborhood denial rate gaps showed signs of narrowing. Determining the exact mechanisms underlying these patterns would require detailed multivariate analysis of the type the Joint Center for Housing Studies completed in its 2007 assessment of the single-family market (see Apgar and Essene, Understanding Mortgage Market Behavior: Creating Good Mortgages for All Americans, 2007). For now, this initial assessment supports the contention that just as in the single-family market, prior to the Great Recession, neighborhood racial and
income factors played a critical role in the willingness of multifamily lenders to approve loan applications.
GSE loan purchases prior to the housing market crash also show these same neighborhood income and racial patterns (Figure 7). Of all multifamily loans originated, securitized, and sold in the secondary market in 2006, the GSEs purchased relatively fewer in lower- than in higher-income areas. But once Fannie and Freddie went into receivership, the distribution of their multifamily loan purchases changed dramatically. By 2011, the disparity had largely disappeared. Indeed, GSE multifamily loan purchases as a share of all secondary market activity topped 70 percent of in a wide range of neighborhood types.
ily mortgage market must therefore be to
extend the benefits of secondary market
access to the small-loan segment.
REFORM PROPOSALS ON THE TABLEThe mortgage market meltdown and Great
Recession brought both debt and equity
markets to a halt, underscoring the fragil-
ity of the nation’s housing finance system.
Although proposed changes to the single-
family mortgage sector have captured
most of the headlines, equally important
reforms are now moving forward that will
alter the regulation of multifamily hous-
ing finance (including the operations of
FHA, and the GSEs), as well as tax and
subsidy mechanisms to expand affordable
rental housing opportunities (including
the LIHTC, public housing, and rental
assistance programs). In addition to rais-
ing many complex technical issues, these
reforms pose especially thorny questions
about the appropriate role of government
in private markets.
When the federal government took control
of Fannie Mae and Freddie Mac in 2008, it
used billions of dollars of taxpayer money
to help keep the two mortgage market
giants afloat. By 2011, nearly 70 percent
of all multifamily mortgage originations
sold in the secondary market were either
purchased or guaranteed by the GSEs or
insured by FHA. While these shares are
expected to drop sharply in the coming
years as the effects of the financial crisis
recede and as the private mortgage mar-
ket recovers, they represent a historic—
and many believe inappropriate—govern-
ment intrusion into the housing market.
After months of debate, Republican
Senator Robert Corker of Tennessee and
Democratic Senator Mark Warner of
Virginia introduced the Housing Reform
and Taxpayer Protection Act, S.1217, in
June 2013. While primarily focused on
single-family mortgage reform, this leg-
islation contains a number of important
changes to multifamily finance. Among
other features, the legislation would con-
solidate the multifamily mortgage lend-
ing programs of Fannie Mae and Freddie
Mac and transfer these activities to a
newly created Federal Mortgage Insurance
Corporation (FMIC). A major feature of the
Corker-Warner bill is the requirement that
the private sector share risk with the new
FMIC to protect the federal government
and taxpayers against losses.
Much of the debate about Corker-Warner
focuses on the single-family market and is
thus linked to discussions about the best
ways to promote affordable homeowner-
ship. Even though the bill abandons the
much-maligned GSE affordable housing
goals, critics nevertheless contend that
the FMIC is likely to bow to pressure to
ease underwriting standards to expand
the supply of affordable housing. Since
investors in mortgage-backed securities
would be fully covered, they would come
out whole in the case of another market
crash. But FMIC, and potentially taxpayers,
would still be on the hook if the FMIC is
judged “too important to fail.”
Other critics have voiced concerns that
the government presence in the mort-
gage marketplace does not expand
lending and in fact crowds out pri-
vate capital. Specifically, they question
whether non-agency lenders would find
it difficult to match the terms available
through FMIC. This largely theoretical
concern about crowding out stands at
the heart of calls to remove government
from mortgage markets.
J O I N T C E N T E R F O R H O U S I N G S T U D I E S O F H A R V A R D U N I V E R S I T Y 7
Important reforms are now moving forward that will
alter the regulation of multifamily housing finance
as well as tax and subsidy mechanisms to expand
affordable rental housing opportunities.
8 J C H S R E S E A R C H B R I E F 1 3 – 1
Opponents of the Corker-Warner proposal
have rallied behind a competing House
bill, H.R 2767. Designed by the Republican-
controlled House Financial Services
Committee and introduced in July 2013,
the Protecting American Taxpayers and
Homeowners (PATH) Act essentially elimi-
nates most taxpayer support for the hous-
ing market and pushes out the government.
PATH would wind down both Fannie and
Freddie over five years and severely shrink
FHA’s footprint in the mortgage market.
Although PATH’s goal of complete priva-
tization may seem workable, the objec-
tive is easier to state than to achieve.
Any potential advantages of privatization
would be more than offset by higher
mortgage rates and less stability as capi-
tal moved in and out of mortgage markets
in response to changing conditions. And
the government or the taxpayer would
still be on the hook, given that global
investors would almost surely continue
to believe that the US government would
once again intervene in any of a number
of catastrophic loss scenarios.
RETHINKING MULTIFAMILY FINANCE Given the important distinctions
between single-family and multifam-
ily finance, the Federal Reserve Bank of
New York has argued that reform leg-
islation should treat regulations in the
two markets differently. For example,
the Mortgage Finance Working Group
(MFWG) has recommended that the
Corker-Warner legislation be amended
to allow Fannie’s and Freddie’s current
operations to be spun off into two sepa-
rate government-owned entities insured
by a Multifamily Housing Insurance
Fund (MHIF). This fund would be admin-
istered by FMIC and backed by the full
faith and credit of the US government.
Under the MFWG proposal, nonbanks
meeting explicit capital standards similar
to those imposed on credit unions, com-
munity and mid-sized banks, and other
multifamily mortgage originators would
be able to purchase MHIF insurance.
Finally, to insure broad social benefit from
the restructured mortgage market, mul-
tifamily developments backed by MHIF
insurance would have to make at least 60
percent of their units affordable to house-
holds with incomes below 60 percent of
area median income (AMI).
The MFWG plan attempts to integrate
the best elements of the highly com-
petitive multifamily origination market
with broad access to capital through an
equally competitive securitization mar-
ket. And by decoupling single-family and
multifamily issues, such a system could
be up and running quickly. Toward this
same end, another proposal by Beekman
Advisors calls for the creation of a transi-
tion entity (TransitionCo MF) that could be
established as a joint venture with Fannie
and Freddie to begin multifamily lending
immediately. The transition entity would
gain market experience before being spun
off as an independent multifamily MBS
issuer upon enactment of GSE reform
legislation, and therefore begin to return
capital to the government without any
disruption to the market.
TAX REFORM ADDS ANOTHER WRINKLETax reform is central to efforts to bal-
ance the national budget and reduce the
debt. To help frame this important poli-
cy debate, Senators Max Baucus (D-MT)
and Orrin Hatch (R-UT), majority and
ranking members of the Senate Finance
Committee, proposed a “blank slate”
approach to reform, arguing that tax
preferences should be kept only if they
help grow the economy, make the tax
code fairer, or effectively promote other
important policy objectives. This strategy
could unblock the partisan gridlock that
has prevented tax reform in the past.
J O I N T C E N T E R F O R H O U S I N G S T U D I E S O F H A R V A R D U N I V E R S I T Y 9
But in seeking to create a path forward,
Congress should be careful not to short-
circuit tax expenditures—and especial-
ly the Low Income Housing Tax Credit
program—that reduce the cost of equity
capital for multifamily rental produc-
tion. The tax breaks that LIHTC provides
enable developers to offer units at rents
affordable to lower-income households. As
one of the nation’s largest corporate tax
expenditures, however, LIHTC is vulner-
able to elimination or substantial cuts to
help pay for lower corporate tax rates or
any one of several deficit-reduction pro-
posals now under consideration.
Supporters argue that LIHTC is a premier
example of successful public-private part-
nership. When combined with housing
vouchers or other forms of rental assistance,
the tax credit plays an important role in
providing decent housing that is affordable
to the nation’s poor. Because private inves-
tors can only claim credits after projects are
completed and occupied by income-eligible
tenants, the tax credit encourages private-
sector discipline. This “pay-for-performance”
model has led to highly effective manage-
ment of affordable apartments and extraor-
dinarily low foreclosure rates.
Opponents, however, counter that LIHTC’s
complex rules either scare away or crowd
out participation by financially motivated
private developers. Harkening back to a
decades-old debate, many critics argue
that supply-side subsidies are inherently
less efficient than demand-side initia-
tives. Others contend that local resistance
in more resource-rich areas means that
LIHTC developments are often not located
in areas where lower-income residents can
prosper. A variant of this criticism is that
the program favors larger developments
rather than neighborhood-scale in-fill
projects. The average number of units in
tax-credit developments has in fact risen
steadily since the program’s inception and
now stands at close to 80 units.
The fix is relatively simple. To improve
both the location of tax credit units and
the program’s ability to assist a broader
range of renters, it is important to expand
the ability of developers to combine LIHTC
resources with housing vouchers or other
tenant-based subsidies. As it is, qualify-
ing for the credit requires that at least 20
percent of the units in the development
be rent-restricted and occupied by ten-
ants with incomes at or below 50 percent
of AMI. Alternatively, at least 40 percent
of the units must be rent-restricted and
occupied by tenants with incomes at or
below 60 percent of AMI. The amount of
the credit reflects the share of units in the
development affordable to lower-income
households. Maximum allowable rents are
restricted to 30 percent of the elected
income standard, adjusted for the number
of bedrooms in the unit.
In practice, these criteria have led to
multifamily housing developments that
serve a very narrow band of tenants with
incomes falling between 40 percent and 60
percent of AMI. As a result, the LIHTC cri-
teria lack incentives to serve renters most
in need—that is, households with incomes
below 40 percent of AMI.
To enhance the utilization of existing
resources, the Obama Administration pro-
posed the addition of another option in
both its FY2012 and FY2013 submissions:
to allow the tax credit for developments
for units that are affordable to tenants
with incomes that average no more than
60 percent of AMI occupy at least 40 per-
cent of the units in the project. In addition,
tenants with incomes over 80 percent of
Greater flexibility to combine LIHTC resources with
housing vouchers or other tenant-based subsidies
would help to improve the location of tax credit units
and broaden the range of assisted renters.
10 J C H S R E S E A R C H B R I E F 1 3 – 1
AMI could not occupy rent-restricted units.
Unfortunately, Congress has yet to address
this and other sensible LIHTC initiatives.
Allowing this additional flexibility could
significantly enhance the efficiency and
effectiveness of the LIHTC program.
Mixed-income buildings that offer rental
housing options serving a broad range of
incomes are especially important in low-
income communities that are being revi-
talized and/or located in sparsely populat-
ed areas. In addition, the current rigidity
of the income criteria makes it difficult for
LIHTC to support acquisition of partially
or fully occupied properties for preserva-
tion or repurposing.
In another recent effort to harness private
capital to expand the supply of afford-
able housing, HUD’s Rental Assistance
Demonstration (RAD) program was
designed to stem the loss of public housing
and certain other at-risk, federally assisted
properties. The program allows owners to
pledge a portion of cash flow derived from
existing long-term, project-based Section
8 contracts as collateral to support public
and private lending to make much-needed
improvements. At a time when the backlog
of public housing repairs stands at $25.6
billion and other federally assisted prop-
erties have yet to recover fully from the
Great Recession, RAD helps both public
and private owners of multifamily housing
address critical rehabilitation needs by bor-
rowing against their future income streams
on the private market.
THE KEY: COORDINATING SUPPLY AND DEMAND SUBSIDIES Market fundamentals suggest that the
multifamily finance sector should remain
strong in the near term. Indeed, govern-
ment engagement in multifamily finance
markets has supported an institutional
infrastructure resilient enough to with-
stand the recent economic crisis and
emerge more or less intact.
Coordination of rules governing utiliza-
tion of existing long-term, project-based
Section 8 contracts with ongoing GSE and
tax policy reform efforts could unleash
private sector expertise to serve broader
segments of today’s renters. This would
help turn the energy of the multifamily
finance sector toward reducing the rental
cost burdens that undermine the well-
being of millions of US households.
About the Authors
William C. Apgar is a senior scholar and Elizabeth La Jeunesse is a research assistant
at the Joint Center for Housing Studies.
Mission
The Joint Center for Housing Studies of Harvard University advances understanding of
housing issues and informs policy. Through its research, education, and public outreach
programs, the Center helps leaders in government, business, and the civic sectors make
decisions that effectively address the needs of cities and communities. Through graduate
and executive courses, as well as fellowships and internship opportunities, the Joint Center
also trains and inspires the next generation of housing leaders.
For additional copies, please contact
Joint Center for Housing Studies of Harvard University
1033 Massachusetts Avenue, 5th Floor
Cambridge, MA 02138
www.jchs.harvard.edu
Joint Center for Housing Studies of Harvard University