1 Food and Agriculture Organization of the United Nations World Health Organization Joint FAO/WHO Expert Meeting on the Public Health Risks of Histamine and Other Biogenic Amines from Fish and Fishery Products 23–27 July 2012 FAO Headquarters, Rome, Italy Meeting Report
Transcript
1
Food and Agriculture Organization of the United Nations World Health Organization
Joint FAO/WHO Expert Meeting on the Public Health Risks of Histamine and Other Biogenic Amines from Fish and Fishery Products
23–27 July 2012
FAO Headquarters, Rome, Italy
Meeting Report
2
Table of Contents Contributors ................................................................................................................ ............... 4
2.5 Analytical methods for histamine ..................................................................... ............. 16 2.6 Fish species ........................................................................................................ ............. 16
3. Exposure assessment............................................................................................... ............. 23 3.1 Introduction ...................................................................................................... ............. 23 3.2 Detection frequency of histamine and levels of contamination ....................... ............. 23 3.3 Consumption ..................................................................................................... ............. 25
4. Hazard characterization........................................................................................... ............. 32 4.1 Histamine as the exposure marker in SFP ......................................................... ............. 32 4.2 Type of study used in the dose–response assessment ..................................... ............. 32 4.3 Study selection for dose–response assessment ............................................... ............. 32 4.4 NOAEL derivation from human challenge studies ............................................ ............. 33 4.5 Benchmark dose assessment (BMD) ................................................................. ............. 33
3
5. Risk characterization ............................................................................................... ............. 36 5.1 Derivation of a histamine limit based on the NOAEL ........................................ ............. 36 5.2 Characterization of histamine distribution from censored data ...................... ............. 36 5.3 Calculating the probability of histamine level exceeding 200 mg/kg ............... ............. 37
6. Risk management options ....................................................................................... ............. 41 6.1 Management of histamine production in fish and fishery products ................ ............. 41
6.1.7 Using suitable starter cultures and/or their enzymes in preparation of specialist fermented fish and fishery products.................. ............. 44
6.1.9 Sensory assessment for decomposition ..................................................... ............. 44
6.2 Designing a sampling plan to meet an appropriate level of protection (ALOP) for histamine as part of risk management ............................................ ............. 45
6.2.2 Designing a sampling plan .......................................................................... ............. 47
6.2.2.1 Using a known standard deviation to derive an acceptable mean ....... ............. 47 6.2.2.2 Using the known standard deviation and the derived mean to
design a sampling plan .......................................................................... ............. 50 6.2.3 Examples and analysis of existing sampling plans ...................................... ............. 53
6.3 Economic impact of enforcement ..................................................................... ............. 56 6.3.1 Estimated cost of rejection ......................................................................... ............. 56
8.1 Research needs and recommendations for future studies ............................... ............. 61 9. References ............................................................................................................... ............. 63 Annex 1 Meeting participants ..................................................................................... ............. 71 Annex 2 Histamine limits and sampling plans in current standards for fish
and fishery products .................................................................................... ............. 74 Annex 3 Background paper: Toxicology, epidemiology and dose response ............... ............. 76
4
Contributors
Experts Ronald Allen Benner Jr, US Food and Drug Administration, United States of America
Catherine Birmingham, Food Standards Agency (FSA), United Kingdom
P. Michael Bolger, US Food and Drug Administration, United States of America
Guillaume Duflos, Agence nationale de sécurité sanitaire de l'alimentation, de
l'environnement et du travail (ANSES), France
Graham Clive Fletcher, The New Zealand Institute for Plant & Food Research Limited, New
Zealand
Laurent Guillier, Agence nationale de sécurité sanitaire de l'alimentation, de
l'environnement et du travail (ANSES), France
Alberto Salas Maldonado, Insituto Tecnologico Pesquero, Peru
Fred Nolte, Clover Leaf Seafoods, Canada
Gerard Lambert Roessink, Netherlands Food and Consumer Product Safety Authority, The
Netherlands
Rogério Mendes, National Institute of Biological Resources, Portugal
Tom Ross, International Commission for Microbiological Specifications for Foods (ICMSF),
Australia
Masataka Satomi, National Research Institute of Fisheries Science, Fisheries Research
Agency, Japan
Sri-anant (Ann) Wanasen, National Center for Genetic Engineering and Biotechnology
(BIOTEC), Thailand
Alphonse Tine, University Cheikh Anta Diop, Senegal
Full contact details of the participants are attached as Annex 1
Declarations of Interest Two of the 14 experts who participated in the meeting declared an interest in the topics under discussion. Dr Fletcher is an ongoing employee of the New Zealand Institute for Plant & Food Research Limited. This company is a government-owned research organization which also undertakes commercial activities including conducting research and providing scientific advice to the private sector. Dr. Fletcher is engaged in carrying out independent research and providing expert advice on seafood, including the food safety risks of histamine, and received more than US $1 000 but less than US $10 000 per year as remuneration from commercial entities in respect of his activities. Our legal advisors considered that the outcome of this meeting may lead to the development of Codex standards, and that this may have a direct or indirect commercial impact on the New Zealand Institute for Plant & Food Research. Mr Nolte is an ongoing employee of Connors Clover Leaf Seafoods Ltd, the Canadian subsidiary of Bumble Bee Foods, which is a commercial seafood manufacturer. He is
5
engaged in quality assurance of seafood and ongoing projects, including hazard analysis and critical control point (HACCP) assessment for tuna processing, which also address histamine. Again it was considered that the outcome of this meeting may lead to the development of Codex standards, which may have a direct or indirect commercial impact on Connors Clover Leaf Seafoods Ltd. In light of the above, the involvement of Dr Fletcher and Mr Nolte in the meeting was limited in so far as they did not participate in the decision-making process relating to the development of meeting recommendations.
Hajime Toyofuku, National Institute of Public Health, Japan
Yu (Janet) Zang, US Food and Drug Administration, United States of America
Secretariat Sarah Cahill, Nutrition and Consumer Protection Division, Food and Agriculture Organization of the United Nations Vittorio Fattori, Nutrition and Consumer Protection Division, Food and Agriculture Organization of the United Nations Karunasagar Iddya, Fisheries and Aquaculture Policy and Economics Division, Food and Agriculture Organization of the United Nations Mina Kojima, Department of Food Safety and Zoonoses, World Health Organization
6
Executive summary Scombrotoxin fish poisoning (SFP) (often called “histamine poisoning”) is caused by ingestion of certain species of marine fish that contain high levels of histamine and possibly other biogenic amines. Codex Alimentarius through its standards and guidelines aims to provide countries with a basis on which to manage issues such as histamine formation. Several of the existing standards include maximum levels for histamine in different fish and fishery products. The need to harmonize such limits and produce the associated guidance on the relevant sampling plans and other aspects of sampling resulted in the 31st Session of the Codex Committee on Fish and Fishery Products (CCFFP), which agreed to look into the issue of histamine limits in more detail. The Committee established an electronic Working Group in order to facilitate this work and identified the need for scientific advice from FAO and WHO to support this work.
FAO and WHO convened an expert meeting at the FAO headquarters in Rome from 23 to 27 July 2012 to address the public health risks of histamine and other biogenic amines from fish and fishery products. This report summarizes the outcome of that meeting. Histamine is produced by bacterial actions, e.g. spoilage and fermentation, in fish species which have a naturally high level of the amino acid histidine. Generally, this takes place at a temperature of more than 25 °C over a period of more than 6 hours or for longer at lower temperatures. A hazard identification process, in which all biogenic amines were considered, concluded that there is compelling evidence that histamine is the most significant causative agent of SFP and that histamine can be used as an indicator of SFP. There are no difficulties in analysing histamine and a number of suitable methods are available. The different species of fish that are reportedly responsible for SFP were identified, including those with a high histidine level which have the potential to cause SFP. Noting that this information should be easily accessible to support risk-based approaches to SFP management, the expert meeting developed the most comprehensive list of fish associated with SFP to date. The hazard characterization concluded that a dose of 50 mg of histamine, which is the no-observed-adverse-effect level (NOAEL), is the appropriate hazard level. At this level healthy individuals would not be expected to suffer any of the symptoms associated with SFP. In addition, no cumulative effect of consecutive meals containing fish was expected, because histamine usually leaves the body within a few hours. Using the available fish and fishery products consumption data combined with expert opinion, the meeting agreed that a serving size of 250 g captured the maximum amount eaten in most countries at a single eating event. Based on the hazard level of 50 mg of histamine and the serving size of 250 g, the maximum concentration of histamine in that serving was calculated to be 200 mg/kg. When food business operators apply good hygienic practices (GHP) and hazard analysis critical control point (HACCP), an achievable level of histamine in fish products was reported to be lower than 15 mg/kg, based on data made available by industry (using a test method with a lower detection limit of 15 mg/kg). Recognizing that the purpose of testing is not to control the problem of SFP, but rather to verify that all the necessary control measures have been implemented effectively, identify failures in the system and remove implicated products from the market, different sampling
7
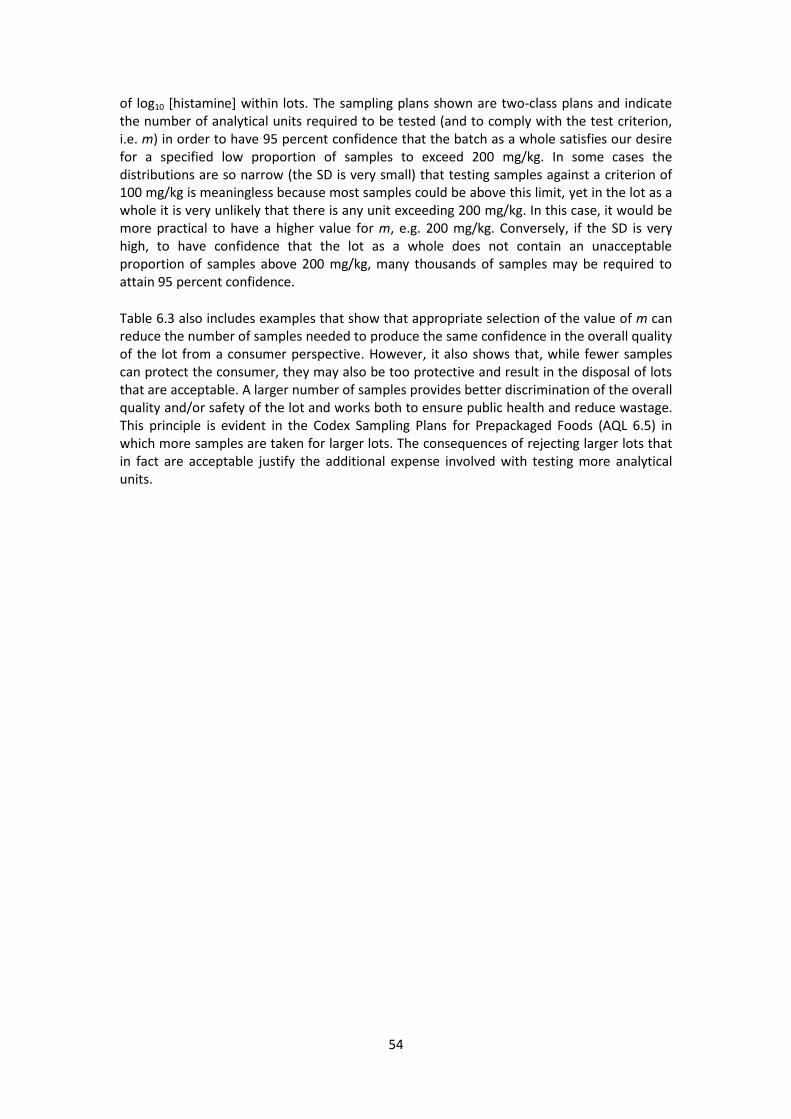
approaches and associated plans were presented. In order to provide more explicit guidance on sampling approaches the meeting analysed a range of sampling plans implemented under different scenarios of histamine levels, as defined by the log-transformed mean and standard deviation. Examples of attributes sampling plans appropriate to different levels of tolerance for samples above 200 mg/kg, and for different assumptions about the standard deviation of histamine concentration within lots, were presented. The sampling plans shown were two-class plans and they indicate the number of analytical units required to be tested in order to have 95 percent confidence that the batch as a whole satisfies the desired specified low proportion of samples (such as 1 in 10 000) to exceed 200 mg/kg. The spread of contamination levels in the batch (i.e. the log-transformed standard deviation of contamination levels) has a strong effect on the tolerable average contamination level and, thus, on the number of samples that must be tested to “accept” the batch. Appropriate selection of the criterion against which test units comprising the sample will be assessed for compliance (the m value), can considerably improve the time- and cost-effectiveness of sampling: requiring the lowest number of samples to be tested to achieve the same level of confidence about the disposition of the lot being assessed. The expert meeting concluded that histamine formation and SFP can be easily controlled. The risk from SFP is best mitigated by applying basic GHPs and, where feasible, a HACCP system. Appropriate sampling plans and testing for histamine should be used to validate the HACCP systems, verify the effectiveness of control measures, and detect failures in the system. Sensory evaluation remains a highly useful tool for quality control programmes, but acceptable sensory quality cannot be taken as final assurance of low histamine, nor can low histamine be taken as final assurance that fish is not decomposed. As a result the conclusion of the expert meeting was to focus their advice on histamine limits and related sampling plans to those focused on consumer protection. Several areas in which further research will be needed have been identified, including the need to clarify the critical role played by histamine and other biogenic amines in the pathogenesis of SFP.
8
1. Introduction
1.1 Background Scombrotoxin fish poisoning (SFP) (often called “histamine poisoning”) is caused by ingestion of certain species of marine fish that contain high levels of histamine and possibly other biogenic amines. The fish species involved include tuna, which accounts for 8 percent of globally traded fish. Other pelagic species such as mackerel, sardines and anchovy, which account for significant global fish production, can also be involved. These fish species contain high levels of free histidine in their tissues and when conditions are favourable for bacteria to multiply in fish, e.g. when fish are subjected to temperature abuse during and/or after harvest, bacterial decarboxylation of histidine leads to histamine formation. Other biogenic amines produced during bacterial growth in fish may potentiate the effect of histamine. The severity of the symptoms can vary, depending on the amount of histamine and other biogenic amines ingested and the individual’s sensitivity to specific biogenic amines. In some parts of the world, SFP accounts for the largest proportion of cases of fish-borne illness.
Fish handling practices are critical with regard to histamine production. For the purposes of consumer protection, fish importing countries have regulations and varying limits for histamine in fish and fishery products. Failure to comply with these regulations and limits leads to import rejection and disruptions in fish trade in major international markets (Ababouch et al., 2005). Thus regulations and limits related to histamine and the fish handling practices that are compatible with these are of great significance for fish producing countries.
Codex Alimentarius, through its standards and guidelines, aims to provide countries with a basis on which to manage issues such as histamine formation. For example, the Codex Code of Practice for Fish and Fishery Products provides guidance on fish handling practices that need to be implemented to minimize food safety problems, including SFP. In addition, the Codex Alimentarius has established several standards that include maximum levels for histamine in different fish and fishery products. Different limits have been established as indicators of decomposition and as indicators of hygiene and handling. However, the associated guidance on the relevant sampling plans and other aspects of sampling is limited or even non-existent. Furthermore, many of these limits (see Annex 2) were established in an era before risk assessment and the scientific basis for the limits is unclear. As food safety management moves towards more risk- and evidence-based approaches, there is a need to review existing limits in the light of the most up-to-date scientific information and to ensure that there is a robust scientific basis for any limits recommended by Codex.
Thus, in April 2011, the 31st Session of the Codex Committee on Fish and Fishery Products (CCFFP) revisited these maximum histamine levels and agreed to look into this issue in more detail. The Committee established an electronic Working Group in order to facilitate this work. The Committee considered that it was important to the decision-making process to have available for their consideration a review of the public health risks and trade implications associated with histamine from fish and fishery products from a more general perspective. This would take into account different maximum levels in various products, existing sampling plans, and risk reductions achieved by various means at the national level. It was also agreed that the Working Group would take into account the work of the Codex
9
Committee on Food Hygiene (CCFH) on the revision of the Principles for the Establishment and Application of Microbiological Criteria for Foods.
1.2 Objectives This expert meeting was organized by FAO/WHO to support and facilitate this effort. Its primary objectives were:
to review the public health impact of histamine and other biogenic amines from fish and fishery products and the trade impacts associated with histamine limits;
to review the epidemiological and toxicological data and examine whether any risk-based control measures can be recommended for different fishery products;
to examine the impact of a range of risk-based sampling plans for monitoring histamine levels as a marker for SFP in various fish and fishery products;
to examine whether fish families mentioned in current Codex standards adequately cover species involved in histamine-associated illness.
1.3 Meeting approach In order to reach these objectives the meeting decided to take a risk assessment approach and use the available data to estimate a level of histamine at which there is no observed adverse effect, estimate the exposure and characterize the risk. Consideration was also given to risk management options, including a range of sampling approaches. It was also agreed to identify those areas where the scientific knowledge was weak or limited in order to highlight areas where further research is needed.
The aim of this report is to provide the CCFFP and its working group with the scientific basis it needs to make decisions on the management of histamine in fish and fishery products.
The meeting was chaired by Dr Gerard Roessink, and Dr Ronald Benner acted as rapporteur. A group of 14 experts from 12 countries participated in the meeting in their independent capacities and not as representatives of their governments, employers or institutions. They included one expert from the fisheries industry and one expert from a government institution with commercial activities related to the fisheries industry. While these experts participated in the general discussion and exchange of information, they did not participate in the final adoption of the conclusion and recommendations of the meeting. The deliberations of this meeting were based on three background papers, prepared in advance of the meeting by Dr P. Michael Bolger, Dr Yu (Janet) Zang, Dr Tom Ross and Dr Ronald Allen Benner. The background paper prepared by Dr Bolger and Dr Zang is available in Annex 3 and the relevant information from the papers prepared by Dr Benner and Dr Ross has been incorporated in the report.
10
2. Hazard Identification
2.1 Biogenic Amines
2.1.1 Histamine
Histamine is a naturally occurring endogenous substance in the human body which is derived from the decarboxylation of the amino acid histidine. Histamine may also be present in certain foods containing free histidine, and is generated by certain bacteria during spoilage and fermentation of fish. Endogenous histamine has important physiological functions related to local immune responses, gastric acid secretion and neuromodulation. Histamine-rich foods may cause food intolerance in sensitive individuals and histamine contamination in fish and fish products may cause food poisoning (Taylor, 1986).
2.1.2 Cadaverine and putrescine
Cadaverine and putrescine are two other biogenic amines found in fish. Like histamine, they are produced from amino acids by bacteria during spoilage and fermentation. The precursors of cadaverine and putrescine are lysine and ornithine, respectively. Cadaverine and putrescine are both found frequently in improperly handled fish, not just those implicated in SFP, and have been studied as spoilage indicators. In some fish spoilage studies, cadaverine appeared to be formed and increased earlier than histamine (Pons-Sanchez-Cascado et al., 2005; Rossi et al., 2002). Although they might act as histamine potentiators (Taylor and Lieber, 1979), the contribution of these biogenic amines to SFP is not clear.
2.1.3 Tyramine
Tyramine is a naturally occurring monoamine compound derived from the amino acid tyrosine. Fresh fish contains little or no tyramine, but a large amount can be found in spoiled or fermented fish (Leuschner and Hammes, 1999; Prester, 2011). Alhough tyramine might also act as a histamine potentiator (Taylor and Lieber, 1979), the contribution of this biogenic amine to SFP is not clear.
2.1.4 Other biogenic amines
Other biogenic amines detected in fish and fish products include spermine, spermidine, dopamine and agmatine (Park et al., 2010; Visciano et al., 2012). Though some of them might act as histamine potentiators (Taylor and Lieber, 1979), the contribution of these biogenic amines to SFP is not clear.
2.1.5 Micro-organisms involved in biogenic amine production
Biogenic amine production requires available amino acids and amino acid decarboxylases synthesized by bacteria (EFSA, 2011). Histamine is formed in fish by certain micro-organisms capable of producing the enzyme histidine decarboxylase (HDC). The histidine decarboxylases produced by these bacteria catalyse the conversion of free histidine, naturally present at high levels in the muscle of some fish, to histamine. Gram-positive and Gram-negative bacteria can both produce histidine decarboxylase but the forms of the enzymes differ (Bjornsdottir-Butler et al., 2010; EFSA, 2011). In the same way, other biogenic amines (putrescine, cadaverine and tyramine) are synthesized by decarboxylases produced by Gram-positive and Gram-negative bacteria.
In the scientific literature the following species are reported to be those most likely to produce histamine: Morganella morganii, Morganella psychrotolerans, Photobacterium damselae, Photobacterium phosphoreum, Raoultella planticola and Hafnia alvei (Dalgaard et al., 2008; EFSA, 2011). In the case of fermented seafood, Staphylococcus spp. and Tetragenococcus spp. are reported to be histamine producers (Satomi et al., 2011; Yatsunami and Echigo, 1991). For biogenic amine compounds other than histamine, several families or genera are reported to be involved, such as Enterobacteriaceae, Pseudomonaceae, Lactobacillus, Enterococcus and Staphylococcus (EFSA, 2011). Within different genera or species the ability to generate histamine is very much strain dependent. In fish, biogenic amine-producing bacteria are most likely to be present on the gills or skin, or in the gastrointestinal tract. Transfer of these bacteria to the flesh of the fish, where free amino acids may be present, leads to development of biogenic amines. Transfer can occur from the gastrointestinal tract after harvest, through migration, or via rupture or spillage of gastric contents during gutting. Micro-organisms may also be transferred from the skin or gills during butchering. The amount of biogenic amines produced depends on the level of free amino acids present, which is related to the species of fish and the amount and activity of decarboxylase enzymes. The quantity of decarboxylases is related to the number of decarboxylase-producing bacteria transferred to the fish and the extent to which they multiply. Many conditions can affect the growth of biogenic amine producers. Temperature is the main determinant. Biogenic amine concentrations thus depend on the combined influence of time and temperature: longer times and higher temperatures will lead to greater microbial growth and biogenic amine formation. Other important factors can be involved, including pH, salt, oxygen availability and competition with other spoilage micro-organisms. In summary, the content of biogenic amines in fish products will depend on: (i) the type of fish (i.e. the amount of free amino acids), (ii) the way the fish is handled (i.e. the potential for bacterial growth in the fish products) and (iii) the duration, conditions and temperature of storage of the fish. This combination of factors can lead to highly variable levels of contamination within individual lots of fish, and even within individual fish, and has implications for the efficacy of testing schemes to assess the safety of fish and fish products with respect to histamine contamination.
2.2 Toxicological aspects
2.2.1 Histamine
2.2.1.1 Absorption, distribution, metabolism and excretion
Human subjects can tolerate up to 180 mg of pure histamine orally without having noticeable effects, while intravenous administration of 0.007 mg of histamine produces vasodilatation and an increase in heart rate (Weiss et al., 1932). This difference suggests that histamine is not efficiently absorbed from the gastrointestinal tract. It has been postulated that histamine metabolizing enzymes present in the intestinal tract prevent the absorption of ingested histamine into the circulatory system (Taylor, 1986). Endogenous histamine is generated in mammals by the enzyme histidine decarboxylase (HDC), which is only synthesized as necessary and is degraded immediately when sufficient histamine has been generated. The HDC exists primarily in mast cells, basophils, enterochromaffin-like cells in gastric mucosa and histaminergic neurons. Generally,
12
histamine is stored as a histamine–heparin complex in the secretory granules in these cells, and is released upon stimulation to exert its physiological functions. However, recently it has been found that a small amount of histamine is synthesized in some epidermal cells and released immediately (Shahid et al., 2009). In humans and experimental animals, histamine is primarily metabolized by two enzymes: diamine oxidase (DAO) and histamine-N-methyltransferase (HMT) (Maintz and Novak, 2007). DAO converts histamine into imidazole acetic acid, which can be conjugated with ribose before excretion. HMT converts histamine into methylhistamine, which is then converted by monoamine oxidase (MAO) into N-imidazole acetic acid. The ultimate end products of histamine metabolism are excreted in the urine. In humans, DAO is expressed mainly in the intestinal tract, which limits the uptake of exogenous histamine into the circulatory system. HMT, however, is widespread in human tissues, with the order of activity being liver > colon > spleen > lung > small intestine > stomach (Hesterberg et al., 1984). Therefore, DAO is considered to be the major metabolic enzyme for ingested histamine, while histamine injected intravenously or intradermally is primarily metabolized by HMT. HMT is very selective for histamine, while the substrates of DAO include other biogenic amines such as cadaverine and putrescine (Taylor, 1986). Altered histamine metabolism has been reported in individuals taking isoniazid (Morinaga et al., 1997) and drugs that inhibit DAO or MAO, as well as patients with mastocytosis, tumours or chronic myelocytic leukaemia (Maintz and Novak, 2007). Histamine metabolism may also be influenced by consumption of food-borne DAO inhibitors such as thiamine, cadaverine and tyramine (Taylor, 1986). When 14C-histamine was administered orally to humans, 68–80 percent of the radioactive dose was recovered in the urine. Some histamine does remain in the faeces, and additional amounts are catabolized by intestinal bacteria and exhaled as CO2 from the lungs (Sjaastad and Sjaastad, 1974).
2.2.1.2 Mechanism of action
Histamine exerts its effects through the activation of four different types of histamine receptor (H1, H2, H3 and H4) on and/or in the cellular membrane. These histamine receptors are expressed on different cell types and work through different signalling pathways, resulting in multiple biological responses. For example, histamine increases vasopermeability and vasodilatation, causing urticaria, flushing, hypotension and headache. Histamine also induces contraction of intestinal smooth muscle, causing abdominal cramps, diarrhoea and vomiting (Lehane and Olley, 2000).
2.2.1.3 Toxicological responses in animals
The toxicological responses to histamine depend on the method of administration, and the toxicological effects differ among species. Oral administration of histamine, alone or together with spoiled tuna, produced emesis in pigs. An emetic response was also observed in dogs (Blonz and Olcott, 1978). Intraduodenal injection of histamine produced only transient hypotension in dogs and cats, while a histamine-containing yeast extract produced a wider variety of effects in cats, including increased volume and acidity of stomach acid, increased haematocrit and limb volume, and enhanced electromyographic activity (Taylor, 1986). When given intradermally, histamine induced microvascular permeability in the skin of hamsters and rats (Woodward and Ledgard, 1986).
13
2.2.1.4 Toxicological responses in humans
While endogenous concentrations of histamine are necessary and are required for normal physiological function, histamine is toxic when large doses enter the circulatory system. This often results in symptoms of poisoning, which involve a wide range of organs (Taylor, 1986). The toxicological effects of histamine are related to its normal physiological actions in the body and include the following. Vascular: Dilatation of the peripheral blood vessels, predominantly arteries, results in hypotension, flushing and headache. Histamine also induces increased capillary permeability, resulting in symptoms such as oedema, urticaria, haemoconcentration and increased blood viscosity. Shock can result from administration of very high doses of histamine. The effect on capillary permeability is mediated by both H1 and H2 receptors (Owen and Woodward, 1980). Heart: Histamine exerts a direct stimulatory action on the heart. Histamine increases heart contractility and increases the rate and strength of the contractions. The effects of histamine on the heart might account for the palpitations noted by some persons experiencing histamine poisoning. Histamine can cause either contraction or relaxation of extravascular smooth muscles. Contraction is mediated by H1 receptors, while relaxation is associated with H2 receptors (Shahid et al., 2009). Gastrointestinal: In humans, the predominant action of histamine on extravascular smooth muscles is contraction. This smooth muscle contraction is most often noted in the bronchi and intestines. In histamine poisoning, the contraction of intestinal smooth muscle is particularly apparent, because histamine enters the gastrointestinal tract initially. Contraction of intestinal smooth muscle leads to the abdominal cramps, diarrhoea and vomiting which are often noted in cases of histamine poisoning (Taylor, 1986). Neurological: Histamine is also a potent stimulant of both sensory and motor neurons. This stimulation may be important in producing the pain and itching that frequently accompany the urticarial lesions in histamine poisoning. This neural stimulation is mediated by H1 receptors (Nuutinen and Panula, 2010).
2.2.2 Cadaverine and putrescine
Cadaverine and putrescine are considered to be histamine potentiators, which may explain the lack of toxicity of pure histamine in human oral challenge studies. In guinea pigs, cadaverine and putrescine enhanced histamine-related mortality (Bjeldanes et al., 1978; Vasseur et al., 1968). As evidence of their potentiating effects, cadaverine and putrescine were demonstrated to be functional inhibitors of DAO and HMT in a rat jejunal model (Taylor and Lieber, 1979). Cadaverine is also able to enhance the absorption of histamine in perfused rat intestinal segments (Lyons et al., 1983; Paik and Bjeldanes, 1979). In an in vivo study conducted in rats, both cadaverine and putrescine increased the amount of unmetabolized histamine, but decreased the amount of its metabolites in urine (Hui and Taylor, 1985). The minimum level of cadaverine or putrescine that potentiates histamine toxicity is unknown. The ratio of cadaverine or putrescine to histamine may need to be high to produce an effect, and it is not clear whether the levels present in spoiled fish are sufficient to enhance the toxicity of histamine in humans.
14
2.2.3 Tyramine
In humans, tyramine acts as a catecholamine (including norepinephrine [noradrenaline], dopamine, epinephrine [adrenaline]) releasing agent, resulting in increased blood pressure. Given that tyramine is metabolized physiologically by MAO, a hypertensive crisis can result when a person who takes MAO inhibitor (MAOI) drugs also consumes foods with high histamine content. This condition, also called the tyramine pressor response, is characterized by an increase in systolic blood pressure of 30 mmHg or more. The displacement of norepinephrine from neuronal storage vesicles by acute tyramine ingestion is thought to cause the vasoconstriction and increased heart rate and blood pressure. In addition to the hypertensive effect, dietary tyramine intake has also been associated with migraine headaches in selected populations, and the mechanism has been linked to tyramine as a neurotransmitter (Jansen et al., 2003). In animals, tyramine has a low acute oral toxicity of more than 2000 mg/kg body weight (bw). It causes a dose-dependent increase in blood pressure. When using an MAOI, the intake of approximately 10–25 mg of tyramine is required for a severe reaction, compared with 6–10 mg for a mild reaction. For adults, levels of 100–800 mg/kg bw of dietary tyramine have been suggested as acceptable, and levels > 1080 mg/kg bw as toxic (Tenbrink et al., 1990). In individuals using MAOI drugs, ingestion of 60 mg/kg of tyramine can cause migraine headaches, while 100–250 mg/kg bw will produce a hypertensive crisis (Silla Santos, 1996). There is some evidence that tyramine, like cadaverine and putrescine, potentiates histamine toxicity by inhibitioffing the histamine-metabolizing enzymes DAO and HMT (Bjeldanes et al., 1978; Shalaby, 1996).
2.3 Scombrotoxin fish poisoning (SFP) SFP is a worldwide food safety problem and is a common cause of fish poisoning that occurs in humans. The food poisoning is caused by heat-stable scombrotoxins, presumably arising from bacterial action in fish. Although detailed components of scombrotoxins have not been identified, it is generally accepted that biogenic amines, especially histamine, play an important role in the pathogenesis of SFP. The incriminated fish usually contain abnormally high levels of histamine due to bacterial activity resulting from inappropriate handling, processing or storage conditions, and histamine has been implicated, at least in part, as an important causative agent. Therefore, SFP is also called histamine fish poisoning (HFP). Although SFP shares some symptoms with histamine intolerance and histamine-induced adverse effects, there are distinctions. Unlike histamine intolerance and histamine induced effects, SFP may involve the presence of other toxic decomposition products or other components unique to fish (Hungerford, 2010). In addition, unlike histamine intolerance, SFP occurs not only in susceptible individuals, but also in those with a normal capacity for histamine degradation.
2.3.1 Symptoms
A variety of symptoms of SFP have been observed among humans (Table 2.1). Poisoned individuals may show one or more of these symptoms, and the severity of the response to the contaminated fish may vary. In several case reports, exacerbation of asthma and more serious cardiac manifestations were reported (Ascione et al., 1997; D'Aloia et al., 2011; Wilson et al., 2012). The symptoms typically develop rapidly (from 5 minutes to 2 hours after ingestion of spoiled fish), with a usual duration of 8–12 hours and with symptoms usually no longer observed after 24 hours. Although symptoms may persist for up to several days,
15
there are no known long-term sequelae. SFP is considered to be rarely if ever fatal. According to data from the United States Centers for Disease Control and Prevention (CDC) for the period from 1998 to 2002, there were 463 cases reported and no deaths (CDC, 2006). According to the data from the Japanese Ministry of Health, Labour and Welfare for the period from 1998 to 2008, there were 89 incidents, 1577 cases reported and no deaths (Toda et al., 2009).
2.3.2 Diagnosis
The diagnosis of SFP is largely dependent on the symptomology, time of onset, history of food allergy and the consumption of contaminated fish. The diagnosis can be confirmed by detecting high levels of histamine in the implicated food, meal remnants or a similar product obtained from the same source (Ferran and Yebenes, 2006; Predy et al., 2003).
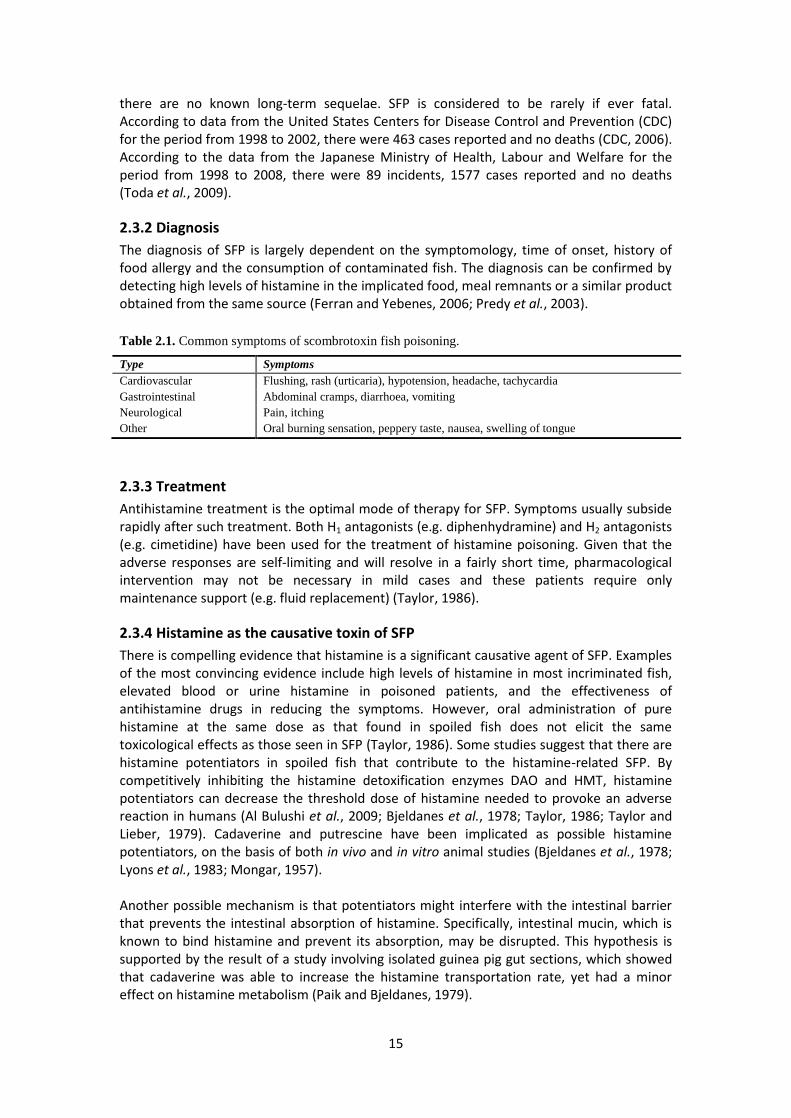
Table 2.1. Common symptoms of scombrotoxin fish poisoning.
2.3.3 Treatment
Antihistamine treatment is the optimal mode of therapy for SFP. Symptoms usually subside rapidly after such treatment. Both H1 antagonists (e.g. diphenhydramine) and H2 antagonists (e.g. cimetidine) have been used for the treatment of histamine poisoning. Given that the adverse responses are self-limiting and will resolve in a fairly short time, pharmacological intervention may not be necessary in mild cases and these patients require only maintenance support (e.g. fluid replacement) (Taylor, 1986).
2.3.4 Histamine as the causative toxin of SFP
There is compelling evidence that histamine is a significant causative agent of SFP. Examples of the most convincing evidence include high levels of histamine in most incriminated fish, elevated blood or urine histamine in poisoned patients, and the effectiveness of antihistamine drugs in reducing the symptoms. However, oral administration of pure histamine at the same dose as that found in spoiled fish does not elicit the same toxicological effects as those seen in SFP (Taylor, 1986). Some studies suggest that there are histamine potentiators in spoiled fish that contribute to the histamine-related SFP. By competitively inhibiting the histamine detoxification enzymes DAO and HMT, histamine potentiators can decrease the threshold dose of histamine needed to provoke an adverse reaction in humans (Al Bulushi et al., 2009; Bjeldanes et al., 1978; Taylor, 1986; Taylor and Lieber, 1979). Cadaverine and putrescine have been implicated as possible histamine potentiators, on the basis of both in vivo and in vitro animal studies (Bjeldanes et al., 1978; Lyons et al., 1983; Mongar, 1957). Another possible mechanism is that potentiators might interfere with the intestinal barrier that prevents the intestinal absorption of histamine. Specifically, intestinal mucin, which is known to bind histamine and prevent its absorption, may be disrupted. This hypothesis is supported by the result of a study involving isolated guinea pig gut sections, which showed that cadaverine was able to increase the histamine transportation rate, yet had a minor effect on histamine metabolism (Paik and Bjeldanes, 1979).
Other Oral burning sensation, peppery taste, nausea, swelling of tongue
16
SFP-like symptoms have been reported following consumption of non-scombroid fish, which contain low levels of histidine and histamine (Bartholomew et al., 1987). It has been postulated that unknown toxin(s) in these spoiled fish act as mast cell degranulators to induce histamine release, and that endogenous histamine, rather than ingested histamine, accounts for the adverse reactions (Clifford et al., 1991; Ijomah et al., 1991). In human volunteers who were given marlin with high levels of histamine, researchers failed to detect mast cell secretion when directly measuring mast cell degranulation indicators such as tryptase (Morrow et al., 1991; Sanchez-Guerrero et al., 1997). In a recent case–control study of 10 patients with SFP-like syndrome and 50 non-SFP-like syndrome patients with an established allergic disorder, serum tryptase levels in all 10 patients with SFP-like syndrome were in the normal range, while increased tryptase levels were found in most patients with allergy (Ricci et al., 2010). Therefore, these results do not support the hypothesis that release of endogenous histamine is causative, and the underlying mechanism for SFP-like syndrome caused by eating low-histidine fish is unknown. Given that under-reporting of SFP-like syndrome may be occurring, the public health significance is unclear or unknown.
2.4 Factors influencing sensitivity
2.4.1 Histamine intolerance
Histamine intolerance is a type of food intolerance with allergy-like symptoms. It occurs when histamine-rich foods such as cheese and wine are consumed by susceptible individuals. As a consequence of genetic or acquired dysfunction of DAO or HMT, ingested histamine cannot be degraded efficiently in the gastrointestinal tracts of these individuals. The resulting buildup of histamine in the system causes a series of toxic effects that are similar to a common food allergy, which usually include swelling, rashes, hives and asthma-like symptoms such as difficulty in breathing, wheezing and smooth muscle contractions. Gastrointestinal symptoms, such as bloating and diarrhoea, have also been reported (Maintz and Novak, 2007). The same histamine-rich foods would not cause these reactions in a non-susceptible population. This condition can be used to explain the variations among individuals in their susceptibility to dietary histamine in decomposed fish (Motil and Scrimshaw, 1979). People with histamine intolerance are advised to consume a histamine-free diet (Wantke et al., 1993). Individual susceptibility to SFP has been observed in multiple epidemiological studies and healthy volunteer challenge tests. It is generally accepted that the ability to tolerate histamine exposure can be compromised when histamine-metabolizing enzymes are impaired. The factors associated with increased sensitivity to histamine have been summarized in a recent report on biogenic amines (EFSA, 2011). Briefly, reduced histamine metabolism can result from genetic polymorphism (Garcia-Martin et al., 2009), certain physiological states/conditions such as menstruation (Jonassen et al., 1976; Kalogeromitros et al., 1995), gastrointestinal diseases (Mainz and Novak, 2007) and the use of certain medications (Hui, 2006; Taylor, 1986). There is suggestive evidence that the incidence and the severity of SFP may depend on age (Ianuzzi et al., 2007). Smoking and drinking alcohol may also increase sensitivity to biogenic amines by reducing the degradation capacity (EFSA, 2011).
2.5 Analytical methods for histamine A variety of test methods exist for determination of histamine levels in fish (Hungerford, 2010), including the well-accepted Association of Official Analytical Chemists (AOAC) fluorometric method (AOAC 977.13), the spectrofluorometric method (Tine et al., 2008), enzyme-linked immunosorbent assay (ELISA) methods, the colorimetric enzyme test (Sato et
17
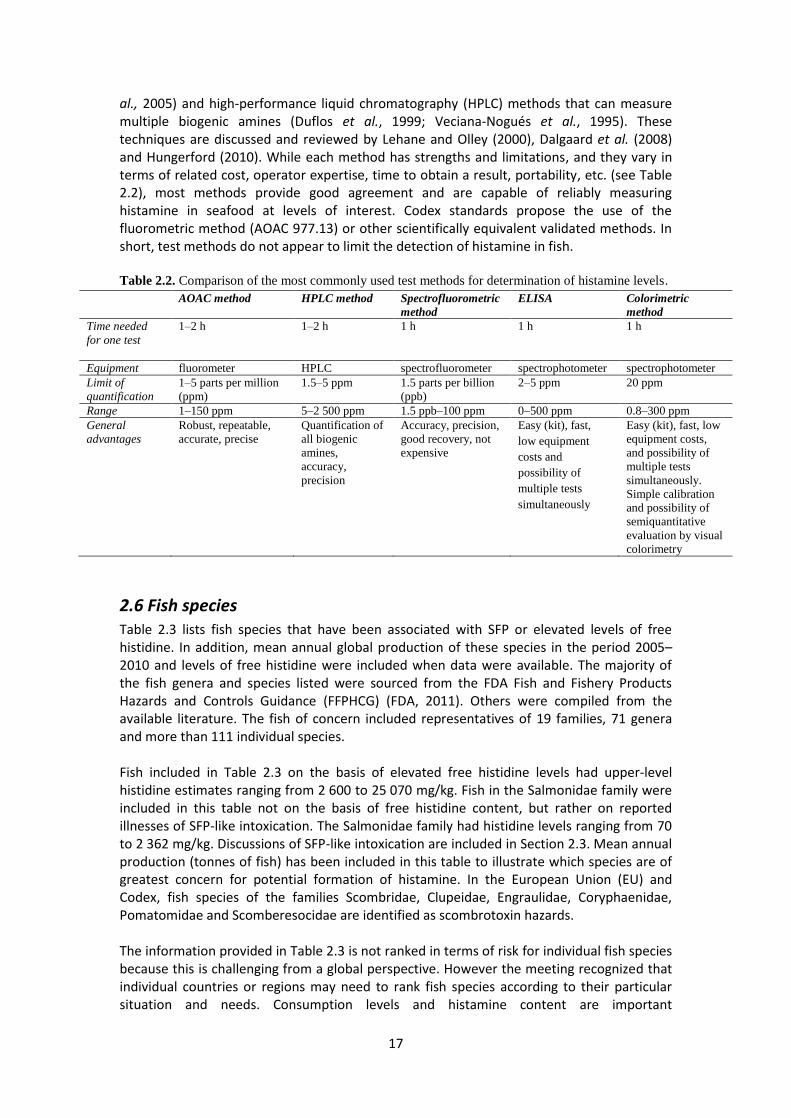
al., 2005) and high-performance liquid chromatography (HPLC) methods that can measure multiple biogenic amines (Duflos et al., 1999; Veciana-Nogués et al., 1995). These techniques are discussed and reviewed by Lehane and Olley (2000), Dalgaard et al. (2008) and Hungerford (2010). While each method has strengths and limitations, and they vary in terms of related cost, operator expertise, time to obtain a result, portability, etc. (see Table 2.2), most methods provide good agreement and are capable of reliably measuring histamine in seafood at levels of interest. Codex standards propose the use of the fluorometric method (AOAC 977.13) or other scientifically equivalent validated methods. In short, test methods do not appear to limit the detection of histamine in fish.
Table 2.2. Comparison of the most commonly used test methods for determination of histamine levels.
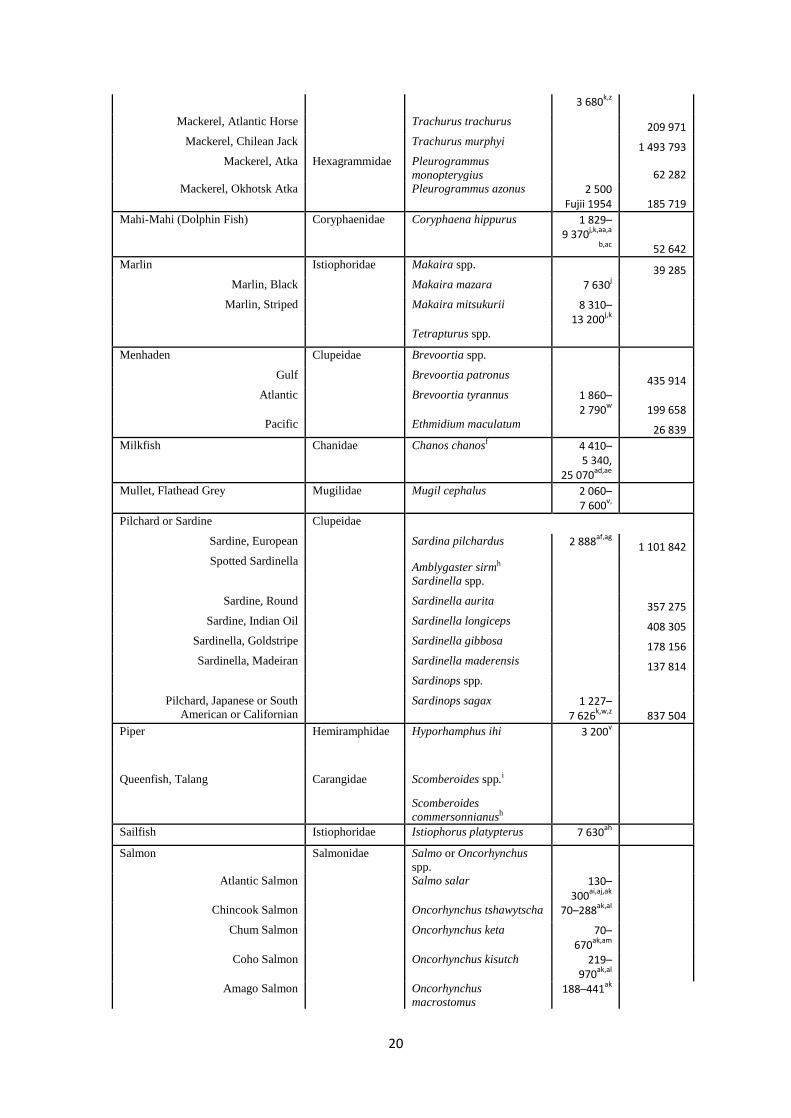
2.6 Fish species Table 2.3 lists fish species that have been associated with SFP or elevated levels of free histidine. In addition, mean annual global production of these species in the period 2005–2010 and levels of free histidine were included when data were available. The majority of the fish genera and species listed were sourced from the FDA Fish and Fishery Products Hazards and Controls Guidance (FFPHCG) (FDA, 2011). Others were compiled from the available literature. The fish of concern included representatives of 19 families, 71 genera and more than 111 individual species. Fish included in Table 2.3 on the basis of elevated free histidine levels had upper-level histidine estimates ranging from 2 600 to 25 070 mg/kg. Fish in the Salmonidae family were included in this table not on the basis of free histidine content, but rather on reported illnesses of SFP-like intoxication. The Salmonidae family had histidine levels ranging from 70 to 2 362 mg/kg. Discussions of SFP-like intoxication are included in Section 2.3. Mean annual production (tonnes of fish) has been included in this table to illustrate which species are of greatest concern for potential formation of histamine. In the European Union (EU) and Codex, fish species of the families Scombridae, Clupeidae, Engraulidae, Coryphaenidae, Pomatomidae and Scomberesocidae are identified as scombrotoxin hazards. The information provided in Table 2.3 is not ranked in terms of risk for individual fish species because this is challenging from a global perspective. However the meeting recognized that individual countries or regions may need to rank fish species according to their particular situation and needs. Consumption levels and histamine content are important
18
considerations in such analyses. Further information on such ranking can be found in Guillier et al. (2011). Table 2.3. Scientific names, free histidine levels and mean annual production levels for fish associated
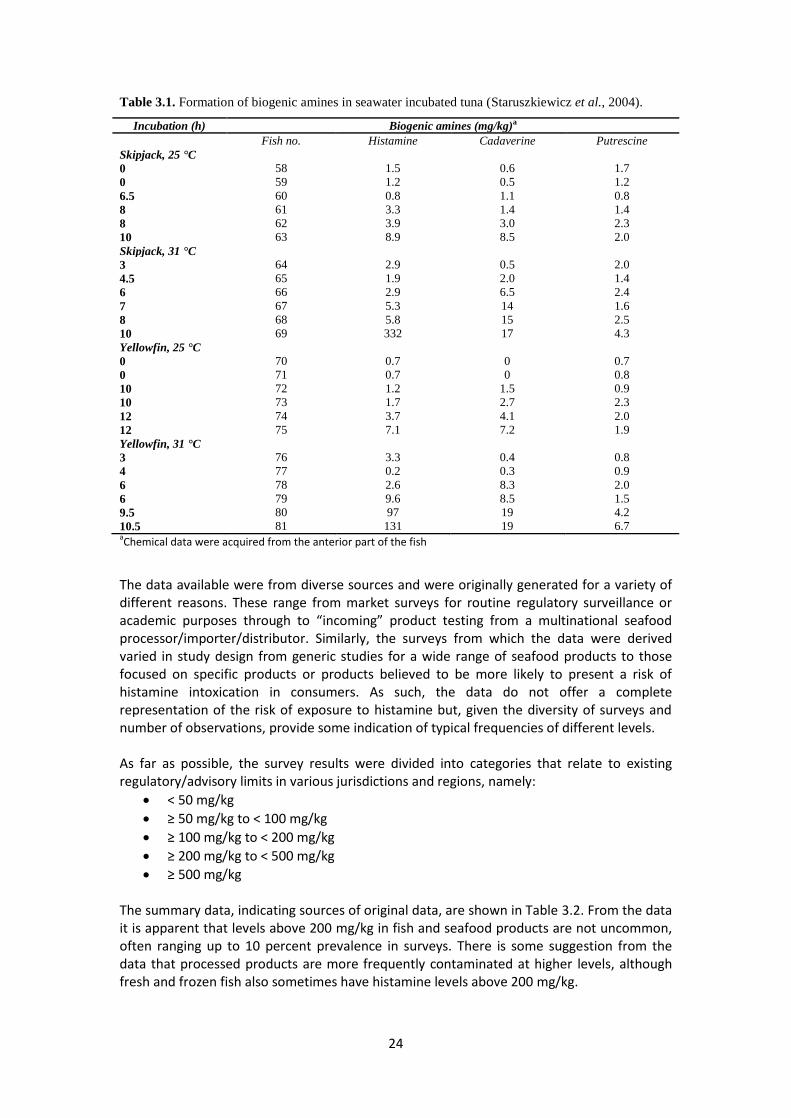
3.1 Introduction Histidine decarboxylating bacteria can be part of the natural microflora in the skin, gills and gut of a freshly caught fish. Given that free histidine is present in the tissues of the fish involved in SFP, the bacterial action could start soon after harvest, and if temperature conditions are suitable these bacteria multiply rapidly and form histamine even before postmortem proteolysis occurs. This could explain the observation that histamine can reach elevated levels before the formation of organoleptic spoilage indicators. Once bacterial multiplication has occurred and histidine decarboxylases are produced, enzyme activity can continue slowly at refrigeration temperatures, even after bacterial growth has ceased (Lehane and Olley, 2000). Histamine formation in fish is dependent on the time/temperature conditions under which the fish is handled, and therefore time/temperature control needs to be taken into consideration from harvest through consumption. There are many fish harvesting methods used throughout the world, employing hooks, nets and traps. These may involve small vessels, large vessels or be shore based. In all cases, live retrieval of the fish, cooling as quickly as possible to temperatures which do not promote bacterial growth, and maintaining at cool temperatures are critical both to discourage histamine formation and to preserve quality. This translates into a need to supply, wherever possible, small boats with ice in boxes to provide insulation and to protect fish from the elements (Shawyer and Pizzali, 2003) and for larger vessels to be equipped with operational and well maintained refrigeration or freezing equipment. Further along the distribution chain, transport trucks need to be equipped to keep the fish cold and protected from the elements (Johnston et al., 1994). Similarly, fish vendors need to maintain this cold chain by, for example, keeping the fish on ice. High histamine levels are a result of gross time/temperature abuse during handling and storage. For example, as presented in Table 3.1, skipjack tuna stored at 25 and 31 °C did not accumulate histamine to levels greater than 10 mg/kg during up to 8 hours of storage. In yellowfin tuna stored under the same conditions, histamine levels remained below 10 mg/kg for up to 6 hours of storage but histamine began to accumulate when fish were stored for longer time periods. In fact, after 10.5 hours at 31 °C, histamine levels reached 131 mg/kg (Staruszkiewicz et al., 2004). These data illustrate that the presence of histamine in fish is related to a lack of time/temperature control. Furthermore, histamine formation can be influenced by evisceration. For example, in uneviscerated yellowfin tuna stored at 30 °C for 12 hours, the maximum histamine level reached 2 400 mg/kg but in eviscerated tuna, stored under the same conditions, the levels did not exceed 16 mg/kg (Benner et al., 2009).
3.2 Detection frequency of histamine and levels of contamination Data describing histamine concentrations and frequencies in seafoods and seafood products were collated to assist in the identification of products representing the greatest risk to public health. These data, together with estimates of the frequency and amount of consumption of specific seafoods and types of fish, are needed to assess human exposure to histamine from seafoods. Data were obtained from existing published literature, or were provided in response to requests for data prior to the meeting.
24
Table 3.1. Formation of biogenic amines in seawater incubated tuna (Staruszkiewicz et al., 2004).
Incubation (h) Biogenic amines (mg/kg)a
Fish no. Histamine Cadaverine Putrescine
Skipjack, 25 °C
0 58 1.5 0.6 1.7
0 59 1.2 0.5 1.2
6.5 60 0.8 1.1 0.8
8 61 3.3 1.4 1.4
8 62 3.9 3.0 2.3
10 63 8.9 8.5 2.0
Skipjack, 31 °C
3 64 2.9 0.5 2.0
4.5 65 1.9 2.0 1.4
6 66 2.9 6.5 2.4
7 67 5.3 14 1.6
8 68 5.8 15 2.5
10 69 332 17 4.3
Yellowfin, 25 °C
0 70 0.7 0 0.7
0 71 0.7 0 0.8
10 72 1.2 1.5 0.9
10 73 1.7 2.7 2.3
12 74 3.7 4.1 2.0
12 75 7.1 7.2 1.9
Yellowfin, 31 °C
3 76 3.3 0.4 0.8
4 77 0.2 0.3 0.9
6 78 2.6 8.3 2.0
6 79 9.6 8.5 1.5
9.5 80 97 19 4.2
10.5 81 131 19 6.7 aChemical data were acquired from the anterior part of the fish
The data available were from diverse sources and were originally generated for a variety of different reasons. These range from market surveys for routine regulatory surveillance or academic purposes through to “incoming” product testing from a multinational seafood processor/importer/distributor. Similarly, the surveys from which the data were derived varied in study design from generic studies for a wide range of seafood products to those focused on specific products or products believed to be more likely to present a risk of histamine intoxication in consumers. As such, the data do not offer a complete representation of the risk of exposure to histamine but, given the diversity of surveys and number of observations, provide some indication of typical frequencies of different levels. As far as possible, the survey results were divided into categories that relate to existing regulatory/advisory limits in various jurisdictions and regions, namely:
< 50 mg/kg
≥ 50 mg/kg to < 100 mg/kg
≥ 100 mg/kg to < 200 mg/kg
≥ 200 mg/kg to < 500 mg/kg
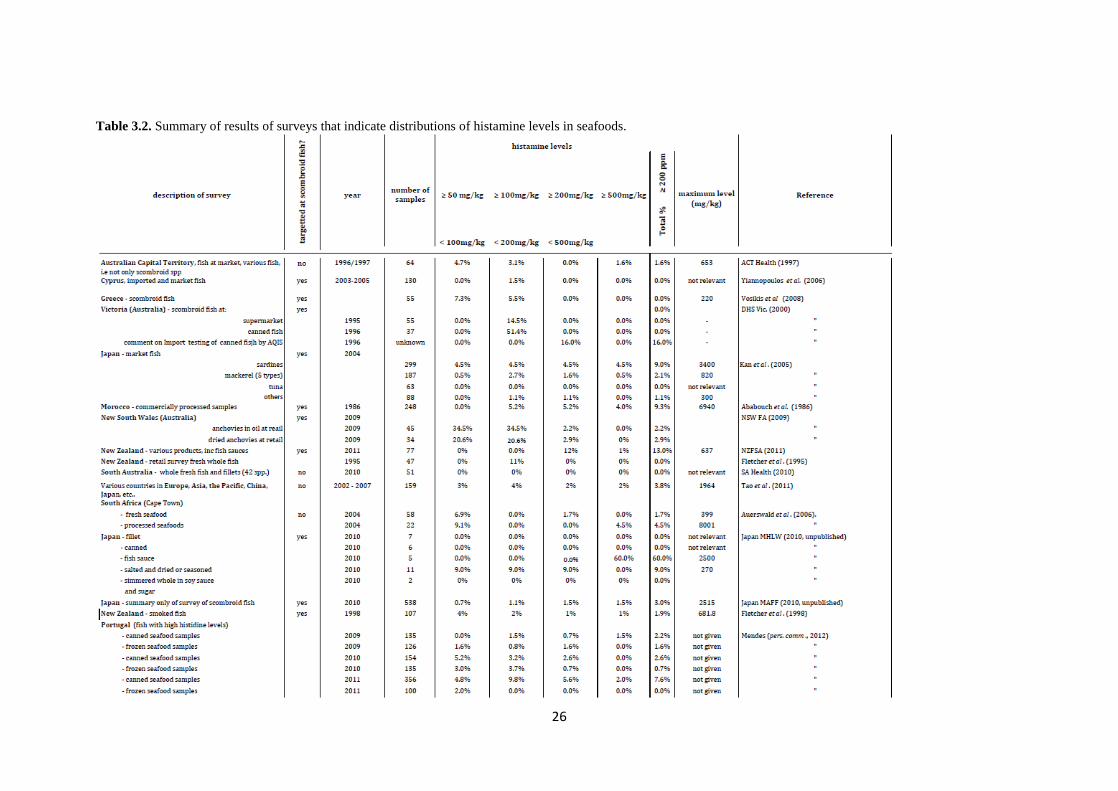
≥ 500 mg/kg The summary data, indicating sources of original data, are shown in Table 3.2. From the data it is apparent that levels above 200 mg/kg in fish and seafood products are not uncommon, often ranging up to 10 percent prevalence in surveys. There is some suggestion from the data that processed products are more frequently contaminated at higher levels, although fresh and frozen fish also sometimes have histamine levels above 200 mg/kg.
25
The histamine levels for canned tuna in Canada were provided by a major importer and marketer. These data reflect production under extensive good hygienic practices (GHP), good manufacturing practices (GMP) and HACCP from fish sourcing through to processing, and importing. The data suggest that histamine levels can be minimized by appropriate food safety and quality management systems. From the data presented, a presumptive conclusion is that without well designed GMP and HACCP systems up to 10 percent of product units may develop histamine in excess of 200 mg/kg, whereas well designed GMP and HACCP virtually eliminate product units with more than 200 mg/kg histamine. As discussed elsewhere, fermented fish sauces are consumed in small quantities (a few grams per serving) and recent Codex decisions (CODEX STAN 302 – 2011; Standard for Fish Sauce) have established that up to 400 mg/kg histamine in such products still provides an acceptable level of consumer protection. Application of the tools provided in this document may be used to reassess safe levels of histamine in fish sauce.
3.3 Consumption The consumption information available in different databases has been collected using different methodologies, which makes synthesis of the data problematic. Nevertheless an approach to the determination of serving size was made using the data available for a number of food consumption databases. These included:
i. EFSA Comprehensive European Food Consumption Database (EFSA, 2011a); ii. Database of Food Consumption of Thai People (ACFS, 2006);
iii. Japanese National Household Expenditure Survey (The Management and Coordination Agency of Japan, 2012);
iv. Consumption frequency data published by the JA General Research Institute, results of consumer buying behaviours for meat and seafood products (JA, 2010);
v. Food Safety Commission Investigations (FSCJ, 2006) for food-borne microbiological risk assessments;
vi. UK National Diet and Nutrition Survey (Henderson et al., 2002); vii. United States Environmental Protection Agency Estimated Per Capita Fish
Consumption (EPA, 2002); viii. New Zealand National Nutrition Survey (Russell et al., 1999).
Serving size/portion size per consumer is defined in different ways in the literature. The United Kingdom Seafish Authority (Seafish, 2012) defines one portion of seafood as 140 g. On the basis of data from the EFSA Concise Food Consumption Database, however, the 95th percentile of consumption among fish consumers ranges between 250 g/day and 422 g/day, with an across-countries median of 300 g/day. Available data on the 97.5th percentile range in the same European countries varies between 300 g/day and 500 g/day, with an across-countries median of 322 g/day.
26
Table 3.2. Summary of results of surveys that indicate distributions of histamine levels in seafoods.
27
Table 3.2 (cont.). Summary of results of surveys that indicate distributions of histamine levels in seafoods.
§ These data were included for information but were not used in the calculation of “typical” histamine contamination levels because of the known higher levels of histamine typical of
fermented Asian fish sauces.
28
Data for consumption of individual fish species per consumer are very scarce. As presented in Table 3.3, which shows consumption of major fish species in the UK for one day, the median of the 97.5th percentile of fish consumption across species is 258 g/day. At the same percentile the mean consumption for different fish species ranges among fish consumers between 185 g/day and 369 g/day. Among species recognized as frequent histamine affected species, herring, fresh tuna, mackerel, sardines and canned tuna are, in decreasing order, the species with the highest portion size per eater per day. Table 3.3. Statistical consumption data for fish products in the UK included in the group “Fish and
Shellfish” of the UK National Diet and Nutrition Survey (Henderson et al., 2002).
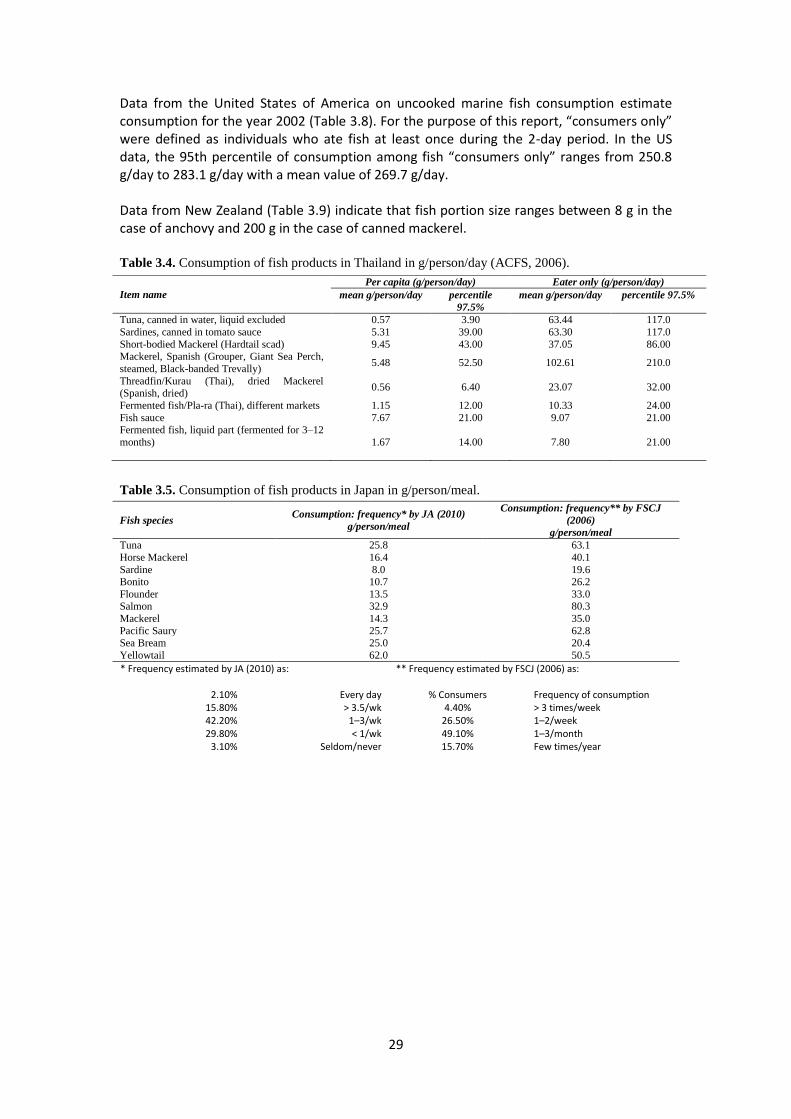
In Thailand, consumption per eater of major fish products linked with histamine production has a mean range from 7.8 to 102.6 g/person/day (Table 3.4). If the 97.5th percentile is considered, consumption will be between 21 g/day for fermented fish and 210 g/day for mackerel. Ranking the most important fish products per portion size gives Spanish mackerel, tuna, sardines, short-bodied mackerel and fermented products in decreasing order of importance.
Data from Japan for consumption of fish species in 2009 is presented in Table 3.5. The range of consumption on a meal basis is calculated as shown in the footnotes to Table 3.5, using the frequency of consumption of a fish meal throughout the year. The estimated mean consumption per meal per person is 8.0–19.6 g for sardine and 32.9–0.3 g for salmon, depending on the frequency data.
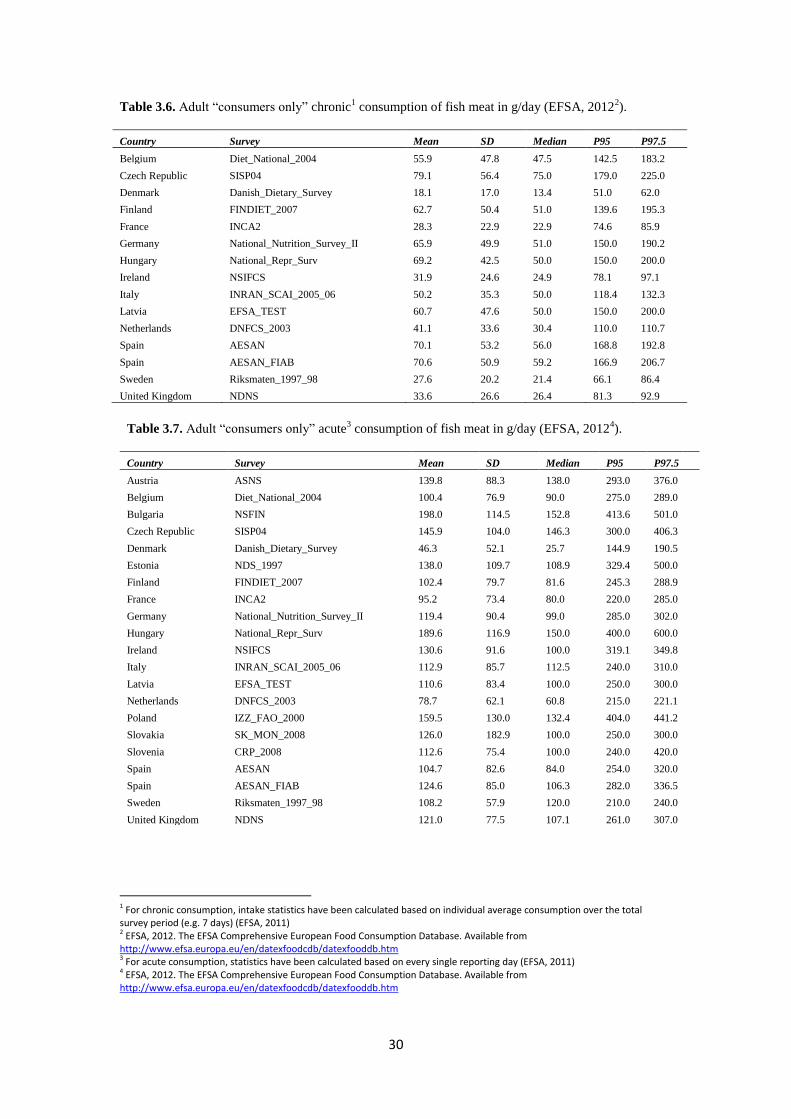
For the European Union, Tables 3.6 and 3.7 summarize information from the EFSA Comprehensive European Food Consumption Database. The database reports dietary surveys and food consumption data for each country by food category and covers both regular/“chronic” and high/“acute” consumption. Adult consumers and fish meat consumption were chosen as the criteria for construction of the tables. Looking at the regular consumption per day (Table 3.6) reveals a considerable difference among European countries; Sweden has the lowest 97.5th percentile, 86.4 g/day, and the Czech Republic has the highest, 225.0 g/day. The mean value across EU countries is 162.4 g/day. If, on the other hand, the high/“acute” consumption is considered (Table 3.7), the consumption ranges from 190.5 g/day in Denmark to 600 g/day in Hungary, with a mean value across Europe of 270 g/day.
Item Mean
g/day
Median
g/day
97.5 Percentile
g/day
Maximum
g/day
Cod 82 79 207 338
Tuna – canned 75 63 185 265
Tuna – fresh 97 100 258 305
Haddock 82 70 225 340
Salmon 107 96 340 610
Sardine/pilchard 85 80 237 360
Trout 152 154 369 460
Mackerel 101 97 239 486
Herring 125 120 332 370
Plaice 129 106 346 400
Sole 140 145 315 327
minimum 75 63 185 265
maximum 152 154 369 610
median 101 97 258 360
29
Data from the United States of America on uncooked marine fish consumption estimate consumption for the year 2002 (Table 3.8). For the purpose of this report, “consumers only” were defined as individuals who ate fish at least once during the 2-day period. In the US data, the 95th percentile of consumption among fish “consumers only” ranges from 250.8 g/day to 283.1 g/day with a mean value of 269.7 g/day. Data from New Zealand (Table 3.9) indicate that fish portion size ranges between 8 g in the case of anchovy and 200 g in the case of canned mackerel. Table 3.4. Consumption of fish products in Thailand in g/person/day (ACFS, 2006).
Table 3.5. Consumption of fish products in Japan in g/person/meal.
Fish species Consumption: frequency* by JA (2010)
g/person/meal
Consumption: frequency** by FSCJ
(2006)
g/person/meal
Tuna 25.8 63.1
Horse Mackerel 16.4 40.1
Sardine 8.0 19.6 Bonito 10.7 26.2
Flounder 13.5 33.0 Salmon 32.9 80.3
Mackerel 14.3 35.0
Pacific Saury 25.7 62.8 Sea Bream 25.0 20.4
Yellowtail 62.0 50.5
* Frequency estimated by JA (2010) as:
** Frequency estimated by FSCJ (2006) as:
2.10% 15.80% 42.20% 29.80%
3.10%
Every day > 3.5/wk
1–3/wk < 1/wk
Seldom/never
% Consumers 4.40%
26.50% 49.10% 15.70%
Frequency of consumption > 3 times/week 1–2/week 1–3/month Few times/year
Item name
Per capita (g/person/day) Eater only (g/person/day)
mean g/person/day percentile
97.5%
mean g/person/day percentile 97.5%
Tuna, canned in water, liquid excluded 0.57 3.90 63.44 117.0
Sardines, canned in tomato sauce 5.31 39.00 63.30 117.0
Sweden Riksmaten_1997_98 108.2 57.9 120.0 210.0 240.0
United Kingdom NDNS 121.0 77.5 107.1 261.0 307.0
1 For chronic consumption, intake statistics have been calculated based on individual average consumption over the total survey period (e.g. 7 days) (EFSA, 2011) 2 EFSA, 2012. The EFSA Comprehensive European Food Consumption Database. Available from http://www.efsa.europa.eu/en/datexfoodcdb/datexfooddb.htm 3 For acute consumption, statistics have been calculated based on every single reporting day (EFSA, 2011) 4 EFSA, 2012. The EFSA Comprehensive European Food Consumption Database. Available from http://www.efsa.europa.eu/en/datexfoodcdb/datexfooddb.htm
Table 3.6. Adult “consumers only” chronic1 consumption of fish meat in g/day (EFSA, 2012
Table 3.8. Consumption estimates for uncooked marine fish (g/person/day) of consumers only (aged
18 years and older) in the USA (EPA, 2002).
Table 3.9. Consumption of fish products in New Zealand in g/meal (Russell et al., 1999).
The data from various nations and regions indicate that typical serving sizes for fish are in the range of approximately 40 to 100 g and the 97.5th percentiles are typically in the range 250–350 g. The amount of fish or fishery product consumed during any one eating occasion is rather variable, with clear differences among countries and regions. The meeting considered that because SFP occurs as a result of an acute exposure, it was important to agree on a serving size that would capture this regional variation and still be reflective of the high-volume eating events. As noted earlier, the different approaches to data collection on consumption make it difficult to combine and summarize the available data mathematically. Therefore, the meeting took a more qualitative approach and, using a combination of the information available and expert opinion, agreed that a serving size of 250 g be used in the risk characterization because it captured the maximum amount eaten in most countries on a single eating occasion.
4.1 Histamine as the exposure marker in SFP Although other biogenic amines such as cadaverine and putrescine might also play a role in the aetiology of SFP, there are no dose–response data in animals or humans for these biogenic amines. In most epidemiological studies, SFP is associated with abnormally high histamine levels in the incriminated fish. Therefore, histamine is considered the most appropriate marker of dose in this assessment.
4.2 Type of study used in the dose–response assessment While there have been a number of reports in the scientific literature of human scombrotoxin poisoning, the vast majority of these are case reports. These case reports generally involve only a small number of individuals (e.g. three or four subjects). In a few of the studies multiple subjects are involved, with several case reports involving slightly more than 100 individuals. The difficulty with case reports is that the recapitulation of the dosage/exposure level is almost impossible to determine. Crude measures have been used to estimate what the dose/exposure level was by using levels detected in samples of the suspect fish, and/or detailed recalled by the patients. These estimates of exposure/dosage are highly uncertain and cannot be used to construct a quantitative assessment of dose versus adverse response. With regard to the few retrospective studies, as is always the case with this type of study, there are important limitations, including reliance on voluntary reporting, limited follow-up, and lack of specific determination of histamine or any other biogenic amine in fish samples consumed by the subjects, or in their biologic fluids. However, the typical histamine-like clinical manifestations together with temporal proximity to consumption of fish known to be involved in scombrotoxin poisoning supports the diagnosis of biogenic amine poisoning. The other major hurdle in the quantitative use of these studies is the uncertainty associated with a lack of understanding of whether histamine is the sole responsible aetiological toxin(s), whether it is a surrogate of another toxin(s), or whether histamine is working in concert with other biogenic amines or as yet unidentified chemicals in the fish, and what the nature of that relationship is (e.g. additive or synergistic). Histamine levels within fish appear to correlate well with clinical toxicity, but an equivalent oral dose of pure histamine produces few symptoms. Even with several hypotheses attempting to explain the paradox, as previously discussed, the mechanism of toxicity in SFP remains unclear. To study the health effectsof histamine in humans, a number of volunteer challenge studies have been conducted. Many studies were aimed at investigating the minimal dose of histamine that causes SFP or histamine intolerance symptoms, or the maximal dose of histamine ingested without causing these symptoms. Most of these studies were well-designed randomized trials, in which the doses were well controlled and the symptoms were carefully monitored by medical professionals. Therefore, data from these human trials should reflect the histamine–SFP dose–response relationship better than that from case reports.
4.3 Study selection for dose–response assessment Human histamine challenge studies are summarized in the EFSA biogenic amine report (EFSA, 2011) and the “Seafood Biogenic Amine Database” (Emborg and Dalgaard, 2007). In these studies histamine was administered with different food matrices and given to healthy
33
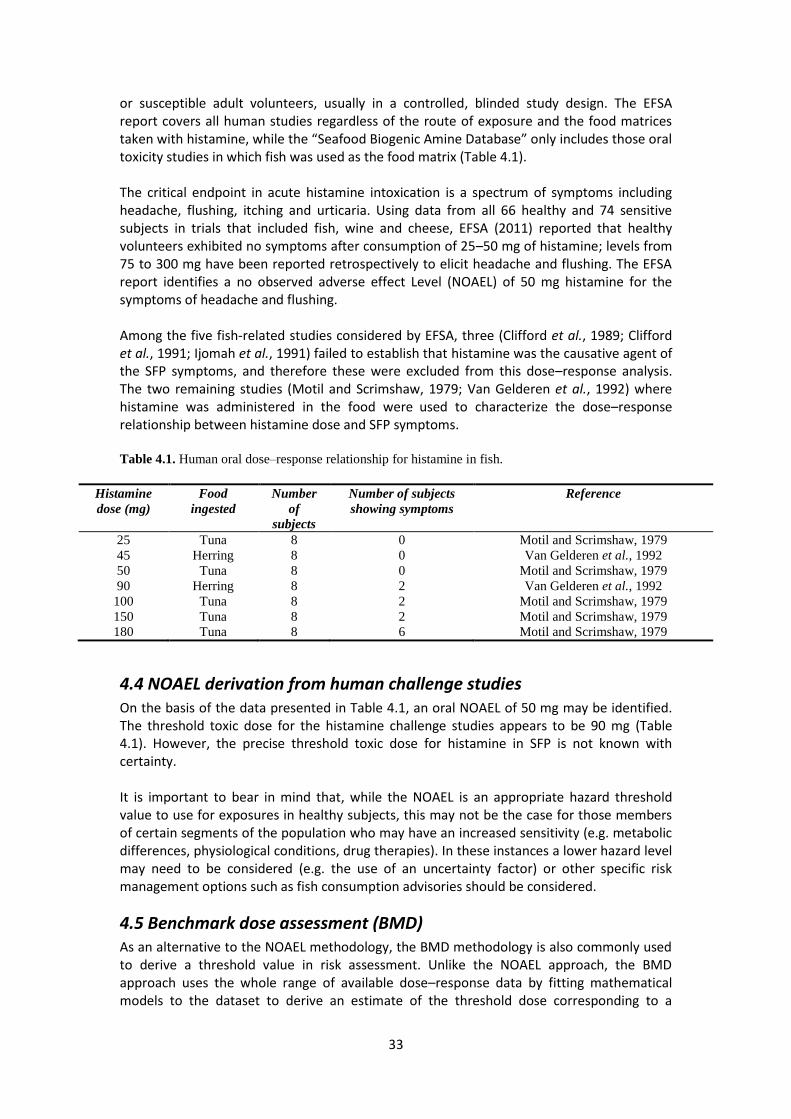
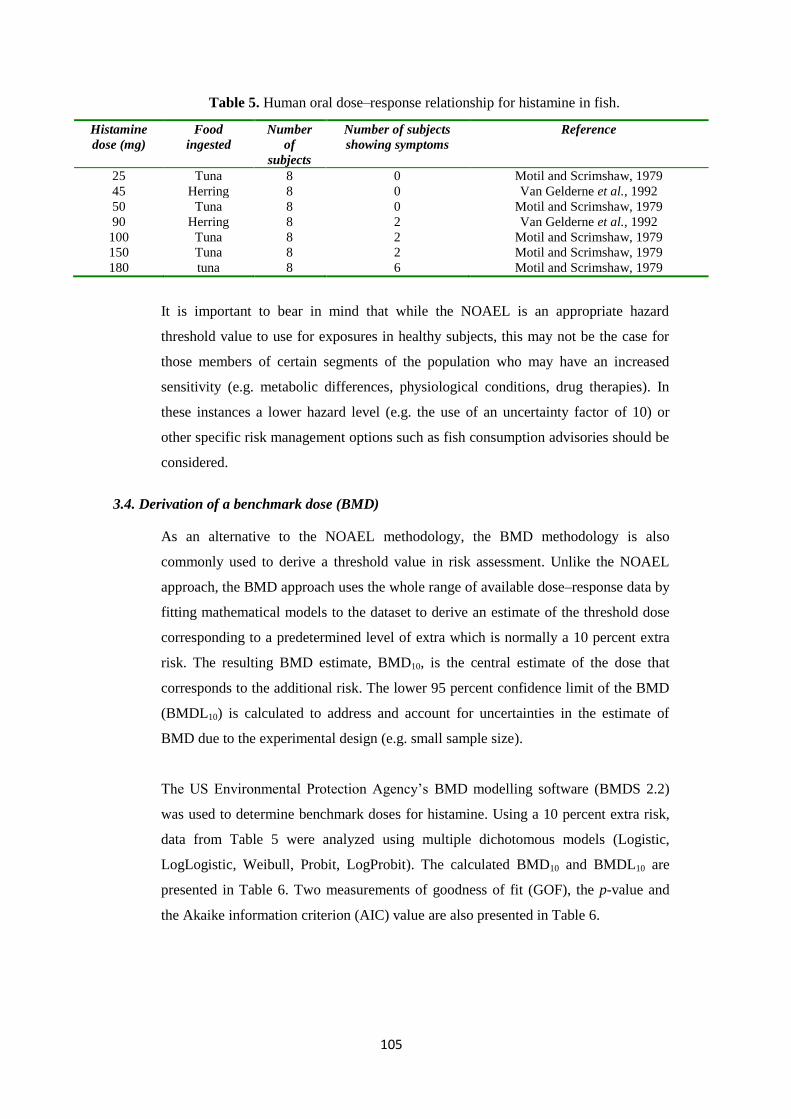
or susceptible adult volunteers, usually in a controlled, blinded study design. The EFSA report covers all human studies regardless of the route of exposure and the food matrices taken with histamine, while the “Seafood Biogenic Amine Database” only includes those oral toxicity studies in which fish was used as the food matrix (Table 4.1). The critical endpoint in acute histamine intoxication is a spectrum of symptoms including headache, flushing, itching and urticaria. Using data from all 66 healthy and 74 sensitive subjects in trials that included fish, wine and cheese, EFSA (2011) reported that healthy volunteers exhibited no symptoms after consumption of 25–50 mg of histamine; levels from 75 to 300 mg have been reported retrospectively to elicit headache and flushing. The EFSA report identifies a no observed adverse effect Level (NOAEL) of 50 mg histamine for the symptoms of headache and flushing. Among the five fish-related studies considered by EFSA, three (Clifford et al., 1989; Clifford et al., 1991; Ijomah et al., 1991) failed to establish that histamine was the causative agent of the SFP symptoms, and therefore these were excluded from this dose–response analysis. The two remaining studies (Motil and Scrimshaw, 1979; Van Gelderen et al., 1992) where histamine was administered in the food were used to characterize the dose–response relationship between histamine dose and SFP symptoms. Table 4.1. Human oral dose–response relationship for histamine in fish.
Histamine
dose (mg)
Food
ingested
Number
of
subjects
Number of subjects
showing symptoms
Reference
25 Tuna 8 0 Motil and Scrimshaw, 1979
45 Herring 8 0 Van Gelderen et al., 1992
50 Tuna 8 0 Motil and Scrimshaw, 1979
90 Herring 8 2 Van Gelderen et al., 1992
100 Tuna 8 2 Motil and Scrimshaw, 1979
150 Tuna 8 2 Motil and Scrimshaw, 1979
180 Tuna 8 6 Motil and Scrimshaw, 1979
4.4 NOAEL derivation from human challenge studies On the basis of the data presented in Table 4.1, an oral NOAEL of 50 mg may be identified. The threshold toxic dose for the histamine challenge studies appears to be 90 mg (Table 4.1). However, the precise threshold toxic dose for histamine in SFP is not known with certainty. It is important to bear in mind that, while the NOAEL is an appropriate hazard threshold value to use for exposures in healthy subjects, this may not be the case for those members of certain segments of the population who may have an increased sensitivity (e.g. metabolic differences, physiological conditions, drug therapies). In these instances a lower hazard level may need to be considered (e.g. the use of an uncertainty factor) or other specific risk management options such as fish consumption advisories should be considered.
4.5 Benchmark dose assessment (BMD) As an alternative to the NOAEL methodology, the BMD methodology is also commonly used to derive a threshold value in risk assessment. Unlike the NOAEL approach, the BMD approach uses the whole range of available dose–response data by fitting mathematical models to the dataset to derive an estimate of the threshold dose corresponding to a
34
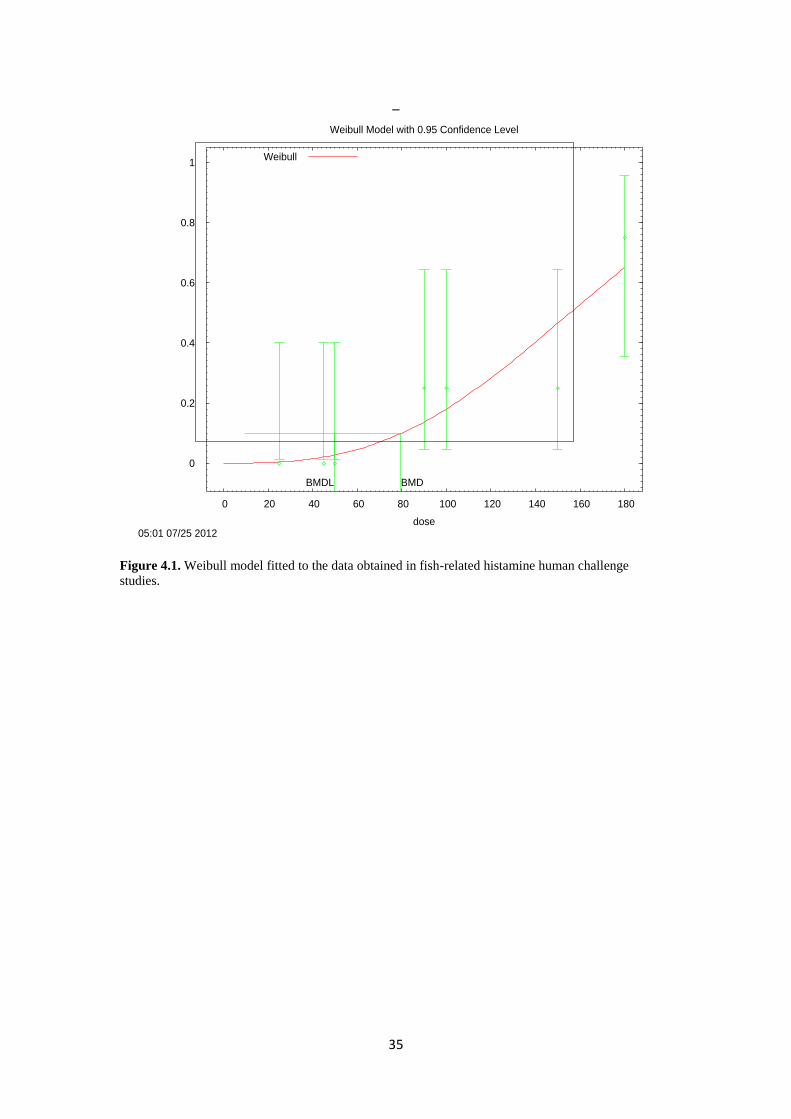
predetermined level of extra risk, which is normally a 10 percent extra risk. The resulting BMD estimate, BMD10, is the central estimate of the dose that corresponds to the additional risk. The lower 95 percent confidence limit of the BMD (BMDL10) is calculated to address and account for uncertainties in the estimate of BMD due to the experimental design (e.g. small sample size). The United States Environmental Protection Agency’s benchmark dose–response modelling software was used to determine benchmark doses. A 10 percent extra risk was selected as the benchmark response value for development of a BMD10 (the benchmark dose referring to the 10 percent extra risk) and a BMDL10 (the lower limit on the benchmark dose for a 10 percent extra risk). Data from Table 4.1 were analysed using multiple dichotomous models (five). Figure 4.1 shows the Weibull model fitted to the dose–response data. The calculated BMD10 value is 80 mg, and the BMDL10 (95 percent lower confidence limit of BMD) is 50 mg. Two measurements of goodness of fit (GOF), the p-value and the Akaike information criterion (AIC) value, were calculated and used to compare the models. The Weibull model has the most conservative BMDL, and the best GOF (p = 0.64) and AIC (AIC = 44), among different models tested. In addition the Weibull model was judged to be the most biologically plausible model and was selected as the best model for BMD modelling. Given that the study of Motil and Scrimshaw (1979) had more dose groups (five doses) than that of Van Gelderen et al. (1992) (two doses), a separate BMD modelling procedure was performed using data from Motil and Scrimshaw (1979) only. The BMD10 and BMDL10 resulting from this assessment were very close to those produced in the assessment of the combined dataset from the two studies. For the Weibull model, the BMDL10 was 47.7 mg, compared with 49.7 mg from the assessment of the combined dataset Both the NOAEL and BMD assessments identified 50 mg of histamine per meal as the dose where either adverse effects were not noted or the estimate of additional risk (lower confidence level) is low. This dosage level will not apply to individuals with a specific sensitivity to histamine and would not apply to children, particularly because they consume more food per unit body weight than adults. It is also important to bear in mind that the 50 mg dosage was derived from data on a small number of subjects, and while the variation of response appears to be reflected in the study results further studies would be most helpful in refining this threshold value. Further background information on the dose–response evaluation is included in Annex 3.
35
_
Figure 4.1. Weibull model fitted to the data obtained in fish-related histamine human challenge
studies.
0
0.2
0.4
0.6
0.8
1
0 20 40 60 80 100 120 140 160 180
Fra
ction A
ffecte
d
dose
Weibull Model with 0.95 Confidence Level
05:01 07/25 2012
BMDL BMD
Weibull
36
5. Risk characterization
5.1 Derivation of a histamine limit based on the NOAEL The NOAEL (50 mg) for histamine as presented in the previous chapter was used for risk
characterization. Based on the consumption data presented in Chapter 3 (Exposure
assessment) the meeting agreed to use a serving size of 250 g, and noted that this can be
considered as the upper value for a serving size. Based on the hazard level of 50 mg of
histamine and a consumption (m) of 250 g, the maximum concentration or level of histamine
(L) in that serving that would not cause an adverse effect was calculated consequently as
follows:
5.2 Characterization of histamine distribution from censored data In a given population of fish, the probability of a histamine level equalling or exceeding 200
mg/kg can be estimated by statistical methods, provided that the distribution of histamine is
known. To determine what type of distribution the histamine level follows, we first fitted
different univariate distributions to some censored data, such as those obtained from the
surveys presented in Chapter 3. This was done with the R package fitdistrplus by the
maximum likelihood method (Pouillot and Delignette-Muller, 2010).
Based on the Akaike information criterion (AIC), a measure of goodness of fit, it was found that the logarithms of histamine concentrations in different surveys follow a normal distribution, as follows:
Where C is the histamine concentration, and µ and are parameters of the distribution, respectively the mean and standard deviation of the lognormal distribution. An example of the distribution fitted to the survey data is shown in Figure 5.1.
37
log10(C) (C in ppm)
Figure 5.1. Fitting of normal cumulative distribution function (CDF) to data from a survey (dried
anchovies at retail, New South Wales, see Table 5.1) using the fitdistrplus R package.
5.3 Calculating the probability of histamine level exceeding 200 mg/kg Given the fact that the histamine concentration in seafood (C) follows a lognormal distribution, i.e. log10 (C) follows a normal distribution, the probability of a histamine level higher than the 200 mg/kg limit can be derived using the statistical methods described below. In a normal distribution, when both the mean and the standard deviation are known, it is straightforward to calculate the probability of being at certain concentration level. Using the same histamine dataset (shown in Figure 5.1) as an example, after a simple logarithmic transformation, Log10 (C) can be plotted as a bell-shaped curve of a normal distribution, with
µ =1.65 and and = 0.34 (Figure 5.2). Thus, after the logarithmic transformation, calculating the probability of C > 200 mg/kg is the same as calculating the probability of log10 (C) > log10 200, i.e. log10 (C) > 2.3. In this example, the probability of a sample whose log10 (C) exceeds 2.3 mg/kg can be illustrated as the shaded area in Figure 5.2, and calculated as follows:
NormalCDF is the cumulative density function of the Normal distribution (under Excel: NORM.DIST[log10(200),1.65,0.34,cumulative]). It gives the probability that a number falls at or below a given value (here, log10(L)) of a normal distribution.
38
Figure 5.2. Probability density function (PDF) and cumulative density function (CDF), describing the
log10 of histamine concentration. The dotted red line represents log10(L), i.e. log10(200).
Table 5.1 presents the fitted parameters and the probability of reaching or exceeding 200 mg/kg (under the assumption of a 250 g serving size). The probability of exceeing 200 mg/kg varied from less than 1 x 10⁻⁶ to 0.68, according to the survey (Table 5.1). We observed that in surveys in which high contents of histamine were detected the standard deviations of the normal distribution describing log10 (C) were often high (above 1.3), yet the associated means were often low (below 0) (e.g. for mackerel in market fish in Japan or canned tuna imports to Canada). For surveys in which no high concentration of histamine was detected, the standard deviations are comparatively low (about 0.5 or less) but the associated means are comparatively high (greater than 1.0). This is probably due to the limited sample size of these surveys. These probabilities of exceeding the limit are only representative of the foods analysed. As it is almost impossible from the surveys to know whether sampling was representative of the country consumption profile, the results cannot be compared among countries. In the same way, fish categories cannot be compared directly unless the surveys were conducted in the same country according to a similar sampling plan.
0
0,2
0,4
0,6
0,8
1
1,2
0
0,2
0,4
0,6
0,8
1
1,2
0 1 2 3 4
CD
F
PD
F
log10(C) (C in ppm)
39
Table 5.1. Parameters of the Normal distribution fitted to the logarithm of the concentration of
histamine, and probability of exceeding the limit of 200 mg/kg for each survey referenced in Table 3.2.
Description of surveya log10(C)N(µ, ) Probability (C > 200
ppm) µ
Australian Capital Territory – fish at market, various fish, i.e not only scombroid spp.
1.39 0.44 0.019
Cyprus – imported and market fish 1.85 0.07 < 0.000001
Greece – scombroid fish 1.04 0.64 0.024
Victoria (Australia) – scombroid fish at:
supermarket 1.93 0.07 < 0.000001
canned fish 2.00 0.05 < 0.000001
Japan – market fish
sardines 1.35 0.38 0.0061
mackerel (five types) –0.36 1.29 0.020
tuna -b - -
others –1.03 1.37 0.0075
Morocco – commercially processed samples
0.98 0.97 0.086
New South Wales (Australia)
anchovies in oil at retail 1.83 0.23 0.020
dried anchovies at retail 1.65 0.34 0.028
New Zealand – various products, inc. fish sauces 1.91 0.35 0.13
New Zealand – retail survey fresh whole fish 1.92 0.06 < 0.000001
South Australia - - -
Various countries in Europe, Asia, the Pacific, China, Japan, etc. 0.31 1.13 0.039
South Africa (Cape Town)
fresh seafood 0.78 0.67 0.011
processed seafoods –0.33 1.82 0.074
Japan
fish sauce 2.57 0.57 0.68
salted and dried or seasoned 1.61 0.14 < 0.000001
Japan – summary only of survey of scombroid fish 1.68 0.45 0.083
New Zealand – smoked fish 0.37 0.92 0.018
Portugal (fish with high histidine levels)
canned seafood samples 2009 –3.29 2.79 0.023
frozen seafood samples 2009 –0.16 1.06 0.010
canned seafood samples 2010 0.80 0.74 0.021
frozen seafood samples2010 0.66 0.72 0.011
canned seafood samples 2011 1.04 0.88 0.075
frozen seafood samples 2011 1.53 0.08 < 0.000001
Maldives – Rihaakuru (cooked fish paste) 1.86 0.95 0.32
Japan – various locations and types of fish –0.57 1.16 0.0066
40
Norway – herring and mackerel, fresh fillets, salted, hot and cold smoked
(regulatory data)
2009–2011 –0.85 1.69 0.031
1994 1.19 0.45 0.0067
1995 1.31 0.48 0.019
The Netherlands – fresh/frozen tuna (regulatory data)
2006 –0.44 1.49 0.033
2007 –2.42 1.86 0.0056
2008 –1.29 2.42 0.068
2009 –3.69 2.64 0.011
2010 –0.55 1.50 0.029
2011 - - -
Private company -
canned tuna imports to Canada –2.51 1.32 0.00013
canned fish (various) imports to USA - - -
canned sardines - - -
anchovies 1.62 0.05 < 0.000001
Thailand – fish saucec 1.96 0.24 0.077
a See Table 3.2 for more details
b Data do not allow estimation
c These values were not used in the calculation of summary results
41
6. Risk management options
6.1 Management of histamine production in fish and fishery products SFP will only occur in healthy individuals when a dose of at least 50 mg histamine is consumed, and this generally inplies that the fish would have histamine levels exceeding 200 mg/kg. Freshly harvested scombrotoxin-forming fish typically have histamine levels below 2 mg/kg (Frank et al., 1981; Staruszkiewicz et al., 2004). In addition, food business operators that apply GHP and HACCP can achieve a histamine level lower than 15 mg/kg in fish products, based on data made available by industry (using a test method with a lower detection limit of 15 mg/kg). As such, the following conditions must be met for fish to have levels above 200 mg/kg.
The fish are of a species that have sufficient free histidine to be converted to histamine (only species listed in Table 2.3 or others that may have similar histidine levels can possibly cause outbreaks).
The presence of histamine-producing bacteria.
Conditions that support the growth of histamine-producing bacteria and their production of histidine decarboxylase (HDC) enzymes.
Conditions that allow HDC to convert histidine to histamine (these are normally the same conditions as for bacterial growth, but there are some conditions under which bacterial growth will not occur but preformed HDC may produce histamine and HDC may be suppressed directly).
The risk of SFP is best mitigated by applying GHP and HACCP to interrupt one or more of these conditions, or perhaps to remove histamine that has been formed. Appropriate sampling plans and testing for histamine should be used to validate the HACCP system, verify its effectiveness and detect HACCP failures. Sampling can also be used by regulators and purchasers to identify suppliers that are not applying controls correctly. Controls for histamine and other biogenic amines in susceptible fish and fishery products have been identified (EFSA, 2011; Emborg and Dalgaard, 2007; NZMAF, 2011), and existing and emerging control strategies were specifically reviewed by Naila et al. (2010). Risk mitigation strategies discussed in the above citations include:
post-harvest chilling;
gutting and gilling of susceptible fish;
freezing and refrigerated storage;
heating to destroy histamine-producing bacteria and HDC;
pH and salt;
modified atmosphere and vacuum packaging;
high hydrostatic pressure;
irradiation;
food additives;
using decarboxylase-free starter cultures for fermented fish and fishery products;
biogenic amine degrading bacteria and enzymes;
microbiological modelling to select safe storage times under particular conditions;
sensory assessment for decomposition.
42
6.1.1 Chilling
Chilling of fish as soon as possible after death is the most important factor in controlling biogenic amine accumulation in scombrotoxin-forming fish (FDA, 2011). Few histamine-producing bacteria will grow at refrigerator temperatures and the growth rates of those that do is much reduced with refrigeration temperatures approaching 0 °C. The following recommendations for chilling of fish after harvest have been provided as procedures that are both readily achievable by industry and will control histamine production (FDA, 2011).
Fish exposed to air or water temperatures above 28.3 °C should be placed in ice, or in refrigerated seawater, ice slurry or brine at 4.4 °C or lower, as soon as possible after harvest, but not more than 6 hours from the time of death.
Fish exposed to air or water temperatures of 28.3 °C or lower should be placed in ice, or in refrigerated seawater, ice slurry or brine at 4.4 °C or lower, as soon as possible after harvest, but not more than 9 hours from the time of death.
Fish that are gilled and gutted before chilling should be placed in ice, or in refrigerated seawater, ice slurry or brine at 4.4 °C or lower, as soon as possible after harvest, but not more than 12 hours from the time of death.
Fish that are harvested under conditions that expose dead fish to waters of 18.3 °C or lower for 24 hours or less should be placed in ice, or in refrigerated seawater, ice slurry or brine at 4.4 °C or lower, as soon as possible after harvest, but not more than the time limits listed above, with the time period starting when the fish leave the environment of 18.3 °C or lower.
Further chilling approaching the freezing point is also recommended (FDA, 2011).
6.1.2 Gutting and gilling of susceptible fish
Histamine-producing bacteria appear to be universally present in the gut, gills and skin of fish at the point of capture. Therefore, selecting fish without histamine-producing bacteria does not appear to be an option. However, rapid removal of guts and gills will delay the production of hazardous levels of histamine by such bacteria. For large fish, removing the gut also allows ice or ice slurry to be applied closer to the core of the fish, resulting in more rapid overall chilling. However, during gutting and gilling, care should be taken to minimize the spread of bacteria into the muscle tissue.
6.1.3 Refrigerated storage and freezing
Once they have been chilled, susceptible fish must be kept cold. Refrigerated storage at 4 °C will prevent the growth of mesophilic histamine-producing bacteria and will slow the growth of the less well-known psychrotrophic histamine-producing bacteria. Freezing and frozen storage (–18 °C or below) will stop the growth of all bacteria and, for all practical purposes, will also prevent any preformed HDC from producing histamine. For products whose preparation does not include a heating step or other means to eliminate bacteria, the presence of psychrotrophic organisms may mean that refrigerated storage will not be sufficient to prevent the production of histamine in products with long shelf-lives. If products have a potential refrigerated shelf-life of weeks rather than days, mathematical modelling may be needed to set a refrigerated shelf-life sufficiently short to prevent histamine formation (Emborg and Dalgaard, 2008). Using fresh, high quality materials, chilling and freezing are usually the best methods used to control growth of the bacteria that
43
produce histamine and other biogenic amines. However, for some types of fishery product, such as fermented and smoked fish, these methods might not be practical. Furthermore, some biogenic amine-producing bacteria can still grow at low temperature and produce enzymes that convert free amino acid precursors to biogenic amines (Emborg and Dalgaard, 2006; Lehane and Olley, 2000; Naila et al., 2010). Other control measures to prevent the formation of biogenic amines have been investigated recently for use in various industries (Naila et al., 2010).
6.1.4 Heating to destroy histamine-producing bacteria and HDC
Most products can be kept under refrigeration until the point of consumption but for some products, such as hot smoked and canned products, processing requires that the frozen products be thawed and chilled, and then warmed. It is important that such products are not held in the temperature zone where histamine-producing bacteria can grow and produce histamine for long enough to become a hazard. Microbiological modelling can be used to determine the effect of various times and temperatures on bacterial growth and histamine production (Emborg and Dalgaard, 2008). The heating process can be used to eliminate histamine-producing bacteria and their HDC enzymes from the product. However, histamine is heat stable. If histamine is produced in fish, cooking will kill bacteria but will not eliminate the histamine. Therefore, it is important to eliminate or slow the growth of biogenic amine-producing bacteria before they start to produce and release biogenic amine-producing enzymes. Given that histamine-producing bacteria are more heat sensitive than the spore-forming bacteria that are targeted in the canning process, commercially sterile canned products will not contain any histamine-producing bacteria. Furthermore, all HDC enzymes will be denatured by the canning process, meaning that no further histamine can be produced in the product, which can then be stored at ambient temperatures. For products such as hot smoked fish, sufficient heat can also be applied during the process to eliminate the histamine-producing bacteria and inactivate their enzymes. Morganella morganii is probably the most heat resistant of the histamine-producing bacteria, and in Australian salmon/kahawai at temperatures between 58 and 62 °C, the D-values for eliminating these bacteria and their associated HDC enzymes were between 15 and 1.5 seconds (Osborne and Bremer, 2000). The smoking process might also be designed to eliminate even more resistant vegetative bacteria of concern such as Listeria monocytogenes (Fletcher et al., 1998b). However, although heating can destroy the bacteria of concern in food, if recontamination and temperature abuse occur after thermal processing, histamine formation may still occur in the thermally processed product. Thus, for products such as hot smoked fish, care must be taken to avoid recontamination after smoking, and refrigerated storage is still required unless the aW has been reduced sufficiently to prevent bacterial growth at ambient temperatures.
6.1.5 High hydrostatic pressure and irradiation
High hydrostatic pressure and irradiation are non-thermal treatments that could also be used to eliminate histamine-producing bacteria from susceptible products in a similar manner to heat. The effect on any HDC has been less well studied, and in some cases irradiation was shown to increase histamine production, perhaps as a result of modifying the structure of HDC (Naila et al., 2010).
6.1.6 pH, salt, modified atmosphere and vacuum packaging
Using organic acids to reduce pH, using salt or other means to reduce aW, and storage under high CO2 atmospheres can limit or prevent the growth of histamine-producing bacteria for either refrigerated or shelf-stable products such as salted dried fish. The effect of pH, aW,
44
temperature and storage atmosphere has been modelled for the fail-safe time to predict when toxic concentrations of histamine might be produced for lightly preserved seafood (Emborg and Dalgaard, 2008).
6.1.6 Food additives
Food additives such as potassium sorbate, sodium nitrites, glucono-delta-lactone and glycine have also been shown to inhibit the growth of histamine-producing bacteria and reduce the production of histamine, and they may be included in formulated products for this purpose (Naila et al., 2010). Various food spices can be applied to similar effect. However, the effectiveness of additives has been little studied and their effects on sensory characteristics, their consumer acceptance in such products and potential negative effects need to be considered. For example, although curcumin can inhibit the growth of histamine-producing bacteria, it also inhibits diamine oxidase, an enzyme that breaks down histamine (Bhutani et al., 2009).
6.1.7 Using suitable starter cultures and/or their enzymes in the preparation of specialist fermented fish and fishery products
Fermented fishery products depend on promoting the growth of certain bacteria to form desirable product characteristics. Their preparation typically requires storage at temperatures that promote rather than inhibit bacterial growth. Bacteria may themselves contain HDC so it is important that decarboxylase-free starter cultures are used for such products. In contrast, some bacteria produce enzymes such as diamine oxidase (DAO) that degrade biogenic amines. These might be included as part of the microflora of starter cultures to provide further protection. In some cases, histamine-degrading bacteria or the enzymes that they produce may also be applied for the removal of preformed amines.
6.1.8 Microbiological modelling Histamine production in some fish and fishery products stored under different conditions can be estimated using predictive modelling. These models can be helpful to fish processors or buyers when used in conjunction with accurate temperature monitoring. For example, if the temperature history of an incoming fish product is known, an appropriate model can be used to predict the current histamine content and the time remaining until histamine levels in the fish may lead to it being decomposed or toxic. The Seafood Spoilage and Safety Predictor (Dalgaard, 2009) contains models that predict histamine formation for Morganella morganii and M. psychrotolerans.
6.1.9 Sensory assessment for decomposition
Fish processors have for many decades used sensory assessment of decomposition as a measure of quality, primarily using the odour of the gills and gut cavity (Lassen, 1965). This has proven useful as a screening method for histamine by quickly identifying lots of fish that have been mishandled and, hence, are at risk of elevated histamine content (USTF, 2002). Conversely, histamine is one of the measures of decomposition (Barnett et al., 2006, 2011). However, the correlation between histamine content and odours of decomposition is often inconsistent (Fücker et al., 1974; Kimata, 1965; Veciana-Nogués et al., 1997). Histamine formation without significant odours of decomposition (Özogul et al., 2002), or odours of decomposition without rejectable histamine formation (Du et al., 2002), are both possible. Therefore, sensory evaluation remains a highly useful tool for quality control programmes, but acceptable sensory quality cannot be taken as final assurance of low histamine, nor can low histamine be taken as final assurance that fish is not decomposed.
45
6.2 Designing a sampling plan to meet an appropriate level of protection (ALOP) for histamine as part of risk management
6.2.1 Understanding attributes sampling plans
“Attributes” sampling plans are defined by several characteristics, namely:
m = the criterion against which test units5 comprising the sample will be assessed for compliance
n = the number of test units to be tested and evaluated against the criterion (or “attribute”), and
c = the number of test units that are allowed to exceed the criterion m.
The term “attribute” arises from the fact that the testing only evaluates whether each test unit meets an absolute criterion, not the actual level of the hazard in the product. That is, a test unit either complies with the criterion (or “attribute”) or it does not6. The proportion of units that comply is the basis of acceptance or rejection of the lot.
Some sampling plans also specify an additional criterion, M, a level that if exceeded in any test unit will lead to immediate rejection of the entire lot or batch. Where only m is specified, the sampling plan is described as a “two-class” plan, i.e. individual samples either “pass” or “fail” and the proportion passing or failing defines the acceptability of the entire lot. Where M is also specified, the sampling plan is described as “three class”: test units with values less than m pass the test; test units with values greater than M fail the test and cause the entire sample to fail; and test units with values between m and M are of “marginal” acceptability. The acceptability of the lot will also be decided on the number of samples with values between m and M.
Attributes sampling plans are designed to determine the proportion of test units in a batch or lot that comply with the criteria. The performance of the sampling plan can be gauged from the number of test units analysed. At the simplest level, the more samples that are tested and shown to be of acceptable quality and/or safety, the greater our confidence that the frequency of unacceptable contamination in the entire batch is low and that the batch as a whole is acceptable.
The number of test units that must be analysed to have confidence about the overall quality and/or safety of the lot can be calculated mathematically and represented by the “operating characteristic” curve (see Figure 6.1), often abbreviated as the “OC curve”. The mathematics required for the calculations used to generate the OC curve are based on the binomial distribution (or, more correctly, the hypergeometric distribution). The principles of these sampling schemes and the determination of their performance are described in greater detail by Ross et al. (2011) and their application in food safety exemplified by van Schothorst et al. (2009).
To exemplify the performance of attributes sampling schemes, the EU sampling scheme for assessing histamine levels in a batch of product is characterized by:
n = 9
m = 100 mg/kg
5 A sample for testing will typically comprise multiple test units. Thus, for the purpose of this document, a sample is a series
of test units all of which are tested and comprise the sample that is used to adjudge the overall acceptability of the batch, or lot, from which it is drawn.
6 In many cases involving histamine testing, an actual concentration is obtained and this information can be used to assess the overall quality of the lot of product more reliably, rather that regarding the unit as either a “pass” or “fail”. Three-class sampling plans begin to use information about distributions of values to assess lot acceptability.
46
M = 200 mg/kg; c = 2
The FDA (2010) sampling plan is a three-class plan of n = 18, c = 1, m = 50 mg/kg, and M = 500 mg/kg.
The OC curves for the EU sampling scheme and the US FDA scheme are compared in Figure 6.1. Note that, for comparison, the EU three-class scheme is considered as two two-class sampling schemes, one in which n = 9, c = 2, m =100 mg/kg, and another in which n = 9, c = 0, m =200 mg/kg. Similarly, the US FDA sampling scheme is comprised of two two-class sampling plans, in which n = 18, c = 1, m = 50 mg/kg and n = 18, c = 0, m = 500 mg/kg are applied.
Figure 6.1. Operating characteristic (OC) curves for EU histamine sampling plan (EU 2073/2005, solid
line) and US FDA (2010) sampling plan (dashed line). The OC curves describe the probability of
accepting a batch as a function of the actual proportion of samples that is defective (histamine level
exceeding a given limit, EU: 100 mg/kg; US FDA: 50 mg/kg). See text for detailed explanation. To aid
comparison, the dotted line is the OC curve for an n = 9, c = 0 sampling plan, analogous to the EU
scheme if m is taken as 200 mg/kg.
Taking nine samples, all of which must comply with the criterion (c = 0), offers 95 percent confidence that a batch that has 28 percent or more defective units (i.e. > 200 mg/kg) will be detected (and hence rejected) by that sampling plan. At 90 percent confidence (Figure 6.1, solid horizontal line), the sampling plan will detect batches with greater than 22 percent defective units (Figure 6.1, solid horizontal line at “b”).
For n = 9, c = 2, the plan will, with 95 percent confidence, detect a batch with > 55 percent of defective units or, with 90 percent confidence (Figure 6.1, solid horizontal line), batches with > 49 percent defective units (Figure 6.1, solid horizontal line at “a”). Therefore, this plan is less stringent than the n = 9, c = 0 plan.
The FDA (2010) states that the “number of samples (i.e., scombrotoxin-forming fish) necessary to make a judgment about a lot depends on the anticipated variability, but should not be fewer than 18 samples per lot, unless the lot contains less than 18 fish, in which case a sample should be collected from each fish.” Accordingly, that sampling plan (n = 18, c = 1), through requiring more samples, achieves a high level of sensitivity, i.e. it is able reliably to detect lower frequencies of contamination within a lot, or batch, of product. Compared with the above two plans, this plan will, with 95 percent confidence, detect a batch with > 24
a b c
47
percent defective units, or, with 90 percent confidence, batches with > 20 percent defective units (Figure 6.1, solid horizontal line at “c”).
Additionally, the criterion for acceptability in the US FDA plan is more rigorous (50 mg/kg). Hence, the US FDA (2010) sampling plan is more stringent than the EU plan and offers more confidence that non-conforming lots will be detected.
6.2.2 Designing a sampling plan
Protection of consumers from food-borne illness involves minimizing their exposure to harmful levels of food-borne hazards. In Section 4 it was concluded that a dose of 50 mg of histamine is unlikely to cause adverse effects in most consumers. For a typical serving of fish, or seafood products, this quantity was translated into a level of 200 mg/kg in fish, or fish products, based on a 250 g serving size. A 250 g serving size represents the typical 97.5th percentile of serving size for fish products in a variety of nations and cultures (see Section 3.3).
Section 3.2 discussed the sources and extent of variability in histamine levels within fish and among fish, and Section 6.1, above, described briefly the statistics of sampling plans. The question arises, then, how a science-based sampling plan can be established that is also practicable. The answer is that this can be developed from an understanding of the distribution of contamination levels within or among batches.
As an example, if we aim to ensure that there is a less than “one in a thousand” probability of any sample in a batch exceeding a specified level, and we know the distribution of contamination levels within the batch, we can use simple statistics based on the Normal (Gaussian) distribution to generate a variety of sampling plans that differ in m and n but all provide the same level of assurance and protection of public health.
6.2.2.1 Using a known standard deviation to derive an acceptable mean
To reveal this variety of sampling plans, we need to have some knowledge of the standard deviation of the contamination levels within the lot to be tested. To be able to estimate this, however, the concentration data must form a Normal distribution, otherwise the statistical inferences will not be valid. In fact, histamine contamination levels do not form a Normal distribution, but the logarithm of histamine concentration does7 (discussed in Chapter 5). As seen in Table 5.1, the standard deviation is not consistent among surveys, but ranges from ~0.05 to 2.7 (in the log-transformed concentration data), depending on the dataset.8
Accordingly, the following analyses use log10 (histamine concentration [mg/kg]) for calculations but convert back to histamine concentration (mg/kg) when reporting the results.
In statistics, the “z-value” characterizes the probability of any particular value from within a distribution being observed by random sampling. Values closer to the average value in the distribution have small z-values and are more likely to be observed, while larger z-values are associated with more extreme values within the distribution. Most scientists and technologists are familiar with the idea that ~95 percent of observations from a population are within 2 standard deviations (SD) of the average, or mean, value for that population. The z-value is the difference between a specific value and the mean of the distribution, expressed as a number of SDs, i.e. the difference between the two values, divided by the SD.
7 This (presumably) arises from the fact that histamine in seafoods is formed by bacteria and that the histamine level has a
stoichiometric relationship with bacterial concentration. That bacterial numbers in foods are log-normally distributed in foods is well established and arises as a result of their pattern of exponential increase with time in storage.
8 It was also noted (Fletcher, 2011; data not shown) that variability in histamine levels was lower when levels were very low (e.g. < 10 mg/kg) or very high (e.g. > 1 000 mg/kg), but that intermediate levels showed greater variability.
48
To determine the average log10 (histamine concentration) of a population in which fewer than 1 in 1 000 samples contain above 200 mg/kg, the standard deviation of the log10 [histamine] in the population must be known. As an example, 200 mg/kg histamine equals 2.301 log10 ([histamine] mg/kg). In a Normal distribution, values that are likely to occur with less than 1 in 1 000 frequency are 3.09 z-values (i.e. 3.09 SD) away from the average, or mean. If the SD is 0.1, then the mean of the distribution that satisfies our requirement for no more than 1 in 1 000 samples ≥ 200 mg/kg is given by:
log10 (mean) = 2.301 – (3.09 × 0.1) = 1.992
mean = 101.992 = 98.2
In other words, our distribution, with 0.1 SD, must have a mean of 98.2 mg/kg or lower to ensure that units containing 200 mg/kg are very unlikely (< 1/1 000) to occur within the lot. Figure 6.2a, below, shows this distribution, as well as the upper tolerable limit of 200 mg/kg.
To illustrate this process further, it might be determined that, to ensure public health, no more than 1 in 10 000 samples above 200 mg/kg histamine can be tolerated. In a Normal distribution, values that are likely to occur with a frequency lower than 1 in 10 000 are 3.72 z-values (i.e. 3.72 SD) away from the mean. Using the same approach as described above, the mean of the histamine concentrations in units in the lot would have to be 84.9 mg/kg (see Figure 6.2b). Similarly, the calculation could be made for a population of samples with an SD of 0.5. In this case, for a lot with fewer than 1 in 10 000 (< 0.01 percent) units likely to exceed 200 mg/kg, the mean histamine concentration would have to be ≤ 2.76 mg/kg, as shown in Figure 6.2c. The information discussed above has been summarized in Table 6.1.
Table 6.1. Comparison of the cumulative distribution function (CDF) plots shown in Figures 6.2a,b,c.
Standard
deviation
Level of
protection
z-value Histamine limit
(mg/kg)
Maximum mean that
meets the criterion
(mg/kg)
0.1 1/1000 3.09 200 98.2
0.1 1/10000 3.72 200 84.9
0.5 1/1000 3.09 200 5.71
0.5 1/10000 3.72 200 2.76
Note that, as the SD becomes larger, the mean concentration in the batch has to become lower for the batch to satisfy the criterion of acceptability (e.g. fewer than 1 in 1 000 samples above 200 mg/kg).
49
Figure 6.2a. Plot showing a normal distribution (black dotted line) of log10 ([histamine]
mg/kg) contamination levels in a lot, or batch, in which ≤ 0.1 percent of samples will be
expected to exceed 200 mg/kg (shown as the solid vertical line at 2.301 log10 ([histamine]
mg/kg). The standard deviation for this distribution is assumed to be 0.1, meaning that the
average contamination in the lot must be 98 mg/kg (or less) so that 99.9 percent of samples
in the lot have histamine levels less than 200 mg/kg. The black solid line shows the
cumulative distribution function (CDF) for the distribution shown by the dotted line. The
CDF can be used to determine the proportion of samples expected to be above, or below, a
particular concentration (see Figure 6.2d).
Figure 6.2b. Plot showing a normal distribution (black dotted line) of log10 ([histamine]
mg/kg) contamination levels in a lot, or batch, in which ≤ 0.01 percent of units will be
expected to exceed 200 mg/kg (shown as the solid vertical line at 2.301 log10 ([histamine]
ppm). The standard deviation for this distribution is assumed to be 0.1, meaning that the
average contamination in the lot must be 84.9 mg/kg (or less) so that 99.99 percent of
samples in the lot have histamine levels less than 200 mg/kg. The black solid line shows
the CDF for the normal distribution shown by the dotted line.
50
Figure 6.2c. Plot showing a normal distribution (black dotted line) of log10 ([histamine]
ppm) contamination levels in a lot, or batch, in which ≤ 0.01 percent of samples will be
expected to exceed 200 mg/kg (shown as the solid vertical line at 2.301 log10 ([histamine]
mg/kg). The standard deviation for this distribution is assumed to be 0.5, meaning that the
average contamination in the lot must be 2.76 mg/kg (or less) so that 99.99 pecent of
samples in the lot have histamine levels less than 200 mg/kg. The black solid line shows
the cumulative distribution function for the distribution shown by the dotted line.
6.2.2.2 Using the known standard deviation and the derived mean to design a sampling plan
Having derived the most extreme distribution that will meet our expectations of acceptably low public health risk, we can derive a sampling plan that provides a specified level of confidence that the batch, as a whole, will satisfy the criterion. To assist in visualizing the process, it is useful to consider cumulative distribution function (CDF) plots. The CDF curve can be interpreted as showing the proportion of samples that fall above, or below, a specified concentration value. From Figure 6.2d, which is based on Figure 6.2c but with several levels of log10 ([histamine] mg/kg) highlighted, by reading from the CDF curve, it can be seen that the distribution which satisfies our objective for tolerable levels and frequencies of histamine has ~56 percent of samples with histamine levels ≤ 0.5 log10 ([histamine] mg/kg) or 3.2 mg/kg, ~87 percent of samples with values ≤ 1.0 log10 ([histamine] mg/kg) or 10 mg/kg, and 98 percent of samples with ≤ 1.5 log10 ([histamine] mg/kg) or 32 mg/kg.
51
Figure 6.2.d. Plot showing cumulative distribution function (CDF) of log10 histamine
contamination in levels in a batch of product in which ≤ 0.01 percent of samples are
expected to exceed 200 mg/kg (shown as the solid vertical line at 2.301 log10 ([histamine]
mg/kg). The standard deviation for this distribution is assumed to be 0.5, meaning that the
average contamination in the lot must be 2.76 mg/kg (or less) so that 99.99 percent of
samples in the lot have histamine levels less than 200 mg/kg. The vertical black dotted
lines are included to show how the proportion of samples below a particular contamination
level can be read from the CDF curve. For example, 87 percent of samples from a batch
that meets the criterion (not more than 1 in 10 000 samples ≥ 200 mg/kg) should have log10
([histamine] mg/kg) values less than 10 mg/kg.
Table 6.2. Comparison of a family of theoretical sampling plans to ensure the same criterion* for a
sample batch**.
m (mg/kg) % Sample
lower than m
No. of samples needed to draw in order to reach 95%
confidence level (calculated from OC curves)
200 99.99% 30 102
150 99.97% 11 527
32 98% 178
10 87% 22
3.2 56% 6
*fewer than 1 in 10 000 units exceeding 200 mg/kg
**with mean of 2.76 mg/kg and a log (SD) of 0.5
A preferred value for m can now be specified and used to determine how many samples drawn from the derived distribution would be expected to be less than (or above) that value. For example, using the distribution shown in Figure 6.2c (and 6.2d), if 10 mg/kg were chosen for m, the required distribution tells us that approximately 87 percent of samples drawn from an acceptable lot will be lower than m while 13 percent will not satisfy the attribute. Using the binomial theorem, 22 samples would need to be taken, each containing less than 10 mg/kg, to have 95 percent confidence that the batch as a whole contained fewer than 1 in 10 000 units higher than 200 mg/kg. If the value selected for m was 32 mg/kg, however, only ~2 percent of samples would be expected to exceed this level, and to demonstrate (with 95 percent confidence) that ≤ 2 percent of samples are “defective” would require 178 samples to be taken, and each shown to contain less than 32 mg/kg histamine. The information discussed above has been summarized in Table 6.2.
Thus, appropriate selection of the m value can improve the time- and cost-effectiveness of sampling considerably; m values close to the mean of the distribution offer the best discrimination of compliant vs non-compliant lots, i.e. they require the lowest number of
52
samples to be tested to achieve the same level of confidence about the disposition of the lot being assessed. A further consideration, however, is the consequence of “false positive” results.
The basis of designing attributes sampling plans is well described elsewhere and this is a well-established approach in technological sciences. While the approach described above is appropriate for consumer protection, there is also the risk that, by chance, a non-compliant unit may be sampled and tested, and lead to inappropriate rejection of the batch, or lot. This false-positive, or “Type I” error, is also termed “the producer’s risk”.
Ideally the OC curve would be nearly vertical between the contamination frequency accepted with 95 percent confidence and that rejected with 95 percent confidence; in other words the sampling scheme would only infrequently accept unacceptable lots and equally infrequently lead to rejection of acceptable lots. In this way the sampling scheme would protect both the public from exposure to toxic seafood products and also the producers from having to discard product that is actually of acceptable quality and/or safety. The more samples that are tested, the closer one comes to that ideal being achieved.
To illustrate, for the distribution shown in Figure 6.2b, if m were selected to be 84.9 mg/kg, the average of the distribution, then 50 percent of samples tested would be expected to be above m and 50 percent below m. If five test units are shown to be lower than m, there is 95 percent confidence that the batch is of acceptable quality and/or safety overall. However, there is also a high probability of detecting a positive sample with a value higher than m. In this case we might set a sampling scheme with n = 2, c = 1, m = 84.9, but this provides little discrimination. The more samples that are tested, the more closely the performance of the sampling plan approaches the ideal of perfect discrimination between lots that are acceptable and those that are not. This is demonstrated in Figure 6.3.
Figure 6.3. Plot comparing OC curves for a sampling plan designed to detect 50 percent of
units above the required mean concentrations, for a defined SD of results, and consistent
with public health protection (see text for details). The possibility of “false positive”
(producer risk) and “false negative” (consumer risk) evaluation decreases with increasing
numbers of samples taken, even though the same proportion of units must pass for the lot
to be considered acceptable.
0.0
0.1
0.2
0.3
0.4
0.5
0.6
0.7
0.8
0.9
1.0
0.0 0.1 0.2 0.3 0.4 0.5 0.6 0.7 0.8 0.9 1.0
Pro
bab
ilit
y t
ha
t th
e l
ot
will b
e a
cc
ep
ted
True proportion of defective units/samples in the lot
n=2,c=1
n=4,c=2
n=10,c=5
n=20,c=10
n=100,c=50
n=200,c=100
n=400,c=200
upper95%
lower95th
50%-ile
53
6.2.3 Examples and analysis of existing sampling plans
Using the approach described above it is possible to interpret the effectiveness of an existing sampling plan, if an assumption is made about the standard deviation (SD) of the log10 [histamine] within the lot. The EU plan accepts lots in which two of nine samples exceed 100 mg/kg, provided that none exceeds 200 mg/kg. In other words, 78 percent of samples must be lower than 100 mg/kg. Figure 6.4 shows the CDF for a population with SD = 0.5 that satisfies this criterion, and compares it with the example developed above for a population in which SD = 0.5 and fewer than 1 in 10 000 samples exceed 200 mg/kg. Figure 6.4 compares the two distributions directly. This comparison demonstrates that the EU plan is less stringent than that proposed and exemplified above to detect more than 1 in 10 000 units at 200 mg/kg (assuming that the variation in log10 [histamine] has SD = 0.5).
Figure 6.4. Plot comparing distribution curves for the sampling plan designed to detect more than 1 in
10 000 units at 200 mg/kg (dashed line)compared with the EU plan (n = 9, c = 2; solid line), and
assuming that the EU plan (pragmatically) tolerates no more than 1 in 1 000 units that exceed the 200
mg/kg limit. The difference in the mean values of these distributions is apparent (30 mg/kg for the
invented sampling plan and 78 mg/kg for the EU-based sampling plan).
It might be argued that the inclusion of M = 200 mg/kg provides an additional level of stringency. If the intent in the EU sampling plan is that fewer than 1 in 10 000 samples exceed 200 mg/kg, and 7 out of 9 (78 percent) samples contain less than 100 mg/kg, the SD of the most extreme distribution that still satisfies these criteria would have to be smaller. Using the concept of z-values described above, a distribution of log10 [histamine] in which ≤ 78 percent of samples contain less than 100 mg/kg, and 99.99 percent of samples contain less than 200 mg/kg implies a (minimum) SD of 0.130 and a mean of no more than 79.4 mg/kg. If the tolerance for exceeding 200 mg/kg is reduced to 99 percent, the distribution has an implied (minimum) SD of 0.193 and a mean no more than 71 mg/kg. If the tolerance for exceeding 200 mg/kg is reduced to 95 percent, the implied (minimum) SD is 0.346 and the mean should be no more than 54 mg/kg. As noted earlier, however, if the actual SD were higher, the mean would also have to be lower, and a smaller proportion of units at 100 mg/kg would be tolerable for the lot overall still to be considered acceptable.
Table 6.3 presents some examples of attributes sampling plans appropriate to different levels of tolerance for samples above 200 mg/kg, and for different assumptions about the SD
54
of log10 [histamine] within lots. The sampling plans shown are two-class plans and indicate the number of analytical units required to be tested (and to comply with the test criterion, i.e. m) in order to have 95 percent confidence that the batch as a whole satisfies our desire for a specified low proportion of samples to exceed 200 mg/kg. In some cases the distributions are so narrow (the SD is very small) that testing samples against a criterion of 100 mg/kg is meaningless because most samples could be above this limit, yet in the lot as a whole it is very unlikely that there is any unit exceeding 200 mg/kg. In this case, it would be more practical to have a higher value for m, e.g. 200 mg/kg. Conversely, if the SD is very high, to have confidence that the lot as a whole does not contain an unacceptable proportion of samples above 200 mg/kg, many thousands of samples may be required to attain 95 percent confidence.
Table 6.3 also includes examples that show that appropriate selection of the value of m can reduce the number of samples needed to produce the same confidence in the overall quality of the lot from a consumer perspective. However, it also shows that, while fewer samples can protect the consumer, they may also be too protective and result in the disposal of lots that are acceptable. A larger number of samples provides better discrimination of the overall quality and/or safety of the lot and works both to ensure public health and reduce wastage. This principle is evident in the Codex Sampling Plans for Prepackaged Foods (AQL 6.5) in which more samples are taken for larger lots. The consequences of rejecting larger lots that in fact are acceptable justify the additional expense involved with testing more analytical units.
55
Table 6.3 Examples of attributes sampling plans appropriate to different levels of tolerance for samples above 200 mg/kg, and for different assumptions about the standard deviation of log10 [histamine] within lots.
*See page 45 for an explanation of m, n and c.
Log standard
deviation
(SD,
assumed)
Level of protection
(allowable probability of any
sample in the lot exceeding 200
mg/kg, risk manager’s decision)
Mean histamine level
(the maximal allowable mean in
order to meet the level of protection;
back-calculated from SD)
m*
(mg/kg)
Percentage of
analytical units
allowed to have
histamine levels > m
n* c* Notes
0.05
1 in 20 165 200 5 59 0 aIn the case of a small SD, a low m provides no
discrimination – almost all samples (italics) are
allowed to exceed this m. Therefore, a larger
value of m is more practical
1 in 20 165 100 99a
1 in 100 153 100 99.99a
1 in 1000 140 100 98a
1 in 10000 130 100 99a
0.1
1 in 20 137 100 92a 2 0
b Increasing the number of analytical units
reduces producer’s risk due to false positive
1 in 20
137 150 35 7 0
1 in 100
117 100 75 3 0
1 in 1 000 98 100 47 10b 1
1 in 1 000 98 100 47 20b 5
1 in 1 000 98 100 47 50b 17
1 in 10 000 85 100 24 11
0.5
1 in 20 30 100 15 19c 0 c For a higher level of protection, a larger
number of units is needed if m doesn’t change 1 in 100 14 100 4 74c 0
1 in 1 000 6 100 0.6 298c 0
1 in 10 000 3 100 0.09 3328c 0
1.0
1 in 20 5 100 9 31 0
Using a more stringent m can significantly
reduce the number of units that need to be
tested – yet provide the same level of
protection
1 in 100 0.9 100 2 149 0
1 in 1 000
0.2
100
0.26
1151
0
1 in 10 000 0.038 100 0.03 9569 0
1 in 10 000 0.038 50 0.09 3301 0
1 in 10 000 0.038 25 0.24 1239 0
1 in 10 000 0.038 1 7.8 37 0
56
6.3 Economic impact of enforcement This analysis is based on available data for the mean annual production of major species of interest (2005–2010) and histamine distribution in major species of interest, in both risk managed and unmanaged circumstances (Table 6.4). No direct monetary values are used; rather costs are expressed in terms of a percentage of the trade. Table 6.4. Volumes and histamine distribution in risk managed and risk unmanaged systems.
Processed without significant GMP and
HACCP
Processed with significant GMP and
HACCP
Species
Mean annual
volume (tonnes)
> 50–
< 100
mg/kg
> 100–< 200
mg/kg > 200 mg/kg
> 50–
< 100
mg/kg
> 100–
< 200
mg/kg
> 200
mg/kg
Tunas 4.5% 6.1% 0.1% 0.40% 0.10% 0%
4 295 639 193 325 263 245 6 287 17183 4 296 0
Clupeidae 4.5% 6.1% 0.1% 0.0% 0.0% 0.0%
3 656 288 164 551 224 065 5 351 0 0 0
Mackerel 4.5% 6.1% 0.1% 0.0% 0.0% 0.0%
5 500 460 247 548 337 079 8 050 0 0 0
Anchovy* 4.5% 6.1% 0.1% 5.0% 0.0% 0.0%
8 941 038 402 392 547 925 13 086 447052 0 0
*Histamine distribution is based on known histamine levels in salted vacuum-packed anchovies – only a minority
of anchovy is processed in this manner. The majority is processed as fishmeal or other products which would be
expected to demonstrate significantly lower histamine levels.
6.3.1 Estimated cost of rejection
Rejected fish or fish products may be completely rejected or partly rejected. The rejected portion either may be destroyed, resulting in 100 percent direct cost, or may be sold to another customer or jurisdiction at partial or no loss. Thus the direct cost of enforcement when the product is out of compliance ranges from 0–100 percent of the product value. There are frequently additional costs associated with redirecting or destruction of the product. These indirect costs were estimated by a major fish product distributor at 12 percent of product value. Thus the cost of rejection can range widely from 12–112 percent of product value. Hence the cost of enforcement at various histamine limit levels can be expressed as a percentage of the overall value of the trade, as presented in Table 6.5. Enforcement can be expected to have a number of different impacts on trade. On the positive side the economic cost associated with not meeting requirements will encourage the industry to follow a risk-based system. Unfortunately the effects can also be negative, driving businesses to operate in jurisdictions or with trading partners who are not practising enforcement; in some cases it may lead to a cessation of trade.
57
Table 6.5. Cost of enforcement by histamine limit level in risk managed and risk unmanaged systems.
Processed without significant GMP
and HACCP
Processed with significant GMP
and HACCP
Species Mean annual
volume (tonnes)
> 50–
< 100
mg/kg > 100–< 200
mg/kg > 200 mg/kg
> 50–
< 100
mg/kg
> 100–
< 200
mg/kg > 200
mg/kg
Tunas min loss 0.5% 1.3% 1.3% 0.0% 0.1% 0.1%
max loss 5.0% 11.9% 12.1% 0.4% 0.6% 0.6%
Clupeidae min loss 0.5% 1.3% 1.3% 0.0% 0.0% 0.0%
max loss 5.0% 11.9% 12.1% 0.0% 0.0% 0.0%
Mackerel min loss 0.5% 1.3% 1.3% 0.0% 0.0% 0.0%
max loss 5.0% 11.9% 12.1% 0.0% 0.0% 0.0%
Anchovy* min loss 0.5% 1.3% 1.3% 0.6% 0.6% 0.6%
max loss 5.0% 11.9% 12.1% 5.6% 5.6% 5.6%
*Histamine distribution is based on known histamine levels in salted vacuum-packed anchovies – only a minority
of anchovy is processed in this manner. The majority is processed as fishmeal or other products which would be
expected to demonstrate significantly lower histamine levels.
6.4 Conclusion For most products, the risk of SFP can be suitably mitigated by rapid chilling of the raw material and maintaining the cold chain. For such products SFP will only occur when they have been subjected to gross time/temperature abuse. However, for other products, such as smoked and fermented products, other controls may be needed. Sampling and testing are a means to verify that controls have been applied as they should be. The information and analyses provided in this section enable the development of sampling plans to achieve desired levels of public health protection. The process of development of sampling plans described also demonstrates that public health protection can be achieved using a single criterion (e.g. fewer than 1 in 10 000 units containing more than 200 mg/kg histamine) and an appropriate sampling plan developed to satisfy that criterion. This requires, however, that information about the variation in histamine levels in the lot is known, can be inferred, or can be assumed. Given that this knowledge of the variability of histamine levels within batches underpins the above approach, data that allow better quantification of the distribution of histamine levels in products and batches of products would be useful.
58
7. Conclusions
Histamine formation and SFP can be easily controlled. The risk of SFP is best mitigated by
applying basic GHP and where feasible a HACCP system. Appropriate sampling plans and
testing for histamine should be used to validate the HACCP systems, verify the
effectiveness of control measures, and detect failures in the system.
There is a range of test methods available for the reliable determination of histamine
levels in fish and fishery products. While each method has its strengths and limitations,
the availability of testing methodology is not a limitation with regard to the detection of
histamine in these products at the limits of interest. It was acknowledged that testing
may involve the use of several methods, such as in the application of a tiered testing
approach where rapid methods (ELISA, colorimetric test, etc.) that allow an initial
screening are followed by higher performing and complex methodologies that allow
confirmation of results and that may work as reference methods.
Sensory evaluation remains a highly useful tool in quality control programmes for fish
and fishery products, but acceptable sensory quality cannot be taken as final assurance
of low histamine, nor can low histamine be taken as final assurance that fish is not
decomposed. As a result the conclusion of the expert meeting was to focus their advice
on histamine limits and related sampling plans on applications related to consumer
protection.
The process of development of sampling plans demonstrates that public health
protection can be achieved using a single criterion (e.g. no more than 1 in 10 000 units
containing more than 200 mg/kg histamine), and an appropriate sampling plan was
developed to satisfy that criterion. Knowledge of the variability of histamine levels within
batches underpins the approach shown here. In order to provide more explicit guidance
on sampling approaches, the meeting analysed a range of sampling plans implemented
under different scenarios of histamine levels as defined by mean and standard deviation.
The above histamine limit and related sampling plans are relevant for products at the
retail level. However, the meeting recognized that, in order to achieve this limit, more
stringent requirements may be applied earlier in the distribution chain.
While other biogenic amines may play a role in the aetiology of SFP, there is limited
evidence of their role and there are no dose–response data in either humans or
laboratory animals for these biogenic amines. Given that most epidemiological studies
associate abnormally high levels of histamine in the incriminated fish or fish product with
SFP, histamine can be considered to be the most appropriate marker of SFP.
Although a number of hypotheses exist, the mechanism of toxicity in SFP remains
unclear.
59
SFP will only occur in healthy individuals when a dose of at least 50 mg histamine is
consumed in fish and fishery products. Considering a single serving size of 250 g as an
estimate of a high consumption level, a limit of 200 mg/kg was calculated. It is important
to bear in mind that, while the NOAEL is an appropriate hazard threshold value to use for
exposures in healthy subjects, this may not be the case for those members of certain
segments of the population who may have an increased sensitivity (e.g. related to
metabolic differences, physiological conditions, drug therapies or age). In these instances
a lower hazard level may need to be considered (e.g. the use of an uncertainty factor) or
other specific risk management options such as fish consumption advisories should be
considered.
A wide range of fish have been associated with SFP and need to be considered in
determining exposure and in SFP risk management. Concluding that this information
should be easily accessible to risk managers, the expert meeting developed the most
comprehensive list of fish associated with SFP to date.
60
8. Recommendations
In order to control histamine formation and manage the risk of SFP, fish catchers and
handlers need to apply basic GHP and the fishery industry needs to apply GHP/HACCP. It
is therefore recommended that regulators and all stakeholders are aware of the basic
steps required to control this hazard.
Fishing methods should be reviewed and adapted, for example by harvesting fish alive, to
minimize histamine formation.
To facilitate implementation of risk-based management plans, it is recommended that
the most up-to-date and complete information should be used, including the list of fish
species in this report, consumption data, epidemiological data.
To refine sampling plans, it would be desirable to quantify better the distribution of
histamine levels in products and batches of products.
Recognizing that the lower investment associated with the use of rapid histamine testing
methods made them an attractive option for the industry, while also noting the
importance of characterizing the performance of these methods under their conditions
of use, the expert meeting recommended periodic verification of the level of
performance of these methods against the reference methods.
Epidemiological data can be used to model the dose–response relationship, in addition to
the existing volunteer studies model. To do so, in-depth outbreak investigations (e.g.
isolating suspected biogenic amine-producing bacteria from implicated fish, testing
histamine and other biogenic amine levels in remaining food samples, and estimation of
consumption volume) should be encouraged.
It is recommended that information about SFP outbreaks should be shared
internationally. An international SFP alert through an existing emergency network, e.g.
INFOSAN9, is recommended.
It is recommended that risk-management recommendations should be developed, based
on the outcomes of the expert meeting. In particular, consideration should be given to
the elaboration of risk-based sampling plans and histamine criteria.
The experts acknowledged the utility of having access to the mathematical tools used in
this meeting to develop different sampling plans. The group therefore recommended
that FAO/WHO find ways to make these available in an easy to use format.
9 The International Food Safety Authorities Network (INFOSAN) was developed by the World Health Organization (WHO) in cooperation with the Food and Agriculture Organization of the United Nations (FAO), to promote the exchange of food safety
information and to improve collaboration among food safety authorities at national and international levels.
61
8.1 Research Needs and Recommendations for Future Studies
A reduction in the uncertainty surrounding the critical role played by histamine and other
biogenic amines in the pathogenesis of SFP is needed. Studies that will clarify the
mechanistic and quantitative roles of histamine and other biogenic amines in the
spectrum of adverse effects seen in SFP are deemed to be essential.
Evidence suggests that potentiators alter the threshold toxic dose for histamine in
contaminated fish. Elucidation of the quantitative relationship between the dose of
histamine and other biogenic amines and the various adverse effects is needed. Ideally,
such work would be derived from human volunteer studies, but the likelihood that such
studies will be conducted may be limited. In lieu of human studies, appropriate animal
models and studies, such as in pigs, should be investigated. In these studies, the
emphasis should be on the dose range between the NOAEL and the low levels associated
with the onset of mild symptoms. Beyond the three known potentiators (cadaverine,
putrescine and tyramine), studies are needed to characterize and identify currently
unknown potentiators, e.g. other biogenic amines. Further studies are also needed to
establish the mechanisms of action of all these potentiators.
Studies are needed to determine the diversity and role of microflora in the production of
biogenic amines. This could include the effect of the different microflora populations and
the quantitative relationship between their levels and biogenic amine production.
More studies are needed to determine the quantity of free amino acids other than free
histidine in fish normally associated with SFP.
Other methods to control the growth of biogenic amine-producing bacteria, aside from
time/temperature control and using high quality raw materials, have been considered
and used. These methods include using starter cultures or enzymes that degrade
histamine during fermentation, application of hydrostatic pressure, irradiation, modified
atmosphere packaging, adding salt, controlling aw, and the use of food additives (Naila et
al., 2010). Only a few emerging methods have been published and applied to specific
fishery products. More studies should be done to help reduce the risk of SFP.
For consistency of dietary exposure assessments, harmonization of data collection with
respect to the identification of typical fishery products consumed in the overall diet and
assessment of the dietary intake of histamine and other biogenic amines from these
products is recommended. It would be very beneficial if consumption data could be
shared internationally.
Other studies that are deemed to be helpful would be those that investigate the various
factors that may enhance the sensitivity of the response to SFP in various populations.
This would include investigation of the roles of:
o genetic polymorphism in histamine toxico-dynamics and -kinetics;
62
o certain physiological states/conditions such as menstruation;
o gastrointestinal tract diseases;
o certain medications;
o role of certain lifestyle practices such as smoking and alcohol consumption in
altering biogenic amine metabolism;
o age.
Studies are needed to investigate and clarify the SFP-like syndrome reported to be
associated with consumption of salmonid species. These studies should establish
whether the syndrome is SFP and, if it is not, the exact nature of the syndrome should be
characterized.
63
9. References and further reading
Ababouch, L., Alaoui, M.M. & Busta, F.F. 1986. A survey of histamine levels in commercially processed
fish in Morocco. FAO Fisheries Report, 329(Suppl.): 450–462.
Ababouch, L., Afilal, M.E., Benabdeljelil, H. & Busta, F.F. 1991. Quantitative changes in bacteria, amino acids and biogenic amines in sardine (Sardina pilchardus) stored at ambient temperature (25–28°C) and in ice. J.f Food Sci. Technol., 26: 297–306.
Ababouch, L.H., Souibri, L., Rhaliby, K., Ouahdi, O., Battal, M. & Busta, F.F. 1996. Quality changes in sardines (Sardina pilchardus) stored in ice and at ambient temperature. Food Microbiol., 13: 123–132.
Ababouch, L., Gandini, G. & Ryder, J. 2005. Causes of detentions and rejections in international fish
trade. FAO Fisheries Technical paper, 473.
Abe, H. 1983. Distribution of free L-histidine and its related compounds in marine fishes. Bull. Japan. Soc. Scient. Fish., 49: 1683–1687.
ACFS [Thailand National Bureau of Agricultural Commodity and Food Standards]. 2006. Food consumption, 2006. Thailand National Bureau of Agricultural Commodity and Food Standards, Ministry of Agriculture and Cooperative. Available at http://consumption.acfs.go.th/index.php?content=consumption&topic=m3&subtopic=percapita
ACT [Australian Capital Territory] Health. 1997. Health services – food survey reports 1996–97, biogenic amines in FISH AND FISH PRODUCTS. Accessed 23 June 2012 at http://www.health.act.gov.au/c/health?a=da&did=10017393&pid=1053607839&template=24
Al Bulushi, I., Poole, S., Deeth, H.C. & Dykes, G.A. 2009. Biogenic amines in fish: roles in intoxication, spoilage, and nitrosamine formation–a review. Crit. Rev. Food Sci. Nutr, 49: 369–377.
Antoine, F.R., Wei, C.I., Littell, R.C. & Marshall, M.R. 1999. HPLC method for analysis of free amino acids in fish using o-phtaldialdehyde precolumn derivatization. J. Agric. Food Chem., 47: 5107.
Antoine, F.R., Wei, C.I., Littell, R.C., Quinn, B.P., Hogle, A.D. & Marshall, M.R. 2001. Free amino acids in dark- and white-muscle fish as determined by o-phthaldialdehyde precolumn derivatization. J. Food Sci., 66: 72–77.
AOAC. 1995. Histamine in seafood: fluorometric method. Method 35.1.32, method 977.13. In: Cunniff, P.A. (Ed.), Official methods of analysis of AOAC International, 16th edition, pp. 16–17, Gaithersburg, MD, Association of Official Analytical Chemists (AOAC) International.
Arakaki, J. & Suyama, M. 1966. Free and conjugated amino acids in the extractives of anchovy. Bull. Japan Soc. Sci. Fish. 32(1): 74–79.
Ascione, A., Barresi, L.S., Sarullo, F.M. & De Silvestre, G. 1997. Two cases of ‘‘scombroid syndrome’’ with severe cardiovascular compromise. Cardiologia, 42(12): 1285–1288.
Auerswald L., Morren C. & Lopata A. L. 2006. Histamine levels in seventeen species of fresh and processed South African seafood. Food Chem., 98: 231–239.
Baranowski, J.D., Frank, H.A., Brust, P.A., Chongsiriwatana, M. & Premaratne, R.J. 1990. Decomposition and histamine content in Mahimahi (Coryphaena hippurus). J. Food Prot., 53: 217–222.
Barnett, J., Shanks, L. & Tom, P. 2006 and 2011. FDA USDA Sensory Workshop, Long Beach CA, October 2006 and October 2011.
Bartholomew, B.A., Berry, P.R., Rodhouse, J.C. & Gilbert, R.J. 1987. Scombrotoxic fish poisoning in Britain: Features of over 250 suspected incidents from 1976 to 1986. Epidemiol. Infect., 99(3): 775–782.
Benner, Jr., R.A., Staruszkiewicz, W.F., Conrad, S.M. & Samuels, R.D. 2009. Biogenic amine production in yellowfin tuna (Thunnus albacares) under controlled decomposition conditions. International Association for Food Protection Annual Meeting. Poster presentation P1-28.
Bhutani, M.K., Bishnoi, M. & Kulkarni, S.K. 2009. Anti-depressant like effect of curcumin and its
combination with piperine in unpredictable chronic stress-induced behavioral, biochemical and
Bjeldanes, L.F., Schutz, D.E. & Morris, M.M., 1978. On the aetiology of scombroid poisoning:
cadaverine potentiation of histamine toxicity in the guinea pig. Food Cosmetic Toxicol., 16(2): 157–
159.
Bjornsdottir-Butler, K., Bolton, G. E., Jaykus, L. A., McClellan-Green, P. D. & Green, D.P. 2010.
Development of molecular-based methods for determination of high histamine producing bacteria
in fish. Int. J. Food Microbiol., 139(3): 161–167.
Blonz, E. R. & Olcott, H. S. 1978. Effects of orally ingested histamine and/or commercially canned spoiled skipjack tuna on pigs, cats, dogs and rabbits. Comp. Biochem. Physiol. C, 61C(1): 161–163.
Boutin, J.-P., Puyhardy, J.-M., Chianea, D., Andreu, P., Paez, S., Fize, L., Vauthier, J.-M., Chapalain, J.-C., Grippari, J.-L., Corbe, H. & Bietrix, P. 1998. Les intoxications alimentaires histaminiques [Histamine food poisoning]. Sante Publique, 10(1): 29–37.
Chang, S. C., Kung, H. F., Chen, H.C., Lin, C. S. & Tsai, Y.H. Determination of histamine and bacterial isolation in swordfish fillets (Xiphias gladius) implicated in a food borne poisoning. Food Control, 19(1): 6 - 21.
CDC [Centers for Disease Control and Prevention, USA]. 2006. Surveillance for food-borne-disease outbreaks – United States, 1998–2002. MMWR, 55(SS10): 1–34.
Chiou, T.K., Shiau, C.Y. and Chai, T.J. 1990. Extractive nitrogenous components of cultured milkfish and tilapia. Nippon Suisan Gakkaishi, 56: 1313–1317.
Clifford, M.N., Walker, R., Wright, J., Hardy, R. & Murray, C.K. 1989. Studies with volunteers on the role of histamine in suspected scombrotoxicosis. J. Sci. Food Agric., 47(3): 365–375.
Clifford, M.N., Walker, R., Ijomah, P., Wright, J., Murray, C.K. & Hardy, R. 1991. Is there a role for amines other than histamines in the aetiology of scombrotoxicosis? Food Addit. Contam., 8(5): 641–652.
CODEX STAN 302 – 2011; Standard for Fish Sauce. Available at http://www.codexalimentarius.org/standards/list-of-standards/en/?provide=standards&orderField=fullReference&sort=asc&num1=CODEX
Dalgaard, P. 2009. Seafood spoilage and safety predictor (SSSP). Version 3.1. National Institute of Aquatic Resources (DTU Aqua), Technical University of Denmark, Lyngby, Denmark, Available at: http://sssp.dtuaqua.dk
Dalgaard, P., Madsen, H.L., Samieian, N. & Emborg, J. 2006. Biogenic amine formation and microbial spoilage in chilled garfish (Belone belone belone) – effect of modified atmosphere packaging and previous frozen storage. J. Appl. Microbiol., 101: 80–95.
Dalgaard, P., Emborg, J., Kjølby, A., Sørensen, N.D. & Ballin, N.Z. 2008. Histamine and biogenic amines: Formation and importance in seafood. In: Improving seafood products for the consumer, Cambridge, England, Woodhead Publishing.
D'Aloia, A, Vizzardi, E, Della Pina, P, Bugatti, S, Del Magro, F, Raddino, R, Curnis, A & Dei Cas, L. 2011. A scombroid poisoning causing a life-threatening acute pulmonary edema and coronary syndrome in a young healthy patient. Cardiovasc. Toxicol., 11(3): 280–283
de las Rivas, B., Rodríguez, H., Carrascosa, A.V. & Muñoz, R. 2008. Molecular cloning and functional
characterization of a histidine decarboxylase from Staphylococcus capitis. J. Appl. Microbiol., 104(1): 194–203.
DHS Vic [Department of Health Services Victoria]. 2000. Histamine in fish. Accessed on 17 May 2012 at http://www.health.vic.gov.au/archive/archive2011/foodsafety/archive/downloads/histamines_summary.pdf.
Du, W.X., Lin, C.M., Phu, A.T., Cornell, J.A., Marshall, M.R. & Wei, C.I. 2002. Development of biogenic
amines in yellowfin tuna (Thunnus albacares): Effect of storage and correlation with decarboxylase-
positive bacterial flora. J. Food Sci., 67(1): 292–301.
Duflos, G., Dervin, C., Malle, P. & Bouquelet, S. 1999. Relevance of matrix effect in determination of biogenic amines in plaice (Pleuronectes platessa) and whiting (Merlangus merlangus). J. AOAC Internat., 82: 1097–1101.
EFSA [European Food Safety Authority]. 2011. Scientific opinion on risk based control of biogenic
amine formation in fermented foods. Panel on Biological Hazards (BIOHAZ). EFSA J., 9(10): 2393–
2487.
EFSA [European Food Safety Authority]. 2011a. The EFSA Comprehensive European Food Consumption
Database. Available at http://www.efsa.europa.eu/en/datexfoodcdb/datexfooddb.htm
EFSA [European Food Safety Authority]. 2012. The EFSA Comprehensive European Food Consumption Database. Available at http://www.efsa.europa.eu/en/datexfoodcdb/datexfooddb.htm
Emborg, J. & Dalgaard, P. 2006. Morganella psychrotolerans sp. nov., a histamine producing bacterium
isolated from various seafoods. J. Food Prot., 69: 2473–2479.
Emborg, J. & Dalgaard, P. 2007. Project: Biogenic amines in seafood – assessment and management of
consumer exposure (BIOCOM). Danish Institute for Fisheries Research, Technical University of
Denmark, 98.
Emborg, J. & Dalgaard, P. 2008. Modelling the effect of temperature, carbon dioxide, water activity
and pH on growth and histamine formation by Morganella psychrotolerans. Int. J. Food Microbiol.,
128(2): 226–233.
Emborg, J., Laursen, B.G., Rathjen, T. & Dalgaard,P. 2002. Microbial spoilage and formation of biogenic amines in fresh and thawed modified atmosphere packed salmon (Salmo salar) at 2°C. J. Appl. Microbiol., 92: 790–799.
Emborg, J., Laursen, B.G. & Dalgaard, P. 2005. Significant histamine formation in tuna (Thunnus albacares) at 2°C - effect of vacuum- and modified atmosphere-packaging on psychrotolerant bacteria. International Journal of Food Microbiology, 101(3): 263-79.
Emborg, J., Dalgaard, P., Kjølby, A., Sørensen, N.D., Ballin, N.Z. & Larsen, I.K. 2006. Biogenic amine concentrations, microflora and product characteristics of seafoods implicated in incidents of histamine fish poisoning (HFP). SEAFOODplus, 1–22.
EPA [United States Environmental Protection Agency]. 2002. Estimated per capita fish consumption in the United States, August 2002. Pennsylvania Avenue, NW, Washington, DC 20460, US Environmental Protection Agency (4303T)1200 EPA-821- C- 02-003.
Espe, M., Lied, E. & Torrissen, K.R. 1993. Changes in plasma and muscle free amino-acids in Atlantic salmon (Salmo salar) during absorption of diets containing different amounts of hydrolyzed cod muscle protein. Comp. Biochem. Physiol. A–Physiol., 105: 555–562.
FAO [Food and Agriculture Organization of the United Nations]. 2004. FAO’s food and nutrition paper on marine biotoxins. Available at http://www.fao.org/docrep/007/y5486e/y5486e00.htm
FAO [Food and Agriculture Organization of the United Nations]. 2012. World production for fisheries of over 1000 T (The State of World Fisheries and Aquaculture 2012) Available at http://www.fao.org/docrep/016/i2727e/i2727e00.htm
FAO Fisheries and Aquaculture Statistics Service. 2012. Global fish production 1950-2010. FISHSTAT Plus – Universal software for fishery statistical time series. Available at www.fao.org/fishery statistics/software/fishstat/en FDA [Food and Drug Administration]. 2010. CPGM Import seafood products compliance program
(7303.844). Available online at http://www.fda.gov/downloads/Food/GuidanceComplianceRegulatoryInformation/ComplianceEnforcement/UCM219993.pdf
FDA [Food and Drug Administration]. 2011. Fish and fishery products hazards and controls guidance.
4th edition. Available at http://www.fda.gov/FoodGuidances
FishBase. 2012. Available at http://www.fishbase.org/search.php Fletcher, G.C., Summers, G., Winchester, R.V. & Wong, R.J. 1995. Histamine and histidine in New
Zealand marine fish and shellfish species, particularly Kahawai (Arripis trutta). J. Aquat. Food Product. Technl., 4: 53–74.
Fletcher, G.C., Bremer, P. J., Summers, G. & Osborne, C. M. 1998a. Guidelines for the safe preparation
of hot-smoked seafood in New Zealand. New Zealand Institute for Crop & Food Research Limited,
Christchurch.
Fletcher, G.C., Summers, G. & van Veghel, P.W.C. 1998b. Levels of histamine and histamine-producing bacteria in smoked fish from New Zealand markets. J. Food Prot., 61(8): 1064–1070.
Frank, H.A., Yoshinaga, D.H. & Nip, W.K. 1981. Histamine formation and honeycombing during decomposition of skipjack tuna, Katsuwonus pelamis, at elevated temperatures. Marine Fish. Rev., 43(10): 9–14.
FSCJ [Food Safety Commission of Japan]. 2006. Investigations for foodborne microbiological risk assessments. Food Safety Commission Japan. Available at http://www.fsc.go.jp/fsciis/survey/show/cho20070330003
Amine in Fisch und Fischprodukten im Zusammenhang mit Lebensmittelintoxikationen, Die
Nahrung, 18(6/7): 663–669.
Fujii, Y. 1954. Chemical studies on atka mackerel meat. Bulletin of the Faculty of Fisheries Hokkaido
Univ., 5: 253–276.
Garcia-Martin, E., Ayuso, P., Martinez, C., Blanca, M. & Agundez, J. A. G. 2009. Histamine pharmacogenomics. JAG Pharmacogenom., 10(5): 867–883.
Guillier, L., Thébault, A., Gauchard, F., Pommepuy, M., Guignard, A. & Malle, P. 2011. A risk-based sampling plan for monitoring of histamine in fish products. J. Food Prot., 74(2): 302–310.
Hang, S.-C., Kung, H.-F., Chen, H.-C., Lin, C.-S. & Tsai, Y.-H. 2008. Determination of histamine and bacterial isolation in swordfish fillets (Xiphias gladius) implicated in a food borne poisoning. Food Control, 19: 16–21.
Henderson, L., Gregory, J. & Swan, G., 2002. The National Diet & Nutrition Survey: adults aged 19 to 64 years. Types and quantities of food consumed. Volume 1. ISBN 0 11 621566 6. Office for National Statistics and Food Standards, UK. Available at www.food.gov.uk/multimedia/pdfs/ndnsprintedreport.pdf.
Hesterberg, R., Sattler, J., Lorenz, W., Stahlknecht, C.-D., Barth, H., Crombach, M. & Weber, D. 1984. Histamine content, diamine oxidase activity and histamine methyltransferase activity in human tissues: fact or fiction? Agents Actions, 14(3–4): 325–334.
Hibiki, S. & Simidu, W. 1959. Studies on putrefaction of aquatic products. 27. Inhibition of histamine formation in spoiling of cooked fish and histidine content in various fishes. Bull. Japan. Soc. Scient. Fish., 24: 916–919.
Hiratsuka, S. 2001. Suitability of longtail tuna as a raw material for "ara-bushi". Fish. Sci., 67: 550–552. Hsu, H.-H., Chuang, T.-C., Lin, H.-C., Huang, Y.-R., Lin, C.-M., Kung, H.-F. & Tsai, Y.-H. 2009. Histamine
content and histamine-forming bacteria in dried milkfish (Chanos chanos) products. Food Chem., 114: 933–938. http://www.codexalimentarius.org/download/standards/11796/CXS_302e.pdf http://www.health.vic.gov.au/archive/archive2011/foodsafety/archive/downloads/histamines_summary.pdf
Hui, J.Y. & Taylor, S.L. 1985. Inhibition of in vivo histamine metabolism in rats by foodborne and pharmacologic inhibitors of diamine oxidase, histamine N-methyl transferase, and mono- amine oxidase. Toxicol. Appl. Pharmacol., 8: 241–249.
Hui, Y.H. 2006. Handbook of food science, technology, and engineering. Food Science and Technology Series. CRC Press, Taylor & Francis group. Boca Raton, FL, USA.
Hungerford, J.M. 2010. Scombroid poisoning: A review. TOXICON, 56(2): 231–243 Iannuzzi, M., D'Ignazio, N., Bressy, L. & De Sio, A. 2007. Severe scombroid fish poisoning syndrome
requiring aggressive fluid resuscitation in the emergency department: two case reports. Minerva Anestesiol., 73(9):481-483.
Ijomah, P., Clifford, M.N., Walker, R., Wright, J., Hardy, R.& Murray, C.K. 1991. The importance of endogenous histamine relative to dietary histamine in the aetiology of scombrotoxicosis. Food Addit. Contam., 8(4): 531–542.
JA General Research Institute. 2010. Consumption frequency data, results of consumer buying
behaviors for meat and seafood products. Tokyo, Japan, JA General Research Institute. Available at
http://www.jc-so-ken.or.jp/work/100316_01.pdf
Jansen, S.C., van Dusseldorp, M., Bottema, K.C. & Dubois, A.E.J. 2003. Intolerance to dietary biogenic amines: a review. Ann. Allerg. Asthma Im., 91: 233–241.
Johnston, W.A., Nicholson, F.J., Roger, A. & Stroud, C.D. 1994. Freezing and refrigerated storage in fisheries. FAO Fisheries Technical paper 340, Rome, FAO. Available at http://www.fao.org/docrep/003/V3630E/V3630E00.HTM
Jonassen, F., Granerus, G. & Wetterqvist, H. 1976. Histamine metabolism during the menstrual cycle. Acta Obstet. Gynecol. Scand., 55: 297–304.
Kalogeromitros, D., Katsarou, A., Armenaka, M., Rigopoulos, D., Zapanti, M. & St Ratigos, I. 1995. Influence of the menstrual cycle on skin-prick test reactions to histamine, morphine, and allergen. Clin. Exp. Allergy, 25: 461–466.
Kan, K., Ushiyama, H., Shindo, T., Uehara, S. & Yasuda,K. 2000. Outbreak of histamine poisoning due to ingestion of fish, "Abura-sokomutsu" (Lepidocybium flavobrunneum). J. Food Hyg. Soc. Japan, 41: 116–121.
Kan, K., Ushiyama, H., Shindo, T. & Saito, K. 2005. Survey of histamine content in seafood on the market. J. Food Hyg. Soc. Japan, 46: 127–132.
Kimata, M. 1965. The histamine problem. In Fish as Food. Borgstrom G, ed., , Vol IV, pp. 329–352.
Academic Press Inc., New York, NY, USA.
Klausen, N.K. & Lund, E. 1986. Formation of biogenic amines in herring and mackerel. Zeitschrift fur Lebensmittel-Untersuchung Und-Forschung, 182: 459–463.
Konso, S., Yamaguchi, Y., Fuke, S. & Shirai, T. 1983. Amino acids and related compounds in the extracts of different parts of the muscleof chum salmon. Bull. Japan. Soc.,Scient. Fish., 49(2): 301–304.
Lassen, S. 1965. Tuna canning and the preservation of the raw material through brine refrigeration. In
Borgstrom G, ed. Fish as food, Vol IV, pp. 207–246. Academic Press Inc., New York, NY, USA.
Lehane, L. & Olley, J. 2000. Histamine fish poisoning revisited. Int. J. Food Microbiol., 58: 1–37.
Leuschner, R. G. & Hammes, W. P. 1999. Formation of biogenic amine in mayonnaise, herring and tuna fish salad by lactobacilli. Int. J. Food Sci. Nutr., 50(3): 159–164.
Lukton, A. & Olcott, H.S. 1958. Content of free imidazole compounds in the muscle tissue of aquatic animals. Food Res., 23: 611–618.
Lyons, D.E., Beery, J.T., Lyons, S.A. & Taylor, S.L. 1983. Cadaverine and aminoguanidine potentiate the uptake of histamine in vitro in perfused intestinal segments of rats. Toxicol. Appl. Pharmacol., 70: 445–458.
Ferran, M. & Yébenes, M. 2006. Flushing associated with scombroid fish poisoning. Dermatol. Online J., 12(2006): 15.
Mackie, I.M. & Fernández-Salguero, J. 1977. Histidine metabolism in fish. Urocanic acid in mackerel (Scomber scombrus). J. Sci. Food Agric., 28: 935–940.
Mackie, I.M., Pirie, L., Ritchie, A.H. & Yamanaka, H. 1997. The formation of non-volatile amines in relation to concentrations of free basic amino acids during postmortem storage of the muscle of scallop (Pecten maximus), herring (Clupea harengus) and mackerel (Scomber scombrus). Food Chem., 60: 291–295.
Maintz, L. & Novak, N. 2007. Histamine and histamine intolerance. Am. J. Clin. Nutr., 85(5): 1185–1196. Mongar, J. L. 1957. Effect of chain length of aliphatic amines on histamine potentiation and release. Br.
J. Pharmacol. Chemother., 12(2): 140–148. Morinaga, S, Kawasaki, A, Hirata, H, Suzuki, S & Mizushima, Y. 1997. Histamine poisoning after
ingestion of spoiled raw tuna in a patient taking isoniazid. Intern. Med., 36(3): 198–200. Morrow, J.D., Margoles, G.R., Rowland, J. & Roberts, L.J. 1991. Evidence that histamine is the causative
toxin of scombroid-fish poisoning. New Engl. J. Med., 324(11): 716–720. Motil, K.J. & Scrimshaw, N.S. 1979. The role of exogenous histamine in scombroid poisoning. Toxicol.
Lett., 3: 219–223. Murata, Y., Kaneniwa, M. & Yamashita, Y. 1998. Composition of free amino acids and related
compounds in the edible portion of ten salmonid species. Bull. Nat. Res. Inst. Fish. Sci., 10(2): 65–73.
Murata,Y., Henmi, H. & Nishioka, F. 1994. Extractive components in the skeletal muscle from ten different species of scombroid fishes. Fish. Sci., 60: 473–478.
Naila, A., Flint, S., Fletcher, G., Bremer, P. & Meerdink, G. 2010. Control of biogenic amines in food -
existing and emerging approaches. J. Food Sci., 75: R139–R150.
Naila, A, Flint, S, Fletcher, GC, Bremer, PJ & Meerdink, G. 2011. Biogenic amines and potential histamine-forming bacteria in Rihaakuru (a cooked fish paste). Food Chem., 128(2): 479–484.
New Zealand Ministry of Health. National nutrition survey. Wellington, New Zealand, Ministry of Health.
NSWFA [New South Wales Food Authority]. 2010. Presence of histamine in anchovies. Accessed 24 June 2012 at http://www.foodauthority.nsw.gov.au/_Documents/science/presence_of_histamine_in_anchovies.pdf
Nuutinen, S. & Panula, P. 2010. Histamine in neurotransmission and brain diseases. Histamine in innflammation, ISSN 0065-2598, Advances in Experimental Medicine and Biology, 709: 95–107.
NZFSA [New Zealand Food Safety Authority]. 2011. Survey of histamine in fish products. MAF Technical Paper No:2011/81. Accessed on 17 May 2012 at http://www.foodsafety.govt.nz/elibrary/industry/histamine-report-fish-sauce.pdf
NZMAF [New Zealand Ministry of Agriculture and Forestry]. 2011. Research of relevance to histamine poisoning in New Zealand: A review. MAF Technical Paper, No. 2011/70. Available at www.foodsafety.govt.nz/science/research-projects/reports-projects/
Osborne, C.M. & Bremer, P.J. 2000. Application of the bigelow (z-value) model and histamine detection to determine the time and temperature required to eliminate Morganella morganii from seafood. J. Food Prot., 63(2): 277–280(274).
Owen, D.A.A. & Woodward, D.F. 1980. Histamine and histamine H-1- and H-2-receptor antagonists in acute inflammation. Biochem. Soc. Trans., 8: 151–156.
Özden, Ö. 2005. Changes in amino acid and fatty acid composition during shelf-life of marinated fish. J. Sci.f Food Agric., 85: 2015–2020.
Őzogul, E., Taylor, K.D.A., Quantick, P. & Őzogul. Y. 2002. Changes in biogenic amines in herring stored
under modified atmosphere and vacuum pack. J. Food Sci., 67(7): 2497–2501.
Paik, J.H.-Y. & Bjeldanes, L.F. 1979. Effects of cadaverine on histamine transport and metabolism in isolated gut sections of the guinea-pig. Food Cosmet.Toxicol., 17: 629–632.
Park, J. S., Lee, C. H., Kwon, E. Y., Lee, H. J., Kim, J. Y. & Kim, S. H. 2010. Monitoring the contents of biogenic amines in fish and fish products consumed in Korea. Food Control, 21(9): 1219–1226.
Pons-Sánchez-Cascado, S.,Vidal-Carou, M.C., Mariné-Font, A. & Veciana-Nogués, M.T. 2005. Influence of the freshness grade of raw fish on the formation of volatile and biogenic amines during the manufacture and storage of vinegar-marinated anchovies. J. Agric. Food Chem., 53(22): 8586–8592.
Pons-Sánchez-Cascado, S., Veciana-Nogues, M.T., Bover-Cid, S., Mariné-Font, A. & Vidal-Carou, M.C. 2006. Use of volatile and non-volatile amines to evaluate freshness of anchovies stored in ice. J. Sci. Food Agric., 86: 699–705.
Pouillot, R. & Delignette-Muller, M.L. 2010. Evaluating variability and uncertainty separately in microbial quantitative risk assessment using two R packages. Int. J. Food Microbiol., 142(3): 330–340.
Predy, G., Honish, L., Hohn, W. & Jones, S. 2003. Was it something she ate? Case report and discussion of scombroid poisoning. Can. Med. Assoc. J., 5: 168.
Prester, L. 2011. Biogenic amines in fish, fish products and shellfish: a review. Food Addit. Contam. Part A Chem. Anal. Control Expo. Risk Assess., 28(11): 1547–1560.
Ricci, G., Zannoni, M., Cigolini, D., Caroselli, C., Codogni, R., Caruso, B., Bonello, E. & Rocca, G.P. 2010. Tryptase serum level as a possible indicator of scombroid syndrome. Clin. Toxicol., 48: 203–206.
Ross, T., Fratamico, P.M., Jaykus, L. & Zwietering, M.H. 2011. Statistics of sampling for microbiological testing of foodborne pathogens. In J. Hoorfar, ed. rapid detection, characterization, and enumeration of foodborne pathogens, pp. 103-120. Washington, DC, ASM Press.
Rossi, S., Lee, C., Ellis, P.C. & Pivarnik, L.F. 2002. Biogenic amines formation in Bigeye tuna steaks and whole skipjack tuna. J. Food Sci., 67: 2056–2060.
Russell, D.G., Parnell, W.R., Wilson, N.C. and the principal investigators of the 1997 National Nutrition Survey. 1999. NZ food: NZ people. Key results of the 1997 National Nutrition Survey. New Zealand Ministry of Health. Wellington, NZ.
Sakaguchi, M., Murata, M. & Kawai, A. 1982. Changes in free amino acids and creatine contents in Yellowtail (Seriola quinqueradiata) muscle during ice-storage. J. Sci.Food Agric., 47: 1661–1666.
Sanchez-Guerrero, I.M., Vidal, J.B. & Escudero, A.I. 1997. Scombroid fish poisoning: a potentially life-threatening allergic-like reaction. J. Allergy Clin. Immunol., 100(3): 433–434.
Sasikala, A., Wijeyaratne, M.J.S. & Jayasinghe, J.M.P.K. 2002. Histamine levels in fishery products imported to Sri Lanka. Indian J. Fish., 52(4): 385–395.
Sato, T., Horiuchi, T. & Nishimura, I. Simple and rapid determination of histamine in food using a new histamine dehydrogenase from Rhizobium sp. Analytical Biochemistry, 346(2): 320 - 326.
Satomi, M., Furushita, M., Oikawa, H. & Yano, Y. 2011. Diversity of plasmids encoding histidine decarboxylase gene in Tetragenococcus spp. isolated from Japanese fish sauce. Int. J. Food Microbiol., 148(1): 60_65.
Seafish [UK Sea Fish Industry Authority]. 2012. What constitutes a portion of seafood? Available at http://www.seafish.org/media/health/what-constitutes-a-portion-of-seafood.
Shahid, M., Tripathi, T., Sobia, F., Moin, S., Siddiqui, M.U. & Khan, R.A. 2009. Histamine, histamine receptors and their role in immunomodulation: an updated systematic review. Open Immunol. J., 2: 9–41.
Shalaby, A.R. 1996. Significance of biogenic amines to food safety and human health. Food Res. Int., 29: 675–690.
Shawyer, M. & Pizzali, M.A.F. 2003. The use of ice in small fishing vessels. FAO Fisheries Technical Paper No. 436, Rome, FAO. 108pp.
Shirai, T., Fuke, S., Yamaguchi, K. & Konosu, S. 1983. Studies on extractive components of salmonids .3. Amino-acids and related-compounds in the extracts of heated muscles of 4 species of salmon. Bull. Japan. Soc. Sci. Fish., 49: 765–768.
Silla Santos, M.H. 1996. Biogenic amines: their importance in foods. Int. J. Food Microbiol., 29: 213–231.
Sjaastad, O. & Sjaastad, O.V. 1974. Catabolism of orally administered 14C-histamine in man. Acta Pharmacol. Toxicol., 34(1): 33–45.
Smith, J.G.M. 1980. The storage of herring (Clupea harengus) in ice, refrigerated seawater and at ambient temperature. Chemical and sensory assessment. J. Sci. Food Agric., 31(4): 375–385.
South Australia Health. 2010. Food Act Report Year ending 30 June 2010. Accessed 24 June 2012 at www.dh.sa.gov.au/pehs/.../FoodActReport-PEHS-2010.pdf
Staruszkiewicz, W.F., Barnett, J.D., Rogers, P.L., Benner, R.A., Jr., Wong L.L. & Cook J. 2004. Effects of on-board and dockside handling on the formation of biogenic amines in mahi-mahi (Coryphaena hippurus), skipjack tuna (Katsuwonus pelamis), and yellowfin tuna (Thunnus albacares). J. Food Prot., 67(1): 134–141.
Statistics Bureau, Director/General for Policy Planning (statistical Standards) & Statistical Research and
Training Institute of Japan. 2012. Family income and expenditure survey. Statistics Bureau,
Director/General for Policy Planning (statistical Standards) & Statistical Research and Training
Institute of Japan. Available at http://www.stat.go.jp/english/data/kakei/index.htm
Suyama, M. & Yoshizawa, Y. 1973. Free amino acid composition of the skeletal muscle of migratory fish. Bull. Japan. Soc. Sci. Fish., 9: 1339–1343.
Tao, Z., Sato, M., Zhang, H., Yamaguchi, T. & Nakano, T. 2011. A survey of histamine content in seafood sold in markets of nine countries. Food Contr., 22(3/4): 430–432.
Taylor, S.L. & Lieber, E.R. 1979. In vivo inhibition of rat intestinal histamine-metabolizing enzymes. Food Cosmetic Toxicol., 17(3): 237–240.
Tenbrink, B., Damirik, C., Joosten, H.M.L.J. & Huis in’t Veld, H.J. 1990. Occurrence and formation of biologically active amines in foods. Int. J. Food Microbiol., 11: 73–84.
Thaysen, H.I. & E. Sloth. 1997. Grilled garfish – and its consequences. Dansk Veterinaertidsskrift, 80(23): 995.
Thippeswamy, S., Ammu, K. & Joseph, J. 2002. Biochemical changes during iced storage of Indian milk fish (Chanos chanos). J. Food Sci. Technol.-Mysore, 39: 144–148.
Tine, A. & Douabale, E.S (2008) new method for determining histamine rate in halieutic products. Reviews in fluorescence 2008, Geddes, C. D., ed., pp. 195–218. Springer. New York, NY, USA.
Toda, M., Yamamoto, M., Uneyama, C. & Morikawa, K. 2009. Histamine food poisonings in Japan and other countries. Am. Chem. So., 238: 209.
Tsai, Y.H., Kung, H.F., Lee, T.M., Chen, H.C., Chou, S.S., Wei, C.I. & Hwang, D.F. 2005. Determination of histamine in canned mackerel implicated in a food borne poisoning. Food Control, 16: 579–585.
Tsai, Y.-H., Hsieh, H.-S., Chen, H.-C., Cheng, S.-H., Chai, T.-J. & Hwang, D.-F. 2007. Histamine level and species identification of billfish meats implicated in two food-borne pathogens. Food Chem., 104: 1366–1371.
US EPA [Environmental Protection Agency]. 2002. Consumption in the United States, August 2002. US Environmental Protection Agency. (4303T) 1200 Pennsylvania Avenue, NW, Washington, DC 20460, USA. EPA-821- C- 02-003.
US EPA [Environmental Protection Agency]. 2002. Estimated per capita fish consumption in the United States, August 2002. (4303T) 1200 Pennsylvania Avenue, NW, Washington, DC 20460, USA. EPA-821- C- 02-003.
US EPA [Environmental Protection Agency]. Benchmark dose-response modelling software. Available at http://www.epa.gov/ncea/bmds/index.html
USTF [The United States Tuna Foundation]. 2002. HACCP Program 2002.
Van Gelderen, C.E.M., Savelkoul, T.J.F., van Ginkel, L.A. & van Dokkum, W. 1992. The effects of histamine administered in fish samples to healthy volunteers. Clin. Toxicol., 30: 585–596.
van Schothorst, M., Zwietering, M.H., Ross, T., Buchanan, R.L & Cole, M.B. International Commission on Microbiological Specifications for Foods. (2009). Relating microbiological criteria to food safety objectives and performance objectives. Food Control, 20: 967–979.
Vasseur, B., Parrot, J. L., Nicot, G. & Canu, P. 1968. Research on certain natural antihistaminic activities. J. Physiol. (Paris), 60(Suppl 2): 380–381.
chromatographic method for determination of biogenic amines in fish and fish products. J AOAC Internat., 78(4): 1045–1050. Veciana-Nogués, M.T., Mariné-Font, A. & Vidal-Carou, M.C., 1997. Biogenic amines as quality
indicators of tuna. Relationships with microbial counts, ATP related compounds, volatile amines,
and organoleptic changes. J. Agric. Food Chem., 45: 2036–2041.
Visciano, P., Schirone, M., Tofalo, R. & Suzzil, G. 2012. Biogenic amines in raw and processed seafood. Front. Microbiol., 3: 188. Vosikis, V., Papageorgopoulou, A., Economou, V., Frillingos, S. & Papadopoulou, C. 2008. Survey of the
histamine content in fish samples randomly selected from the Greek retail market. Food Addit. & Contam. Part B_SurveillancE, 1: 122–129.
Wantke, F., Gotz, M. & Jarisch, R. 1993. Histamine-free diet: treatment of choice for histamine-induced food intolerance and supporting treatment for chronic headaches. Clin. Exp. Allergy, 23(12): 982–985.
Weiss, S., Robb, G.P. & Ellis, L.B. 1932. The systemic effects of histamine in man. Intern. Med., 49: 360-96.
Wilson, B.J., Musto, R.J. & Ghali, W.A. 2012. A case of histamine fish poisoning in a young atopic woman. J. Gen. Intern. Med. 27(7):878-881.
Woodward, D. F. & Ledgard, S. E. 1986. Histamine-induced microvascular permeability increases in hamster skin: a response predominantly mediated by H2-receptors. Agents Actions, 18(5-6): 504–507.
Yatsunami, K. & Echigo, T. 1991. Isolation of salt tolerant histamine-forming bacteria from commercial rice-brane pickles of sardine. Nippon Suisan Gakkaishi, 57: 1723–1728.
Yiannopoulos, S., Iacovou, X., Poulli, E. & Argyrides, R. 2006. A survey for determining the presence of histamine in fishes of the Cyprus market. Presentation accessed on 20 June 2012 at http://www.aoaceurope.com/2006/yianno.pdf (European Section of AOAC International).
Annex 1 – Meeting participants Dr Ronald Allen Benner Jr US Food and Drug Administration Gulf Coast Seafood Laboratory One Iberville Dr. Dauphin Island, AL 36528 USA Tel: +1 251 690 2319 Fax: +1 251 694 4477 E-mail: [email protected]
Mrs Catherine Birmingham Senior Toxicologist Chemical Risk Assessment Unit Chemical Safety Division Food Standards Agency (FSA) 3b Aviation House 125 Kingsway London WC2B 6NH Tel: +44 207 276 8526 E-mail: [email protected]
Dr P. Michael Bolger Senior Toxicologist CFSAN FDA 5100 Paint Branch Parkway College Park, MD 20740-3835 USA Tel: +1 240 402 1941 Home tel: +1 410 267 7249 Fax: E-mail: [email protected][email protected]
Dr Guillaume Duflos Assistant Director Laboratory for Fishery Products ANSES (Agence nationale de sécurité sanitaire de l'alimentation, de l'environnement et du travail), France Bld du bassin Napoléon 62200 Boulogne-sur-Mer France Tel: +33 (0)3 21 99 25 00 Fax: +33 (0)3 21 99 17 25 Email: [email protected]
Mr Graham Clive Fletcher Research Team Leader Food Safety and Preservation Seafood Technologies The New Zealand Institute for Plant & Food Research Limited Private Bag 92169 Auckland 1142 New Zealand Tel: +64 9 926 3512 Mobile: +64 27 4511 755 Fax: +64 9 925 7001 Email: [email protected]
Dr Laurent Guillier Laboratoire de sécurité des aliments (ANSES) 23 avenue du Général de Gaulle 94700 Maisons-Alfort France Tel: +33 149772644 Email: [email protected]
Dr Alberto Salas Maldonado Research Director Insituto Tecnologico Pesquero Avenida El triunfo 1662 Villa Maria del Triunfo Lima Perú Tel: +51 1 577 5255 Personal: +51 1 496 0034 Mobile: +51 1 990 984 713 E-mail: [email protected]
Mr Fred Nolte Senior Director Quality Assurance Clover Leaf Seafoods 13071 Vanier Place Unit 230, Richmond BC Canada Tel: +1 604 249 3474 x 9907 Mobile: +1 858 736 6047 Fax: +1 858 694 9391 Email: [email protected]
Dr Gerard Lambert Roessink Senior Advisor International Cooperation Netherlands Food and Consumer Product Safety Authority Ministry of Economic Affairs Agriculture and Innovation Catharijnesingel 59 3511 GG Utrecht The Netherlands Tel: +31 882333333 Mobile: +31 6150 35 926 Email: [email protected]
Dr. Rogério Mendes Researcher with Habilitation Unit of Upgrading of Fish and Aquaculture Products National Institute of Biological Resources INRB I.P./L-IPIMAR Av. Brasília 1449-006 Lisbon Portugal Tel: +351 21 3027036 Mobile: +351 968 603 671 Fax: + 351 21 301 59 48 Email: [email protected]
Dr Tom Ross Food Microbiologist International Commission on Microbiological Specifications for Foods (ICMSF) Tasmania Australia Email: [email protected]
Dr Masataka Satomi National Research Institute of Fisheries Science Fisheries Research Agency 2-12-4, Fukuura Kanazawa-ku, Yokohama 2368648 Japan Tel: +81 45 788 7669 Fax: +81 45 788 5001 Email: [email protected]
Miss Wanasen, Sri-anant (Ann) Food Microbiology and Risk Assessment National Center for Genetic Engineering and Biotechnology (BIOTEC) 113 Thailand Science Park Phahonyothin Road Klong 1 Klong Luang Pathumthani 12120 Thailand Tel: +66 (0)2564-6700 ext. 3252, Mobile: +66(0)846997200 Fax: +662 5646707 Email: [email protected]
Prof Alphonse Tine Professor, Dept. Chemistry Faculty of Sciences and Techniques University Cheikh Anta Diop BP 5005 Dakar Senegal Tel: +221 77 541 90 53 Fax: :+221 33 824 63 18 Email: [email protected]
Dr Hajime Toyofuku Section Chief (Food Safety) Department of International Health and Coordination National Institute of Public Health 2-3-6 Minami Wako Saitama 351-1097 Japan Tel: +81 48 458 6150 Fax: +81 48 458 6195 Email: [email protected]
Dr Yu (Janet) Zang Toxicology Team Division of Petition Review (HFS-265) Office of Food Additive Safety FDA/CFSAN 5100 Paint Branch Pkwy HFS-265 College Park, MD 20740 USA Tel: +1 240 402 2095 Fax: +1 301 436 2972 Email: [email protected]
FAO/WHO Secretariat Dr Sarah Cahill Food Safety Officer (JEMRA Secretary) Food and Agriculture Organization of the United Nations (FAO) Viale delle Terme di Caracalla 00153 Rome, Italy Tel: +39 06 570 53614 Fax +39 06 570 54593 Email: [email protected]
Dr Vittorio Fattori Food Safety and Quality Officer Food and Agriculture Organization of the United Nations (FAO) Viale delle Terme di Caracalla 00153 Rome, Italy Tel: +39 06 570 56951 Fax +39 06 570 54593 Email: [email protected]
Dr Karunasagar Iddya Senior Fishery Officer Products, Trade and Marketing Service Food and Agriculture Organization of the United Nations (FAO) Viale delle Terme di Caracalla 00153 Rome, Italy Tel: +39 06 570 54873 Fax +39 06 570 53020 Email: [email protected]
Dr Mina KOJIMA Technical Officer Department of Food Safety and Zoonoses World Health Organization 20, Avenue Appia CH-1211 Geneva 27 Tel: +41 22 791 2920 Fax: +41 22 791 4807 E-mail: [email protected]
Codex Secretariat Dr Verna Carolissen-Mackay Food Standard Officer Codex Alimentarius Commission Joint FAO/WHO Standards Programme Viale delle Terme di Caracalla 00153 Rome, Italy Tel: +39 06 570 55629 Fax +39 06 570 54593 Email: [email protected]
Dr Selma Doyran Secretary Codex Alimentarius Commission Joint FAO/WHO Standards Programme Viale delle Terme di Caracalla 00153 Rome, Italy Tel: +39 06 570 55826 Fax +39 06 570 54593 Email: [email protected]
3. Dose–response assessment .............................................................................. 102 3.1. Histamine as the exposure marker in SFP ................................................. 102 3.2. Study selection for dose–response assessment ........................................ 102 3.3. Derivation of a no-observed-adverse-effect limit (NOAEL) ....................... 104 3.4. Derivation of a benchmark dose (BMD) .................................................... 105
4. Recommended studies ...................................................................................... 106 5. Major references ............................................................................................... 108
78
1. Toxicological aspects
1.1 Histamine
Histamine is a naturally occurring substance in the human body and is derived
from the decarboxylation of the amino acid histidine. Histamine is also present
in certain foods containing free histidine, and is generated by certain bacteria
for example during spoilage and fermentation. Endogenous histamine has
important physiological functions related to local immune responses, gastric
acid secretion, and neuromodulation (Taylor, 1986). However, histamine-rich
foods may cause food intolerance in sensitive individuals. Further, histamine
contamination in fish and fish products may cause food poisoning.
1.1.1 Absorption, distribution, metabolism and excretion
Absorption Human subjects can tolerate up to 180 mg histamine orally without having
noticeable effects, while intravenous administration of 0.007 mg histamine produces
vasodilatation and increased heart rate (Weiss et al., 1932). This suggests that
histamine is not efficiently absorbed from the gastrointestinal tract. It has been
postulated that histamine-metabolizing enzymes present in the intestinal tract prevent
the absorption of ingested histamine into the circulation (Taylor 1986).
Distribution Endogenous histamine is generated by an enzyme called histidine
decarboxylase (HDC), which is only synthesized as necessary and is degraded
immediately when sufficient histamine has been generated. The HDC exists primarily
in mast cells, basophils, enterochromaffin-like cells in the gastric mucosa and
histaminergic neurons. Generally, histamine is stored as a histamine–heparin complex
in the secretory granules in these cells, and is released upon stimulation to exert its
physiological functions. However, recently it has been found that a small amount of
histamine is synthesized in some epidermal cells and released immediately (Shahid et
al., 2009).
Metabolism In humans and experimental animals, histamine is primarily metabolized
by two enzymes, diamine oxidase (DAO) and histamine-N-methyltransferase (HMT)
(Maintz and Novak, 2007). DAO converts histamine into imidazoleacetic acid, which
can be conjugated with ribose before excretion. HMT converts histamine into
methylhistamine, which is then converted by monoamine oxidase (MAO) into N-
imidazoleacetic acid. The ultimate end products of histamine metabolism are excreted
in the urine.
In humans, DAO is expressed mainly in the intestinal tract, which limits the uptake of
exogenous histamine into the circulation. HMT, however, is widespread in human
79
tissues with the order of activity being liver >> colon > spleen > lung > small intestine
> stomach (Hesterberg et al., 1984). Therefore, DAO is considered the major
metabolic enzyme for ingested histamine, while intravenously or intradermally
injected histamine is primarily metabolized by HMT. HMT is very selective for
histamine, while the substrates of DAO include other biogenic amines such as
cadaverine and putrescine (Taylor, 1986).
Altered histamine metabolism has been reported in individuals taking isoniazid
(Morinaga et al., 1997) and drugs that inhibit DAO or MAO, as well as patients with
mastocytosis, tumor or chronic myelocytic leukemia (Maintz and Novak, 2007).
Histamine metabolism may also be influenced by consumption of foodborne DAO
inhibitors such as thiamine, cadaverine and tyramine (Taylor, 1986).
Excretion When 14
C-histamine was administered orally to humans, 68 to 80 percent of
a radioactive dose was recovered in the urine. Some histamine does remain in the
feces and additional amounts are catabolized by intestinal bacteria and exhaled as CO2
from the lungs (Sjaastad and Sjaastad, 1974).
1.1.2 Mechanism of action
Histamine exerts its effects through the activation of four different types of histamine
receptors (H1, H2, H3 and H4) on/in the cellular membrane. These histamine receptors
are expressed on different cell types and work through different signaling pathways,
resulting in multiple biological responses. For example, histamine increases
vasopermeability and vasodilation, causing urticaria, flushing, hypotension and
headache. Histamine also induces contraction of intestinal smooth muscle, causing
abdominal cramps, diarrhea and vomiting (Lehane and Olley, 2000).
1.1.3 Toxicological responses in animals
The toxicological responses to histamine depend on the method of administration, and
the toxicological effects differ among species. Oral administration of histamine, alone
or together with spoiled tuna, produced emesis in pigs. An emetic response was also
observed in dogs (Blonz and Olcott, 1978). As reviewed by Taylor (1986),
intraduodenal injection of histamine produced only transient hypotension in dogs and
cats, while a histamine-containing yeast extract produced a wider variety of effects in
cats, including increased volume and acidity of stomach acid, increased hematocrit
and limb volume, and enhanced electromyographic activity. When given
intradermally, histamine induced microvascular permeability in the skin of hamsters
and rats (Woodward and Ledgard, 1986).
80
1.1.4 Toxicological responses in humans
While in physiological concentration a necessary and desirable substance, histamine
becomes toxic when large doses enter the circulation. The incidence often results in
poisoning symptoms, with a wide range of organs affected (Taylor, 1986). The
toxicological effects of histamine are related to its normal physiological actions in the
body.
Vascular: Dilatation of the peripheral blood vessels, predominantly arteries, results in
hypotension, flushing and headache. Histamine also induces increased capillary
permeability, resulting in symptoms such as edema, urticaria, hemoconcentration and
increased blood viscosity. Shock can result from administration of very high doses of
histamine. The effect on capillary permeability is mediated by both H1 and H2
receptors (Owen et al., 1980).
Heart: Histamine exerts a direct stimulatory action on the heart. Histamine increases
heart contractility and increases the rate and strength of the contractions. The effects
of histamine on the heart might account for the palpitations noted by some persons
experiencing histamine poisoning. Histamine can cause either contraction or
relaxation of extravascular smooth muscles. Contraction is mediated by H1 receptors,
while relaxation is associated with H2 (Shahid et al., 2009) receptors.
Gastrointestinal In humans, the predominant action of histamine on extravascular
smooth muscles is contraction. This smooth muscle contraction is most often noted in
the bronchi and intestines. In histamine poisoning, the contraction of intestinal smooth
muscle is particularly apparent, because histamine enters the gastrointestinal tract
initially. Contraction of intestinal smooth muscle leads to the abdominal cramps,
diarrhea, and vomiting which are often noted in cases of histamine poisoning (Taylor,
1986).
Neurological: Histamine is also a potent stimulant of both sensory and motor neurons.
This stimulation may be important in producing the pain and itching that frequently
accompany the urticarial lesions in histamine poisoning. This neural stimulation is
mediated by H1 (Nuutinen and Panula, 2010) receptors.
1.1.5. Histamine intolerance
Histamine intolerance is a type of food intolerance with allergic-like symptoms. It
occurs when histamine-rich foods, such as cheese and wine, are consumed by
susceptible individuals. Owing to genetic or acquired dysfunction of DAO or NMT,
ingested histamine cannot be degraded efficiently in the gastrointestinal tracts of these
individuals. The resulting build-up of histamine in the system causes a series of toxic
81
effects that are similar to a common food allergy, which usually include swelling,
rashes, hives, and asthma-like symptoms such as difficulty in breathing, wheezing and
smooth muscle contractions. Gastrointestinal symptoms, such as bloating and
diarrhea, have also been reported (Maintz and Novak, 2007). The same histamine-rich
foods would not cause these reactions in a non-susceptible population. This condition
can be used to explain the variations between individuals in their susceptibility to
dietary histamine in decomposed fish (Motil and Scrimshaw, 1979). People with
histamine intolerance are advised to take a histamine-free diet (Wantke et al., 1993).
Individual susceptibility to SFP has been observed in multiple epidemiological studies
and healthy volunteer challenge tests. It is generally accepted that the ability to
tolerate histamine exposure can be compromised when histamine-metabolizing
enzymes are impaired. The factors associated with increased sensitivity to histamine
have been summarized in a recent report on biogenic amines (EFSA, 2011). Briefly,
reduced histamine metabolism can result from genetic polymorphism (Garcia-Martin
et al., 2009), certain physiological states/conditions such as menstruation (Jonassen et
al., 1976; Kalogeromitros et al., 1995), gastrointestinal diseases (Mainz and Novak,
2007) or use of certain medications (Y. H. Hui, 2006; Taylor, 1986). There is
suggestive evidence that the severity and incidence of SFP may depend on age
(Ianuzzi et al., 2007). Smoking and alcohol drinking may also increase sensitivity to
biogenic amines by reducing the degradation capacity (EFSA, 2011).
1.1.6. Scombrotoxin fish poisoning (SFP)
SFP is a worldwide food safety problem and is a common cause of fish poisoning. The
food poisoning is caused by heat-stable scombrotoxins, presumably arising from
bacterial action in fish. Though detailed components of scombrotoxins have not been
identified, it is generally accepted that biogenic amines, especially histamine, play an
important role in the pathogenesis of SFP. The incriminated fish usually contains
abnormally high levels of histamine due to bacterial activity resulting from
inappropriate handling or storage conditions, and histamine has been implicated as (at
least part of) a potential causative agent. Therefore, SFP is also called histamine fish
poisoning (HFP). Though HFP shares some symptoms with histamine intolerance,
they are two distinct conditions. Unlike histamine intolerance, SFP may involve the
presence of other toxic decomposition products or other components unique to fish
(Hungerford, 2010). In addition, SFP attacks not only susceptible individuals but also
those with normal capacity for histamine degradation.
82
Symptoms A variety of symptoms of SFP have been observed among humans (Table
1). Poisoned individuals may show one or more of these symptoms, and the severity
of the response to the contaminated fish may vary. In several case reports,
exacerbation of asthma and more serious cardiac manifestations were reported
(Ascione et al., 1997; D'Aloia et al., 2011; Wilson et al., 2012). The symptoms
typically develop rapidly (from 5 minutes to 2 hours after ingestion of spoiled fish),
with a usual duration of 8–12 hours, and usually resolve themselves within 24 hours.
Although symptoms may persist for up to several days, there are no known long-term
sequelae. SFP is rarely is considered to be potentially fatal. According to the data from
US Centers for Disease Control and Prevention (CDC) for the period from 1998 to
2002, there were 463 cases reported and no deaths (CDC, 2006). According to the data
from the Japanese Ministry of Health, Labor and Welfare for the period from 1998 to
2008, there were 89 cases reported and no deaths (Toda et al., 2009) .
Table 1. Common symptoms of scombrotoxin fish poisoning.
neoplasia, stomach and colonic ulcers) may elevate sensitivity because of the lower
activity of oxidases in the intestine compared withg healthy individuals (Jarisch, 2004;
Mainz and Novak, 2007).
Tobacco smoke reduces MAO levels by up to 40 percent and several cigarette smoke
compounds have been shown to inhibit MAO enzyme activities (Broadley, 2010).
Certain food components may also compromise the ability of detoxifying enzymes
(MAO, DAO, HMT) to degrade ingested amines, such as other amines, alcohol and its
metabolite acetaldehyde, and phenols (J. Y. Hui and Taylor, 1985; Zimatkin and
Anichtchik, 1999).
There is suggestive evidence that the severity of the symptoms and the incidence of
SFP may be age-related (Iannuzzi, 2007; FDA, 2011).
3. Dose–response assessment
3.1. Histamine as the exposure marker in SFP
Though other biogenic amines such as cadaverine and putrescine might also play a
role in the etiology of SFP, there are no dose–response data for the co-administration
of either biogenic amine with histamine in laboratory animals or humans. In most
epidemiological studies, SFP is associated with abnormally high histamine levels in
the incriminated fish. Therefore, histamine is considered the most appropriate marker
of dose in this assessment.
3.2. Study selection for dose–response assessment
While there have been a number of reports in the scientific literature of human
scombroid poisonings, the vast majority of these are case reports of generally a few
cases and in a few instances of multiple cases of more than 100 subjects. The
difficulty with the use of case reports in a dose–response assessment is that the
recapitulation of the dosage/exposure level in these studies is almost impossible to
determine. Crude measures have been used to estimate the dose/exposure level by
using levels detected in samples of the suspect fish and/or the recall of the patients of
the amounts of fish consumed. These estimates of exposure/dosage are highly
uncertain and cannot be used to construct a quantitative assessment of dose versus
adverse response.
In regards to the few published retrospective studies, there are important limitations
including reliance on voluntary reporting, limited follow-up, and the lack of data on
histamine levels or those of any other biogenic amines in fish samples consumed by
the subjects, or in their biologic fluids. However, the typical histamine-like clinical
103
manifestations seen in SFP together with temporal proximity to consumption of fish
known to be involved in scombroid poisoning supports the diagnosis of biogenic
amine poisoning. The critical endpoint in acute histamine intoxication is a spectrum of
symptoms including headache, flushing, itching and urticaria.
The other major hurdle in the quantitative use of these studies is the uncertainty
associated with the lack of understanding of whether histamine is the sole responsible
etiological toxin(s), whether it is a surrogate of another toxin(s), or whether histamine
is working in concert with other biogenic amines or as yet unidentified chemicals in
the fish, and what the nature of that relationship is (e.g. additive, synergistic).
Histamine levels within fish appear to correlate well with the clinical toxicity of SFP,
but an equivalent dose of orally administered pure histamine does not produce the
same spectrum of symptoms as seen in SPF. Even though there are several plausible
hypotheses which attempt to explain this paradox, the mechanism of toxicity in SFP
remains unclear.
To study health effects of histamine in humans, a number of volunteer challenge
studies have been conducted. Many studies were designed to investigate the minimal
dose of histamine that causes SFP or histamine intolerance symptoms, or the
maximum dose of histamine that can be taken without causing these symptoms. Most
of these studies are well-designed randomized trials, in which the doses were well
controlled and the symptoms were carefully monitored by medical professionals.
Therefore, data from these human trials should reflect the histamine–SFP dose–
response relationship better than data from case reports.
Histamine challenge studies in humans are summarized in the EFSA biogenic amine
report (EFSA, 2011) and the “Seafood Biogenic Amine Database” (Emborg and
Dalgaard, 2007). In these studies histamine was administrated with different food
matrices and given to healthy or susceptible volunteers, usually in a controlled,
blinded study design. The EFSA report includes all human studies regardless of the
route of exposure and the food matrices in which histamine was administered, while
the “Seafood Biogenic Amine Database” only includes those oral toxicity studies in
which fish was used as the food matrix (Table 4).
Among the five studies listed in Table 4, three studies (Clifford et al., 1989; Clifford
et al., 1991; Ijomah et al., 1991) failed to establish that histamine was the causative
104
agent of the SFP symptoms, and therefore these were excluded from the dose–
response assessment.
Table 4. Published histamine oral challenge studies (from Emborg and Dalgaard,
2007).
3.3. Derivation of a no-observed-adverse-effect limit (NOAEL)
Data used to characterize the dose–response relationship between histamine in fish
and SFP-like symptoms are presented in Table 5. Based on these data, a NOAEL of 50
mg histamine is identified, which is consistent with that established by EFSA. The
threshold toxic dose for the histamine challenge studies appears to be about 90 mg
(Table 5). However, the threshold toxic dose for histamine in SFP is not known.
105
Table 5. Human oral dose–response relationship for histamine in fish.
Histamine
dose (mg)
Food
ingested
Number
of
subjects
Number of subjects
showing symptoms
Reference
25 Tuna 8 0 Motil and Scrimshaw, 1979
45 Herring 8 0 Van Gelderne et al., 1992
50 Tuna 8 0 Motil and Scrimshaw, 1979
90 Herring 8 2 Van Gelderne et al., 1992
100 Tuna 8 2 Motil and Scrimshaw, 1979
150 Tuna 8 2 Motil and Scrimshaw, 1979
180 tuna 8 6 Motil and Scrimshaw, 1979
It is important to bear in mind that while the NOAEL is an appropriate hazard
threshold value to use for exposures in healthy subjects, this may not be the case for
those members of certain segments of the population who may have an increased
sensitivity (e.g. metabolic differences, physiological conditions, drug therapies). In
these instances a lower hazard level (e.g. the use of an uncertainty factor of 10) or
other specific risk management options such as fish consumption advisories should be
considered.
3.4. Derivation of a benchmark dose (BMD)
As an alternative to the NOAEL methodology, the BMD methodology is also
commonly used to derive a threshold value in risk assessment. Unlike the NOAEL
approach, the BMD approach uses the whole range of available dose–response data by
fitting mathematical models to the dataset to derive an estimate of the threshold dose
corresponding to a predetermined level of extra which is normally a 10 percent extra
risk. The resulting BMD estimate, BMD10, is the central estimate of the dose that
corresponds to the additional risk. The lower 95 percent confidence limit of the BMD
(BMDL10) is calculated to address and account for uncertainties in the estimate of
BMD due to the experimental design (e.g. small sample size).
The US Environmental Protection Agency’s BMD modelling software (BMDS 2.2)
was used to determine benchmark doses for histamine. Using a 10 percent extra risk,
data from Table 5 were analyzed using multiple dichotomous models (Logistic,
LogLogistic, Weibull, Probit, LogProbit). The calculated BMD10 and BMDL10 are
presented in Table 6. Two measurements of goodness of fit (GOF), the p-value and
the Akaike information criterion (AIC) value are also presented in Table 6.
106
Table 6. Results from the BMD dose–response modelling.
Model BMD10 BMDL10 p AIC
Logistic 85.7 61.1 0.53 44.63
LogLogistic 78.7 50.5 0.64 43.82
Weibull 79.6 49.6 0.64 43.74
Probit 83.1 58.4 0.58 44.20
LogProbit 78.1 51.9 0.67 43.43
As shown in Table 6, all models attained an acceptable goodness of fit (p > 0.1), and
produced similar BMD10 and BMDL10. The Weibull model gave the most
conservative BMDL10 (49.6 mg, rounded to 50 mg) of the five models, and the best
overall goodness of fit (p = 0.64, AIC = 43.74). In addition, the Weibull model is
biologically relevant for use in the dose–response modelling of histamine, which is a
product of micro-organism activity. Figure 3 shows the Weibull model fit to the dose–
response data in Table 5.
Figure 3. Weibull model of combined data from fish–histamine human challenge studies.
Since the study of Motil and Scrimshaw (1979) had more dose groups (five doses)
than the Van Gelderen (1992) study (two doses), separate BMD modelling was
performed using data from Motil and Scrimshaw (1979) only. The BMD10 and
BMDL10 resulting from this assessment were very close to those produced in the
assessment of the combined dataset of these two studies. For the Weibull model, the
BMDL10 was 47.7 mg, as compared to 49.7 mg from the assessment of the combined
dataset.
0
0.2
0.4
0.6
0.8
1
0 20 40 60 80 100 120 140 160 180
Fra
ctio
n A
ffect
ed
dose
Weibull Model with 0.95 Confidence Level
05:01 07/25 2012
BMDL BMD
Weibull
107
4. Recommended studies
The reduction of the uncertainty surrounding the critical role played by histamine in
the pathogenesis of SFP is needed. Studies that will clarify the mechanistic role and
the quantitative relationship of histamine to the spectrum of adverse effects seen in
SFP are deemed to be essential.
Evidence suggests that potentiators alter the threshold toxic dose for histamine in
contaminated fish. The elucidation of the quantitative relationship between the dose of
histamine and other biogenic amines and the various adverse effects is needed. Ideally
such work would be derived from studies of human volunteers, but the likelihood that
they can be conducted may be limited. In lieu of human studies, appropriate animal
models and studies, such as in the swine, should be investigated. In these studies, the
emphasis should be on a dose range between the NOAEL and the low levels
associated with the onset of mild symptoms.
Beyond the three known potentiators (cadaverine, putrescine and tyramine), studies
are needed to characterize and identify currently unknown potentiators, e.g. other
biogenic amines.
Further studies are needed on the identity and mechanisms of action of potential
histamine potentiators. The types and levels of the potentiators may vary depending on
a variety of factors, including the types of microflora, the metabolic capabilities of the
microflora, the natural constituents of the fish, and the conditions of spoilage.
Other studies that are deemed to be helpful would be those that consider and
investigate the various factors that may enhance sensitivity of the response to SFP in
various populations and would include study of the role of:
genetic polymorphism in histamine metabolism;
certain physiological states/conditions such as menstruation;
gastrointestinal tract diseases;
certain medications;
certain lifestyle practices such as smoking and alcohol consumption in
altering biogenic amine metabolism.
108
Acknowledgement
The authors would like to thank Dr Ronald Benner Jr. (from US FDA), for kindly
sharing his knowledge and resources. Dr Benner, as an expert on histamine and seafood
safety, has been collecting both scientific and regulatory information on histamine for
the past 10 years.
109
5. Major references
Al Bulushi, I., et al. 2009. Biogenic amines in fish: roles in intoxication, spoilage, and nitrosamine formation – a review'. Crit. Rev. Food Sci. Nutr., 49(4): 369–377.
Ascione, A., et al. 1997. [Two cases of "scombroid syndrome" with severe cardiovascular compromise], Cardiologia, 42(12): 1285–1288.
Bartholomew, B.A., et al. 1987. Scombrotoxic fish poisoning in Britain: features of over 250 suspected incidents from 1976 to 1986. Epidemiol. Infect., 99(3): 775–782.
Becker, K., et al. 2001. Histamine poisoning associated with eating tuna burgers. JAMA, 285(10): 1327–1330.
Bjeldanes, L.F., Schutz, D.E. & Morris, M.M. 1978. On the aetiology of scombroid poisoning: cadaverine potentiation of histamine toxicity in the guinea-pig. Food Cosmet. Toxicol., 16(2): 157–159.
Blonz, E.R. & Olcott, H.S. 1978. Effects of orally ingested histamine and/or commercially canned spoiled skipjack tuna on pigs, cats, dogs and rabbits. Comp. Biochem. Physiol. C, 61C(1): 161–163.
Borade, P.S., Ballary, C.C. & Lee, D.K. 2007. A fishy cause of sudden near fatal hypotension. Resuscitation, 72(1): 158–160.
Borysiewicz, L. & Krikler, D. 1981. Scombrotoxic atrial flutter. Br. Med. J. (Clin. Res. Ed.), 282(6274): 1434.
Brown, C. 1993. Scombroid poisoning-case report. Med. J. Aust., 158: 435–436. CDC. 2006. Surveillance for food-borne-disease outbreaks – United States, 1998-2002.
MMWR, 55(SS10); Altanta, GA, Centers for Disease Control and Prevention): 1–34. Clifford, M.N., et al. 1991. Is there a role for amines other than histamines in the aetiology of
scombrotoxicosis? Food Addit. Contam., 8(5), 641–651. Cruickshank, J. & Williams, H. 1978. Scombrotoxic fish poisoning. BMJ, 2: 739–740. D'Aloia, A., et al. 2011. A scombroid poisoning causing a life-threatening acute pulmonary
edema and coronary syndrome in a young healthy patient. Cardiovasc. Toxicol., 11(3): 280–283.
Demoncheaux, J.P., et al. 2012. A large outbreak of scombroid fish poisoning associated with eating yellowfin tuna (Thunnus albacares) at a military mass catering in Dakar, Senegal. Epidemiol. Infect., 140(6): 1008–1012.
Di Grande, A., et al. 1999. The scombroid syndrome, a potentially serious ichthyotoxicosis. Ann. Ital. Med. Int., 14: 51–53.
EFSA. 2011. Scienfic opinion on risk based control of biogenic amine formation in fermented foods. EFSA J., 9(10): 2393.
FDA. 2005. Compliance Policy Guide (CPG) Sec. 540.525 Decomposition and histamine raw, frozen tuna and mahi-mahi; canned tuna; and related species.
FDA. 2011. Chapter 7: Scombrotoxin (histamine) formation. In Fish and fishery products hazards and controls guidance.
Feldman, K.A., et al. 2005. A large outbreak of scombroid fish poisoning associated with eating escolar fish (Lepidocybium flavobrunneum). Epidemiol. Infect., 133(1): 29–33.
Ferran, M. & Yebenes, M. 2006. Flushing associated with scombroid fish poisoning. Dermatol. Online J., 12(6): 15.
Garcia-Martin, E., et al. 2009. Histamine pharmacogenomics. Pharmacogenomics, 10(5): 867–883.
Gregory, J. 2002. Outbreaks of diarrhoea associated with butterfish in Victoria. Commun. Dis. Intell., 26(3): 439–440.
Hall, M. 2003. Something fishy: six patients with an unusual cause of food poisoning! Emerg. Med. (Fremantle), 15(3): 293–295.
110
Hesterberg, R., et al. 1984. Histamine content, diamine oxidase activity and histamine methyltransferase activity in human tissues: fact or fictions? Agents Actions, 14(3-4): 325–334.
Hui, J.Y. and Taylor, S.L. 1985. Inhibition of in vivo histamine metabolism in rats by foodborne and pharmacologic inhibitors of diamine oxidase, histamine N-methyltransferase, and monoamine oxidase. Toxicol. Appl. Pharmacol., 81(2): 241–249.
Hui, Y.H. 2006. Handbook of food science, technology, and engineering. Taylor & Francis. Hungerford, J. M. 2010. Scombroid poisoning: a review. Toxicon, 56(2): 231–243. Huss, H.H., Ababouch, L. & Bram, L. 2004. Assessment and management of seafood safety
and quality. FAO Fisheries Technical Paper. No. 444. Ijomah, P., et al. 1991. The importance of endogenous histamine relative to dietary histamine
in the aetiology of scombrotoxicosis. Food Addit. Contam., 8(4): 531–542. Jansen, S.C., et al. 2003. Intolerance to dietary biogenic amines: a review. Ann. Allergy
Asthma Immunol., 91(3): 233–240; quiz 41–42, 96. Jonassen, F., Granerus, G. & Wetterqvist, H. 1976. Histamine metabolism during the
menstrual cycle. Acta Obste.t Gynecol. Scand., 55(4): 297–304. Kalogeromitros, D., et al. 1995. Influence of the menstrual cycle on skin-prick test reactions
to histamine, morphine and allergen. Clin. Exp. Allergy, 25(5): 461–466. Lavon, O., Lurie, Y. & Bentur, Y. 2008. Scombroid fish poisoning in Israel, 2005-2007. Isr. Med.
Assoc. J., 10(11): 789–792. Lehane, L. & Olley, J. 2000. Histamine fish poisoning revisited. Int. J. Food Microbiol., 58 (1–
2): 1–37. Lerke, P.A., et al. 1978. Scombroid poisoning. Report of an outbreak. West. J. Med., 129(5):
381–386. Leuschner, R.G. & Hammes, W.P. 1999. Formation of biogenic amine in mayonnaise, herring
and tuna fish salad by lactobacilli. Int. J. Food Sci. Nut.r, 50(3): 159–164. Lyons, D.E., et al. 1983. Cadaverine and aminoguanidine potentiate the uptake of histamine
in vitro in perfused intestinal segments of rats. Toxicol. Appl. Pharmacol., 70(3): 445–58.
Maintz, L. & Novak, N. 2007. Histamine and histamine intolerance. Am. J. Clin. Nutr., 85(5):1185–1196.
Merson, M.H., et al. 1974. Scombroid fish poisoning. Outbreak traced to commercially canned tuna fish. JAMA, 228(10): 1268–1269.
Mongar, J.L. 1957. Effect of chain length of aliphatic amines on histamine potentiation and release. Br. J. Pharmacol. Chemother., 12(2): 140–148.
Morinaga, S., et al. 1997. Histamine poisoning after ingestion of spoiled raw tuna in a patient taking isoniazid. Intern. Med., 36(3): 198–200.
Morrow, J.D., et al. 1991. Evidence that histamine is the causative toxin of scombroid-fish poisoning. N. Engl. J. Med., 324(11): 716–720.
Motil, K. & Scrimshaw, N 1979. The role of exogenous histamine in scombroid poisoning. Toixcol. Lett., 3: 219–223.
Nuutinen, S. & Panula, P. 2010. Histamine in neurotransmission and brain diseases. Adv. Exp. Med. Biol., 709: 95–107.
Otani, N. & Ishimatsu, S. 2006. [Outbreak of anaphylaxis: a case of histamine (scombroid) mass poisoning]. Chudoku Kenkyu, 19(3): 227–234.
Owen, D.A., et al. 1980. Evaluation of the role of histamine H1- and H2-receptors in cutaneous inflammation in the guinea-pig produced by histamine and mast cell degranulation. Br. J. Pharmacol., 69(4): 615–623.
Paik Jung, H.Y. & Bjeldanes, L.F. 1979. Effects of cadaverine on histamine transport and metabolism in isolated gut sections of the guinea-pig. Food Cosmet. Toxicol., 17(6): 629–632.
111
Park, J.S., et al. 2010. Monitoring the contents of biogenic amines in fish and fish products consumed in Korea. Food Control, 21(9): 1219–1226.
Parrot, J.L. & Nicot, G. 1965. [The role of histamine in food poisoning by fish]. Aliment Vie, 53(4): 76–82.
Pons-Sanchez-Cascado, S., et al. 2005. Influence of the freshness grade of raw fish on the formation of volatile and biogenic amines during the manufacture and storage of vinegar-marinated anchovies. J. Agric. Food Chem., 53(22): 8586–8592.
Predy, G., et al. 2003. Was it something she ate? Case report and discussion of scombroid poisoning. CMAJ, 168(5): 587–588.
Prester, L. 2011. Biogenic amines in fish, fish products and shellfish: a review. Food Addit. Contam. Part A Chem. Anal. Control Expo. Risk Assess., 28(11): 1547–1560.
Ricci, G., et al. 2010. Tryptase serum level as a possible indicator of scombroid syndrome. Clin. Toxicol. (Phila.), 48(3): 203–206.
Rossi, S., et al. 2002. Biogenic amines formation in bigeye tuna steaks and whole skipjack tuna. J. Food Sci., 67(6): 2056–2060.
Russell, F.E. & Maretic, Z. 1986. Scombroid poisoning: mini-review with case histories. Toxicon, 24(10): 967–973.
Sanchez-Guerrero, I.M., Vidal, J.B. & Escudero, A.I. 1997. Scombroid fish poisoning: a potentially life-threatening allergic-like reaction. J. Allergy Clin. Immunol., 100(3): 433–434.
Shahid, M., et al. 2009. Histamine, histamine receptors, and their role in immunomodulation: an updated systematic review. Open Immunol. J., 2: 9–41.
Shalaby, A.R. 1996. Biogenic amines to food safety and human health. Food Res. Int., 29(7): 675–690.
Silla Santos, M.H. 1996. Biogenic amines: their importance in foods. Int. J. Food Microbiol., 29(2-3): 213–231.
Sjaastad, O. & Sjaastad, O.V. 1974. Catabolism of orally administered 14C-histamine in man. Acta Pharmacol. Toxicol. (Copenh.), 34(1): 33–45.
Smart, D.R. 1992. Scombroid poisoning. A report of seven cases involving the Western Australian salmon, Arripis truttaceus. Med. J .Aust., 157(11-12): 748–751.
Taylor, S.L. & Lieber, E.R. 1979. In vitro inhibition of rat intestinal histamine-metabolizing enzymes. Food Cosmet. Toxicol., 17(3), 237–240.
ten Brink, B., et al. 1990. Occurrence and formation of biologically active amines in foods. Int. J. Food Microbiol., 11(1): 73–84.
Toda, M., et al. 2009. [Histamine food poisonings in Japan and other countries]. Kokuritsu Iyakuhin Shokuhin Eisei Kenkyusho Hokoku, (127): 31–38.
Todd, E.C., et al. 1992. Scombroid poisoning – an outbreak in two Ontario communities. Can. Commun. Dis. Rep., 18(3), 17–19.
Tsai, Y.-H., et al. 2007. Histamine level and species identification of billfish meats implicated in two food-borne poisonings. Food Chem., 104(4), 1366–1371.
Tursi, A., et al. 2001. [Scombroid syndrome with severe and prolonged cardiovascular involvement]. Recenti Prog. Med., 92(9): 537–539.
Vasseur, B., et al. 1968. [Research on certain natural antihistaminic activities]. J. Physiol. (Paris), 60 Suppl 2: 380–381.
Visciano, P., et al. 2012. Biogenic amines in raw and processed seafood. Front. Microbiol., 3: 188.
Wantke, F., Gotz, M. & Jarisch, R. 1993. Histamine-free diet: treatment of choice for histamine-induced food intolerance and supporting treatment for chronic headaches. Clin. Exp. Allergy, 23(12): 982–985.
112
Weiss, S., Robb, G.P. & Ellis, L.B. 1932. The systemic effects of histamine in man. Intern. Med., 49: 360–96.
Wilson, B.J., Musto, R.J. & Ghali, W.A. 2012. A case of histamine fish poisoning in a young atopic woman. J. Gen. Intern. Med. 27(7): 878-881.
Woodward, D.F. & Ledgard, S.E. 1986. Histamine-induced microvascular permeability increases in hamster skin: a response predominantly mediated by H2-receptors. Agents Actions, 18(5-6): 504–507.