16
Joint Infrared & X-ray Investigation of LINER Galaxies Rachel Dudik, John McNulty & Mona Sanei
| Date post: | 14-Dec-2015 |
| Category: |
Documents |
| Upload: | derick-stear |
| View: | 216 times |
| Download: | 1 times |

Joint Infrared & X-ray Investigation of
LINER Galaxies
Rachel Dudik, John McNulty & Mona Sanei

Study of LINER galaxies in the far infrared
Mona Sanei

LINERsWhat are they?
Heckman, T.M. (1980) – optical spectroscopy
Low-Ionization Nuclear Emission-line Regions
Why are they important?
Very common – 30-50% of all galaxies are LINERs
No explanation the difference in location of LINERs

LINERs Continued …Questions
Are LINERs AGNs or …
Are LINERs stars in an unusual environment?Evolutionary Change!!!
Very few near by galaxies are standard AGNs (Seyferts)
If LINERs = Black hole = AGNs [ >50% of galaxies]
For AGNs to be so common could imply that They are an evolutionary phase in the
life of a galaxy
The following graphs: represent the far infrared study of liners
Normal Galaxy – Malhotra et al. (2001)ULIGs, SBs, and AGNs – Satyapal et al. (2002).
Goal: Do liners distinguish themselves from other galaxies in the far infrared.
There are 500 LINER galaxies;
69 have been observed by ISO

The far infrared wavelength range contains several fine structure emission lines.
The lines we find and their line ratios, allow us to probe the physical conditions of the galaxy and the underlying ionizing
radiation field.

-4.5 -4.0 -3.5 -3.0 -2.5 -2.0 -1.5 -1.00
5
10
15
20
Normal Galaxies
LINERs and Normal Galaxies
LINERs have lower [CII]/FIR ratios than normal galaxies.
Num
ber o
f Ga
laxi
es
log([CII]/FIR)
LINERs

-4.5 -4.0 -3.5 -3.0 -2.5 -2.0 -1.5 -1.0
0
2
4
6
8N
um
ber o
f Ga
laxi
es
log([CII]/FIR)
LINERs
Starbursts
AGNs
ULIGs
Histogram: Comparison with LINERs
0.0 0.5 1.0 1.5 2.0 2.5 3.00
2
4
6
8
10
12
14
16N
um
ber o
f Ga
laxi
es
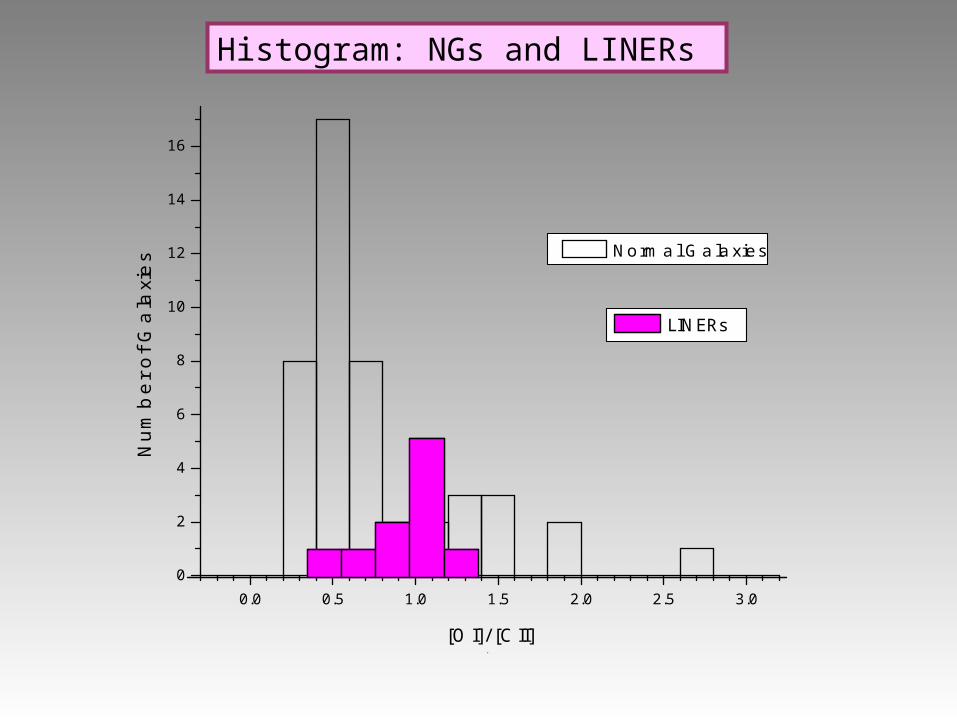
[OI]/[CII]
Normal Galaxies
.
LINERs
Histogram: NGs and LINERs
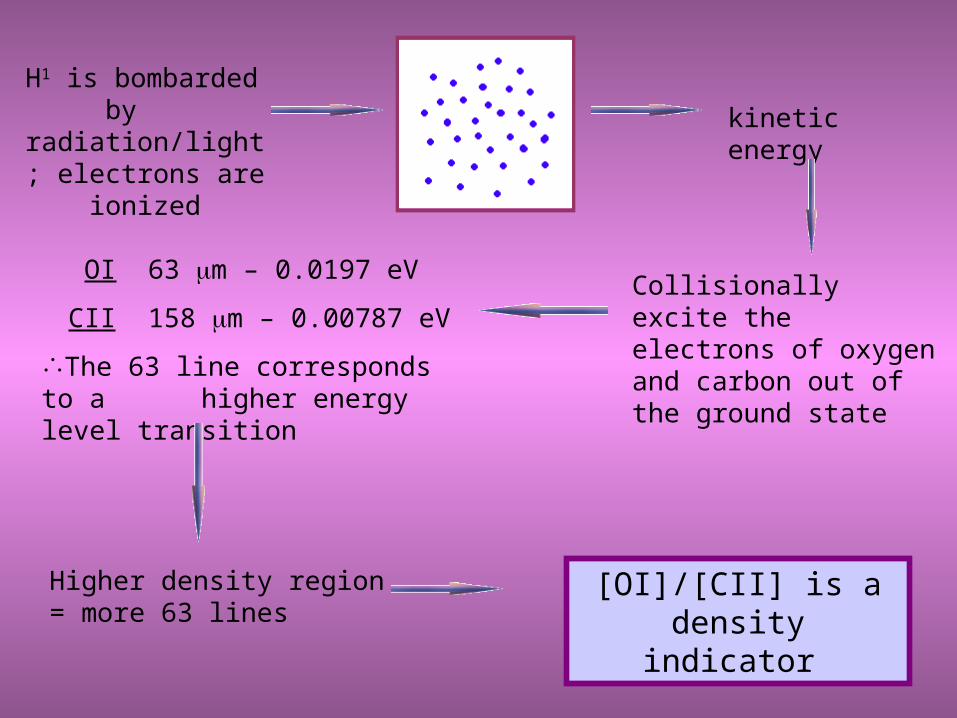
H1 is bombarded by radiation/light; electrons are ionized
kinetic energy
Collisionally excite the electrons of oxygen and carbon out of the ground state
OI 63 m – 0.0197 eV
CII 158 m – 0.00787 eV
The 63 line corresponds to a higher energy level transition
Higher density region = more 63 lines
[OI]/[CII] is a density indicator
0.0 0.5 1.0 1.5 2.0 2.5 3.0 3.5 4.0 4.5
0
1
2
3
4
5
Num
ber o
f Ga
laxi
es
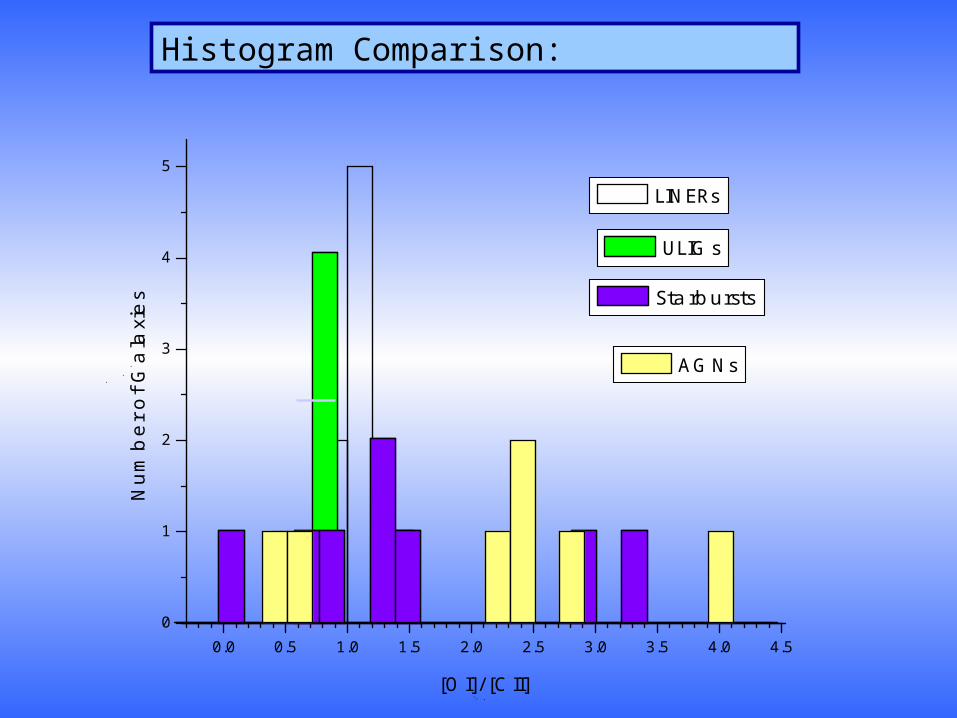
[OI]/[CII]
LINERs
.
.
ULIGs
.
.
Starbursts
.
.
AGNs
Histogram Comparison:

Plot One:Plot One:
-5.0
-4.5
-4.0
-3.5
-3.0
-2.5
-2.0
-1.5
-1.0
6 7 8 9 10 11 12
log(Lfir)
log
([C
II]/F
IR)
LINERs
No apparent trend

-0.600
-0.100
0.400
0.900
1.400
1.900
2.400
2.900
8.000 8.500 9.000 9.500 10.000 10.500 11.000 11.500
log(Lfir)
[OI]/[
CII]
y = 0.1252x - 0.2444
R2 = 0.1796
-0.600
-0.100
0.400
0.900
1.400
1.900
2.400
2.900
8.000 8.500 9.000 9.500 10.000 10.500 11.000 11.500
log(Lfir)
[OI]/[
CII]
Plot One:Plot One: Do you see a trend?!?

Liners have a weak [CII] emission compared to normal galaxies, starbursts, and standard AGNs. (They seem to resemble ULIGs)
Liners have higher [OI]/[CII] ratios than normal galaxies, this may imply denser gas. Further analysis is required.
Conclusions :

For the future:1. We will model the observed
infrared emission lines to infer the properties of the gas and possible AGNs in these galaxies.
2. More observations!? Space infrared telescope facility SIRTF (launched January 2003)

The mediocre teacher tells. The good teacher explains. The superior teacher demonstrates. The great teacher inspires.
William Arthur Ward


