37
Joint Strategic Needs Assessment 2015 New Forest District Council Hampshire Public Health Team
| Date post: | 30-Dec-2015 |
| Category: |
Documents |
| Upload: | carol-summers |
| View: | 215 times |
| Download: | 0 times |
Joint Strategic Needs Assessment 2015
New Forest District Council
Hampshire Public Health Team
Contents
• Demography – how is our population changing?
• Starting Well – the health and life chances of our children
• Staying Well – the health of our adult population
• Ageing Well – the health of our older population
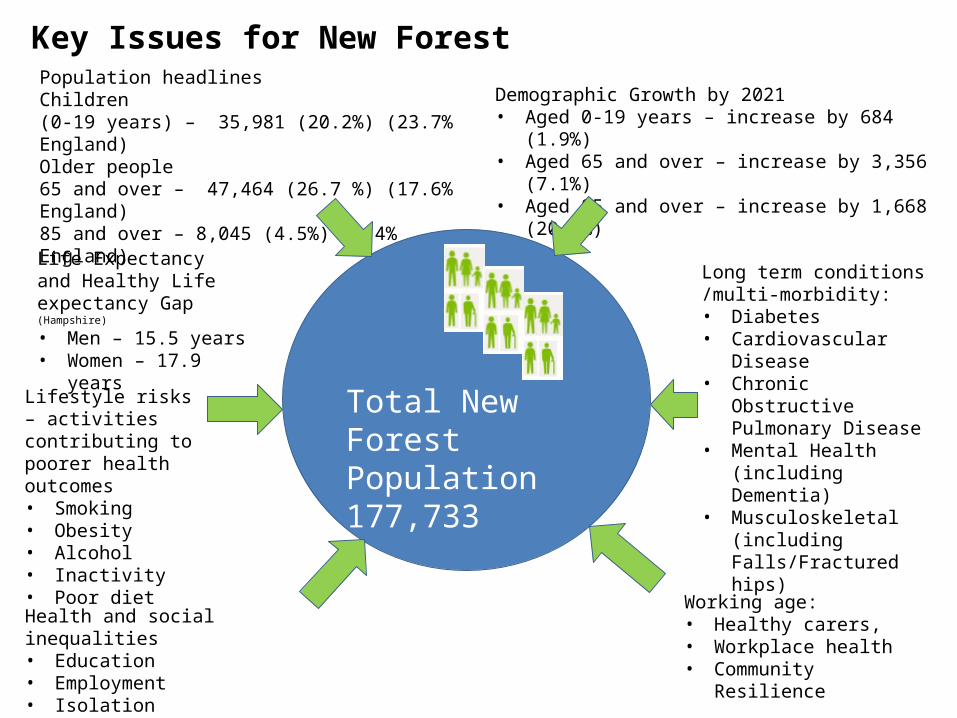
Population headlines Children (0-19 years) – 35,981 (20.2%) (23.7% England)Older people 65 and over – 47,464 (26.7 %) (17.6% England)85 and over – 8,045 (4.5%) (2.4% England)
Total New Forest Population177,733
Key Issues for New Forest
Long term conditions /multi-morbidity:• Diabetes • Cardiovascular Disease • Chronic Obstructive
Pulmonary Disease • Mental Health (including
Dementia)• Musculoskeletal
(including Falls/Fractured hips)
Lifestyle risks – activities contributing to poorer health outcomes• Smoking• Obesity • Alcohol• Inactivity• Poor diet
Demographic Growth by 2021 • Aged 0-19 years – increase by 684 (1.9%) • Aged 65 and over – increase by 3,356 (7.1%)• Aged 85 and over – increase by 1,668 (20.7%)
Working age: • Healthy carers,• Workplace health• Community Resilience
Health and social inequalities• Education• Employment• Isolation
Life Expectancy and Healthy Life expectancy Gap (Hampshire)
• Men – 15.5 years• Women – 17.9 years

Demography
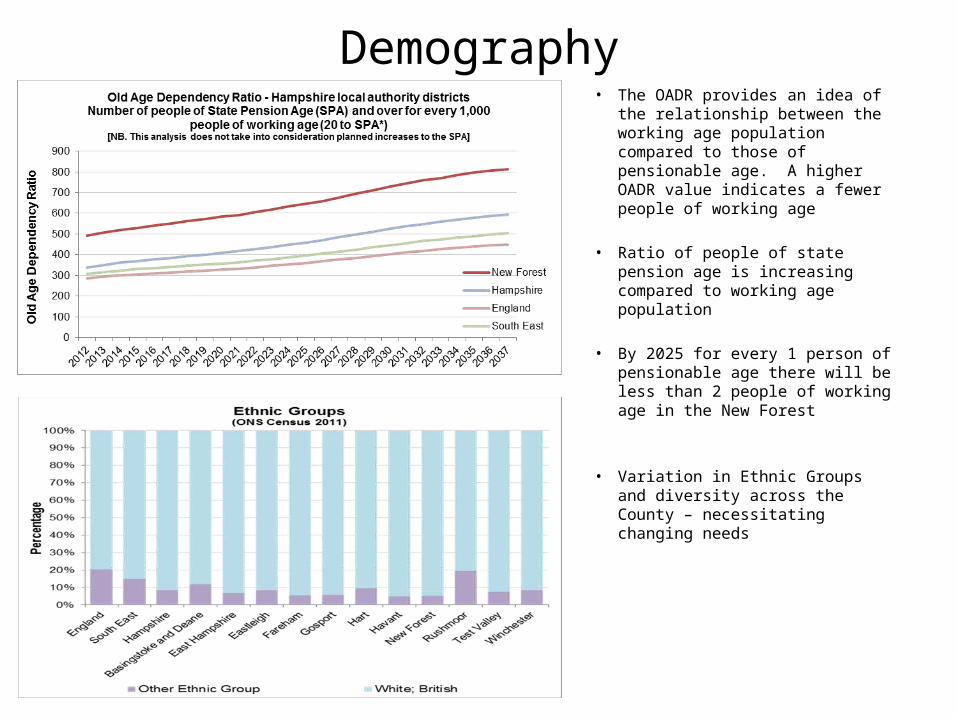
Demography• The OADR provides an idea of
the relationship between the working age population compared to those of pensionable age. A higher OADR value indicates a fewer people of working age
• Ratio of people of state pension age is increasing compared to working age population
• By 2025 for every 1 person of pensionable age there will be less than 2 people of working age in the New Forest
• Variation in Ethnic Groups and diversity across the County – necessitating changing needs

Demography
• Life expectancy has been increasing but is starting to plateau; healthy life expectancy is reducing

Demography
• Life expectancy for women; beginning to plateau and fall• Healthy life expectancy is decreasing

Inequality
• Gap in life expectancy due primarily to Circulatory disease, Cancer and Respiratory disease for both men and women,
• Mental and behavioural (including Dementia) causes of death are increasingly a cause of the gap in life expectancy
Scarf Chart showing the breakdown in life expectancy gap between most deprived and least deprived quintiles across the New Forest, by broad cause of death 2010-12
New ForestLife expectancy gap between most deprived and least deprived quintiles, by broad cause of death 2010-12
Starting Well
• A wide number of factors influence and determine good health
• No single definitive measure
• Infant and child mortality, and birth weight are good indicators of health now and in the future
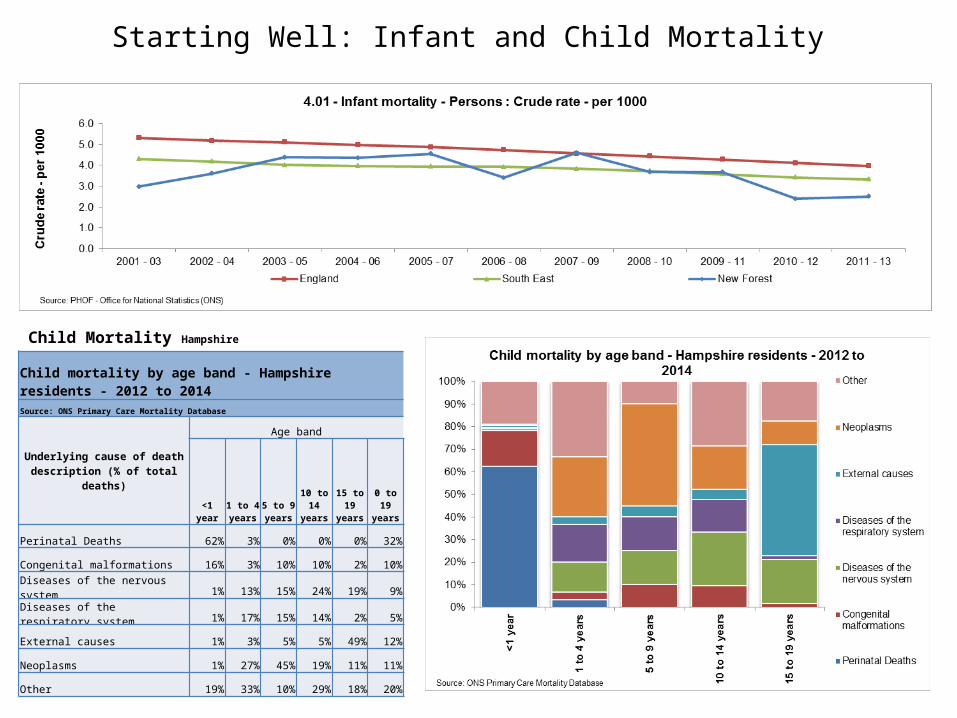
Starting Well: Infant and Child Mortality
Child Mortality Hampshire
Child mortality by age band - Hampshire residents - 2012 to 2014Source: ONS Primary Care Mortality Database
Underlying cause of death description (% of total deaths)
Age band
<1 year1 to 4 years
5 to 9 years
10 to 14
years
15 to 19
years0 to 19 years
Perinatal Deaths 62% 3% 0% 0% 0% 32%
Congenital malformations 16% 3% 10% 10% 2% 10%
Diseases of the nervous system 1% 13% 15% 24% 19% 9%
Diseases of the respiratory system 1% 17% 15% 14% 2% 5%
External causes 1% 3% 5% 5% 49% 12%
Neoplasms 1% 27% 45% 19% 11% 11%
Other 19% 33% 10% 29% 18% 20%
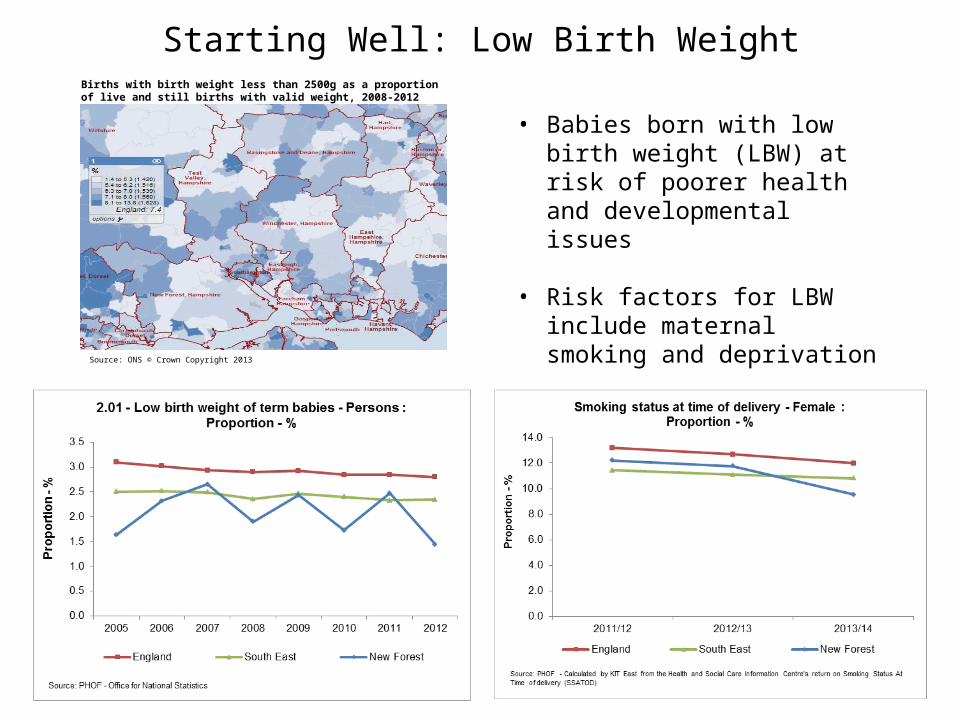
Starting Well: Low Birth Weight Births with birth weight less than 2500g as a proportion of live and still births with valid weight, 2008-2012
Source: ONS © Crown Copyright 2013
• Babies born with low birth weight (LBW) at risk of poorer health and developmental issues
• Risk factors for LBW include maternal smoking and deprivation
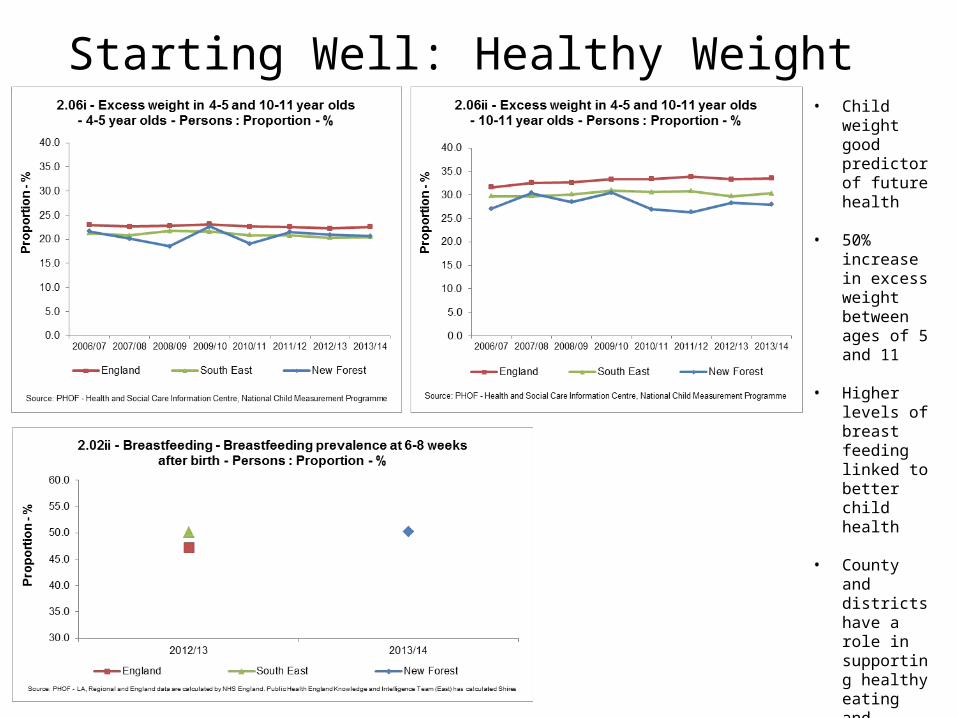
Starting Well: Healthy Weight• Child weight
good predictor of future health
• 50% increase in excess weight between ages of 5 and 11
• Higher levels of breast feeding linked to better child health
• County and districts have a role in supporting healthy eating and increased activity
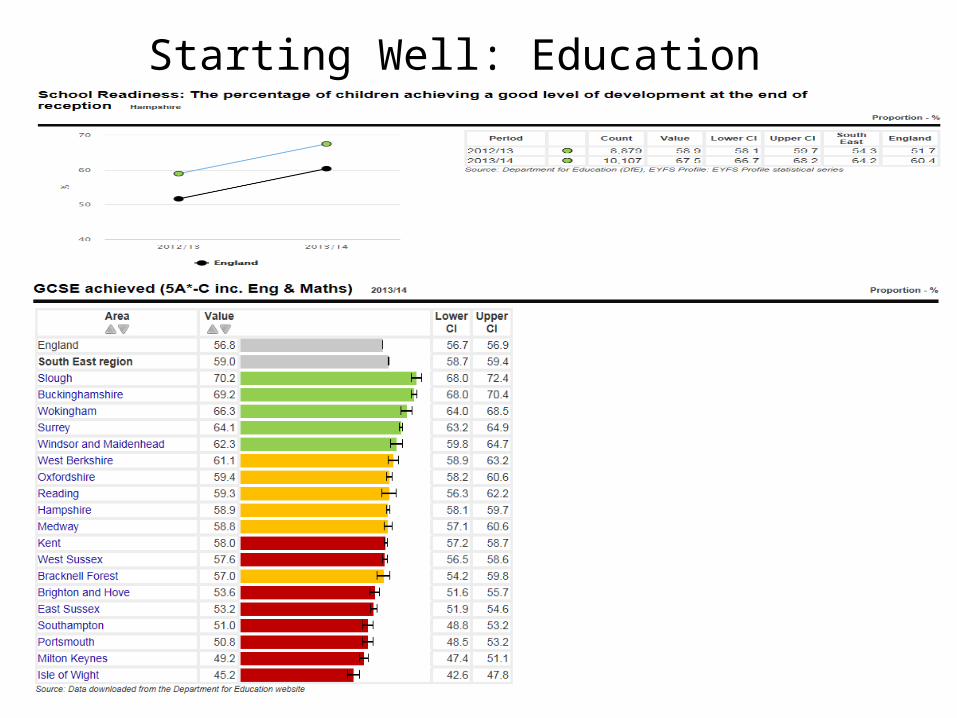
Starting Well: Education
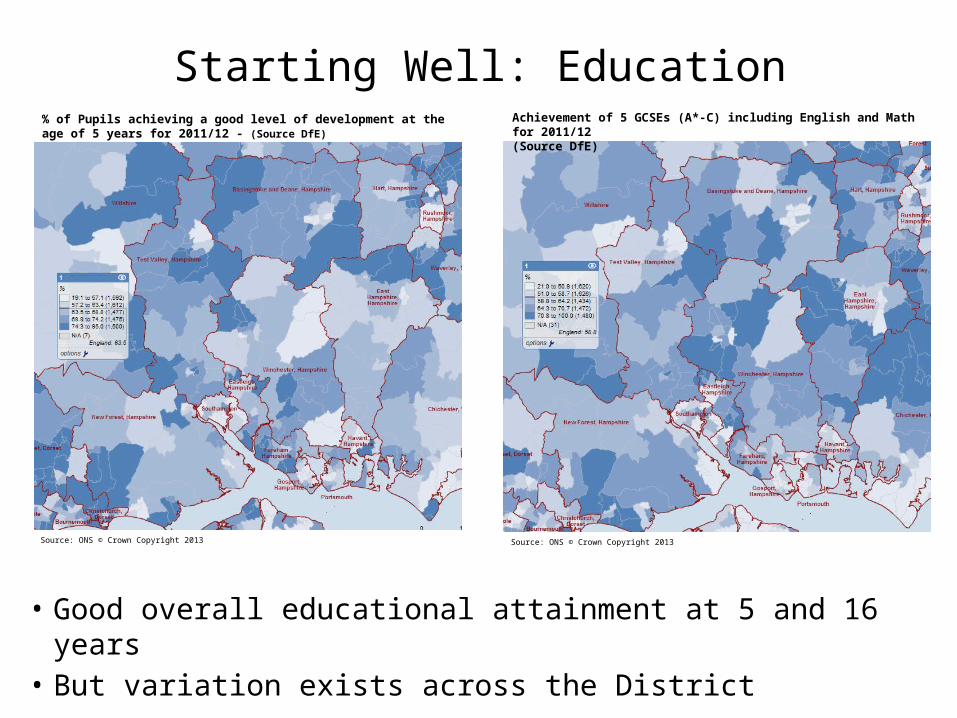
Starting Well: Education
• Good overall educational attainment at 5 and 16 years• But variation exists across the District
Achievement of 5 GCSEs (A*-C) including English and Math for 2011/12 (Source DfE)
Source: ONS © Crown Copyright 2013Source: ONS © Crown Copyright 2013
% of Pupils achieving a good level of development at the age of 5 years for 2011/12 - (Source DfE)
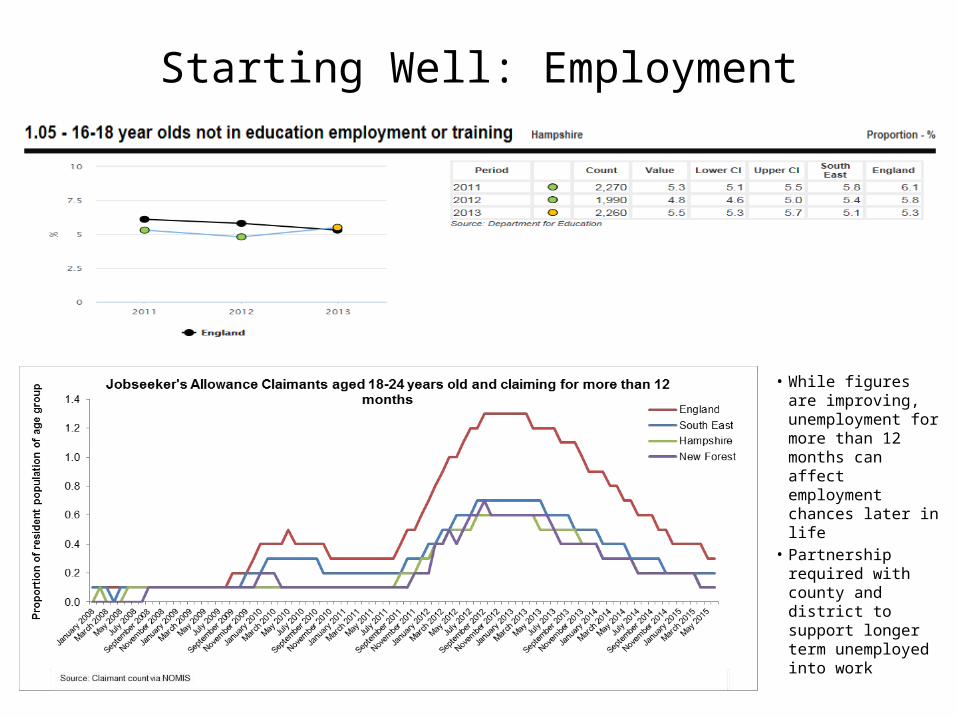
• While figures are improving, unemployment for more than 12 months can affect employment chances later in life
• Partnership required with county and district to support longer term unemployed into work
Starting Well: Employment

Starting Well: Injuries
• Need to understand better social and emotional factors affecting young people that impact on these
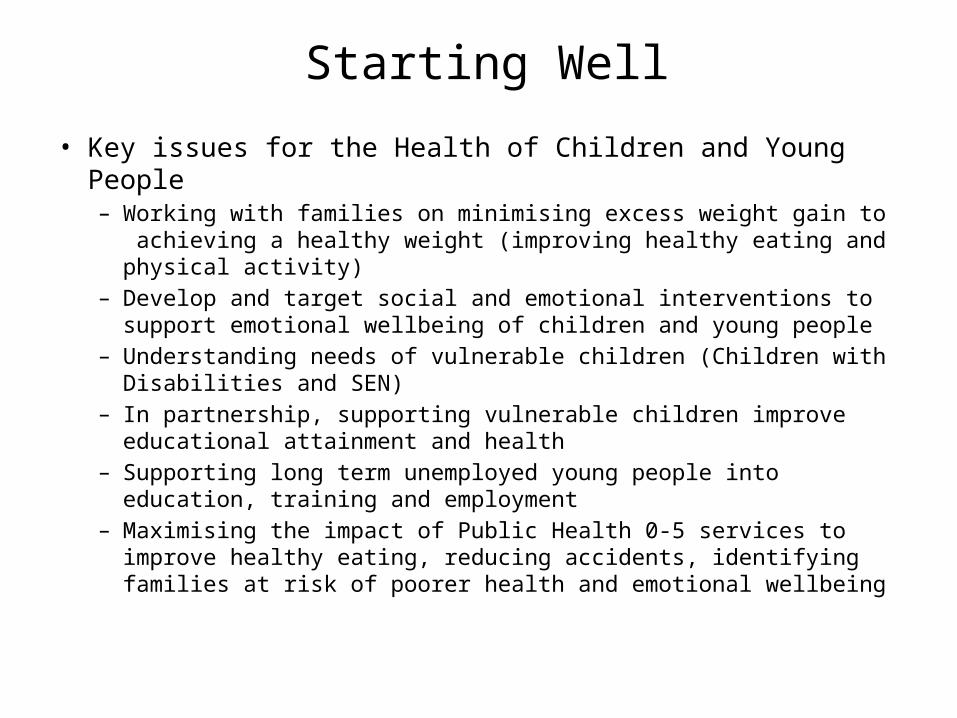
Starting Well
• Key issues for the Health of Children and Young People – Working with families on minimising excess weight gain to
achieving a healthy weight (improving healthy eating and physical activity)
– Develop and target social and emotional interventions to support emotional wellbeing of children and young people
– Understanding needs of vulnerable children (Children with Disabilities and SEN)
– In partnership, supporting vulnerable children improve educational attainment and health
– Supporting long term unemployed young people into education, training and employment
– Maximising the impact of Public Health 0-5 services to improve healthy eating, reducing accidents, identifying families at risk of poorer health and emotional wellbeing
Staying Well
• Prevalence of factors or conditions that cause premature mortality or illness indicate how healthy our population is
• For adults – the main causes of premature death are Cancer, Heart disease
and respiratory disease. – Certain illnesses (e.g. mental health and diabetes) not only
cause morbidity but can also cause significant disability impacting on employment and future wellbeing
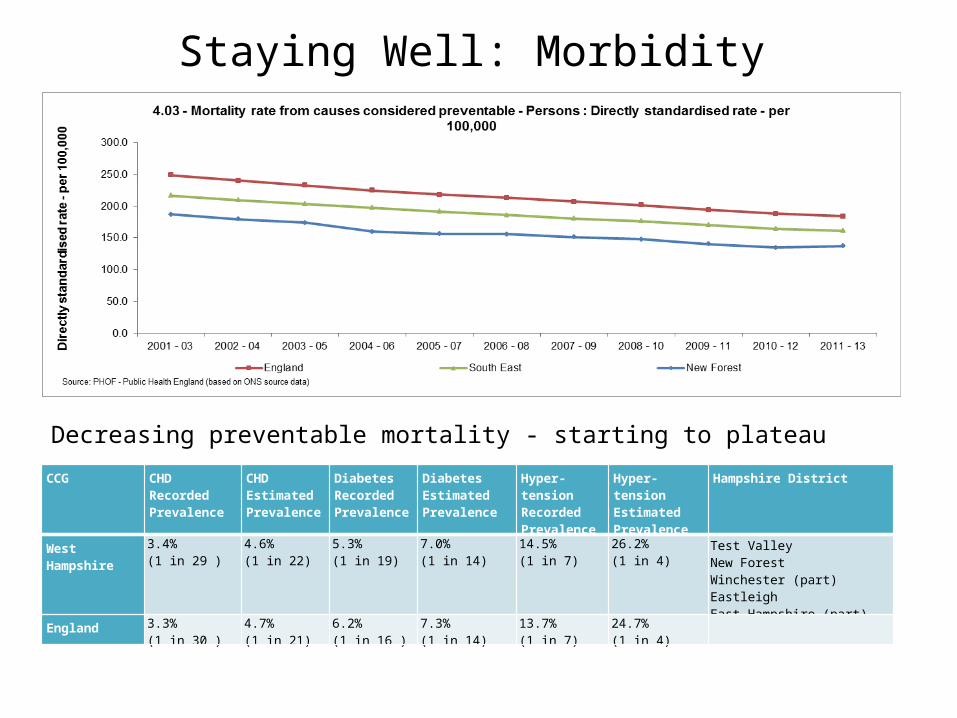
Staying Well: Morbidity
Decreasing preventable mortality - starting to plateau
CCG CHD Recorded Prevalence
CHD Estimated Prevalence
Diabetes Recorded Prevalence
Diabetes Estimated Prevalence
Hyper-tension Recorded Prevalence
Hyper-tension Estimated Prevalence
Hampshire District
West Hampshire
3.4%(1 in 29 )
4.6%(1 in 22)
5.3%(1 in 19)
7.0%(1 in 14)
14.5%(1 in 7)
26.2%(1 in 4)
Test ValleyNew ForestWinchester (part)EastleighEast Hampshire (part)
England 3.3%(1 in 30 )
4.7%(1 in 21)
6.2%(1 in 16 )
7.3%(1 in 14)
13.7%(1 in 7)
24.7%(1 in 4)
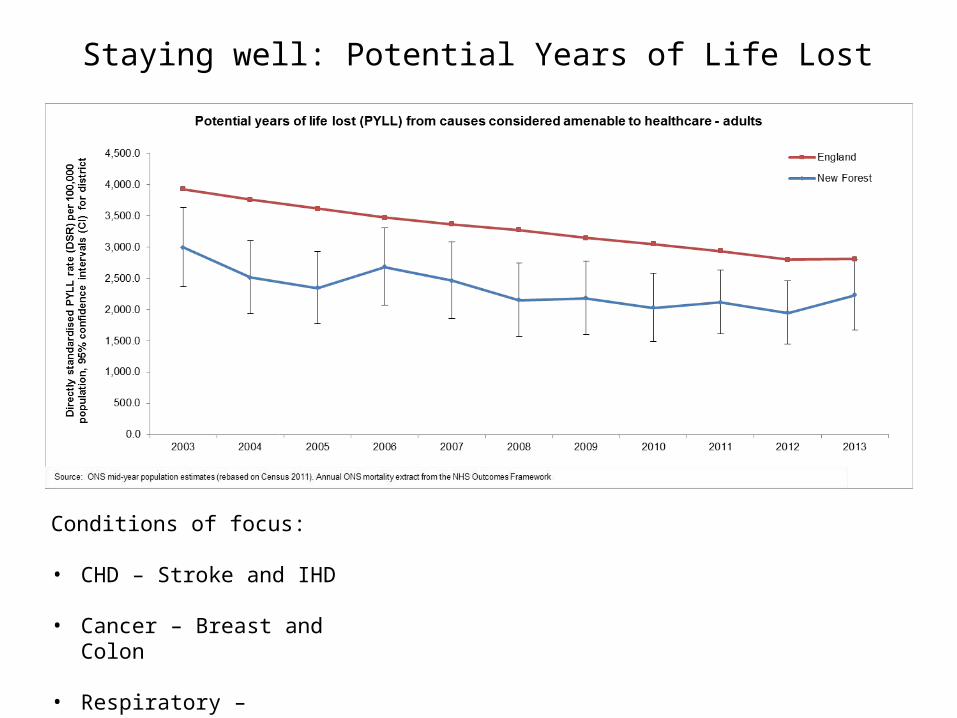
Staying well: Potential Years of Life Lost
Conditions of focus:
• CHD – Stroke and IHD
• Cancer – Breast and Colon
• Respiratory – Pneumonia
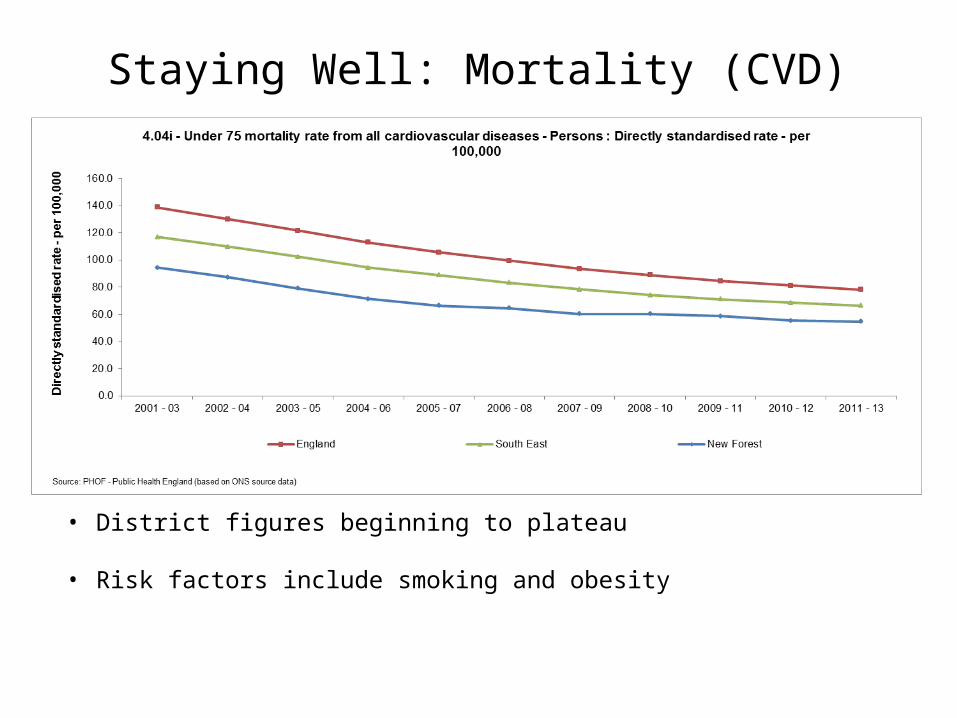
Staying Well: Mortality (CVD)
• District figures beginning to plateau
• Risk factors include smoking and obesity

Staying Well: Mortality (Cancer)
• Significant difference between men and women• The general fall in mortality rates is plateauing for men and there has been an
increase for women since 2008/10
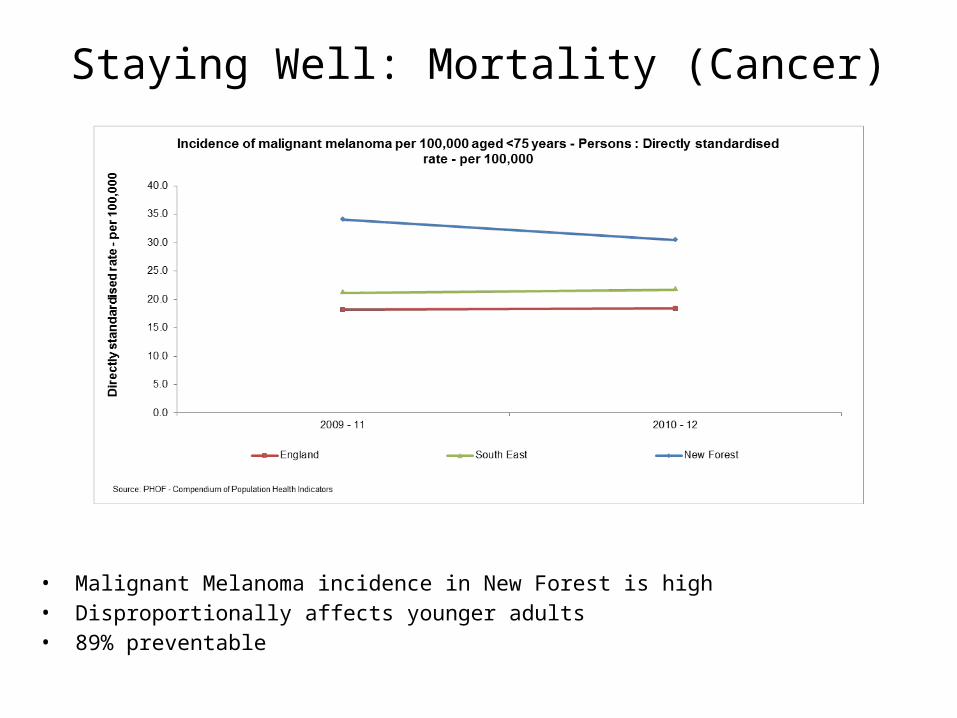
Staying Well: Mortality (Cancer)
• Malignant Melanoma incidence in New Forest is high• Disproportionally affects younger adults • 89% preventable
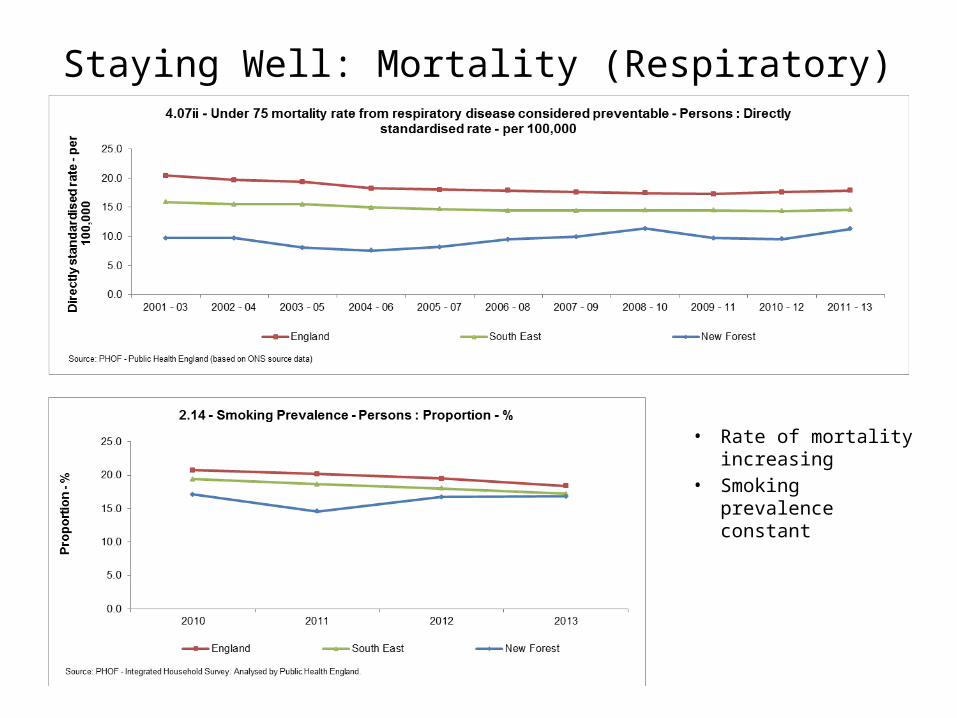
Staying Well: Mortality (Respiratory)
• Rate of mortality increasing
• Smoking prevalence constant
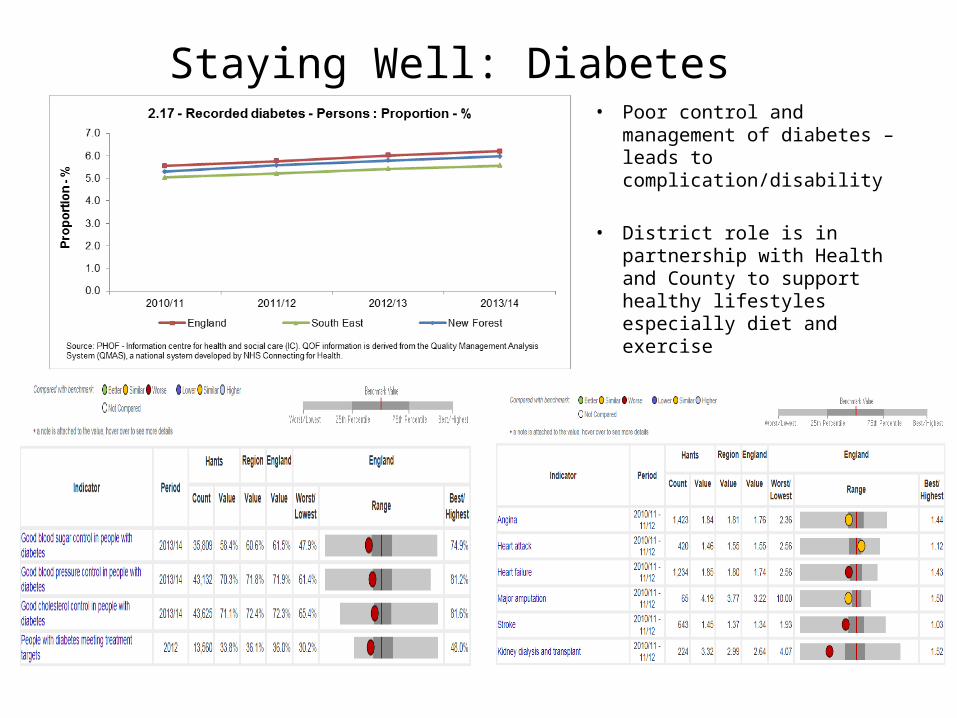
Staying Well: Diabetes• Poor control and
management of diabetes – leads to complication/disability
• District role is in partnership with Health and County to support healthy lifestyles especially diet and exercise
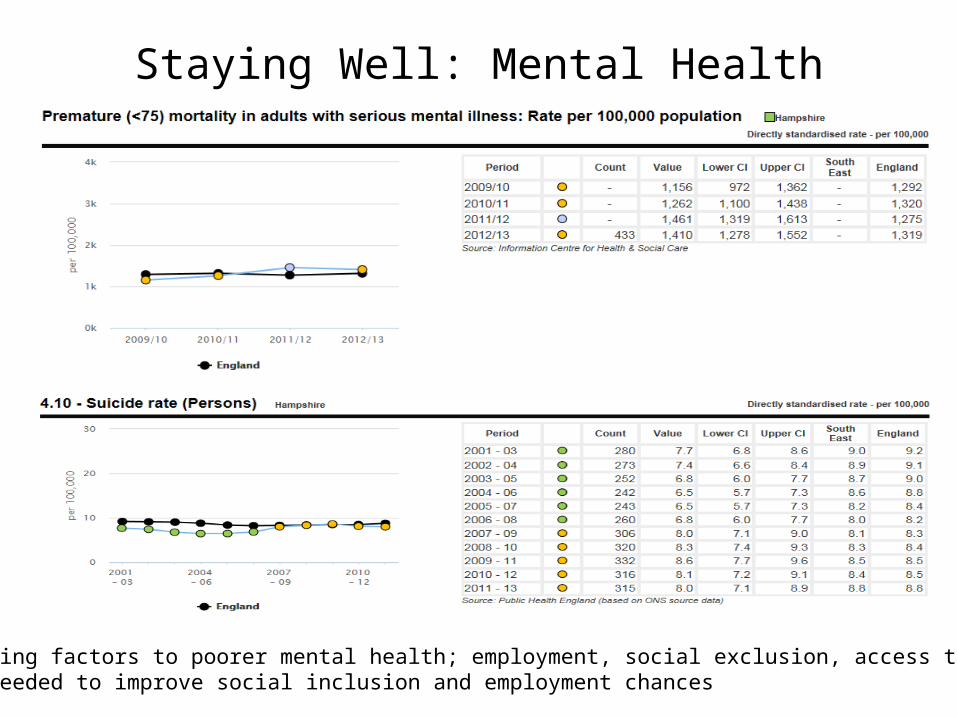
Staying Well: Mental Health
• Contributing factors to poorer mental health; employment, social exclusion, access to services • Support needed to improve social inclusion and employment chances
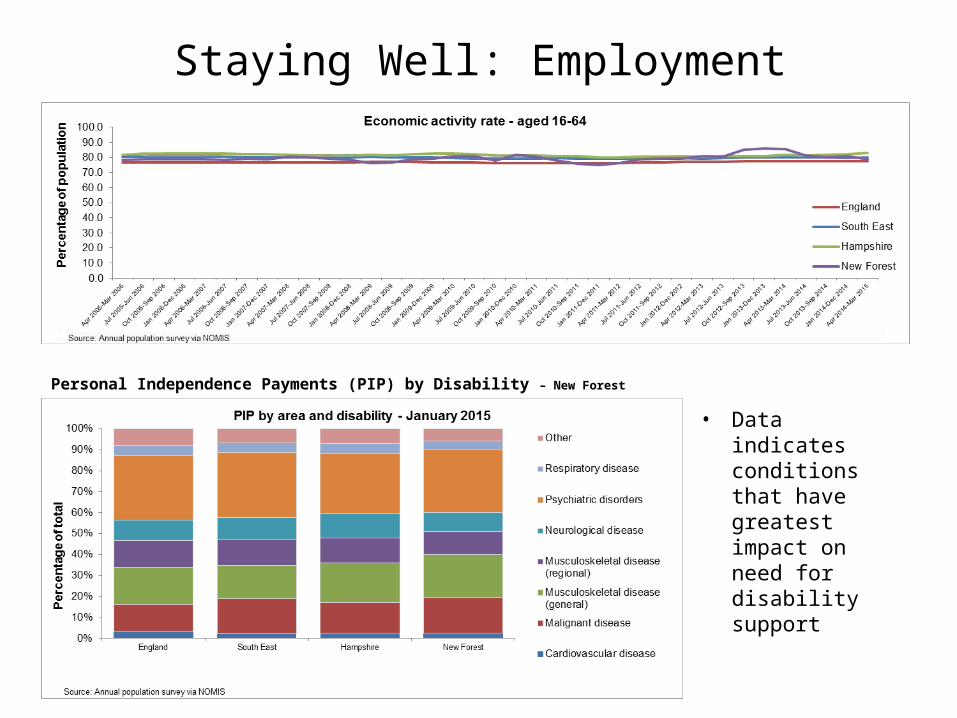
Staying Well: Employment
• Data indicates conditions that have greatest impact on need for disability support
Personal Independence Payments (PIP) by Disability – New Forest

Staying Well: Employment
• A good measure of independence is the number of people with disabilities who are in employment• Partnership between County and Districts needed to support more people with disabilities into
employment

Staying Well
• Proportion of working aged population is reducing; pressure on services and caring
• Reducing healthy life expectancy; focus on improving lifestyles and self management of health conditions, particularly diabetes
• Reducing Cancer mortality; improving early diagnosis and screening uptake;
• Higher levels of preventable mortality for SMI; improving access to services and social inclusion and employment chances
• Understanding impact of health conditions on disability (Mental health, cancer, neurological conditions, MSK)
Ageing Well• Life expectancy at 65 and disability-free life expectancy at 65 give
us a measure of the health of our older population
• Falls and fractures in older people can lead to loss of independence and death – preventing falls has a major impact on health and wellbeing
• Social isolation and loneliness impact on health and wellbeing particularly for conditions such as dementia – reducing isolation can improve outcomes for all ages but particularly our older population
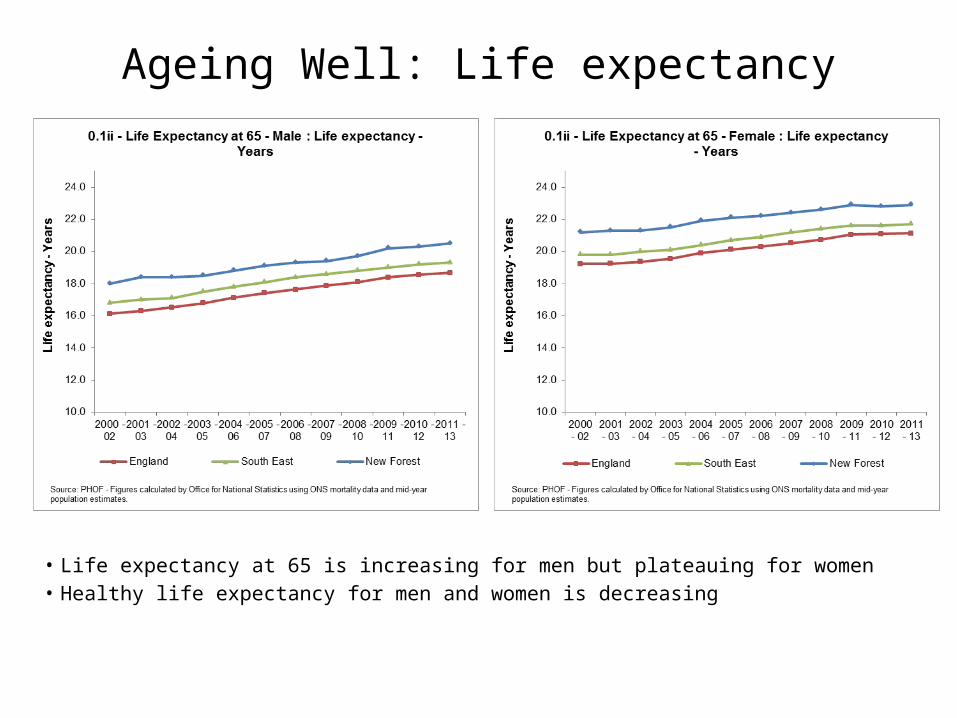
Ageing Well: Life expectancy
• Life expectancy at 65 is increasing for men but plateauing for women• Healthy life expectancy for men and women is decreasing
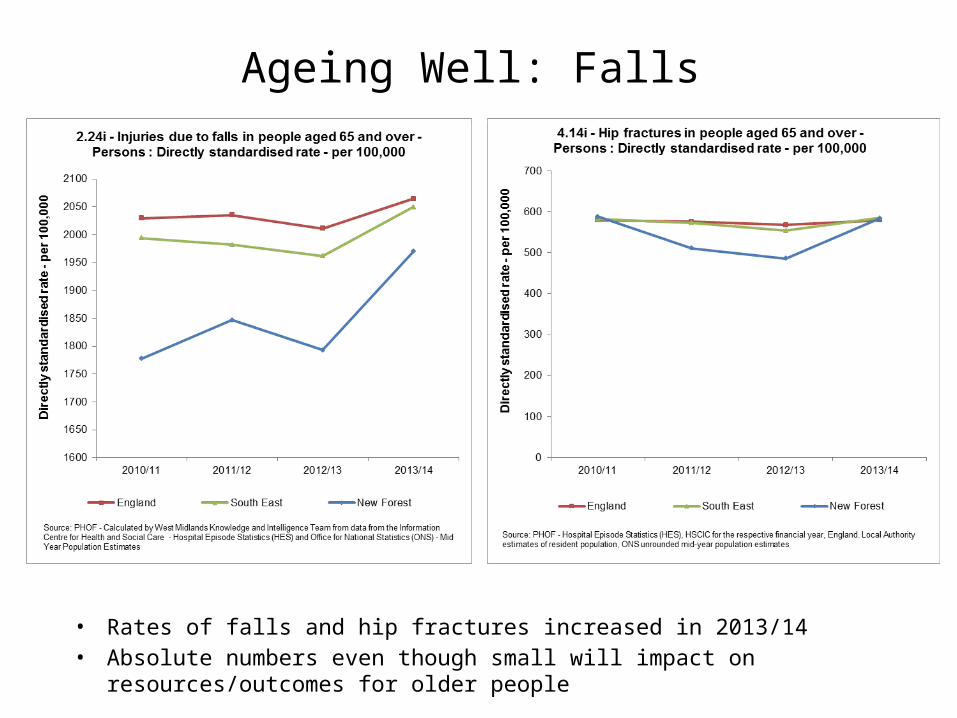
• Rates of falls and hip fractures increased in 2013/14• Absolute numbers even though small will impact on resources/outcomes for
older people
Ageing Well: Falls
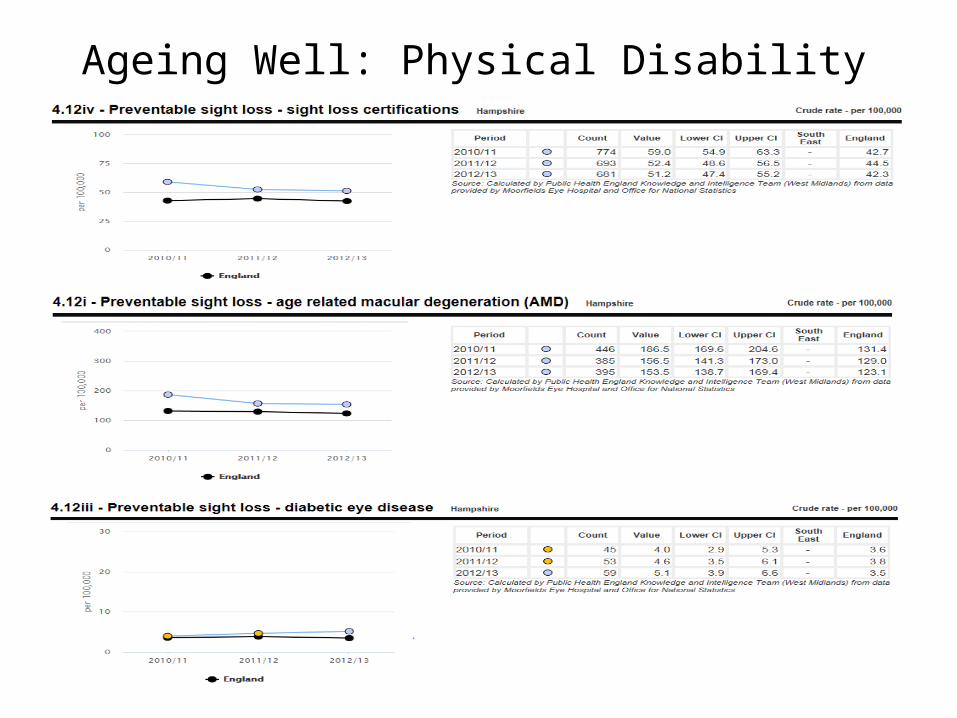
Ageing Well: Physical Disability

• The UK has one of the highest Excess Winter Death (EWD) rates in Europe• In 2013/14, 78% of EWD in people over 75 years• Fuel poverty and keeping warm, major factor in increasing susceptibility• Link to social isolation and fuel poverty – identification of individuals at risk is
key issue
Ageing Well: Excess Winter Deaths
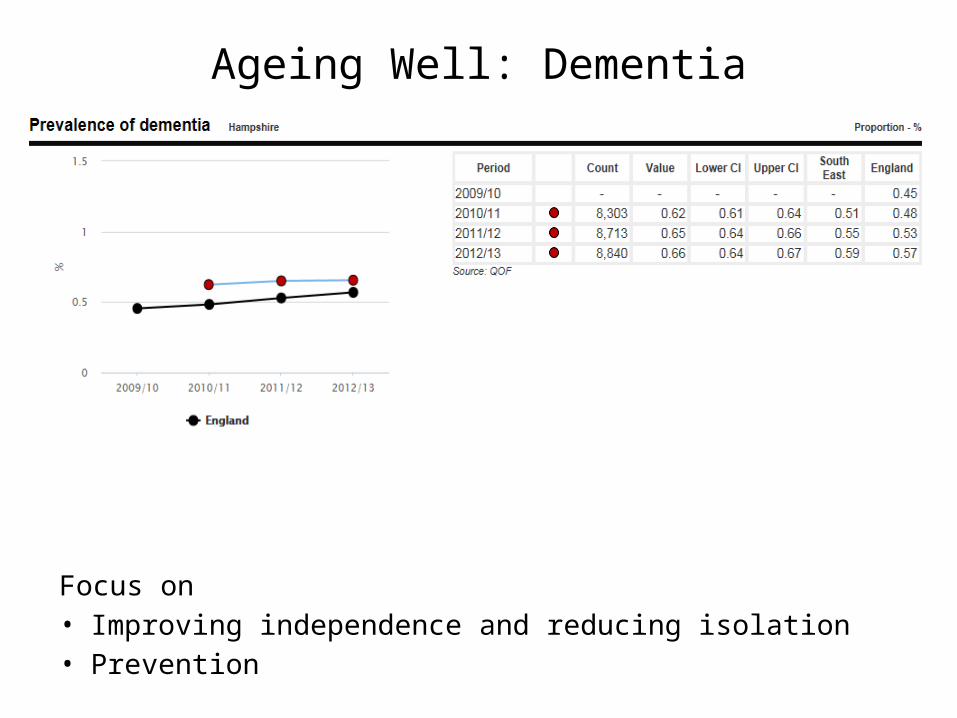
Ageing Well: Dementia
Focus on • Improving independence and reducing isolation • Prevention

Ageing Well: Isolation% of Pensioners who live alone 2011 Census
Source: ONS © Crown Copyright 2013
% of people over 60 living in pension credit households (IDAOP 2010 DCLG)
Source: ONS © Crown Copyright 2013
• Need to understand scale of the problem and what data sources can help
• Partnership approach needed to develop interventions to reduce impact of isolation
• Strategic use of voluntary sector to support

Ageing Well
• Focus on falls prevention; Return on Investment for evidence-based exercise classes, improving independence (opportunity for joint commissioning)
• Focus on preventable disabilities; blindness (AMD/Reducing Smoking, Diabetic Retinopathy/Screening)
• Focus on impact of social isolation; partnership working on initiatives to reduce impact


