25
Joint Strike Fighter - Lightning II Monthly Assessment Report Prepared for the Joint Strike Fighter Program Office Prepared by DCMA Lockheed Martin Fort Worth February 2009
Joint Strike Fighter - Lightning II Monthly Assessment Report
Prepared for the Joint Strike Fighter Program Office Prepared by DCMA Lockheed Martin Fort Worth
February 2009
Table of Contents Program Summary 3 Report Scope 5 Maintain LRIP Aircraft Delivery Rate 6 Improve Supplier Delivery Rate 8 Improve Supplier Quality Rate 9 Maintain Cost and Schedule 10 Reduce Schedule Variation 13 Non-Conformance Reduction 19 Safety of Flight (SoF) 20 Improve Software Productivity 20 Improve Minor Variance 22 Improve FCAIPCA 23 Improve Minor Change 23 Maintain Assist Audit Request Timing 24 Maintain FAR Requests for Contract Closeout 24 Reduce Cancelling Funds 25 Earned Value 25 Appendix A - EV Assessment Criteria 25
For Official Use Only - Proprietary Program Data Page 2 of25
Program Summary Flight Test (as of 17 Feb 09) AA-l flight test is projected by LM Aero to commence no earlier than the last week in February 2009 BF-l CTOL engine runs and BF-2 first flight are expected to occur within the last week of February BF-4 rolled to the Fuel Barn on 21 Jan 09 (MS 61 baseline was 21 Oct 08) AF-l rollout occurred on 5 Feb 09 (MS 61 baseline was 25 Nov 08)
Seat Sequencer Assembly L RU Update flight certification pending investigation of the f_ilurest he ejection and the Sequencer Assembly b su lier has been ab Ie to du ring hi gh shock te sts and~oduce a lrmware fix to resolve the resulting sy stem da ta b us faults Preliminary testmg at __has been successfully completed and steps are being taken to retrofit the modified sequence~_semRU into JSF a ircraft up on final a pproval by t he JSFPO Root cau Se is still unknown investigation will continue Firmware fix is currently not endorsed for Flight by JSFPO an emonstratlOn of the fix through live fire tests at Holloman AFB (6 on 18 Feb 7 on 4 Mar and 8 on 18 Mar) required prior to implementation I n t he interim L M Aero has issued an Air Vehicle System Release Mem 0 only for existing standard Sequencer Assembly L RU version 70 and Ejection Seat version -25 in order to continue BF-l and BF-2 flight testing under restricted conditions Note __does not have a contractual schedule of requirements with and is informally workin~ delivery
i Center Fuselage
Structure Mate
Final AssemblySub-SystemsSystems TestLabs Field OpsITF
F-135 Engine On 30 Jan 09 the Fl35 STOVL Powered Lift Statement of Qualification (SOQ) letter was by the JSFPO certifying the F 135 STOVL propulsion system for powered lift FTE-6 has arrived at LM Aero for in into BF-] this month LRIP 2 Basis of Estimates
DCMA L MFW is in the pro cess of reviewing t he 2000 -21 Single Process Initiative (SPI) for InterchagabilityReplacability in respect to SDD and LRIP LM Aeros Basis of Proposal includes Single Process Initiatives for existing c ontracts (eg S PI 2000 -21 authorization da te was 11 A pr 0 I) This requirement does not appear to be incorporated into LM Aeros planning
DCMA EV Center visit The majority of the milestones have been completed except for the development of a compliant scheduling process and the ability to adequately support a data call from the DCMA E V Center for the next Compliance Review Data traces were conducted on Integrated Network Scheduling System (lNSS) in February during a DCMA EV Center visit and LM Aero could not demonstrate that all various parts that make up the INSS are interconnected
For Official Use Only - Proprietary Program Data Page 3 of25
Additionally during the DCMA EV center visit four CAMs were interviewed and all had data integrity issues on their accounts This supported the conclusion that LM Aero was not ready for another DCMA EV Center Compliance Review in the spring of 2009 LM Aero submitted a written request to move the compliance audit to July 2009 which allows them to clean up the data on programs and make the needed corrections to their scheduling processes In response to LM Aero not meeting the two milestones _withhold was applied to the SOD contract
LM Aero has officially notified the Government (16 Feb 09) that it expects to exceed 75 percent of the total amount allotted to the contract and current funding provided per will allow performance through 8 Mar 09 The contractor has estimated an is needed to fully fund the contract through 2013 Furthermore an OTBOTS through October 2014 This total is close to LM Aeros EAC
LM A ero Production 0 perations Cost and schedule pe rformance trends ha ve be gun t 0 s how slight improvement from the downward trend it has been on since the incorporation of the program replan in July 2008 Recovery plans that have been implemented over the last several months in an attempt to get the pr ogram ba ck on track toM S 61 ha ve be gun to ha ve ani mpact Favorable cost and schedule variance trends in the Forward Wing AftEmpennage and Mate build operations have contributed to this overall slight improvement
DCMA LM Fort Worth continues to observe the amount of out-of-station tasks traveling to Mate and the Flight Line The Wing has gradually reduced their out-of-station tasks traveled to Mate but is expected to overlap beyond LRIP II This reduction is beginning to have an affect on Mate since Mate has recently sent (STOVL) BF-4 to the fuel barn with onl y s lightly more out-of-station tasks (34 variance to its planned schedule) than BF-2 (29)
_ DCMA_predicts additional SOD cost growth of$300 Million above_ EAC reported in Teran 09 S D~st Performance Report (CPR) _ EAC still exclud~uture Major B changes and other likely costs required to complete S~s a given that the EAC will continue to increase with 112 Major B changes and - 40 Baseline Change Requests (BL~ in process Schedule performance remains under pressure and LM Aero approved a one-month extension for delivery for BF-5 and AF-4 to 9 M arch and 27 April respectively Workaround plans to mitigate part shortages are onshygoing Advanced Composite Center (ACC) manufacturing slipped slightly to recovery plan
_ Delivery pe rformance commitment cont inues to be rated Red because t he con tractor is not meetmg t he contractual schedule MS61 I nclusive of January month e nd planned shipments A ft Fuselage is 44 calendar days behind schedule HT is 50 days late and VT is 46 days late _ has implemented a recovery plan identified as the SOP7 Issue 3 but still not meeting these plan sta~ship dates based on a comparison of the events planned and accomplished during this rating period
For Official Use Only - Proprietary Program Data Page 4 0(25
Report Scope The Joint Strike Fighter - Lighting I I Monthly A ssessment Report (MAR) is focused on reporting the status of Customer Outcomes and associated Performance Commitments identified in the Memorandum of Agreement with the JSF Program Office Interdisciplinary teaming between DCMA personnel is used to ensure customer outcomes are ascertained risks to outcomes are identified and assessed
Maintain FAR Requests Contract Closeout
are
of canceling funds will be billed andor de-obligated before the end of the fiscal
Yellow 90 up to but not including 95
parts meeting design requirements is i
to S95
Green Yellow 80-89 Red lt80
Y
G
Y
G
G
G
G
G
G
G
G
G
Improve Productivity
Improve Minor Variance
aligned in support of funding and budget allocations IEAC data and projections match actual perfonnance within + - 1 0 of contractors budget
= Block 10 OPC ~83 Yellow = Block 10 OPC at least 73 but less then 83 Red = Block 10 OPC lt73
Green classified minor variances is ~95
variances
For Official Use Only - Proprietary Program Data Page 5 of25
Maintain LRIP Aircraft Delivery Rate PC - NSF198AJ17 Description Maintain LRIP aircraft delivery to within 10 M-days of contract delivery date The Maintain LRIP Delivery Rate is an Integrated Master Schedule (IMS) based metric of the monthly average (+1-) float manufacturing days (M-days) of all reported LRIP aircraft to their contract delivery schedule (00-250) Goal is to maintain delivery of LRIP aircraft to within 10 Mshydays of contract delivery date Note Float M-days are entered u positive values but represent behind schedule status
Monthly IMS LRIP CORL data is directly used as data source Data shall be updated NLT the 20th of each month Total Float of all reported aircraft in flow will be averaged monthly for metric Green 510 M-day variance to delivery date Yellow 11 - 21 M-day
variance Red gt21 M-day variance to contract delivery date
YS-AlH DCMA LMFW F-35 NSF198Al17 Maintain LRlP Acft Delivery
~ ~ ~ ~ ~ ~ ~ ~ ~ ~ ~ ~ FY09
bull ArhJlJ bull Targelt Target rang~
Metric Status Red
Trend Improving
Summary of Metric Status Metric is -25 Mdays (-12 months) for month end December This months metric is an average of the following aircraft as reported per the CDRL A F-6 (-10) AF-7 (0) AF-8 (shy40) AF-9 (-42) and AF-IO (-32) = 248 M-days
Root Causes The behind schedule un load ofB F-5 from the EMAS station is the AF-6 top dr iver (expected mitigation by January) Past due LRIP 1 items for month end December - mainly in Forward Fuselage and Wing Build are driven mainly by late part deliveries LM Aero projects these past due items will not have an impact on the Program due to recovery plan efforts
Contractor Actions A recovery plan to MS 61 has been developed and briefed to JPODCMA by LM Aero the week of 12 Jan 09 The recovery plan was incorporated into the LRIP 1 IMS files (LRIP 2 incorporation projected i n January 2009) dur ing t he month of December - leading t 0 am ajor improvement in the critical paths A F-6 improved to 10 M-days late opposed to 55 M -days late while AF-7 improved to 0 M-days late opposed to 55 M-days late at the end of November LM Aero estimates that recovery to the following Mate events per MS 6 I will occur as follows Aft AF-ll (Sep 09) Center - BF-6 (Nov 09) and Wing - AF -9 (Jul 09)
Key LM Aero initiatives such as crew size adjustments overtime compression as well as factory build teams working concurrently with flightIine teams a re a fundamental pa rt of the recovery pI an T he limitation of this plan appears to be reliance on parts availability and the ability for major components to load to the projected Mate plan based on EMAS availability Past performance indicates that these plans have been exceedingly optimistic and challenging to execute
In accordance with CDRL A005 (IMS) the January 2009 Schedule Risk Assessment for LRIP 1 indicates the following
For Official Use Only Proprietary Program Data Page 6 of25
Major Risk Areas shybull Timely availability of tooling (SOD units completing on time) bull Late part deliveries to various SWBSs continue to be a concern bull Late SW delivery affecting the SiW build for trainers bull Delays in negotiation with some suppliers may drive Site Activation out
The January assessment also indicated a 50 probability of AF-6 being 19 M-Days late to contract 00shy250 date (31 Jan 10) and AF-7 being 3 M-Days late (28 Feb 10)
DCMA Actions DCM~ reports that_ submitted a new recovery plan SOP 7_ is currently projecting re~reen of the muselage by 2BF-9 (LRIP 2) i n Jan~ the Horizontal Tail by the end of LRIP 2 and the Vertical Tail return in early LRIP 3 DCM~ _ is continues to monitor recovery to MS 61
DCMA that schedule risk is high due to compressed cycle times (-3 wks) and late parts history is currently working to SOP Rev G (Rev F reported last month) _production dates have m the right again slightly since last report and still exceed MS 6 l~ock dates to LM Aero _ management anticipates a contract update to MS 61 for the incorporation of the P5 upgrade for L tmTa nd 2 _ ant icipates pa rts availability for L RIP 3 will b e worse than currently experiencing with SDD~IP 1 Schedule is being stressed due to LM Aero LRIP 3 budget release for long-lead parts procurement
DCMA PSI PA Production and PA 0amp1 Team members are developing performance commitment subshymetrics to assess key build event progress on LRIP aircraft These metrics will utilize data from the IMS and various shop floor systems 0 CMA continues to work with LM Aero QampMS and the new DCMA POC for Joint Process Reviews (JPR) in the coordination of JSF specific LM AeroiDCMA JPRs for 2009 as part of our strategy to influence LRIP aircraft deliveries
Estimate when PC will achieve goal TBD - Part deliveries to various S WBSs continue to impact build activities
This table includes the total SCOPs planned for LRIP 1 aircraft the number of SCOPs completed as of the reporting period the percentage of SCOPs completed relating to the total planned for the specific test article and the percentage of testing completed prior to test article rollout from the factory to the flight line (Rollout)
SCOP testing starts at the trailing end 0- The current IMS baseline finish dates are 19 Jan 09 and 9 Feb 09 for AF-6 and AF-7 respec~this reporting period formal SCOP planning as been initiated against ai rcraft A F -7 but no testing ha s been started N 0 formal S COP pI anning ha s been completed for AF-6
SCOP Completions per Aircraft (AlC) Aircraft
Effectivity Total SCOPs
Planned SCOP Completed
Complete fTotalAlC)
Complete prior to Rollout
AF-6 85 - - Est Oct 09 I AF-7 85 - - Est Nov 09
Currently 85 SCOPs and 8 AEIs (Aerospace Equipment Instructions) are formally released against AF-6 andAF-7 These numbers are certain to increaseastheLRIP 1 builds mature over the next couple of months
For Official Use Only - Proprietary Program Data Page 7of25
bull bull bull bull bull bull
Improve Supplier Delivery Rate PC - NSF198AJ21 Description JSF Key Suppliers have an average delivery rating of greater than or equal to 00 percent JSF Key Suppliers are determined by analyzing category 3 and 4 shortages to jig load JSF Key Suppliers may be adjusted on a quarterty basis as new issues emerge This metric is a monthly average percent of lots delivered on-time for JSF Key Suppliers The goal is to achieve an average of 00 percent or greater onmiddottime lot delivery rate Supplier delivery data is obtained from LM Aeros Supplier Qualily Management and Procurement Quality Network databases These databases are updated on approximately the 15th of each month The monthly data from each database is reftective of the previous months performance This metric will be updated within one week of the LM database updates Green 1000 to 000 Yellow 959 to 870 Red S869
YS-AJH DCMA LMFW Fmiddot35 NSFl98AJ21 Imp Supplier Delivery Rate
~ ~ ~ ~ ~ ~ ~ ~ ~ ~ ~ ~ FY09
bull Actual bull Targel Target lange
Metric Status Red
Trend Declining
Summary of Metric Status The delivery rate declined 111 to a monthly average of 677 and showed significant decline after a one month improvement
The chart below shows the overall delivery performance over the past 12 months for the top 50 DCMA JSF Key Suppliers The blue vertical bars represent the monthly average percent oft ots delivered onshytime The uppe r red line represents the monthly ne t scheduled qu antity of parts which were t 0 be delivered by these 50 suppliers and the lower green line represents the monthly quantity of parts received on-time from these 50 suppliers
JSF Top 50 Key SuppliE1$ - Overall Delivery Periormaneemiddot Jan 08 to Dee 08
-
For Official Use Only - Proprietary Program Data Page 8 of25
Root Causes The root causes of t he poor delivery performance continue to be late requirements to suppliers rapidly changing requirements du e toe ngineering changes schedule pressures material availability and an immature supplier base
Contractor A ctions To correct the negative de livery pe rformance Lockheed Martin has deployed 20+ Supply Chain Managers to focus suppliers Additionally they began a Tier 2 initiative called Deliver the Parts In this program 25 suppliers have been identified for expanded oversight and assistance with corporate resources solicited
DCMA Actions DCMA is initiating Letters of Delegation to monitor and r with significant negative impact on the delivery rate F or example had a lot delivery rate of 171 for the month of December with 13 actually delivered
Estimate when PC will achieve goal LRIP 3 to LRIP 4 (2011 to 2013)
Improve Supplier Quality Rate PC - NSF198AJ10 Description Each delegated supplier has quality ratings greater than 96 percent The total LM Quality rating for key suppliers (areas of consideration are cost iSsues technical criticality) The top suppliers are summed and divided by quantity which gives an average QA rating per month The goal is to achieve an average of greater than 96 Supplier quality data is obtained from LM Aeros Procurement Quality Assurance database and metric updated no later than the 20th of each month Green ~96 YeUow 87 to 95 Red lt87
YS-AJH DCMA LMFW F-35 NSF198AJ10 Imp Supplier Qual Rate
+ +
~ ~ ~ ~ ~ ~ ~ ~ ~ ~ ~ ~ FY09
bull Actual bull Target Target range
Metric Status Yellow
For Official Use Only - Proprietary Program Data Page 9 of25
Maintain Cost and Schedule pc - NSF198AJ08 Description Resource requirements are aligned in support of funding and budget allocations IEAC data and projections match actual perfonnance within + Imiddot 10 of contractors budget at completion DCMA Independent EAC is measured against the prime contractors BAC DCMA includes risk pressures cost and schedule variances as compared to LM Aero BAC The source of EV data comes from the monthly JSF SOD Cost Performance Report which lags by 1 month Metric is updated in Metrics Manager as soon as data is received from contractor (approximately 45-60 days after end-of-rnonth) This is represented
as the contractors BAC as the Numerator divided by DCMAs IEAC as the Denominatormiddot with a 10 percent tolerance band Green 10 to 095 variance (5) Yellow 095 to 090 variance (5 to 10) Red 090 or greater variance (gt10)
YSmiddotAlH DCMA LMFW F-35 NSF198AJ08 Maint SDD Cost Schedule
~ ~ ~ ~ ~ ~ ~ ~ ~ FY09
bull AlhJiJ1 bull iarger Target range
Lockheed Martin is now reporting to an 0 ver Target Baseline of _ reported in the Cost Performance Report (CPR)
DCMA IEAC i~ for the SOD contract This DCMA IEAC is based upon the December 08 CPR report ~pended an average of__ per month over the last six months Assuming a continuance of this ~e rate DCM~ SOD budget with OTB will be depleted in FY2011 (BAC ot~ - ACWP ot~ remaining)
Using December 08 CPR data the above formulae yields an SOD increase of__over current LM Aero BAC With the addition of risk factors such as Supplier Costs La~rts Schedule
Change Requirements~CROM data etc the DCMA IEAC verses the LM Aero BAC o~
The December 2008 SOD cost summary and program status is as follows
For Official Use Only Proprietary Program Data Page 10 of25
Performance StartEnd Oct 20011 2012 2007Feb20 1 0 201OFeb 2011
PrirnaQ Trip Wires Secondary Trip Wires
Mar 20 IIDec 2011
System Baseline Contract
Mods Baseline
Indicator Indicator Revs 5
NA
Cum BEl
098
SPI
0977
Cum CPU
100
CPI
0961
CPITCPI 10
52
Primary Trip Wires shy(a) System Indicator Please see EV section of report (b) Baseline Indicators A baseline assessment shows the contractors BAC and EAC to be optimistic To complete the contract within the CBB the contractor needs to be about 52 percent more efficient The BAC has increased by 40 since the start up in Oct of 2001 The cost growth is likely to increase due to inherent eng ineering risks in the first versions 0 f S TOVL and C V aircraft The con tractors D CROM database for the corresponding month shows a net cost growth of threats and pressures exceeding
Secondary Trip Wires shybull Baseline Execution Index (BEl) Cumulative tasks from October 200 I thru January 2009 Cum
BEl = 135423 Completed Tasksl38389 Planned Tasks = 098 bull Monthly (January 2009) Tasks 408 Completed Tasks vs 1046 Baselined to Complete Tasks bull SPI (since replan) BCWPBCWS= 0977 bull CPU= (1435 + (7raquo1435 = 100 (Time Now 25 Jan 09) bull CPI (since replan) = BCWPACWP== 0961 bull CPIITCPI= 096111014=948 bull Contracts Mods-(BAC now)original BAC 1001= __=1401
The DCMA Risk Rating for EVMS at the total program level is rated Green using the agreed to parameter ofVAC (-428)
Similarly the TCPIEAc is different when using the DCMA IEAC versus the contractors EAC
TCPIDCMA IEAC 0898 TCPILMEAc == 1014
For Official Use Only - Proprietary Program Data Page 11 of25
NSF198AJ08 Sub-Metrics Description The SOD Baseline execution Index (BEl) metric is an Integrated Master Schedule (lMS) based metric that calculates the efficiency with which actual work has been accomplished when measured against the baseline The BEl provides insightinto the realism of program cost resource and schedule estimates For BEl an index of lt95 is used as a warning indication 0 f schedule execution under performance Goal I s to achieve B EI value8295 Cumulative BEl equals actual tasksactivities completed divided by the baseline total tasksactivities
The SOD Critical Path Length Index (CPU) indicates whether or not the program schedule can be completed on time This is an Integrated Master Schedule (lMS) based metric that utilizes the critical path methodology definition being the longest continuous sequence of tasks through then etwork schedule with t he I east a mount of float f rom contract start to contract completion After contract start the critical path is always measured from ime now until contract completion For CPU an index of lt95 is used as a warning indication thatthe program will not complete on time Goal is to maintain CPU val~95 Critical Path Length Index (CPU) equals the Critical Path Length (CPL) plus or minus the Total Float (TF) divided by the Critical Path Length (CPL) The target efficiency ratio for both metrics is 100 An index greater than 100 is favorable and an index less than 100 is unfavorabltl95 =
Green 90 to lt95 Yellow lt90 Red
YS-AlH DCMA LMFW F-3S SDD IMS BEl
~~ ~ FY09
Targe-t range
YS-AlH DCMA LMFW F-35 SDD IMS CPU
$6 ~~ ~ ~ i-~ i- -ltp ~
FY09
bull AGlusl TallO9
Cumulative SDD Program BEl and CPU sub-metrics are rated Green for this period with the Cum BEl at 98 and CPU at 100 for month end January
For Official Use Only - Proprietary Program Data Page 12 of25
055
I
Baseline Current vs Actual Current FinishesMonth Program Cum BEl CPLI Trend
105 r 2500
MS-61 baseline replan dates were incorporated into the IMS month-end May 2008 A decrease in overall program planned monthly performance to MS 61 baseline task completions continues over the past eight months
Reduce Schedule Variation PC - NSF198AJ05 Description Reduce the average Wing touch labor variance at move to Mate to within 10 by SDD completion In addition to monthly performance indicators linear trend lines are used to project out subsequent Wing builds that have not moved to mate yet - projection is used to access current and predict future Wing variance performance Metric will be updated NLTthe 20th of the follOwing month Green lt-10 variance Yellow -10 and -15 variance Red gt-15 variance
YS-AJH OCMA LMfW F-35 NSF198AJ05 Reduce Schedule Variation
~ ~ ~ ~ ~ ~ ~
FYog
bull Actual
Metric Status Yellow - Performance Commitment is rated Yellow this period with a current overall Wing average touch labor variance to schedule is at -13
Q95
085
075
065 iii III
2000
1500
~ ~
lloo0
r 500
o
For Official Use Only - Proprietary Program Data Page 13 or25
Trend Improving - the variation average improved by 1 since the CF-2 Wing moved with only a 9 variance to its schedule
Summary of Metric Status Chart 1 (below) is a breakout of the Wings which build up the -13 variation average metric The Wing ha s gradually r educed their ou t of station tasks t ravelled to Mate This is noteworthy since history has shown that Mate and Final Assembly performance has been significantly affected by the condition (maturity) and timing of the Wing delivery The CF-2 Wing moved to Mate since the last reporting period with only a 9 variance to its schedule This has contributed to the overall average sche dule variance reduction D CMA do es not include ground aircraft performance in its variance calculations
The Wing partially recovered some schedule pe rformance this month due to receipt of several critical shortages in AF-I thru 4 BF-4 and 5 BH-1 and CF-2 The CF-I Wing is experiencing schedule delays due to critical shortages are preventing plumbing systems installation in its upper fuel tanks and lower bays The C G-l Wing ha s be en impacted by critical pa th Mate operations which are preventing on he upper surface ofthe Wing These uppe r Wing operations are limited due to safety issues surrounding the component when de-mated and weight limitations when the components are not structurally joined This situation has been extended longer than expected due to the late delivery of the Aft Fuselage Some data adapted from program Format 5 CPR (Nov 08) report
Wing Variance Move to Mate
Jan 2009
Chart I
Chart 2 (sub-metric) below is a breakout of some of the aircraft that have either gone through or are in Mate and Final Assembly along with their associated variance to schedule BF-3 left Mate and Final Assembly temporarily and returned from the Calibration Lab in mid January 2009 and now carries a 27 variance to its planned schedule BF-4 rolled-out on 21 Jan 09 According to our estimates (data as of25 Jan 09) BF-4 had 840 standard hours 22870 estimated actual hours of open work at the time it moved to the fuel barnflight line This equates to an estimated 34 variance to planned schedule There was no change in our variation average (33) since BF-4 performance fell in between BF- and BF-2 Note BFshy4 has over 350 more standard (labor) hours than prior B F (STOVL) aircraft and is considered the first Mission System aircraft DCMA projected variance at move pe rcentages for Aircraft (BF-3 and A F -1) are encouraging and should positively impact the overall average within the next month
Mate t hru Delivery bui ld performances continue to be unde r pr essure tom eet schedule requirements Mates cost and schedule variances continue to be driven by part shortages late planning and late Wing component delivery to Mate WAM (Wing at Mate) Team continues to work to mitigate planned out of station work For Flight Line Operations (WBS 3186) primary issues are centered on coordinating work with traveled work from the factory BF-3s projected late receiptstart at which has moved to February 2009 and BF-2s late receipt from System Checkout by two months
For Official Use Only - Proprietary Program Data Page 14 of25
LM Aero has recently stood up a Focused Flight Line Support Team to better support the Flight Line operations Some data adapted from program Format 5 CPR (Nov 08) report
Both our charts use SPI data for variance projections on Wingsaircraft that havent moved to matelflight line y et Per Lockheed Martin The da ta used i n t he cha rts i s from shop floor sy stems and is no t auditable data or official EV data It is for status purposes only
MatemiddotFinal Assembly Variance Move to Flight Line
Jan 2009 I
r~____ __~11Av_e~_g_e_=_~_ 40 35 30 25 20 15 10 5 0
Chart 2
Root Causes In general performance continues to be hindered by Critical part shortages high change traffic difficultinefficient work (Out of StationOut of SequenceWork-Around Plans metrology etc) integration of flight t est instrumentation etc) I ate andor constant rework of planning and tooling issuesavailability In order to have a positive impact on overall throughput (roll-out) LM Aero must find a way to simultaneously continue to reduce out-of-station tasks and improve their ability to start and finish on plan
Contractor Actions LM Aero continues to put emphasis on Value Stream recovery initiatives such as a Shortage Resolution Process with consulting company ~) Tiger Teams for on-sight subcontract management support at critical suppliers advanced work~up teams to review job packages prior to major assembly start continued tool designrework to mature tooling WAM (Wing at Mate) Teams to mitigate pi anned out of station work impacting Mate ( showing pr ogress) pr ocess improvement initiatives (such as B racket I ocatinglbulkhead marking and portableperishable tools) increased manpower and outsourcing to reduce pi anning backlog as well as sp an time crew si ze and schedule compressions in the factory and Flight Line areas including the new Focused Flight Line Support Team
DCMA Actions Regular interface with LM Aero project teams to assess progress on recovery initiatives look for process review or corrective action opportunities monitor impacts on Mate update metrics and report progress in monthly report to customers
The Joint Process Review (JSF Wing Special Tooling) that was completed September 11-182008 (in order to determine the suitability adequacy and effectiveness ofL ockheed Martins JSF Wing spe cial tooling storage and control processesprocedures) will undergo verification on the shop floor over the next several weeks Once this is complete the JPR team will close the review Two new JSF process reviews are planned for 2009 and will be announced once schedules are solidified
Estimate when PC will achieve goal Every first new Variant disrupts the overall PC performance with each subsequent AC showing improvement Goal may not be reached until after SDD completion (2014) when Wing and Mate overlap is eliminated
For Official Use Only - Proprietary Program Data Page 15 of25
The following table depicts the SCOP completions per test articleaircraft The table includes the total SCOPs planned per aircraft the number of SCOPs completed as of this reporting period (2 Feb 09) the percentage ofS COPs co mpleted relating to the total planned for th e specific test article a nd th e percentage of testing completed prior to test article rollout from the factory to the flight line This table is provided to better align the data to the new PCs as well as a major milestone (Rollout) for LMFW
SCOP Total SCOPs
SCOP CompletedTest Article
This table is provided to track Wing specific SCOP testing prior to move to Mate and percent of testing completed prior to factory rollout Please note that BF-4 has left the factory floor and moved to the Fuel Barn during this reporting period
SCOPCompleI fIons on W102 A ssembrles
Test Article
Total SCOPs
Planned to Date
oAtComplete (No SCOPs Completed)
Complete prior to Move to Mate
(Assy Move Date)
Complete prior to Rollout
Max Calendar
Day Behind MS61
BF-l 15 100 (15) 0( 53007) 40 (6) -168 BF-2 18 100(18) 0(91101) 833 (15) -216
BF-3 18 500(9) 0(1211607) - -191 BF-4 19 473(9) 0(3308) 316 (6) -169
AF-l 16 1 687(11) 0(32708) - -176 AF-2 14 285(4) 0(61308) - -148 AF-3 15 267(4) 0(8108) - -89
CF-l 13 0(0) OO~Il1708) - -59 CF-2 12 0(0) - - +48
I
I
New SCOPs added thIS reporting penod bull Wing testing is still in-work Travel work frombullbullbullbullbullbull will be in effect until LRIP 2Value is not final until all testing is completed
For Official Use Only - Proprietary Program Data Page 16 of25
I
NSF198AJ05 Sub-Metrlc Description Reduce monthly average of negative float manufacturing days (Mdays) of key variant First Flight dates over baseline aircrafts (M-1) delayed (-80Mdays) First Flight date BF-4 (STOVl- Mi$$ion Systems Article) targets a 50 reduction in negative float over baseline incorporating a 20 reduction each month in negative float Mdays AF-1 (CTOLshyOptimized vs M-1) targets a 50 reduction in negative float over baseline incorporating a 15 reduction each month in negative float Mdays 12 months out from Master Schedule First Flight date (Note Mdays are displayed as positive values but represent behind schedule status
YS-AlH DCMA LMFW F-35 BF-4 First Flight Date
30
25
20
5~_1_
0
bull Actual bull TarJe Target range
BF-4 sub-metric is rated Red with a January average of 33 Mdays late to first flight date of 24 Mar 09 BF-4 baseline rollout was 21 Oct 08 - rollout occurred on 21 Jan 09 Projected first flight is now June as of7 Feb 09 An additional build period is required to complete the aircraft
SF Fist Flight (24 March 09 ~ MS61) Total Sled Trend MSS ltlatct In IMS 4 Nov 01 j MS~1 dalee IIi INS 9 Mar OB
For Official Use Only - Proprietary Program Data Page 17 of25
YS-AlH DCMA LMFW F-35 AF-l First Flight Date
~ ~ ~ ~ ~ ~ ~ ~ ~ ~ ~ FY09
bull Ac1ual bull Target Target range
AF-l sub-metric israted Red with a January average of 31 Mdays late to first flight date of 14 May 09 Baseline rollout date was 25 Nov 08 - aircraft rolled on 5 Feb 09
AF-1 Firt Fllght (14 May 09 - MS61 i Total Slade Trol1ltl MS6l1ate1l In IM$4 Noy 07 J M561 ($atellin jMS9Mar06
For Official Use Only - Proprietary Program Data Page 18 of2S
Non-Conformance Reduction PC - NSF198AJ06 Description 10 reduction in MRS discrepancies per year Metric shows the average number of MR defects per 1000 actual manufacturing hours The goal is to reduce MR defectS per 1000 actual manufacturing hours by 10degA per year Metric Is based on contractor provided data that is collected updated in metrics manager NlT the 20th of each month and averaged against all prior months to illustrate normalized trend Green ltgoal of 21 Yellow within 10 of the goal Red gt10 above the goal of21
DEFECT CODE PARETO F35 PRODUCTION ASSEMBLY OPERATIONS
RPOWELL
Metric Status Green
Trend Improving with approximately 18333 MR defects per 1000 HRS for FY 09
Summary of Met ric Status Metric iJ lustrates improving t rend that has been maintained for t he last 12 months
DCMA Actions Reducing the goal to reflect an effort to further reduce the amount of MRB actions for this year
Estimate when PC will achieve goal PC has achieved goal as set last year
For Official Use Only Proprietary Program Data Page 19 of25
Safety of Flight (SoF) PC - NSF198AJ01 Description Measures contractor perfonnance in passing Safety of Flight inspections on the first attempt It is a measure of quality where the target is 85 Nonnally SOF metries measure the number of SOF escapes to the customer The Fmiddot 35 program is not yet delivering to the customer therefore we are measuring the contractors learning curve in presenting to DCMA defect free products in SOF designated areas Fonnal SoF implementation was June 2007 - a traditional SoF metlic based on customer reported escapes will be adopted once delivery of aircraft begins Data is updated in Metries Manager NL T the 20th of the following month Perfonnance data obtained from local DCMA quality data base as a result of DCMA inspections Green gt85 Yellow 80-84 Red lt79
YS-AlH DCMA LMFW Fmiddot35 NSF19SAlOl Main SOF Insp 1st time pass
~ ~ FY09
bull AC(1iill bull T3fget
Metric Status Green
Trend No Change
Summary of Metric Status New metric in development will be reported next month
Improve Software Productivity
Metric Status Green
Trend Improving
For Official Use Only - Proprietary Program Data Page 20 of25
Summary of Metric Status Current performance is exceeding our target of 83 - the value this month is 9106 which is an improvement over last months value of 8877
Root Causes DCMA LMFW performed a risk assessment for this revised PC Process areas of focus include Software Product Evaluation (SPE) and Interface Work Package (IWP) processes Another focus area i s improved communication through consistent u se of developmental software configuration management practices
Contractor Actions T he contractors process includes process improvement activities (Kaizans Tiger Team Efforts Value Stream Mapping Lean Events etc)
bull System Build Process bull Reducing the amount of effort spent working SPAR RWPs
DCMA Ac tions DCMA-LMFW Report and Exec Summary-January 2008 - DCMA m et wi th t he contractor to discuss SPE Process Review findings and planned corrective actions Robustness testing is included in DCMAs discussions with LM Aero as it applies to the SPE process and review ofCSCI and unit test artifacts Additionally there were some discussions about Robustness Testing described in the AS SDP and what organizations are involved to develop robustness test cases and results DCMA is in process of de vel oping an IWP proc ess review ch ecklist and also plans to discusscoordinate with the contractors Quality and Mission Success team to incorporate contractor audit checklist
- [WBS 1422 - External Communications Domain] - This
n up 0 report
Issueslconcerns that may be r elated to pr ocess execution mentioned in t his months report include requirements interface problems uncoordinated interface changes and requirements re-work
- [WBS 1424 - Mission Domain] - DCMA is the reasons for SLOC growth which invo
At pr esent D CMA i s looking at a ne w of this matter Issuesconcerns that may be related to process execution
mentioned in this months report include rework time I SPARs JADE inefficiencies due to difficulty of running file models and missing messages in configuration files
DCMA -_- Integrated Core Processor s m eetmg r eport m omtor and Program Manager to discuss the status of these PRs and their plan to resolve them They are aware that some of these have been open for awhile and are making them a top priority (See chart below) We also attend the eekl PR status meeting I feel that as a result of the communication between DCMA and ___
~ has redirected more attention towards these High Problem Reports It was verifi~ as ape rson assigned to it age and status ofP R are being monitored closely and discussed at the
weekly meeting
Estimate when PC will achieve goal Current performance exceeds target and the trend is improving
For Official Use Only - Proprietary Program Data Page 21 of25
Improve Minor Variance PC - NSF198AJ19 Description Maintain at least a 95 correct classification rate of variances Cumulative number of minor variances classified correctly divided by the cumulative number of minor variances reviewed Metric should be updated at the end of each month but no later than the twentieth of the foUoNing month Green of properly classified minor variances is ~95Yelow 90 up to but not including 95 Red lt90
YS-AlH DCMA LMFW F-35 NSF198Al19 Improve Minor Variance
bull
~ ~ ~ ~ ~ ~ ~ ~
FY09
bull AChJtl bull r39 Target range
Metric Status Green
Trend Degrading
Summary of Metric Status The contractor had a correct classification rate of 962 this month - goal is to maintain at or above 95
Root Causes No root causes identified at this time
Contractor Actions No contractor actions required at this time until root causes can be identified
DCMA Actions Continue tor eview Minor Variances for correct classification and tow ork with the contractor to determine root causes of incorrect classifications Ensure the contractor takes the necessary corrective actions to preclude any incorrect classifications in the future
Estimate when PC will achieve goal T he PC has currently achieved its goal by being at or ahov e a correct classification rate of95
For Official Use Only - Proprietary Program Data Page 22 of25
bull bull bull bull bull bull
Improve FCAIPCA PC - NSF198AJ20 Description Ensure that at least 95 of systems reviewed in interim FCAIPCAs meet the design requirements Technical Description Verification of the Fmiddot35s physical configuration to the design requirements by performing PCAs (physical configuration audits) Percentage of part and assembly numbers reviewed in interim audits in accordance with engineering drawings divided by total population of parts and assemblies assessed The data used to assess this comes from interim audits from suppliers Green of parts meeting design requirements is ~95 Yellow 9G94 Red lt90
YS-AJH DCMA LMFW Fmiddot35 NSFl98AJ20 Improye FCAPCA
~ ~ ~ ~ ~ ~ ~ ~ FY09
bull Actual bull Target Torgel range
Metric Status Green
Contractor Actions Meetings with DCMA personnel
found on QARS __
Improve Minor Change PC - NSF198AJ18 Description Ensure that 95 of minor changes are correctly classified A Minor Change is defined as a change to an item which remains interchangeable with the same item in which the change has not been incorporated (formffit function Interchangeable) has little or no impact to any downstream functions and has no effect on any criteria goveming Major A andor Major S type changes Criteria for classification of changes are presented In PD-44 Data Source(s) PDM JDL and weekly
CIS meetings participation Metric is calculated by the number of minor changes correctly dasslfied + by the total number of minor changes reviewed during the month Data is updated in Metrics Manager NL T the 20th of the following month Green gt95 Yellow ~9O to S95 Red lt90
YSmiddotAlH DCMA LMfW F-35 NSF198Al18 Improve Minor Change
bull bull bull bull
bull Actual bull Target Target range
Metric Status Green
For Official Use Only - Proprietary Program Data Page 23 of2S
Maintain Assist Audit Request Timing PC - NSF198AJ13 Description Process contractorpeO requests for domesticinternational Assist Audits within 2 business days 85 of the time The percentage will be calculated by dividing the number of Assist Audits processed within 2 business days by the
i total number of Assist Audits requested Source data will be obtained prior to the 15th of the following month and updated in Metrics I Manager NL T the 20th of the following month Green gt84 Yellow 75-84 Red lt75
YSmiddotAlH DCMA LMFW Fmiddot35 NSF198Al13 Malnt Asst Audit Req Timing
~ ~ ~ ~ ~ ~ ~ ~ ~ ~ ~ ~
FY09
The performance commitment is rated Green for this period
Maintain FAR Requests for Contract Closeout PC - CDDAGYOC02 Description Maintain 94 contract closeout actions within the Federal AcqUisition Regulation (FAR) mandated timeframes The percentage will be calculated by dividing the number of on time contracts closed by the total number of contracts closed Source data will be obtained prior to the 15th of the following month and updated in Metrics Manager NLT 20th of the following month Green gt93 Yellow 85-93 Red lt85
~
YS-AlH DCMA lMFW Fmiddot3S CDDAGYOC02 Main FAR Req for K Closeout
~ ~ ~ ~ ~ ~ ~ ~ FY09
bull Actual Target Target range
The performance commitment is rated Green for this period
For Official Use Only - Proprietary Program Data Page 24 of25
Reduce Cancelling Funds PC - CDDAGYOC01 Description 90 of canceling funds will be billed andor de-obligated before the end of the fiscal year Attainment of the goal will be calculated by dividing the total dollar amount of canceling funds billed andor de-obiigated by the total amount of canceling funds identified Source data will be obtained prior to the 15th of the following month and updated in Metrics
Manager NLT the 20th of the following month Green gt89 Yellow 80-89 Red lt80 of the funds identified to cancel at year end
YS-AlH DCMA LMFW F-35 CDDAGYOCOl Reduce Cancelling Funds
bull bull bull bull
~ltI ~ ~ ltr -ogt
FY09
bull Actual bull Target Targe IIgt
The performance commitment is rated Green for this period
Earned Value The complete EV report is attached
Appendix A - EV Assessment Criteria Rating Criteria is based on the DCMA V AC and when possible should include MR in the DCMA lEAC
Green- VACoogt-5
Yellow - -1 OltVAClt-5
VAClt-lOshyNR- Not Rated or Not Reported
For Official Use Only - Proprietary Program Data Page 25 of25
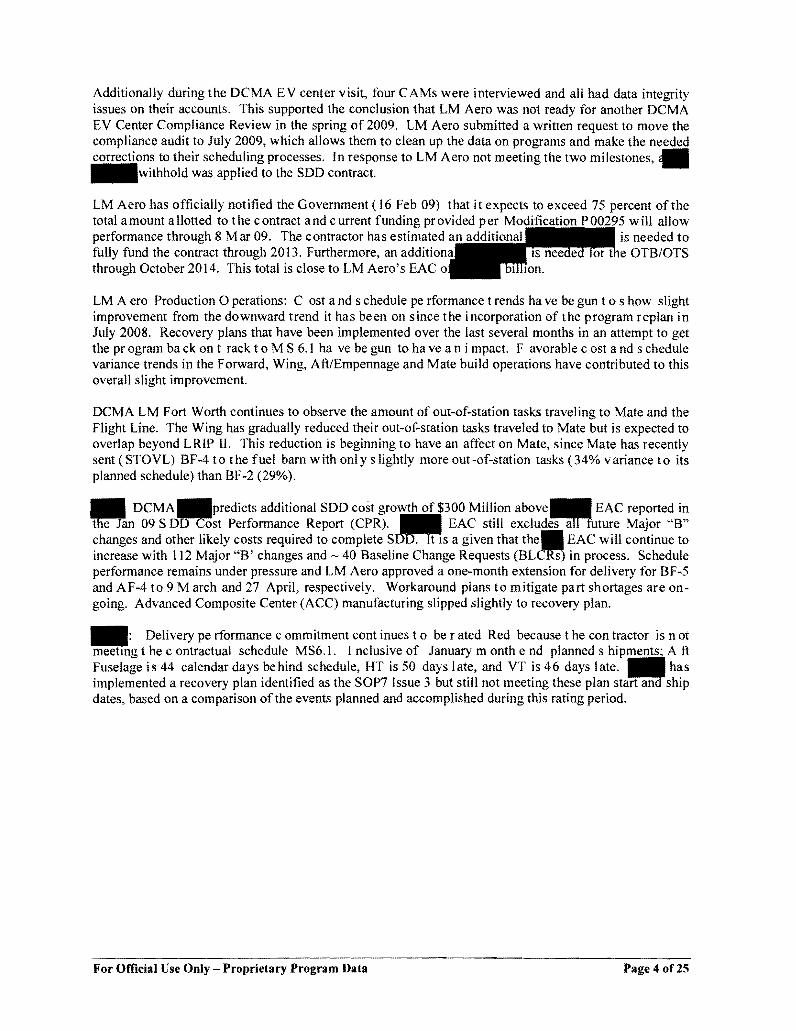

bull bull bull bull bull bull
Improve Supplier Delivery Rate PC - NSF198AJ21 Description JSF Key Suppliers have an average delivery rating of greater than or equal to 00 percent JSF Key Suppliers are determined by analyzing category 3 and 4 shortages to jig load JSF Key Suppliers may be adjusted on a quarterty basis as new issues emerge This metric is a monthly average percent of lots delivered on-time for JSF Key Suppliers The goal is to achieve an average of 00 percent or greater onmiddottime lot delivery rate Supplier delivery data is obtained from LM Aeros Supplier Qualily Management and Procurement Quality Network databases These databases are updated on approximately the 15th of each month The monthly data from each database is reftective of the previous months performance This metric will be updated within one week of the LM database updates Green 1000 to 000 Yellow 959 to 870 Red S869
YS-AJH DCMA LMFW Fmiddot35 NSFl98AJ21 Imp Supplier Delivery Rate
~ ~ ~ ~ ~ ~ ~ ~ ~ ~ ~ ~ FY09
bull Actual bull Targel Target lange
Metric Status Red
Trend Declining
Summary of Metric Status The delivery rate declined 111 to a monthly average of 677 and showed significant decline after a one month improvement
The chart below shows the overall delivery performance over the past 12 months for the top 50 DCMA JSF Key Suppliers The blue vertical bars represent the monthly average percent oft ots delivered onshytime The uppe r red line represents the monthly ne t scheduled qu antity of parts which were t 0 be delivered by these 50 suppliers and the lower green line represents the monthly quantity of parts received on-time from these 50 suppliers
JSF Top 50 Key SuppliE1$ - Overall Delivery Periormaneemiddot Jan 08 to Dee 08
-
For Official Use Only - Proprietary Program Data Page 8 of25
Root Causes The root causes of t he poor delivery performance continue to be late requirements to suppliers rapidly changing requirements du e toe ngineering changes schedule pressures material availability and an immature supplier base
Contractor A ctions To correct the negative de livery pe rformance Lockheed Martin has deployed 20+ Supply Chain Managers to focus suppliers Additionally they began a Tier 2 initiative called Deliver the Parts In this program 25 suppliers have been identified for expanded oversight and assistance with corporate resources solicited
DCMA Actions DCMA is initiating Letters of Delegation to monitor and r with significant negative impact on the delivery rate F or example had a lot delivery rate of 171 for the month of December with 13 actually delivered
Estimate when PC will achieve goal LRIP 3 to LRIP 4 (2011 to 2013)
Improve Supplier Quality Rate PC - NSF198AJ10 Description Each delegated supplier has quality ratings greater than 96 percent The total LM Quality rating for key suppliers (areas of consideration are cost iSsues technical criticality) The top suppliers are summed and divided by quantity which gives an average QA rating per month The goal is to achieve an average of greater than 96 Supplier quality data is obtained from LM Aeros Procurement Quality Assurance database and metric updated no later than the 20th of each month Green ~96 YeUow 87 to 95 Red lt87
YS-AJH DCMA LMFW F-35 NSF198AJ10 Imp Supplier Qual Rate
+ +
~ ~ ~ ~ ~ ~ ~ ~ ~ ~ ~ ~ FY09
bull Actual bull Target Target range
Metric Status Yellow
For Official Use Only - Proprietary Program Data Page 9 of25
Maintain Cost and Schedule pc - NSF198AJ08 Description Resource requirements are aligned in support of funding and budget allocations IEAC data and projections match actual perfonnance within + Imiddot 10 of contractors budget at completion DCMA Independent EAC is measured against the prime contractors BAC DCMA includes risk pressures cost and schedule variances as compared to LM Aero BAC The source of EV data comes from the monthly JSF SOD Cost Performance Report which lags by 1 month Metric is updated in Metrics Manager as soon as data is received from contractor (approximately 45-60 days after end-of-rnonth) This is represented
as the contractors BAC as the Numerator divided by DCMAs IEAC as the Denominatormiddot with a 10 percent tolerance band Green 10 to 095 variance (5) Yellow 095 to 090 variance (5 to 10) Red 090 or greater variance (gt10)
YSmiddotAlH DCMA LMFW F-35 NSF198AJ08 Maint SDD Cost Schedule
~ ~ ~ ~ ~ ~ ~ ~ ~ FY09
bull AlhJiJ1 bull iarger Target range
Lockheed Martin is now reporting to an 0 ver Target Baseline of _ reported in the Cost Performance Report (CPR)
DCMA IEAC i~ for the SOD contract This DCMA IEAC is based upon the December 08 CPR report ~pended an average of__ per month over the last six months Assuming a continuance of this ~e rate DCM~ SOD budget with OTB will be depleted in FY2011 (BAC ot~ - ACWP ot~ remaining)
Using December 08 CPR data the above formulae yields an SOD increase of__over current LM Aero BAC With the addition of risk factors such as Supplier Costs La~rts Schedule
Change Requirements~CROM data etc the DCMA IEAC verses the LM Aero BAC o~
The December 2008 SOD cost summary and program status is as follows
For Official Use Only Proprietary Program Data Page 10 of25
Performance StartEnd Oct 20011 2012 2007Feb20 1 0 201OFeb 2011
PrirnaQ Trip Wires Secondary Trip Wires
Mar 20 IIDec 2011
System Baseline Contract
Mods Baseline
Indicator Indicator Revs 5
NA
Cum BEl
098
SPI
0977
Cum CPU
100
CPI
0961
CPITCPI 10
52
Primary Trip Wires shy(a) System Indicator Please see EV section of report (b) Baseline Indicators A baseline assessment shows the contractors BAC and EAC to be optimistic To complete the contract within the CBB the contractor needs to be about 52 percent more efficient The BAC has increased by 40 since the start up in Oct of 2001 The cost growth is likely to increase due to inherent eng ineering risks in the first versions 0 f S TOVL and C V aircraft The con tractors D CROM database for the corresponding month shows a net cost growth of threats and pressures exceeding
Secondary Trip Wires shybull Baseline Execution Index (BEl) Cumulative tasks from October 200 I thru January 2009 Cum
BEl = 135423 Completed Tasksl38389 Planned Tasks = 098 bull Monthly (January 2009) Tasks 408 Completed Tasks vs 1046 Baselined to Complete Tasks bull SPI (since replan) BCWPBCWS= 0977 bull CPU= (1435 + (7raquo1435 = 100 (Time Now 25 Jan 09) bull CPI (since replan) = BCWPACWP== 0961 bull CPIITCPI= 096111014=948 bull Contracts Mods-(BAC now)original BAC 1001= __=1401
The DCMA Risk Rating for EVMS at the total program level is rated Green using the agreed to parameter ofVAC (-428)
Similarly the TCPIEAc is different when using the DCMA IEAC versus the contractors EAC
TCPIDCMA IEAC 0898 TCPILMEAc == 1014
For Official Use Only - Proprietary Program Data Page 11 of25
NSF198AJ08 Sub-Metrics Description The SOD Baseline execution Index (BEl) metric is an Integrated Master Schedule (lMS) based metric that calculates the efficiency with which actual work has been accomplished when measured against the baseline The BEl provides insightinto the realism of program cost resource and schedule estimates For BEl an index of lt95 is used as a warning indication 0 f schedule execution under performance Goal I s to achieve B EI value8295 Cumulative BEl equals actual tasksactivities completed divided by the baseline total tasksactivities
The SOD Critical Path Length Index (CPU) indicates whether or not the program schedule can be completed on time This is an Integrated Master Schedule (lMS) based metric that utilizes the critical path methodology definition being the longest continuous sequence of tasks through then etwork schedule with t he I east a mount of float f rom contract start to contract completion After contract start the critical path is always measured from ime now until contract completion For CPU an index of lt95 is used as a warning indication thatthe program will not complete on time Goal is to maintain CPU val~95 Critical Path Length Index (CPU) equals the Critical Path Length (CPL) plus or minus the Total Float (TF) divided by the Critical Path Length (CPL) The target efficiency ratio for both metrics is 100 An index greater than 100 is favorable and an index less than 100 is unfavorabltl95 =
Green 90 to lt95 Yellow lt90 Red
YS-AlH DCMA LMFW F-3S SDD IMS BEl
~~ ~ FY09
Targe-t range
YS-AlH DCMA LMFW F-35 SDD IMS CPU
$6 ~~ ~ ~ i-~ i- -ltp ~
FY09
bull AGlusl TallO9
Cumulative SDD Program BEl and CPU sub-metrics are rated Green for this period with the Cum BEl at 98 and CPU at 100 for month end January
For Official Use Only - Proprietary Program Data Page 12 of25
055
I
Baseline Current vs Actual Current FinishesMonth Program Cum BEl CPLI Trend
105 r 2500
MS-61 baseline replan dates were incorporated into the IMS month-end May 2008 A decrease in overall program planned monthly performance to MS 61 baseline task completions continues over the past eight months
Reduce Schedule Variation PC - NSF198AJ05 Description Reduce the average Wing touch labor variance at move to Mate to within 10 by SDD completion In addition to monthly performance indicators linear trend lines are used to project out subsequent Wing builds that have not moved to mate yet - projection is used to access current and predict future Wing variance performance Metric will be updated NLTthe 20th of the follOwing month Green lt-10 variance Yellow -10 and -15 variance Red gt-15 variance
YS-AJH OCMA LMfW F-35 NSF198AJ05 Reduce Schedule Variation
~ ~ ~ ~ ~ ~ ~
FYog
bull Actual
Metric Status Yellow - Performance Commitment is rated Yellow this period with a current overall Wing average touch labor variance to schedule is at -13
Q95
085
075
065 iii III
2000
1500
~ ~
lloo0
r 500
o
For Official Use Only - Proprietary Program Data Page 13 or25
Trend Improving - the variation average improved by 1 since the CF-2 Wing moved with only a 9 variance to its schedule
Summary of Metric Status Chart 1 (below) is a breakout of the Wings which build up the -13 variation average metric The Wing ha s gradually r educed their ou t of station tasks t ravelled to Mate This is noteworthy since history has shown that Mate and Final Assembly performance has been significantly affected by the condition (maturity) and timing of the Wing delivery The CF-2 Wing moved to Mate since the last reporting period with only a 9 variance to its schedule This has contributed to the overall average sche dule variance reduction D CMA do es not include ground aircraft performance in its variance calculations
The Wing partially recovered some schedule pe rformance this month due to receipt of several critical shortages in AF-I thru 4 BF-4 and 5 BH-1 and CF-2 The CF-I Wing is experiencing schedule delays due to critical shortages are preventing plumbing systems installation in its upper fuel tanks and lower bays The C G-l Wing ha s be en impacted by critical pa th Mate operations which are preventing on he upper surface ofthe Wing These uppe r Wing operations are limited due to safety issues surrounding the component when de-mated and weight limitations when the components are not structurally joined This situation has been extended longer than expected due to the late delivery of the Aft Fuselage Some data adapted from program Format 5 CPR (Nov 08) report
Wing Variance Move to Mate
Jan 2009
Chart I
Chart 2 (sub-metric) below is a breakout of some of the aircraft that have either gone through or are in Mate and Final Assembly along with their associated variance to schedule BF-3 left Mate and Final Assembly temporarily and returned from the Calibration Lab in mid January 2009 and now carries a 27 variance to its planned schedule BF-4 rolled-out on 21 Jan 09 According to our estimates (data as of25 Jan 09) BF-4 had 840 standard hours 22870 estimated actual hours of open work at the time it moved to the fuel barnflight line This equates to an estimated 34 variance to planned schedule There was no change in our variation average (33) since BF-4 performance fell in between BF- and BF-2 Note BFshy4 has over 350 more standard (labor) hours than prior B F (STOVL) aircraft and is considered the first Mission System aircraft DCMA projected variance at move pe rcentages for Aircraft (BF-3 and A F -1) are encouraging and should positively impact the overall average within the next month
Mate t hru Delivery bui ld performances continue to be unde r pr essure tom eet schedule requirements Mates cost and schedule variances continue to be driven by part shortages late planning and late Wing component delivery to Mate WAM (Wing at Mate) Team continues to work to mitigate planned out of station work For Flight Line Operations (WBS 3186) primary issues are centered on coordinating work with traveled work from the factory BF-3s projected late receiptstart at which has moved to February 2009 and BF-2s late receipt from System Checkout by two months
For Official Use Only - Proprietary Program Data Page 14 of25
LM Aero has recently stood up a Focused Flight Line Support Team to better support the Flight Line operations Some data adapted from program Format 5 CPR (Nov 08) report
Both our charts use SPI data for variance projections on Wingsaircraft that havent moved to matelflight line y et Per Lockheed Martin The da ta used i n t he cha rts i s from shop floor sy stems and is no t auditable data or official EV data It is for status purposes only
MatemiddotFinal Assembly Variance Move to Flight Line
Jan 2009 I
r~____ __~11Av_e~_g_e_=_~_ 40 35 30 25 20 15 10 5 0
Chart 2
Root Causes In general performance continues to be hindered by Critical part shortages high change traffic difficultinefficient work (Out of StationOut of SequenceWork-Around Plans metrology etc) integration of flight t est instrumentation etc) I ate andor constant rework of planning and tooling issuesavailability In order to have a positive impact on overall throughput (roll-out) LM Aero must find a way to simultaneously continue to reduce out-of-station tasks and improve their ability to start and finish on plan
Contractor Actions LM Aero continues to put emphasis on Value Stream recovery initiatives such as a Shortage Resolution Process with consulting company ~) Tiger Teams for on-sight subcontract management support at critical suppliers advanced work~up teams to review job packages prior to major assembly start continued tool designrework to mature tooling WAM (Wing at Mate) Teams to mitigate pi anned out of station work impacting Mate ( showing pr ogress) pr ocess improvement initiatives (such as B racket I ocatinglbulkhead marking and portableperishable tools) increased manpower and outsourcing to reduce pi anning backlog as well as sp an time crew si ze and schedule compressions in the factory and Flight Line areas including the new Focused Flight Line Support Team
DCMA Actions Regular interface with LM Aero project teams to assess progress on recovery initiatives look for process review or corrective action opportunities monitor impacts on Mate update metrics and report progress in monthly report to customers
The Joint Process Review (JSF Wing Special Tooling) that was completed September 11-182008 (in order to determine the suitability adequacy and effectiveness ofL ockheed Martins JSF Wing spe cial tooling storage and control processesprocedures) will undergo verification on the shop floor over the next several weeks Once this is complete the JPR team will close the review Two new JSF process reviews are planned for 2009 and will be announced once schedules are solidified
Estimate when PC will achieve goal Every first new Variant disrupts the overall PC performance with each subsequent AC showing improvement Goal may not be reached until after SDD completion (2014) when Wing and Mate overlap is eliminated
For Official Use Only - Proprietary Program Data Page 15 of25
The following table depicts the SCOP completions per test articleaircraft The table includes the total SCOPs planned per aircraft the number of SCOPs completed as of this reporting period (2 Feb 09) the percentage ofS COPs co mpleted relating to the total planned for th e specific test article a nd th e percentage of testing completed prior to test article rollout from the factory to the flight line This table is provided to better align the data to the new PCs as well as a major milestone (Rollout) for LMFW
SCOP Total SCOPs
SCOP CompletedTest Article
This table is provided to track Wing specific SCOP testing prior to move to Mate and percent of testing completed prior to factory rollout Please note that BF-4 has left the factory floor and moved to the Fuel Barn during this reporting period
SCOPCompleI fIons on W102 A ssembrles
Test Article
Total SCOPs
Planned to Date
oAtComplete (No SCOPs Completed)
Complete prior to Move to Mate
(Assy Move Date)
Complete prior to Rollout
Max Calendar
Day Behind MS61
BF-l 15 100 (15) 0( 53007) 40 (6) -168 BF-2 18 100(18) 0(91101) 833 (15) -216
BF-3 18 500(9) 0(1211607) - -191 BF-4 19 473(9) 0(3308) 316 (6) -169
AF-l 16 1 687(11) 0(32708) - -176 AF-2 14 285(4) 0(61308) - -148 AF-3 15 267(4) 0(8108) - -89
CF-l 13 0(0) OO~Il1708) - -59 CF-2 12 0(0) - - +48
I
I
New SCOPs added thIS reporting penod bull Wing testing is still in-work Travel work frombullbullbullbullbullbull will be in effect until LRIP 2Value is not final until all testing is completed
For Official Use Only - Proprietary Program Data Page 16 of25
I
NSF198AJ05 Sub-Metrlc Description Reduce monthly average of negative float manufacturing days (Mdays) of key variant First Flight dates over baseline aircrafts (M-1) delayed (-80Mdays) First Flight date BF-4 (STOVl- Mi$$ion Systems Article) targets a 50 reduction in negative float over baseline incorporating a 20 reduction each month in negative float Mdays AF-1 (CTOLshyOptimized vs M-1) targets a 50 reduction in negative float over baseline incorporating a 15 reduction each month in negative float Mdays 12 months out from Master Schedule First Flight date (Note Mdays are displayed as positive values but represent behind schedule status
YS-AlH DCMA LMFW F-35 BF-4 First Flight Date
30
25
20
5~_1_
0
bull Actual bull TarJe Target range
BF-4 sub-metric is rated Red with a January average of 33 Mdays late to first flight date of 24 Mar 09 BF-4 baseline rollout was 21 Oct 08 - rollout occurred on 21 Jan 09 Projected first flight is now June as of7 Feb 09 An additional build period is required to complete the aircraft
SF Fist Flight (24 March 09 ~ MS61) Total Sled Trend MSS ltlatct In IMS 4 Nov 01 j MS~1 dalee IIi INS 9 Mar OB
For Official Use Only - Proprietary Program Data Page 17 of25
YS-AlH DCMA LMFW F-35 AF-l First Flight Date
~ ~ ~ ~ ~ ~ ~ ~ ~ ~ ~ FY09
bull Ac1ual bull Target Target range
AF-l sub-metric israted Red with a January average of 31 Mdays late to first flight date of 14 May 09 Baseline rollout date was 25 Nov 08 - aircraft rolled on 5 Feb 09
AF-1 Firt Fllght (14 May 09 - MS61 i Total Slade Trol1ltl MS6l1ate1l In IM$4 Noy 07 J M561 ($atellin jMS9Mar06
For Official Use Only - Proprietary Program Data Page 18 of2S
Non-Conformance Reduction PC - NSF198AJ06 Description 10 reduction in MRS discrepancies per year Metric shows the average number of MR defects per 1000 actual manufacturing hours The goal is to reduce MR defectS per 1000 actual manufacturing hours by 10degA per year Metric Is based on contractor provided data that is collected updated in metrics manager NlT the 20th of each month and averaged against all prior months to illustrate normalized trend Green ltgoal of 21 Yellow within 10 of the goal Red gt10 above the goal of21
DEFECT CODE PARETO F35 PRODUCTION ASSEMBLY OPERATIONS
RPOWELL
Metric Status Green
Trend Improving with approximately 18333 MR defects per 1000 HRS for FY 09
Summary of Met ric Status Metric iJ lustrates improving t rend that has been maintained for t he last 12 months
DCMA Actions Reducing the goal to reflect an effort to further reduce the amount of MRB actions for this year
Estimate when PC will achieve goal PC has achieved goal as set last year
For Official Use Only Proprietary Program Data Page 19 of25
Safety of Flight (SoF) PC - NSF198AJ01 Description Measures contractor perfonnance in passing Safety of Flight inspections on the first attempt It is a measure of quality where the target is 85 Nonnally SOF metries measure the number of SOF escapes to the customer The Fmiddot 35 program is not yet delivering to the customer therefore we are measuring the contractors learning curve in presenting to DCMA defect free products in SOF designated areas Fonnal SoF implementation was June 2007 - a traditional SoF metlic based on customer reported escapes will be adopted once delivery of aircraft begins Data is updated in Metries Manager NL T the 20th of the following month Perfonnance data obtained from local DCMA quality data base as a result of DCMA inspections Green gt85 Yellow 80-84 Red lt79
YS-AlH DCMA LMFW Fmiddot35 NSF19SAlOl Main SOF Insp 1st time pass
~ ~ FY09
bull AC(1iill bull T3fget
Metric Status Green
Trend No Change
Summary of Metric Status New metric in development will be reported next month
Improve Software Productivity
Metric Status Green
Trend Improving
For Official Use Only - Proprietary Program Data Page 20 of25
Summary of Metric Status Current performance is exceeding our target of 83 - the value this month is 9106 which is an improvement over last months value of 8877
Root Causes DCMA LMFW performed a risk assessment for this revised PC Process areas of focus include Software Product Evaluation (SPE) and Interface Work Package (IWP) processes Another focus area i s improved communication through consistent u se of developmental software configuration management practices
Contractor Actions T he contractors process includes process improvement activities (Kaizans Tiger Team Efforts Value Stream Mapping Lean Events etc)
bull System Build Process bull Reducing the amount of effort spent working SPAR RWPs
DCMA Ac tions DCMA-LMFW Report and Exec Summary-January 2008 - DCMA m et wi th t he contractor to discuss SPE Process Review findings and planned corrective actions Robustness testing is included in DCMAs discussions with LM Aero as it applies to the SPE process and review ofCSCI and unit test artifacts Additionally there were some discussions about Robustness Testing described in the AS SDP and what organizations are involved to develop robustness test cases and results DCMA is in process of de vel oping an IWP proc ess review ch ecklist and also plans to discusscoordinate with the contractors Quality and Mission Success team to incorporate contractor audit checklist
- [WBS 1422 - External Communications Domain] - This
n up 0 report
Issueslconcerns that may be r elated to pr ocess execution mentioned in t his months report include requirements interface problems uncoordinated interface changes and requirements re-work
- [WBS 1424 - Mission Domain] - DCMA is the reasons for SLOC growth which invo
At pr esent D CMA i s looking at a ne w of this matter Issuesconcerns that may be related to process execution
mentioned in this months report include rework time I SPARs JADE inefficiencies due to difficulty of running file models and missing messages in configuration files
DCMA -_- Integrated Core Processor s m eetmg r eport m omtor and Program Manager to discuss the status of these PRs and their plan to resolve them They are aware that some of these have been open for awhile and are making them a top priority (See chart below) We also attend the eekl PR status meeting I feel that as a result of the communication between DCMA and ___
~ has redirected more attention towards these High Problem Reports It was verifi~ as ape rson assigned to it age and status ofP R are being monitored closely and discussed at the
weekly meeting
Estimate when PC will achieve goal Current performance exceeds target and the trend is improving
For Official Use Only - Proprietary Program Data Page 21 of25
Improve Minor Variance PC - NSF198AJ19 Description Maintain at least a 95 correct classification rate of variances Cumulative number of minor variances classified correctly divided by the cumulative number of minor variances reviewed Metric should be updated at the end of each month but no later than the twentieth of the foUoNing month Green of properly classified minor variances is ~95Yelow 90 up to but not including 95 Red lt90
YS-AlH DCMA LMFW F-35 NSF198Al19 Improve Minor Variance
bull
~ ~ ~ ~ ~ ~ ~ ~
FY09
bull AChJtl bull r39 Target range
Metric Status Green
Trend Degrading
Summary of Metric Status The contractor had a correct classification rate of 962 this month - goal is to maintain at or above 95
Root Causes No root causes identified at this time
Contractor Actions No contractor actions required at this time until root causes can be identified
DCMA Actions Continue tor eview Minor Variances for correct classification and tow ork with the contractor to determine root causes of incorrect classifications Ensure the contractor takes the necessary corrective actions to preclude any incorrect classifications in the future
Estimate when PC will achieve goal T he PC has currently achieved its goal by being at or ahov e a correct classification rate of95
For Official Use Only - Proprietary Program Data Page 22 of25
bull bull bull bull bull bull
Improve FCAIPCA PC - NSF198AJ20 Description Ensure that at least 95 of systems reviewed in interim FCAIPCAs meet the design requirements Technical Description Verification of the Fmiddot35s physical configuration to the design requirements by performing PCAs (physical configuration audits) Percentage of part and assembly numbers reviewed in interim audits in accordance with engineering drawings divided by total population of parts and assemblies assessed The data used to assess this comes from interim audits from suppliers Green of parts meeting design requirements is ~95 Yellow 9G94 Red lt90
YS-AJH DCMA LMFW Fmiddot35 NSFl98AJ20 Improye FCAPCA
~ ~ ~ ~ ~ ~ ~ ~ FY09
bull Actual bull Target Torgel range
Metric Status Green
Contractor Actions Meetings with DCMA personnel
found on QARS __
Improve Minor Change PC - NSF198AJ18 Description Ensure that 95 of minor changes are correctly classified A Minor Change is defined as a change to an item which remains interchangeable with the same item in which the change has not been incorporated (formffit function Interchangeable) has little or no impact to any downstream functions and has no effect on any criteria goveming Major A andor Major S type changes Criteria for classification of changes are presented In PD-44 Data Source(s) PDM JDL and weekly
CIS meetings participation Metric is calculated by the number of minor changes correctly dasslfied + by the total number of minor changes reviewed during the month Data is updated in Metrics Manager NL T the 20th of the following month Green gt95 Yellow ~9O to S95 Red lt90
YSmiddotAlH DCMA LMfW F-35 NSF198Al18 Improve Minor Change
bull bull bull bull
bull Actual bull Target Target range
Metric Status Green
For Official Use Only - Proprietary Program Data Page 23 of2S
Maintain Assist Audit Request Timing PC - NSF198AJ13 Description Process contractorpeO requests for domesticinternational Assist Audits within 2 business days 85 of the time The percentage will be calculated by dividing the number of Assist Audits processed within 2 business days by the
i total number of Assist Audits requested Source data will be obtained prior to the 15th of the following month and updated in Metrics I Manager NL T the 20th of the following month Green gt84 Yellow 75-84 Red lt75
YSmiddotAlH DCMA LMFW Fmiddot35 NSF198Al13 Malnt Asst Audit Req Timing
~ ~ ~ ~ ~ ~ ~ ~ ~ ~ ~ ~
FY09
The performance commitment is rated Green for this period
Maintain FAR Requests for Contract Closeout PC - CDDAGYOC02 Description Maintain 94 contract closeout actions within the Federal AcqUisition Regulation (FAR) mandated timeframes The percentage will be calculated by dividing the number of on time contracts closed by the total number of contracts closed Source data will be obtained prior to the 15th of the following month and updated in Metrics Manager NLT 20th of the following month Green gt93 Yellow 85-93 Red lt85
~
YS-AlH DCMA lMFW Fmiddot3S CDDAGYOC02 Main FAR Req for K Closeout
~ ~ ~ ~ ~ ~ ~ ~ FY09
bull Actual Target Target range
The performance commitment is rated Green for this period
For Official Use Only - Proprietary Program Data Page 24 of25
Reduce Cancelling Funds PC - CDDAGYOC01 Description 90 of canceling funds will be billed andor de-obligated before the end of the fiscal year Attainment of the goal will be calculated by dividing the total dollar amount of canceling funds billed andor de-obiigated by the total amount of canceling funds identified Source data will be obtained prior to the 15th of the following month and updated in Metrics
Manager NLT the 20th of the following month Green gt89 Yellow 80-89 Red lt80 of the funds identified to cancel at year end
YS-AlH DCMA LMFW F-35 CDDAGYOCOl Reduce Cancelling Funds
bull bull bull bull
~ltI ~ ~ ltr -ogt
FY09
bull Actual bull Target Targe IIgt
The performance commitment is rated Green for this period
Earned Value The complete EV report is attached
Appendix A - EV Assessment Criteria Rating Criteria is based on the DCMA V AC and when possible should include MR in the DCMA lEAC
Green- VACoogt-5
Yellow - -1 OltVAClt-5
VAClt-lOshyNR- Not Rated or Not Reported
For Official Use Only - Proprietary Program Data Page 25 of25
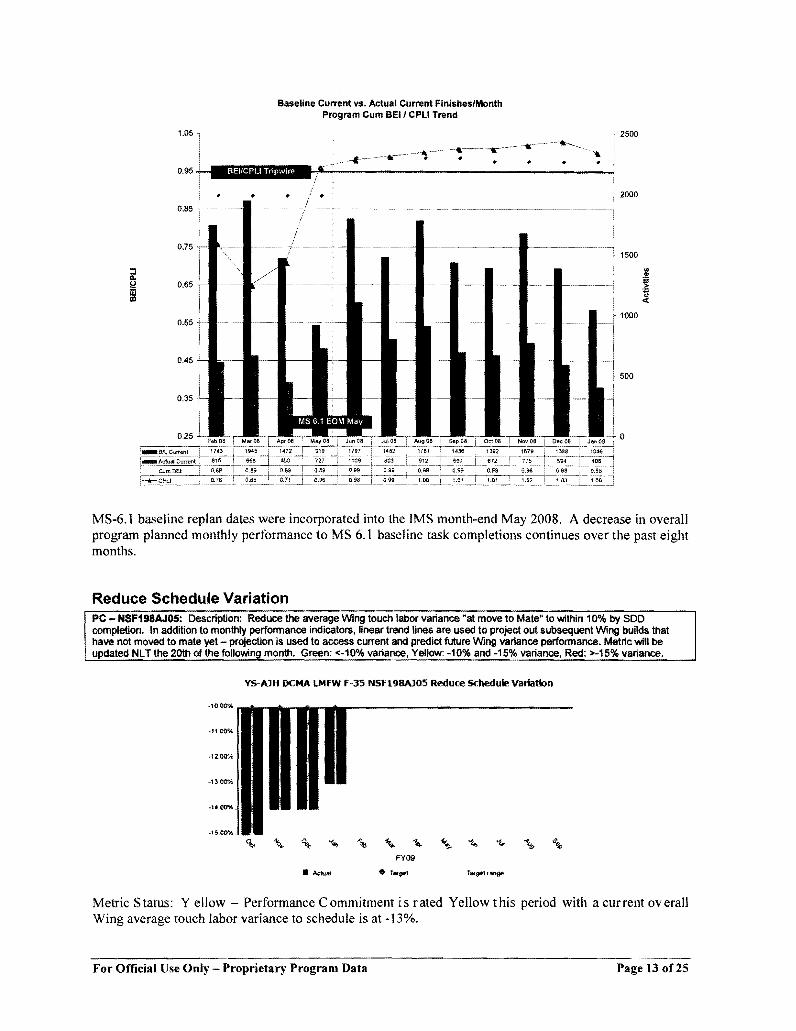


