Jointed AT Blade Jointed AT Blade Shu Ching Quek Shu Ching Quek (Presenter) (Presenter) Baehmann Peggy Baehmann Peggy Yerramalli Chandra Yerramalli Chandra Miebach Thomas Miebach Thomas Faidi Waseem Faidi Waseem General Electric General Electric Global Research Center Global Research Center
Transcript
Jointed AT BladeJointed AT Blade
Shu Ching Quek Shu Ching Quek (Presenter)(Presenter)Baehmann PeggyBaehmann PeggyYerramalli ChandraYerramalli ChandraMiebach ThomasMiebach ThomasFaidi WaseemFaidi Waseem
General Electric General Electric Global Research CenterGlobal Research Center
2 / 9/2/2009
GE Proprietary
Logistics of Transporting BladesLogistics of Transporting Blades
Key Benefits•Standardized joint design•Reduce transportation costs •Reduce escort and route
limitations•Competitive feature
Typical blade length shipping cost
Lower costLower cost
$
miles
Jointed BladeJointed Blade
Increases transportability
3 / 9/2/2009
GE Proprietary
Ongoing and Tested Concepts To DateOngoing and Tested Concepts To Date
LM, TU Delft, WMC
Enercon E-126 (7+ MW)Rotor diameter 126 m
WeightBlade Freq
Dynamic ResponseRoot Moment
Torsional StiffnessBlade twist
Tailor Blade designLimited Spar Cap Fab
Field Assembly /Maintenance
Ease of assemblySpace requirement
ReliabilityCloser to root causeshigh torque / momentIncreases fatigue risks
Joint Type
Bolted / Bonded
Bolted / BondedBolted / Bonded
Bolted / Bonded
Reference: European Space Agency PSS-03-203 Issue 1, Structural Materials Handbook, vol.1
4 / 9/2/2009
GE Proprietary
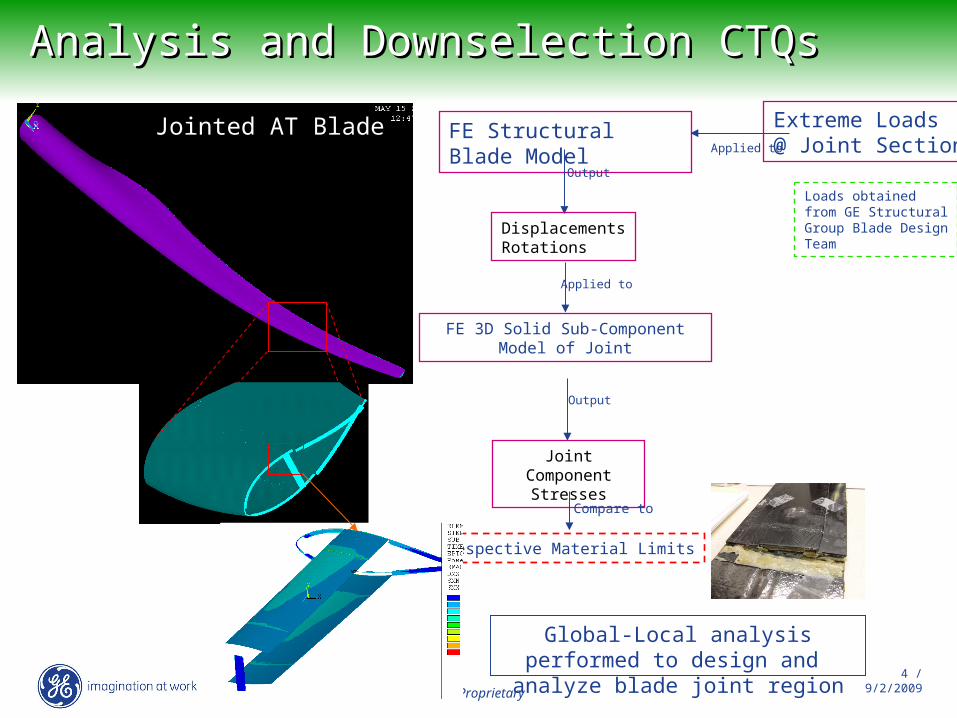
Analysis and Downselection CTQsAnalysis and Downselection CTQs
Global-Local analysis performed to design and analyze blade
joint region
FE Structural Blade Model
Extreme Loads@ Joint Section
FE 3D Solid Sub-Component Model of Joint
DisplacementsRotations
Applied to
Output
Applied to
Output
Joint Component Stresses
Loads obtained from GE Structural Group Blade Design Team
Compare to
Respective Material Limits
Jointed AT Blade
5 / 9/2/2009
GE Proprietary
Testing and Validation of Subscale Joint Testing and Validation of Subscale Joint DesignDesign
Nonjointed
Jointed
Static Spanwise
Static Edgewise
Cyclic Spanwise
Cyclic Edgewise
Blade 1 & 2 Positive Edgewise (Pulling up with LE facing up)
-0.008
-0.006
-0.004
-0.002
0
0.002
0.004
0.006
0.008
23x
24x
25x
40x
41x
42x
36x
37x
38x
46x
47x
Strain Gage
Str
ain
Analysis B1 FX 88, B1 Loc
Test B1 F2 Edge Static +45,700 lb E9 After F
Analysis B2 FX 94, B2 Loc
Test B2 F2 Edge Static +49,800 lb E13 Before F
TE TE Core LE Core LE
SBJ1 SBJ2 SBJ1 SBJ2
SBJ2SBJ1 SBJ1 SBJ2
FF FF
FF
SBJ1 & SBJ2 = 25 mm Each Side of Skin Butt JointFF = Far Field