38
Productivity and innovation in UK financial services: an intangible assets approach Discussion paper 2011/02 May 2011 Jonathan Haskel, Annarosa Pesole

Productivity and innovation in UK financial services: an
intangible assets approach
Discussion paper 2011/02
May 2011
Jonathan Haskel, Annarosa Pesole

0
Productivity and Innovation in UK Financial Services: An
Intangible Assets Approach*
Jonathan Haskel Imperial College Business School, Imperial College London; CeRiBA, CEPR and
IZA Annarosa Pesole
Imperial College Business School, Imperial College London; CeRiBA
JEL Reference: E01, G20, O47
Keywords: Productivity, Innovation, Financial services, Intangible assets
February 2011
Abstract
Financial services are typically described as highly innovative (excessively so according to some). However, it is hard to see this by many standard IO innovation and productivity measures. Patenting for financial products in the UK is zero. The R&D/sales ratio in UK financial services is 0.02%, putting finance (on this measure) less innovative than furniture manufacture (0.3%). Whilst measured labour and total factor productivity growth have been quite rapid, there are doubts over measurement and the residual nature of TFP growth leaves open the question of what drives financial innovation. This paper looks at innovation in UK financial services by trying to bring together the industry productivity/TFP literature with some of the case study evidence. Case studies suggest that much financial innovation (a) can be readily copied and (b) requires investment in product development, software, marketing, training and organisational change. Whilst copying can be captured by TFP, these investments are almost certainly not captured by conventional R&D. Thus we follow the Corrado, Hulten and Sichel (2005) intangibles framework and measure the broad range of intangible/knowledge assets that case studies suggest are important in finance. We document that these investments are very large in UK finance, and that conventional R&D understates them. Incorporating them into growth accounting shows that the method seems to capture much of innovation in financial services and changes the productivity/TFP growth picture to give more intuitive numbers.
*Contact: Jonathan Haskel, Imperial College Business School, Imperial College London SW7 2AZ, [email protected], Annarosa Pesole, Imperial College Business School, [email protected]. We are very grateful for financial support from the NESTA Innovation Index project and from the COINVEST project, www.coinvest.org.uk, funded by the European Commission FP7, Theme 9, Socio-economic Science and Humanities, grant number 217512. This work contains statistical data from ONS which are crown copyright and reproduced with the permission of the controller HMSO and Queen's Printer for Scotland. The use of the ONS statistical data in this work does not imply the endorsement of the ONS in relation to the interpretation or analysis of the statistical data. We thank Larry White for helpful comments, Rob Hunt for data and our interviewees in various financial institutions for their time and information. Errors and opinions in this paper are our own.
1
1 Introduction
Financial services is widely regarded as being highly innovative. Retail users of banks for
example, can bank online, transfer money electronically and trade exotic financial instruments
(all from their iPhone). However, the extent and social benefits of some financial innovation are
hotly contested. Paul Volker, quoted in 2009, regards Automatic Teller Machines as the most
important financial innovation. Alan Greenspan, speaking in 2002, allocated to financial
innovation much of the credit for a previously stable macroenvironment. Warren Buffett, writing
in 2002, allocated to (particular forms of) financial innovation the epithet “financial weapons of
mass destruction”. Rarely before has innovation in any industry been accused of bringing down
the entire capitalist system.1
Despite such popular interest, recent surveys bemoan a comparative lack of academic
empirical work on financial innovation: see for example, the excellent survey papers by Frame
and White (2004) and Tufano (2002). Indeed, in their comprehensive long period survey, Frame
and White (2004) were only able to find 39 empirical studies of financial innovation studying 21
separate phenomena, with six studies preceding the 1990s and 23 since 1998.
Given the gigantic IO/productivity literature on innovation in general, one might go there
first for financial innovation studies. However as Frame and White (2004) point out, that
literature, which relies on such measures as R&D, patents and labour or total factor productivity
growth (LPG, TFPG) has hardly been used in financial services. On patents, as Hall (2009)
points out, this is for good reasons; in the UK for example, regulators have ruled that financial
innovation is essentially unpatentable. On R&D, banks have the lowest R&D intensity in the
official UK official R&D scoreboard, but this uses R&D from company accounts, which only
allow software in the course of development to be counted as R&D.2 As we document below,
R&D intensity (spend over sales) measured by the UK official R&D survey puts financial
services (at 0.02%) below furniture manufacture (0.3%).3 On LPG, the UK Office for National
Statistics (ONS) say that output measurement is too unreliable for these data to be relied upon
(Vaze, 2002). In addition, since TFPG is a residual this leaves open what is driving financial
innovation (besides pure knowledge spillovers).
1 Volker’s 2009 WSJ article quoted in Litan (2010). Greenspan/Buffet quoted in Jenkinson (2008). See also Litan (2010) for similar quotes and a review of financial innovation by function and a qualitative assessment of the contribution to productivity. 2 For the US, using such accounting data Lerner (2002) reports that “for instance, neither Citigroup nor Merrill Lynch report any R&D between 1990 and 2002”. 3 This is similar for the US. US data breaks down R&D in “Finance, Insurance and Real Estate” and finds a share of sales of 0.5% in 2005, compared with 3.6% in manufacturing as a whole (http://www.nsf.gov/statistics/seind08/append/c4/at04-22.xls from http://www.nsf.gov/statistics/seind08/c4/c4s3.htm#c4s31). That puts financial R&D intensity less than half that of furniture manufacturing (0.8%).

2
Thus one important strand of the empirical literature consists of studies of particular
forms of financial innovations, suggested by, for example, interviews with market participants or
newspaper records (we label these as “case studies” for convenience). Black and Scholes (1974)
for example describe the introduction by Wells Fargo Bank of what would now be called an index
fund. Tufano (1989) considers 58 financial innovations, 1974-86, where his sample are innovative
corporate or mortgage-backed securities, as identified in literature searches or by industry experts.
Lerner (2002) documents innovation 1990-2002 via a search for particular news stories in the
Wall Street Journal. Litan (2010) list innovation types from a range of sources including
Wikipedia.
This paper attempts to incorporate (at least some of) the important findings of the case
study type work into the conventional LPG/TFPG/R&D literature to see if results in this area can
be improved. It does this expressly not to deny the importance of the detailed innovation
literature. Rather, in the light of Frame and White’s (2004) request for more empirical work in
the area, we wish to see if extending the conventional approach can yield insights. In addition,
industry-level productivity studies continue to be staple tools of the profession and statistical
authorities have a duty to collect financial services data to compile National Accounts. With this
increasing emphasis on measurement of the service sector, this study might be seen as
contributing to that literature.4
To summarise our work, we proceed as follows. Detailed work on financial services,
surveyed below, suggests a number of interesting features of financial innovation. First, much
financial innovation is due to new products and services (e.g. subprime mortgages, internet
banking, ATMs). Second, much comes from new production processes (e.g. electronic money
processing, credit scoring) and organisational forms (e.g. internet only banks) (Frame and White,
2004). Third, much financial innovation can be copied readily (Frame and White, 2004 Lerner,
2002, Tufano, 2002). Thus we need a framework that captures innovation in products,
organisational form and imitation.
What does financial product innovation need to happen? Tufano (1998) states that his
case studies indicate that a typical financial product innovation needs
“an investment of $50,000 to $5 million, which includes (a) payments for legal, accounting, regulatory, and tax advice, (b) time spent educating issuers, investors, and traders, (c) investments in computer systems for pricing and trading, and (d) capital and personnel commitments to support market-making. In addition, investment banks that innovate typically pay $1 million annually to staff product development groups.”
4 Thus on patents, we simply document that UK regulations are that patenting in financial services is more or less completely excluded, but we do comment on output measurement in finance.
3
How does all this fit into the conventional LPG/TFPG/R&D Solow-type framework? In that
framework, output comes from physical capital, labour and knowledge. As typically measured in
conventional growth accounting work, knowledge is measured by TFP. Some of the features of
the detailed studies can be captured in this framework at least conceptually (measurement issues
aside for the moment). First, such studies emphasise the importance of computers: they are part
of physical capital. Second, since products seem to be able to be imitated very quickly and
cheaply as knowledge passes very rapidly between financial firms, this can in principle be
captured by TFP.
However, these case studies suggest that at least some innovation is not free but requires
up-front investment in new knowledge. In Tufano’s example above, this is outside conventionally
measured R&D, since it is investment in software, product development time for employees,
marketing the product, training staff and changing organisational form.
Thus our key argument in this paper is that whilst the productivity/growth accounting
framework allows for spending on tangible capital, it needs to be extended to spending on
intangible capital, which is what detailed studies suggest financial innovation involves. Central to
much of the work of Grilliches (1999) was just this idea, with an emphasis on R&D. But the
examples above suggest we have to consider spending beyond just that of R&D. This is exactly
what the recent contributions by Corrado, Hulten, Sichel (2005, 2007), applied to the macro
economy, do. They argue that knowledge spending should embrace a broad range of investment
in knowledge assets, as well as R&D, software, marketing, training, organisational capital and
that incorporation of such spending should improve our understanding of growth by, for example,
explaining much of the unexplained residual TFPG.5
The purpose of this paper is then to apply the CHS framework to see if it gives a more
informative picture of innovation and growth in financial services. To the best of our knowledge,
this is the first paper to do this. Of course, in so doing we have to rely on a number of
assumptions regarding e.g. measurement, returns to scale, competition etc. Thus we regard this
paper as an initial exploration into whether it is worthwhile for future work to examine these
issues.
We feel we contribute to the literature in two areas. First, we try to quantify investment
in intangible assets in the financial sector, using a mix of available surveys and our own small
survey of firms. Second, we present growth accounting results incorporating such measures.
5 Some of these categories are now counted in the official data as investment, notably software. Software was only fully integrated as investment into the UK National Accounts in 2005 however. R&D will be integrated in 2012. .

4
Clearly the latter approach relies on additional assumptions and measurement issues such as
measured output in finance6 (and the impact of the crisis) which we discuss below.
We use UK data in this paper. We believe the UK to be interesting in this regard since it
is one of the world leaders in financial services and so a test-bed for this framework. It was the
first country, for example, to install an ATM.7 In addition, there are many foreign banks in the
UK and to the extent they share technology studying the UK might be insightful for other
countries.8
We obtain a number of results. First, in applying the framework to financial services we
have also to apply it to the rest of the economy (to solve endogenously for rates of return to
compute consistent intangible and tangible capital rental rates). Thus we start by comparing
(broadly defined) knowledge investment in financial services with the rest of the economy. As
discussed above, financial services accounts for a very small share of total measured R&D spend,
but it is a disproportionately9 large spender on other intangible assets: in 2006, 22% of all
software spend, 17% of all marketing spend and 19% of all organisational capital spend. Using
the wider definition then, financial services is actually very “innovation spending” intensive,
contrary to the view if one just used measured R&D.
Second, if the conventional measure of R&D is inappropriate for financial services, we
need to develop a new one. We do this by following the standard method for measuring own-
account software10. Using the labour force data, we identify “research” type occupations, where
we assume that such occupations produce a knowledge asset, like a new product. We then infer
spending on “R&D”, in this case, knowledge development in firms, from costs of these workers.
We attempt to validate these assumptions with data from interviews with major financial firms.
Such spending turns out to be around £1bn for 2006. Relative to the official R&D measure, of
around £20m, this is much larger, although it is small relative to software spending of £4.1bn.
Third, we then estimate the contributions of all these assets to LPG (measured as annual
growth in gross output per hour) and the resulting TFPG. Taking no account of intangibles (i.e.
spending on knowledge assets such as R&D spend, software, product development etc), LPG in
financial services, 2000-05 is 2.94%pa (against 3.02%pa in retail and 3.79%pa in manufacturing).
6 As we set out below, this remains unsettled, conceptually and empirically. We cannot do justice in one paper to all the issues involved, thus to summarise, our approach here is pragmatic, namely to use the available data and try to set out the biases that might be involved. 7 In 1967, by Barclays Bank in London (the first McDonalds in the UK opened in 1974). 8 The Office of National Statistics states that in 2009, 34% of GVA in financial services was foreign-owned. 9 Financial services value added is about 11% of the market sector and employment 5%, see tables below. 10 First, occupations are identified that are part of the creation of software (e.g. software engineers and programmers, IT managers). Second, estimates of wage bills using occupational data are computed. Third, the wage bills are multiplied by a fraction of time spend on long-lasting software creation (e.g. this is 50% for software professionals and 15% for managers) and another fraction for overhead costs (1.6). The resulting number is an estimate of the “R&D” costs that firms incur in producing own-account software and these numbers are added to purchased software from surveys (for the UK in 2004, own-account and purchased software came to around £10bn each).

5
Capital deepening is around 12% of LPG in finance, almost all of which is due to ICT capital.
TFPG in financial services is 1.39%pa, about 1½ times manufacturing and 2½ times retail, and
around 50% of LPG, (TFPG is 23% of LPG in manufacturing and 20% in retail).
When we incorporate intangible capital, the picture changes. First, a much larger fraction
of LPG in financial services is accounted for by capital deepening, 26%. Second, rather than all
of such capital deepening being due to tangible ICT capital, around half of it, with the other half
due to intangible capital deepening. The bulk of intangible capital deepening is from software
and organisational capital. The contribution of software (0.14%pa) in finance is larger than that of
manufacturing and retail (both 0.08%pa), according with the intuition that software-related capital
deepening is important in financial services. The contribution of organisational capital (0.15%pa)
is similar to that in other sectors, but a higher fraction (around 5%) of LPG. Hardware is also
very important in financial services, with half of capital deepening due to hardware (in
manufacturing and retail the figures are 8% and 31% of total capital deepening), again suggesting
the importance of ICT in the sector. Indeed, the sum of hardware and software contributes 20%
of (gross output) LPG in financial services as opposed to 14% in retail and 5% in manufacturing.
Finally, TFPG in finance is still twice that in manufacturing and 2½ that in retail, but 29% of
LPG, thus allowing us to account for much more of LPG when intangibles are included. So, if
one scores “innovation” in industries as the fraction of LPG accounted for by intangible capital
deepening and TFPG, financial services are the most innovative (44%), followed by
manufacturing and retail (34% and 26%).
In sum, whilst there is clearly more work to be done relaxing assumptions etc., and we
present a number of robustness tests, we think these findings offer a more complete picture than
much of the previous work that either relegated all knowledge to TFP or just used R&D and they
accord with much of the findings in the detailed industry-specific studies.
The rest of this paper proceeds as follows. The next section reviews the literature on
financial innovation. Section 3 sets out our data on knowledge capital in financial services,
section 4 our growth accounting results and section 5 concludes.

6
2 Previous work on financial services innovation
In this paper we seek to measure productivity and innovation in financial services via a growth
accounting method. We stress very strongly that this method is but one contribution to a
literature which will rightly draw evidence from a number of methods. So the purpose of this
section here is to better understand how this method will fit with other methods, and its relative
advantages and disadvantages.
Frame and White (2004), in an exhaustive survey, document that there are very few
empirical studies of financial innovation, a conclusion supported by Lerner (2002) and the survey
of Tufano (2002). In addition, they argue there seems to be no single preferred categorisation of
either research method or innovation category.
To start, perhaps the most straightforward, and venerable, approach to innovation is to
categorise innovation by product. For example, Tufano’s survey of financial innovation
documents that lists of security types have been collated since at least the 1930s. He himself also
sets out a list, from 1980 to 2001, of new securities. As he mentions, this is but a small amount of
innovation in the field and many securities on such a list are near-identical products by different
banks. In a similar vein, Lerner (2002) documents innovation 1990-2002 via a search for
particular news stories in the Wall Street Journal.
Another approach is case studies. Black and Scholes (1974) describe the introduction by
Wells Fargo Bank of (what would now be called) an index fund, the innovation being a product
enabling investors to hold a share collection but economising on the transactions costs of buying
every stock individually. Black and Scholes (1974) emphasise the high up-front costs of the
product; that Wells felt they needed to spend $60m to go ahead with the fund and also discuss the
high costs of marketing and selling the product.
Tufano (1992, page 25) discusses Exchange Traded Funds and personal funds (the latter
being a follow-up to index funds, essentially allowing trading in the market index during the
trading day with fractional shares). He comments that although the motivation to offer diversified
baskets is old, “..it is technology, embedded in improvements in information technologies, that
permit personal funds to be technically feasible. Technology may enable these innovators to
market these products via the web as well as execute transactions at low costs.” This example
emphasises the blend of ICT, new since Black and Scholes, and the required coinvestment in
marketing, not so new.
Tufano (1989) considers 58 financial innovations, 1974-86, where his sample are
innovative corporate or mortgage-backed securities, as identified in literature searches or by
industry experts. He has a number of interesting findings in relation to our growth accounting
approach here. First, reports that bankers estimate that developing a new financial product

7
requires “an investment of $50,000 to $5 million, which includes (a) payments for legal,
accounting, regulatory, and tax advice, (b) time spent educating issuers, investors, and traders,
(c) investments in computer systems for pricing and trading, and (d) capital and personnel
commitments to support market-making. In addition, investment banks that innovate typically pay
$1 million annually to staff product development groups with two to six bankers.” Like above,
this emphasise the coinvestments needed in innovation around the pure notion of a new product
Second, he estimates that imitation of the innovative product is typically very fast: the mean
number of days until a rival entered with an imitative product was 77.6 days, and 35 of the
products surveyed were imitated within a year of initial marketisation.
Frame and White (2004) categorise classes of innovation by purpose11 in the financial
system. First, they discuss new products (e.g., subprime mortgages) or services (e.g., ATM, debit
and pre-paid cards and internet banking for transactions). Second, new production processes.
Examples included credit scoring, the electronic processing of payments, asset securitization and
new methods of risk management, helped in turn by advances in IT and financial theory. Finally,
they discuss new organizational forms (e.g., Internet-only banks).
Lerner (2006) sets out some reasons why innovation in finance might be very different
from that in manufacturing. First, he argues that financial innovation is unlikely to be
appropriable. Patents in finance have only been introduced very recently (in the US), are
essentially unpatentable in the UK (Hall, 2009), and hence new product ideas are diffused very
quickly.12 Indeed, he finds, in his analysis of financial innovations 1990-2002, spillover effects
with more financial innovations occurring when there are more innovations in the two-digit zip
11 There is no one way of classifying innovation in finance. Mayer (1986) surveys innovation by (a) new instruments and (b) changing practices and structures (such as cross border banking: his survey was written before the internet). Merton (1992) sets out functions of a financial system namely (1) moving funds across time and space; (2) the pooling of funds; (3) managing risk; (4) extracting information to support decision-making; (5) addressing moral hazard and asymmetric information problems; and (6) facilitating the sale of purchase of goods and services through a payment system. Tufano (2002) says that innovation in finance exists for the following reasons: 1. inherently incomplete markets. 2) Innovation persists to address inherent agency concerns and information asymmetries: (3) Innovation exists so parties can minimize transaction, search or marketing costs. (4) Innovation is a response to taxes and regulation: (5) Increasing globalization and risk motivate innovation. (6) Technological shocks stimulate innovation: he then documents some innovations that, in practice cross over all these motivations. Litan (2010) sets out the four key functions of finance: payments, saving, investment, risk bearing. 12 Lerner (2002) reports the following on US patents. In the US and UK business methods had not been considered patentable. In the US, this changed with the Signature decision. Signature had a patent on a software program to determine the value of mutual funds. They successfully defended the patent and it appears that business methods can be patented. Despite this, at the time of his paper, patenting was not widespread. For example, universities and academics had patented 4 innovations. However, the position is different for the UK, as reported in Hall (2009). “In the UK, for example, the Patent Office introduced special treatment for business method applications in November 2004, due to the increasing number that had little or no chance of being granted (MIP Week 2004). In so doing, the Director cited applications from Fujitsu for optimizing the scheduling of airline crew, and a system for managing a debt-recovering process as being inherently unpatentable. In general UK practice with respect to software patents is viewed by practitioners as more restrictive than that at the EPO (MIP Week 2007).”
8
code. Second, much innovation is due to regulation, particularly with respect to taxes. Third,
collaboration is likely to be particularly important for example in the syndication of securities.
How does all this fit in with our approach? To stress again, we do not claim that our approach is
better than others, but wish here to “stress test” our approach by seeing what elements of other
approaches it can and cannot incorporate.
First, there seems much evidence of spillovers: e.g. the banks offering “near identical”
securities in Tufano (1992), very fast entry in Tufano (1989), limited use of patents and use of
collaboration (Lerner, 2002). All this suggests that one needs a framework which accommodates
spillovers as a source of knowledge. In terms of our approach, TFPG will be important in
growth.
Second, although there are spillovers, we also have direct evidence that innovation
requires investment. The most direct evidence is that from bankers themselves summarised in
Black and Scholes (1975) and Tufano (1988). Such spending is of course ICT related, computer
hardware for example. Frame and White’s list of innovations, for example, credit scoring,
electronic money transfer and internet banking seem especially IT-intensive. So it will be
important to measure this and, given the quality-changes in IT, quality adjust for IT. But such
innovation investment is not just pure product development (which might be thought of as
“R&D” in a manufacturing context) but also marketing, organisational change, and within-
company training.
Third, and related, such innovation spending is almost certainly not captured by reported
R&D. The UK accounting rules exclude almost all of the headings above (only some software is
allowed). Reporting rules for the ONS R&D survey exclude software, marketing and training.
Fourth, and similarly related, if knowledge can easily spillover and so first-mover
advantage is particularly important, this suggests that much innovation will be developed in
house. Thus it will be not captured in standard business spending surveys that typically ask about
purchases of investment goods: such surveys are typically well suited to tangible investment
(computers are not made in-house by banks) but not intangible investment.
There has of course been much work on financial services output since the National
Accounts has to incorporate financial services when measuring GDP. This work is somewhat
unappreciated, perhaps because it is behind the National Accounts scenes and perhaps too
because it is recent (so for example, the new measures of financial services were incorporated
into US National Accounts in 2003 and in the UK in Summer 2009). Such work is summarised
most recently in Fixler, Reinsdorf and Smith (2009), but draws on previous work surveyed in, for
example, Triplett and Bosworth (2004) Fixler, Reisnsdorf and Smith (2003) and Fixler and
Zieschang (1999). Perhaps the easiest way to see this work is to view banking as providing a
stream of financial services rewarded by explicit charges and margins. The calculation of the
margin is the typical issue and different views are set out in Wang (2003) and Basu et al (2008),

9
see also the survey in Schryrer (2009). We shall not attempt to adjudicate on such arguments, but
use the official UK data, and note the relevant caveats for our approach, which is reviewed in
Section 4.
Recent papers that apply growth accounting to UK financial services include Basu et al
(2003), whose main focus is retailing, and Haldane, Brennan and Madouros (2010). The latter
paper uses, as we do, EUKLEMS data, although value added and without intangibles. They
document high TFPG in banks relative to other sectors and show a falling share of physical
capital in total capital for the financial sector. Since we include here intangible capital, our
capital shares rise between 2000 and 2006, see Table 5 below. They also argue that output of
banks is likely misstated if risk is mispriced, which we discuss below.
3 Knowledge investment in UK financial services
3.1 Industry definitions Table 1 sets out our industries of interest. The first three columns show the relevant UK SIC
codes by letter and number and description. In the paper below we will contrast our data with the
official Business Enterprise R&D data (BERD), and the fourth column shows the industry
breakdown which they report, namely “AD” defined as “Miscellaneous business activities;
Technical testing and analysis”. As the table shows, the BERD category covers most of the J to
K sections, with the exception of SIC72 “Computer-related activities” and SIC73 “Research and
development” which are separate classifications in BERD. The final column shows the industries
that our paper covers. We present industry analysis for “financial intermediation” and “business
services” separately. It will be important in our productivity analysis to note that we omit sector
70.2 “letting of own property” which has imputed rents included in it, for we do not measure
household dwellings in our capital stock.
3.2 Spending on product development in financial services The case studies suggest that financial service firms have to spend on product development.
Hence our requirement here is to try to measure such “R&D” spending. To compare such
spending to the official data, we go to the labour force data on occupations and following the
OECD software method, try to identify such occupations who are carrying out research activities.
This was the approach taken to US financial services by Hunt (2009) and so our choice of
occupations is informed by this and interviews with financial firms. The UK Standard
Occupational Classification (SOC, 2000) has nine “major occupational groups”.13 The
13 The major groups in SOC (2000) are: 1 “managers and senior officials”, 2 “professional occupations”,3 “associate professional and technical occupations”, 4 “administrative and secretarial occupations”, 5

10
occupations which perform routine administrative and manual activities are SOC (2000) major
occupational group codes 4 to 9, which we exclude. We also decided to exclude “financial
technicians (brokers, analysts, adviser, etc)” (these occupations are in major group 3) since we
judged that they mostly do sales rather than research. This leaves us with “managers and senior
officials”, major occupational group code 1, “professional occupations” major group 2 and
“associate professional and technical occupations” major group 3. We discuss group 1, managers
below, but here we discuss group 2.
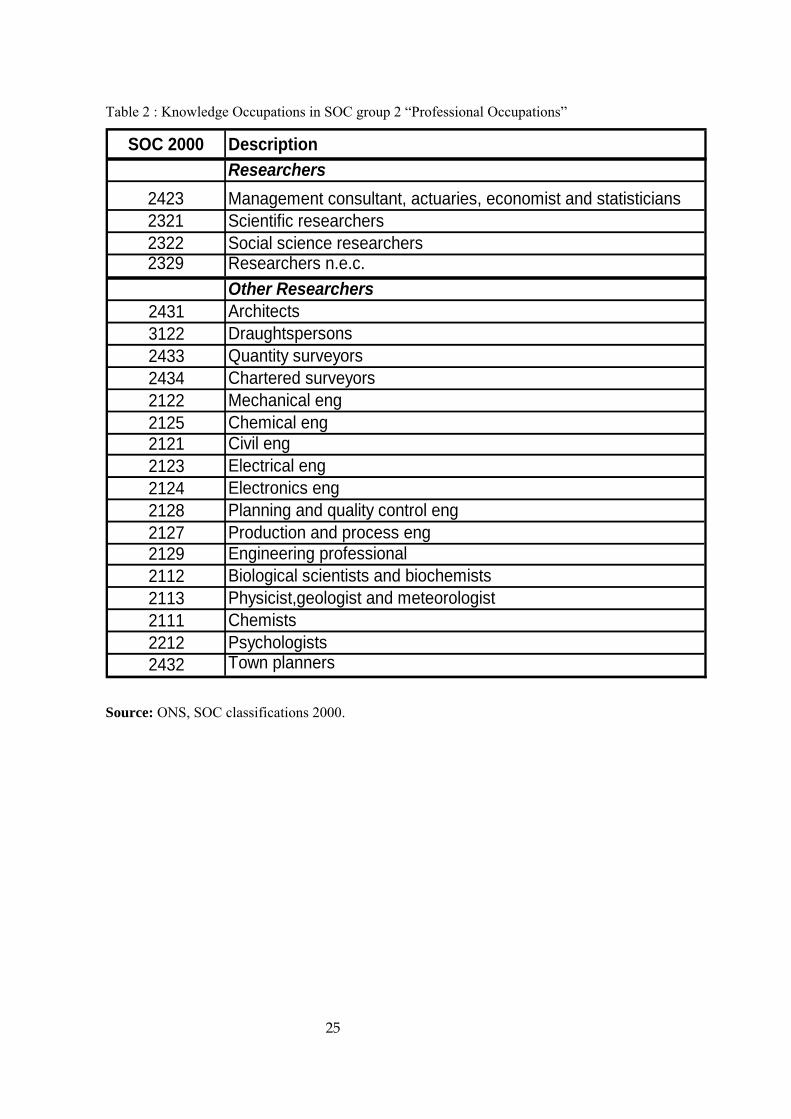
Table 2 sets out the detailed occupational headings under the broad headings
“researchers” and “other researchers”. Researchers are those whose occupational title seems to
correspond to the type of occupations one would expect to be designing new products, carrying
out analysis and building knowledge capital in financial services, most notably “management
consultants, actuaries, economists and statisticians” (who turn out to be much the largest group).
We also include scientific and social science researchers. “Other researchers”, consists of a rather
disparate group of engineers and other professionals who one might expect to be knowledge
creators. In practice, this is a small group, but we set these out to facilitate the comparability of
this work to similar work in the US carried by Hunt (2009).
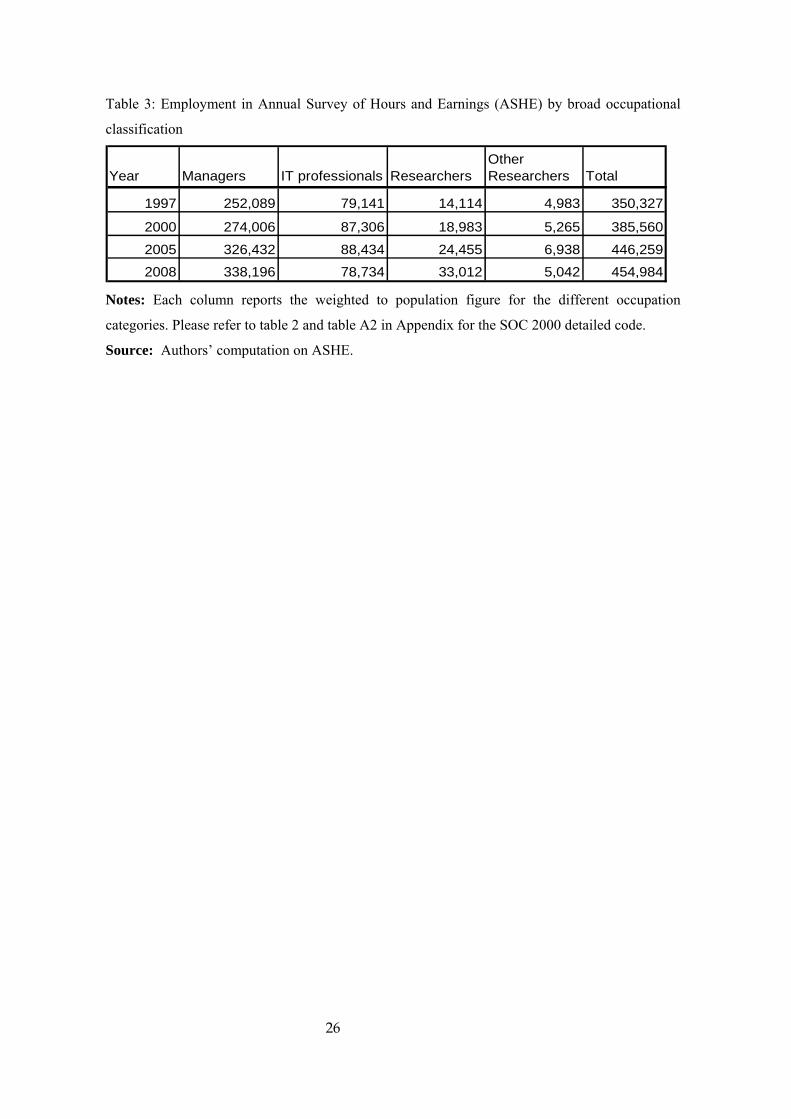
Table 3 reports employment data for these occupational groups, with managers and
software professionals added in the first two columns for comparison.14 It is worth noting that
“researchers” and “other researchers” are relatively small compared to IT employees in financial
services, suggesting IT is a significant part of innovation in finance.15
“skilled trades occupations”, 6 “personal services occupations”, 7.”sales and customer services occupations”, 8 “process, plant and machine operatives”, 9 “elementary occupations”. 14 For software we follow the ONS method that has been built up with industry consultation. Whilst some of what software workers do is likely short-lived, for example fixing bugs and day-to-day advice, some activities, particularly writing code, is likely creating a long lived (knowledge) asset. Our interviews with financial firms have indicated for example, that many buy in software and then use their own in-house software specialists to modify it. Official ONS data includes these types with, in addition, other ICT staff such as technicians. CHS also have an intangible category called “organisational capital”, which they assume to be 20% of the wage bill of managers (see below for tests of robustness to this). Thus we follow them in assuming the following. First, one might measure management consulting services bought it, to the extent that they are helping firms in organisational innovation. Second, some fraction of managerial time might be spend on “in-house” development of organisations. Of course, a manager likely builds up experience etc. which is embodied in themselves, but firms have a clear incentive to try to capture and codify at least some of this knowledge, not least because managers might leave. 15 Employment by occupation is complicated because of two different sources of employment data, the ASHE (Annual Survey of Employment and Hours) and the LFS (labour force survey). The ASHE is a sample of 1% of workers whom have a National Insurance number ending in a certain 2 digits. Employers fill out the survey and report occupation and wages, information on which is then weighted by ONS to be nationally representative. The LFS is a quarterly household survey where workers self-report wages and occupation. Relative to the ASHE, the aggregated employment data from the LFS is sometimes argued to be more accurate, whilst the wage and occupation data to be less accurate, the latter because there is considerable poor reporting in the wage data e.g. for respondents if householders are absent when the surveyor calls and likewise for occupations. In data available on request, we explored both surveys. Managerial employment and researchers are quite close, whereas the LFS has more software.

11
How do these employment numbers compare with official R&D employment? The
BERD reports, for 2005, for the UK whole economy, 77,000 scientists and engineers working on
civilian R&D and 17,000 working on defence (with respectively 24,000 and 2,000 and 25,000
and 4,000 “technicians, laboratory assistants” and “admin and clerical staff”). Now, for sector
AD, which includes financial intermediation, miscellaneous business activities and technical and
testing analysis the data are a total of 6,000, consiting of 3,000 scientists, and 2,000 technicians
and 1,000 admin. Our numbers, see Table 3, are of course very much higher than this, with over
30,000 “researchers” and “other researchers” in 2005 in Financial Intermediation (which as Table
1 shows is but part of BERD industry AD).
Having chosen the occupations we believe are potential “knowledge” occupations we are
now in a position to estimate implied spending on broad knowledge, or “R&D”. To do this, we
adopt the software method by taking the wage bill and assuming (a) the fraction of time each
occupation spends on research activities (b) the mark-up on wage costs (due to overheads and
ancillary costs) that firms incur on such workers. The resulting figure gives the “own-account”
spending on broad knowledge activities. The method mirrors the spending in the official R&D
survey, which asks for spending on R&D employees, including taxes, plus capital stock
associated with such spending and other ancillary costs.
Establishing the fractions in (a) and (b) is a matter of ongoing research. Our data for
overheads uses the standard assumptions in software (1.6). Turning to (a), we note that for
software the official data uses the results of industry consultations, cross-checked with other
countries and uses for example, a figure of 50% for software professionals and 15% for managers.
The fraction of time spent by research occupations in financial has not been examined
systematically thus far by official data. We therefore undertook our own preliminary surveys as
follows. First, we were given access to an unpublished study of time allocation undertaken by the
Council for Industry and Higher Education (2007) for the London office of a very large US-
owned investment bank. This covered a number of different grades and occupations and
suggested a figure of 50% for researchers, that is, 50% of their time is spending on asset-building
activities. Second, we conducted interviews with two other London-based major banks and found
a similar kind of figure. Clearly more needs to be done here, although since banking is so
concentrated we have covered a rather large fraction of banks even with just a small number of
firms. Thus we shall use a figure of 50%, but we shall of course experiment with altering this
figure in growth accounting below, it turns out to not make too much difference.
So what are the final numbers and how do they compare with the “official” R&D
spending data? Table 4 sets this out. Column 1 and 2 shows our implied R&D investment from
the wage bill data for selected years due to researchers and “other researchers”. Columns 3 to 6
are the data on software and organisational capital, purchased and own-account where own-
account organisational capital is 20% of managerial wages and salaries in managerial occupations

12
applied consistently across industries and the software data are official ONS data. As the data
show, spending on other researchers is not large. But spending on researchers is about a quarter
of total spending on software in recent times, but both less than spending on organisational
capital.
Finally, for comparison columns 7 and 8 set out two other figures for R&D in financial
services. In column 7, we show R&D from the Department for Business Innovation and Skills
(BIS) R&D scoreboard publication, giving R&D reported in company accounts16. This is
£0.86bn, being 0.45% of sales (see the lower panel). By a remarkable coincidence this number is
very close to our research occupations-based numbers. But it is well below official software
investment, which accords with the point that only some software is allowable to be capitalised as
R&D in company accounts.
Column 8 sets out our estimates of R&D spend as measured by the ONS BERD data.
The reported spend covers both financial and some business services, so the numbers in the table
are our best estimate of the part accounted for by financial services.17
What conclusions can we draw from this? First, the BERD data suggests a “research”
spend of about 1/100th of that from the researchers evidence. So “research” spend, we believe is
underestimated by the BERD: instead of being 0.01% of sales in 2006, it is 0.52% of sales.
Second, spending on other knowledge assets is considerable; in 2006 software investment for
example is 2.09% of sales.
16 According to the BIS Scoreboard (2008) notes, the only type of R&D capitalised by banks is investment in the development of internally generated software. For a comparison see their figure 8 where R&D as a fraction of sales in banks is very low (figure 8, p20). 17 This allocation is rather complicated for it is hard to know how firms in industry J report when they report their R&D to the ONS. First, the R&D definition in the Frascati manual upon which BERD draws has changed somewhat over the years, with pre1992 excluding pretty much all R&D in financial services. Second, whilst in recent years the opening part of the form has asked for R&D not mentioning the word scientific, the final part asks firms to report scientists, technicians and related administrative workers, a classification that might make financial institutions not report their R&D work. At any rate, as set out in Table 1, the reported BERD R&D data is for is reported for sector AD which consists of industry J, SIC65, 66, 67,70 and 71 (financial intermediation, pensions, and auxiliary activities, real estate and renting of machinery) plus SIC74 (other business activities). There are a number of reasons to suppose that quite a small proportion should be allocated to J. First, ONS informed us that a very small number of financial firms actually returned the BERD, too small to pass disclosure (that is, under 10 firms). Indeed, the ABI, which forms the sampling frame for the R&D questionnaire was not sent to financial service firms and so another survey was required to form the sampling frame. Second, the R&D survey (until 2009) asks respondents to allocate employment into that covered by scientists, technicians and other R&D-related administrative areas. If we duplicate these classifications, using the Standard occupational codes from the ASHE for SICs 65to71 and 74, we find that 95% of total wage bills comes from scientists employed in SIC74 (and 92% of technicians, but the bulk of technicians in Sector J are in the “not elsewhere classified” part of the technicians’ occupation classification). Thus we decided to allocate 5% of the BERD spending for BERD sector AD to financial services. That figure, for 2006, is about £19m (allocating by total employment gives £92m).
13
3.3 Spending on other knowledge activities in financial services Following CHS (2006) we distinguished between three main classes of intangible assets: i)
computerised information (software and databases); ii) innovative property (R&D, mineral
exploration, copyright, product development in finance, design) ; and iii) economic competencies
(branding, firm-funded training, organisational investment).
Computerised information (computer software, both purchased and own-account, and
computerized databases) are already capitalised in the National Accounts and we use this data.
Innovative property consists of the headings. For scientific R&D, as mentioned before, we use
BERD, where to avoid double counting of R&D and software investment, R&D spending in
“computer and related activities” (SIC 72) is subtracted from R&D spending.18
Design is a major category in aggregate, where we collect purchased data from IO tables
and own-account data from architects and designer occupations (who are mostly “architects” and
“design and development engineers”, (SOC 2431 and SOC2126) and “designers” minor group
SOC342)19. By this method, financial services has almost no own-account spending, since almost
none of these occupations are in financial services. However, the input/output tables reveal quite
considerable purchases of design and architectural services; around 2/3rds of that in
manufacturing. Upon further investigation, it turns out that almost all of such purchases are by
the insurance sector. Further work will need to use interviews with major insurance companies to
probe this spending more, but for the moment we shall regard this spending as particularly
uncertain knowledge investment, but experiment with setting it to zero in the growth accounting
exercises. Results are presented in the appendix.
The final group of intangible spending is economic competencies. Advertising
expenditure is estimated from the IO Tables by summing intermediate consumption on
Advertising (product group 113) across all industries. Firm specific human capital, is estimated
from cross sections of the National Employer Skills Survey (NESS 2004, 5) and a one-off survey
from 1998. Finally, investment in organisational structure relies on purchased management
consulting, on which we have used the Management Consultancy Association (MCA), and own-
account spending. Such own-account spending is hard to measure, and so we have taken,
following CHS, 20% of the value of managerial time. Such a time allocation is clearly arbitary,
and it requires more data, but for the moment we note the following. First, we report below
robustness checks to different assumed time fractions. Second, regarding managerial time, we do
have two (albeit small) microdata surveys on intangible investment, set out in Haskel and Pesole
18 Other items that do not affect financial services are mineral exploration, and copyright and license costs all of which are already capitalised in the National Accounts, thus we use ONS Gross Fixed Capital Formation (GFCF). R&D in social sciences and humanities is estimated as twice the turnover of R&D in “Social sciences and humanities” (SIC 73.2), where the doubling is assumed to capture own-account spending. 19 We left out other engineers in case of double counting with R&D.

14
(2009) and Barnett (2009). These papers use, respectively, intangible spending from the ONS
pilot Intangible Investment Survey, carried out in Summer 2008 and the Warwick/Aston survey,
carried out in Summer 2009. In both those surveys, respondents were asked directly about
spending on organisational capital, including asking them to estimate managerial time. In both
cases, the spending figure is remarkably close to the derived figure assuming 20% of managerial
time. At the time of writing the new extended ONS survey, that asks companies for spending on
all intangible assets is in the field, so this will provide vital extra information. Our current
starting point is at least in line with the current data on this area.
Table 5 sets out the share of investment in the particular asset in the indicated industry as
a share of total investment of the same asset in the total market sector, with, in the lower panel,
shares of value added and employment shown for comparison. Thus, looking at column 1 for
example, in 2000, manufacturing accounted for 19% of software investment, 79% of R&D
investment, 32% of design etc. Financial services is much less R&D intensive (R&D here
includes our imputed R&D figure based on occupations and official R&D figure from BERD) but
very software intensive, accounting for 21% of all market sector software investment. This is
considerable bearing in mind the size of financial services, see the lower panel of Table 5.
Likewise, there is a large share of investment, relative to employment or value added share, in
brand equity and organisational capital.
3.4 Conclusion: how much does financial services invest in knowledge? Our overall conclusions are then as follows. First, the official R&D on R&D spend in financial
services indicate spending as a proportion of sales to be 0.01% (in 2006). Based on our
calculations of research-type occupations, we have a figure of 0.52%, suggesting the official data
underestimate product development spending. Second, as the case studies suggest, financial
services spends very intensively on other “intangible/knowledge” assets. Despite financial
services being 5% of employment, it spends 22% of total market sector investment in software,
17% on branding and 19% on building organisational capital.
15
4 Productivity growth and innovation in financial services
revisited
4.1 Output values and price indices in financial services Our output data is taken from the EUKLEMS dataset, see Timmer, O'Mahony and van Ark,
(2008). This dataset gives consistent data on output, labour and tangible capital input for many
UK industries, is widely used and based on National Accounts conventions. Appendix C sets out
a model explaining some of the key measurement issues and UK practices to better understand
the example the exchange between e.g. Bosworth and Triplett (2004), Fixler (2004), Diewert
(2007), Basu, Fernald and Wang (2007) and Scheryer (2007) on the conceptual issues.
The EUKLEMS measure of output in financial services follows the ONS method which
is a combination of value and volume measures (60% of financial services value added) and
deflated FISIM (Financial Intermediation Services Indirectly Measured, the remaining 40%)).
The value measures include bank fees charged and volume measures include volume of cheques
transacted, insurance policies written and stock exchange transactions (see Williams, Fender and
Drew, 2009, Table A1). FISIM is designed to measure services that are not directly charged for
and so are implicitly priced by means of bank margins. For example, storing money safely in a
bank vault is typically not charged for explicitly in the UK, but is presumably covered in the
margin between with the bank rewards lenders and charges borrowers. In the UK, FISIM is
calculated as the differential between the interest rate charged on loans or paid out on deposits
and a “reference” or risk-free rate, see Akritidis (2007); for a criticism of this approach as applied
to UK data, see Haldane, Brennan and Madouros (2010).
Whilst this area remains controversial, for the purposes of the current investigation, we
shall proceed to use the data as measured. This is for a number of reasons. First, in practice the
chain weighting of the interest differential, large volume of loans and deposits and 40% weight of
FISIM make almost all the variation in bank output due to variation in the directly measured part
of output (Akritidis, 2007). So whilst the level of financial services output might be missated by,
for example, the inappropriate choice of reference rates, growth rates are not likely to be greatly
affected. Second, we use all UK industries EUKLEMS to do growth accounting, since we solve
endogenously for the economy-wide rate of return that equalises capital rental prices and ex post
profit shares (Oulton, 2008). Thus making substantial output adjustments to one sector would
involve having to adjust many other sectors as well.

16
Third, our data end in 2005 before the financial crisis which makes comparisons of, for
example, interest margins problematic when interest rates are at a lower bound. One might argue
that our output measures overstate financial services output ex post if the value of the loans that
banks made have now turned out to be greatly overstated, but, as the appendix sets out, capital
gains and losses are not counted as bank output.
Fourth, there have been well documented wage gains at least in the upper echelons of
financial services, although not in bank retailing. This is picked up in our data in a number of
ways. First, to the extent they reflect better educated and trained workers they show up in our
quality of labour and training data. Second, our imputed R&D data are based on wages excluding
bonuses (since this is all that the ONS make available). Third, to the extent that high wages
reflect rent-extraction, then the weight on labour in our growth accounting will be too high and on
capital too low, biasing our results against finding any impact of intangible and tangible capital.
Finally, there is a (little-known) issue to do with the deflator used to get a volume index
from the value measures. This is set out in Williams, Fender and Drew (2009). FISIM is deflated
by the GDP deflator. The bank fee indicator is deflated by, in Banks and Building Societies, the
“average earnings index AEI for Financial Intermediation, excluding bonuses – adjusted for
changes in productivity”. This reflects the unavailability of adequate price indices, and so the
average earnings index is used instead with the assumption that the price of output is largely
dependent on the price on the main input, labour, with the price adjusted for assumed changes in
productivity. There are a number of issues here however. First, the index excludes bonuses for
lack of data. This could be a substantial distortion depending upon how widespread bonuses are
in the sector. Second, the productivity adjustment to the deflator of course automatically confers
some productivity growth to financial services by construction, which turns out to be 0.44%pa.20
20 ONS have reported to us that the productivity adjustment used is taken from the growth in GVA per Job for ‘Total Services’ (G-P), as published in the ONS First Release and is incorporated: Deflator growth = ((AEI growth - Prod growth) where AEI is average earnings index and Prod Growth service sector productivity growth. To get some idea of this adjustment, average growth in the AEI for Financial Intermediation (excl bonuses) is 3.7% from 2000-08. Average growth in labour productivity for total services over the same period was 1.7%. Since 26% of monetary intermediation (65.1: Banks & BS) is deflated by this adjustment, then the everything else remained constant, real output in this sector would grow by 026*1.7%=0.44%pa purely from the assumed productivity adjustment.

17
4.2 Productivity growth with intangibles: theory We now apply these ideas to the productivity growth data. For a full discussion, see Corrado,
Hulten and Sichel (2004, 2006). Define the accumulation of tangible and intangible/knowledge
capital as follows
TAN TAN TAN TAN
INTAN INTAN INTAN INTAN
K I KK I K
δ
δ
Δ = −
Δ = − (1)
where KTAN is tangible capital stock (i.e. plant, machinery, industrial buildings, vehicles), ITAN
investment in KTAN and KINTAN, intangible capital stock (i.e. stock of knowledge in software,
design, reputation, training, organisational capital etc.) , and investment in intangibles IINTAN. If
we suppose a consumption sector, producing final consumers goods from stocks of labour,
tangible capital and intangible/knowledge capital; an investment sector, using the same inputs to
produce investment goods and an “ideas” sector, producing new ideas from those inputs, a
production function in each sector and perfect competition, we may write sectoral-output growth
as
ln ln ln ln ln lnTAN INTANTAN INTAN
M L K KY s M s L s K s K TFPΔ ≡ Δ + Δ + Δ + Δ + Δ (2)
where Y is real gross output, M is real materials, s denotes a share of payments to that factor in
gross output, and L is labour. Relative to the conventional approach, growth accounting is
expanded, since we have an extra capital asset, namely KINTAN. Note too that industry-level gross
output rises since there is more production, in this case of own-account intangible capital and that
increased value added is equal to a payment for the use of such capital.
Finally, it will be important to distinguish between product and process innovation. In
the case of a process innovation, with competition, all output goes to the lowest cost firm and
prices fall in proportion to TFPG in the process innovation. In the case of a product innovation in
inputs, computers for example, that should be accounted for by the hedonic adjustment of
computer prices, which is done here following US methods. In the case of a product innovation
in output, statistical practice is not to quality adjust output. Thus the growth in real-quality

18
adjusted output is faster than ΔlnY in (2) and thus ΔlnTFP is understated. See e.g. Hulten
(2009).21
4.3 Growth accounting data and results Before setting out our growth accounting results we give more complete details on the input
measures on the right hand side of (2). The primary source of our data is the industry-level data
from EUKLEMS (March 2008 release, the most comprehensive data release). Since the
intangibles data by industry are only feasible for seven industry groups (Gil and Haskel, 2008),
this is the level of aggregation we use (our industry groups are: 1 Agriculture, Fishing and
Mining, 2, Manufacturing, 3 Electricity, Gas and Water Supply, 4 Construction, 5 Wholesale and
Retail Trade, Hotels and Restaurants, Transport and Communications, 6 Financial Intermediation
and 7 Business Services).
Beginning with L, it is often thought that financial services uses increasingly skilled
labour, and so we use composition-adjusted person hours, taken from EUKLEMS which
generates labour services by weighting growth in hours for different age/education and gender
worker groups using wages.
Turning to tangible capital, these are the EUKLEMS measures consisting of 12 different
capital groups. Real capital stocks, of both tangible and intangible capital, are built by a perpetual
inventory method and then changes in log real stocks are weighted together by capital shares, the
capital shares using rental rates endogenously determined to exhaust all factor payments
including intangibles. Deprecation rates for tangible capital are those set out in KLEMS.
Depreciation rates for intangible capital are those used by CHS, whose assumptions receive
support from the microsurvey in Awano et al (2010).
Table 6 sets out the results of applying this framework without intangibles. We report
results for 2000-2005, for financial intermediation and business services, manufacturing and
retail, hotels and transport (for comparison) as well. The only assets are tangible capital assets
and (quality adjusted) labour. The tangible assets are split into ICT-hardware (which is
computers and communications equipment) and other. Thus these data exclude software. In
Table 7, we include intangible capital assets. We report software, R&D (which in finance is our
measure derived from researcher time but otherwise is BERD R&D), design, brand equity, firm-
financed human capital and organisational capital.
21 In Hulten’s model, define quality adjusted ouput QE=V/PE where V=PQ. Then QE/Q=P/PE and since PE<P i.e. quality corrected prices are less then observed prices, then QE>Q i.e. a “better” good is like having “more of the good”. In this model, Hulten derives ln ln ( ln ln )e eTFP TFP p pΔ = Δ − Δ −Δ where ΔlnTFP in efficiency units is denoted ΔlnTFPE . This expression shows the relation between observed TFPG, which reflects process innovation and quality adjusted TFPG, which reflects process and product innovation and the term -(Δlnp - ΔlnpE). Assuming improvements in product quality, ΔlnpE < Δlnp, and hence -(Δlnp - ΔlnpE)<0. Thus observed ΔlnTFP grows more slowly ΔlnTFPE.

19
What do we find? Table 6 shows slow LPG in financial services relative to
manufacturing, about equal to retailing and faster than business services (2.94%pa against
3.79%pa, 3.02%pa and 1.93%pa). The total capital deepening column (column 2) shows that in
manufacturing 8% (0.30/3.79) of LPG is due to total capital deepening, with 30%(0.09/0.30) of
that capital deepening due to ICT. TFPG is about 23% (0.81/3.79) of LPG. In Financial
Services, the picture is different. 11% (0.34/2.94) of LPG is capital deepening. Of the capital
deepening all of it (138%) is due to ICT-hardware. Almost 50% of LPG is TFPG (1.4/2.94). In
business services almost a quarter of LPG is due to capital deepening which in turn is mostly due
to ICT. TFPG is about 34%. Thus the conventional results stress the importance of hardware in
financial services, but leave other intangibles in the TFPG term, which is itself 50% of LPG. Can
the augmented approach give more information?
Table 7 shows the augmented approach with all intangibles. First, TFPG is now 10% of
LPG in manufacturing and retailing (0.38/3.75 and 0.29/3.07) and 29% in financial services
(0.85/2.89). So our first result is that whilst TFPG in finance is relatively high, which is to be
expected if products are costless to imitate. Our second is that using intangibles has accounted
for some of the residual; that is, the residual has gone from 50% of LPG to 29%.
Second, consider capital deepening. In finance, intangible capital deepening accounts for
around 50% of that total capital deepening, with the bulk of the contributions from software,
organisational capital, training and product design. The contribution of software (0.14%pa) in
finance is larger than that of manufacturing and retail (both 0.08%pa), documenting how
important software is in financial services. The contribution of organisational capital (0.15%pa)
is similar to that in other sectors, but a higher fraction (around 5%) of LPG. Hardware is also
very important in financial services, with half of capital deepening due to hardware (in
manufacturing and retail the figures are 8% and 31% of total capital deepening), again suggesting
the importance of ICT in the sector. Indeed, the sum of hardware and software contributes 20%
of (gross output) LPG in financial services as opposed to 14% in retail and 5% in manufacturing.
Hardware and software is 74% of capital deepening in financial services.
Thus it would appear that incorporating intangibles fills out the picture of productivity
growth in financial services. To get some more feel for the results, we also undertook a number
of robustness checks. First, to guard against double counting we subtracted the BERD R&D
spend from our research occupation measure, but the results were almost identical. Second, we
changed the fraction of managerial time allocated to 10% and 5% (full results reported in the
appendix). This did affect the results. For the 10% check, the contribution of own account
organisational capital was lowered to 0.8%pa and financial services TFP raised by 0.8%pa (we
had very similar findings for the 5% assumption, interestingly, this change hardly affected the
other industries). Third, we subtracted purchased design activities from the insurance sector in
financial services, which added 0.11 percentage points to TFP, see Appendix Table A1. In sum,

20
the largest intangible asset contributors from Table 7 are software, organisational capital building,
design and firm training. Changing the assumptions on organisational capital and design
essentially places their contributions back to TFP.
There are clearly a number of issues that we might want to address in future work.
Firstly, the measurement of output in financial services is clearly not easy, but the approach here
is consistent with National Accounts conventions. Second, we do not have a very good measure
of prices in financial services, which might again be examined. Third, to do growth accounting
one must assume perfect competition so that factor shares measure the (unobserved) output
elasticities. To some extent this does not matter in this exercise, since we are most interested here
in how the LPG and TFPG picture changes when one moves from excluding intangible assets to
including them. Such a conclusion is not of course affected by the degree of imperfection in
competition. Finally, we clearly need better micro measures to back up the macro assumptions:
the results in Awano et al (2010) are encouraging on depreciation rates, but design needs to be
examined further.
5 Conclusion
We have re-examined innovation, productivity and total factor productivity in financial services.
We have done this by calculating knowledge spending taking account of the wider spending on
knowledge indicated by detailed studies of financial innovation. These studies suggest spending
on software, training, marketing and organisation capital are integral to financial innovation, as
well as copying of innovation from other companies. Using this approach changes TFPG from
around 50% of LPG to 29% of LPG, reducing the “measure of our ignorance” but confirming that
TFPG is important in financial services, as case studies suggest. It also confirms the relative
importance in financial services of ICT (software and hardware spend): they account for twice as
much LPG as in manufacturing and retail and 74% of capital deepening in financial services.
Finally, it suggests important contributions from organisational spending and training.
Future work will of course look at many areas in this paper, such as the time spent on
research activities and better measurement of TFP in imperfect competition situations. But this
paper suggests this intangibles approach is likely to be worth exploring further.22
22 We have dodged the question here is whether financial innovation is a “good” thing. The method here values output at market prices (either direct charges for services or indirectly via margins). If market prices deviate from social values (due to externalities say or imperfect competition) the private costs are not equal to social costs (just as e.g. measured output in the cigarette industry might not be valued at social cost).
21
REFERENCES Akritidis L. (2007), “Improving the measurement of banking services in the UK National Accounts”,
Economic and Labour Market Review, Office for National Statistics Awano, G, Franklin, M, Haskel, J. and Kastrinaki, Z, (2010), “Measuring investment in intangible
assets in the UK: results from a new survey”, Economic and Labour Market Review, 4, issue 7, p. 66-71, Basu, Susanto, Robert Inklaar, and Christina Wang (2008). “The Value of Risk: Measuring the Services
ofCommercial Banks.” Federal Reserve Bank of Boston Working Paper no. 08\04. Federal Open Market Committee (2009). Monetary Policy Report to Congress. Washington
(http://www.federalreserve.gov/monetarypolicy/files/20090721_mprfullreport.pdf), forthcoming Economic Inquiry.
Barnett (2009), UK Intangible Investment: Evidence from the Innovation Index Survey, CeRiBA
Working paper, July Black F. and Scholes M (1974), “From Theory to a New Financial Product”, the Journal of Finance, Vol.
29, No. 2, Papers and Proceedings of the Thirty-Second Annual Meeting of the American Finance Association, New York, New York, December 28-30, 1973 (May, 1974), pp. 399-412 Published by: Blackwell Publishing for the American Finance Association Stable URL: http://www.jstor.org/stable/2978810
BIS, 2008 R&D scoreboard, Commentary and Analysis,
http://www.innovation.gov.uk/rd_scoreboard/downloads/2008_RD_Scoreboard_analysis.pdf). Buffett, W., (2002), Berkshire Hathaway Inc. 2002 Annual Report. Chamberlin, G., Chesson, A. Clayton, T. and Farooqui, S. (2006), “Survey based measure of software
investment in the UK”, Economic Trends, Office of National Statistics Chamberlin, G., Chesson, A., Clayton, T. and Farooqui, S. (2007), “New measures of private- sector
software investment”, Economic and Labour Market Review, Office for National Statistics Crespi G., Criscuolo C. & Haskel J.(2007),. "Information Technology, Organisational Change and
Productivity Growth: Evidence from UK Firms," CEP Discussion Papers dp0783, Centre for Economic Performance, LSE.
Corrado, C., Hulten, C. and Sichel, D. (2005), “ Measuring capital and technology: an expanded
framework”, in Measuring Capital in the New Economy, edited by Corrado, J.Haltiwanger and D.Sichel, National Bureau of Economic Research Studies in Income and Wealth, Vol. 65, pp.11-45, The University of Chicago Press,Chicago and London
Corrado, C., Hulten, C., and Sichel, D. (2006), “Intangible Capital and Economic Growth”, NBER
Working Paper, No.11948. Frame, W.S. and White, L.J. (2004). “Empirical studies of financial innovation: lots of talk, little action?”
Journal of Economic Literature, 42(1), 116-144. Fixler, Dennis, Marshall Reinsdorf, and George Smith (2003). “Measuring the Services of
CommercialBanks in the NIPAs: Changes in Concepts and Measures” Survey of Current Business, vol. 83, no. 9(September), pp. 33� ]45.no. 9 (June).(January), pp. 66|68.
Fixler, D. and K. Zieschang (1999) “The Productivity of the Banking Sector: integrating financial and
production approaches to measuring financial service output,” Canadian Journal of Economics, 32(2): 547-569.
Fixler, D. and K. Zieschang (2010) “Deconstructing FISIM: Should Financial Risk Affect GDP?,” draft paper, at http://www.iariw.org/papers/2010/4aFixler.pdf.
22
Galindo-Rueda F., Haskel J and Pesole A.(2008) “How much does UK employ, spend and invest in design?” CeRiBA working paper , July.
Greenspan, A., (2002) in “World Finance and Risk Management”, delivered at Lancaster House 25
September 2002. Giorgio Marrano, M., Haskel, J. (2006), “How Much Does the UK Invest in Intangible Assets?, CEPR
Discussion Paper No 6287. Giorgio Marrano, M., Haskel, J. and Wallis, G. (2007), “What happened to the Knowledge Economy?
ICT, Intangible Investment and Britain’s Productivity Record Revisited”, Department of Economics, Queen Mary, University of London, Working Paper 603.
Haldane, A, Brennan, S, and Madouros., V. (2010). What is the Contribution of the Financial Sector:
Miracle or Mirage? Cahpter 2 in The Future of Finance: The LSE Report at http://www.futureoffinance.org.uk/.
Hall, BH. , (2009), “Business and financial method patents, innovation, and policy”, Scottish Journal of
Political Economy 56(4): 443-473. Haskel J, Pesole A.(2009) “UK intangible investment: Evidence from three sources” CeRiBA working
paper , March. Hulten C. R. (2009) "Total Factor Productivity. A Short Biography," NBER Chapters, in: New
Developments in Productivity Analysis, pages 1-54, National Bureau of Economic Research, Inc. Hunt R. (2009) “Business method patents and U.S. financial services” Federal Reserve Bank of
Philadelphia, WP no 8-10 Inklaar, R, and J. Christina Wang (2010), Real Output of Bank Services: What Counts Is What Banks
Do, Not What They Own, draft paper, available at http://www.iariw.org/papers/2010/4aInklaar.pdf. Ingham, H and Thompson S. (1993), "The Adoption of New Technology in Financial Services:The Case
of Building Societies." Econ. Innov. NewTechn. 2, pp. 263-74. Jenkinson, N., (2008), “Financial innovation – what have we learnt?”, speech by Mr Nigel Jenkinson,
Executive Director, Financial Stability, Bank of England, to the Reserve Bank of Australia Conference on “Lessons from the Financial Turmoil of 2007 and 2008”, Sydney, 14-15 July 2008.
Lerner, Josh. (2002), "Where Does State Street Lead? A First Look at Finance Patents, 1971-2000," J.
Finance 57:2, pp. 901-30. Lerner, J (2006), “The new financial thing: the origins of financial innovations”, Journal of Financial
Economics, 79(2), 223-255. Litan, R., (2010), “In Defense of Much, But Not All, Financial Innovation”, Brookings Institution Paper,
http://www.brookings.edu/papers/2010/0217_financial_innovation_litan.aspx Mayer, Colin. (1986), "Financial Innovation: Curse or Blessing?" Oxford Rev. Econ. Pol. 2:4, pp. i-xix. OECD (2002). Frascati Manual: Proposed standard practice for surveys on research and development,
OECD Paris. OECD (2005). Oslo Manual: Guideline for Collecting and Interpreting Innovation Data, 3rd edition OECD
Paris. Office of National Statistics (2008), “GVA SOURCE DATA BOOK” http://www.ons.gov.uk/about-
statistics/user-guidance/ios-methodology/source-data/full-list-of-ios-source-data.pdf Office of National Statistics (2006), National Accounts, Concepts, Sources and Methods, available at

23
(http://www.statistics.gov.uk/downloads/theme_economy/Concepts_Sources_&_Methods.pdf) Office of National Statistics (2006), “Research and development in UK businesses, 2004 (MA14) Office of National Statistics (2007), “Standard Industrial Classification 2003” Office of National Statistics (2006), “Standard Occupation Classification 2000” Office of National Statistics (2007), “United Kingdom National Accounts, the Blue Book. Oulton, N., (2007), "Ex Post Versus Ex Ante Measures Of The User Cost Of Capital," Review of Income and Wealth, Blackwell Publishing, vol. 53(2), pages 295-317, 06. Schreyer P. (2004), “A General Equilibrium Asset-Pricing Approach to the Measurement of Nominal and
Real Bank Output” by J. Christina Wang, Susantu Basu and John G. Fernald, Conference on Research on Income and Wealth (CRIW), Vancouver, June 2004. Comments by, OECD, in Index Concepts and Measurement
Triplett J.E., Bosworth B.P. (2004) “Services productivity in the United States: new sources of economic
growth” Washington D.C., Brookings Institution Press Tufano, Peter. (1989), "Financial Innovation and First Mover Advantages," J. Finan. Econ. 25:3, pp. 213-
40. Tufano, Peter (2002),. "Financial Innovation." The Handbook of Economics of Finance, (North Holland)
edited by George Constantinides, Milt Harris and Rene’ Stultz.. Williams B., Fender V. & Drew S (2009) “Output and employment in financial sector” Economic and
Labour Market Review, vol 3, issue 7, pp 18-25. Wang J. C. (2003) “Loanable funds, risk and bank service output” Federal Reserve Bank of Boston WP no
03-4

24
Table 1: UK Standard Industry Classifications for Financial and Business
Services and relation to R&D survey industry sector classification AD
“"Miscellaneous business activities, technical and testing analysis”
SIC division SIC code Description BERD sector AD Industry description in
this paper
65
Financial intermediation,
except insurance and
pension √ Financial services
66
Insurance and pension
funding, except
compulsory social
security √ Financial services
J 67
Activities auxiliary to
financial intermediation √ Financial services
70 Real estate, renting and
business act's
Of which:
70.1
Real estate activities with
own property √ Business services
70.2 Letting of own property √ X
70.3
Real estate activities on a
fee or contract basis √ Business services
71
Renting of machinery and
equipment √ Business services
72
Computer related
activities X Business services
73
Research and
development X Business services
K 74 Other business activities √ Business services
Notes: the Business Enterprise R&D Survey (BERD) classification “AD” covers the indicated SICs where ticked. BERD classification is called "Miscellaneous business activities, technical and testing analysis". In the paper, if we quoted BERD data for a subsector of the AD sector, this is prorated data by wage bills. Source: SIC (2003) and EUKLEMS industry definitions
25
Table 2 : Knowledge Occupations in SOC group 2 “Professional Occupations”
SOC 2000 DescriptionResearchers
2423 Management consultant, actuaries, economist and statisticians2321 Scientific researchers2322 Social science researchers2329 Researchers n.e.c.
Other Researchers2431 Architects3122 Draughtspersons2433 Quantity surveyors2434 Chartered surveyors2122 Mechanical eng2125 Chemical eng2121 Civil eng2123 Electrical eng2124 Electronics eng2128 Planning and quality control eng2127 Production and process eng2129 Engineering professional2112 Biological scientists and biochemists2113 Physicist,geologist and meteorologist2111 Chemists2212 Psychologists2432 Town planners
Source: ONS, SOC classifications 2000.
26
Table 3: Employment in Annual Survey of Hours and Earnings (ASHE) by broad occupational
classification
Year Managers IT professionals ResearchersOther Researchers Total
1997 252,089 79,141 14,114 4,983 350,327
2000 274,006 87,306 18,983 5,265 385,560
2005 326,432 88,434 24,455 6,938 446,2592008 338,196 78,734 33,012 5,042 454,984
Notes: Each column reports the weighted to population figure for the different occupation
categories. Please refer to table 2 and table A2 in Appendix for the SOC 2000 detailed code.
Source: Authors’ computation on ASHE.

27
Table 4: Knowledge investment in financial services, Industry J 1 2 3 4 5 6 7 8
Year Researchers Other researchersSoftware own account
Software purchased
Managers own account
Managers purchased
R&D, BIS scoreboard R&D, BERD
investment in £bn1990 0.25 0.04 0.8 0.3 . 0.2 0.0042000 0.5 0.05 1.8 1.4 2.4 0.9 0.0062004 0.5 0.1 2.2 1.5 3.1 1.1 0.0172006 0.9 0.1 2.2 1.8 3.6 1.2 0.86 0.019
as a % of sales1990 0.39% 0.06% 1.26% 0.47% 0.31% 0.01%2000 0.42% 0.04% 1.50% 1.17% 2.00% 0.75% 0.00%2004 0.31% 0.06% 1.37% 0.94% 1.94% 0.69% 0.01%2006 0.47% 0.05% 1.15% 0.94% 1.88% 0.63% 0.45% 0.01%
Notes: The top panel reports investment (£bn) from different sources. The second panel shows the percentages of the top panel data in nominal Gross
Output. The first two columns are data based on calculations in this paper, with columns 1 and 2 from the researcher data set out above. Column 3 and
4 are based on official ONS software data. Column 5 and 6 are based on spending on management consultants for bought in spending and 20% of
managerial time for own account. Column 7 is the BIS R&D scoreboard for financial services, which is R&D spend from accounting data (the only
type of R&D capitalised by banks is investment in the development of internally generated software) and column 8 is official data from BERD allocated
between financial services and other services as set out in the text, see section 3.2.
Source: Authors’ computations, EUKLEMS, BERD, R&D BIS scoreboard

28
Table 5: Share of Intangible Investment by industry and asset.
Year
Intangible assets ManufacturingFinancial Services Manufacturing Financial Services
Software 0.19 0.21 0.15 0.22Total R&D 0.79 0.06 0.78 0.06Design 0.32 0.08 0.26 0.07Brand equity 0.21 0.20 0.17 0.17Firm-human capital 0.21 0.07 0.13 0.05Organisational capital 0.25 0.19 0.25 0.19Memoemployment 21 5 17 5hours 23 5 18 5value added 25 7 19 11
2000 2006
Notes: Each cell in upper part of the table is investment in the particular asset in the indicated
industry as a share of total investment of the same asset in the total market sector. Total R&D is
defined as the sum of conventional R&D, R&D in social sciences and new development of
financial products. Cells in lower part of the table under “memo” are shares for the indicated
industry over total market sector.
Source: See text. Memo cells from EUKLEMS.

29
Table 6: Growth Accounting, 2000-2005, excluding all intangibles, selected industries
1 2 3 4 5 6 7
Total ICT TangibleNon-ICT Tangible
Manufacturing 3.79 0.30 0.09 0.20 0.29 2.32 0.89Retail, transport and hotels 3.02 0.56 0.33 0.23 0.22 1.63 0.62
Business activities 1.93 0.51 0.38 0.13 0.30 0.46 0.66
Financial services 2.94 0.34 0.47 -0.14 0.27 0.94 1.39
Labour Productivity
Capital DeepeningLabour Quality
Intermed Input Deep TFP
Notes: The table reports selected industries, other industries are Agriculture, Construction, Gas, Electricity and Water. The data are average
growth rates per year 2000-2005 in percent per annum. Data exclude software. The first column is growth in industry gross output per hour. Column 2 is the total contribution of capital services per hour, namely growth in capital services per hour times share of capital in Gross Output (GO) and equals the sum of column 3 and 4. Column 3 is growth in computer capital services times share in GO. Column 4 is growth in other tangible capital services (buildings, plant, vehicles) times share in GO. Column 5 the contribution of labour services per hour, namely growth in labour services per hour times share of labour in GO. Column 6 is the contribution of intermediate inputs per hour, namely growth in intermediate inputs per hour times their nominal share in GO. Column 7 is TFPG, namely column 1 minus the sum of columns 2, 5 and 6.
Source: Authors’ computations from EUKLEMS and own intangible data.

30
Table 7: Growth Accounting, 2000-2005, including all intangibles, selected industries
1 2
(=3+4+5)3 4 5 6 7 8 9 10 11 12 13 14 15 (=1-2-
13-14)
Total ICT Tangible
Non-ICT Tangible
Intangible capital Software
Total R&D Design
Brand equity
Firm-human capital
Org cap own account
Org cap purch
Manufacturing 3.75 1.25 0.10 0.24 0.92 0.08 0.37 0.16 0.03 0.11 0.10 0.07 0.29 1.83 0.38
Retail, transport and hotel
3.07 1.11 0.35 0.27 0.49 0.08 0.02 0.07 0.05 0.16 0.08 0.02 0.22 1.45 0.29
Business activities
2.21 1.41 0.40 0.15 0.86 0.13 0.03 0.25 0.07 0.24 0.13 0.01 0.30 0.49 0.01
Financial services
2.89 0.77 0.43 -0.08 0.42 0.14 0.02 0.07 0.00 0.05 0.11 0.04 0.27 1.00 0.85
Labour Productivity
Labour Quality
Intermed Input Deep TFP
Intangible categoriesCapital Deepening
Notes: The table reports selected industries, other industries are Agriculture, Construction, Gas, Electricity and Water. The data are average
growth rates per year 2000-2005. The first column is growth in real gross output per hour. Column 2 is the total contribution of capital services per hour, namely growth in capital services per hour times share of capital in Gross Output (GO). Column 3 is growth in computer capital services times share in GO. Column 4 is growth in other tangible capital services (buildings, plant, vehicles) times share in GO. Column 5 is growth in intangible capital services times share in GO. Columns 6-12 are the breakdown contribution by asset of intangible capital services per hour; respectively the shares in gross output times growth per hour in software, R&D (including for financial services R&D derived from research occupations, as set out in the paper), Design, Brand equity (investment in marketing and branding), Firm-specific human capital (training financed by firms) and organisational capital (namely investment in management consultants for bought in spending and 20% of managerial time for own account). Column 13 is the contribution of labour services per hour, namely growth in labour services per hour times share of labour in GO. Column 14 is the contribution of intermediate inputs per hour, namely growth in intermediate inputs per hour times their nominal share in GO. Column 15 is TFP, namely column 1 minus the sum of columns 2, 13 and 14.
Source: Authors’ computations from EUKLEMS and own intangible data.

31
APPENDIX A. Robustness checks
In this section we try to relax some of the measurement assumptions in the paper to check the
sensitivity of our results to those. As Table 7 shows, the contribution to LPG of organisational
capital in finance accounts for the biggest share in intangible capital deepening. The breakdown
between own account and purchased shows how the bulk of it comes from the own account
measured on an assumed 20% fraction of time spent by managers on knowledge activities. We
therefore relax this assumption and reduce the time fraction of a half. Table A.1 panel A, below
reports growth accounting decompositions where managerial own-account organisational capital
formation is assumed to be 10% of time as opposed to 20% in the baseline results above. The
contribution of own account organisational capital decreases of 0.08ppa, from 0.11 (Table 7,
column 11 last row) to 0.03 here. This change entirely goes to TFPG. That is TFPG increase 0.08
percentage points relative to the baseline case in Table 7, column 15 last row. A second
measurement issue we want to explore is the contribution of purchased design in finance.
Looking at the intermediate consumption reported by SU tables the insurance sector accounts for
almost the entire purchases of design services by finance. The investment nature of such
spending is uncertain. We present in the bottom row of table A.1 panel B the growth accounting
results setting to zero purchased design in financial services. Setting to zero the capital stock of
design in finance brings to a nil contribution for the asset and an increase in TFPG.
.

32
Table A.1: Growth Accounting, 2000-2005, robustness check assuming 10% of managerial time is on organisational capital building
Total ICT Tangible
Non-ICT Tangible
Intangible capital Software
Total R&D AED
Brand equity
Firm-human capital
Organ'al capital Own-account
Organ'al capital Purchased
Manufacturing 3.75 1.17 0.1 0.23 0.84 0.08 0.37 0.16 0.03 0.11 0.02 0.07 0.29 1.88 0.41
Financial Services
2.91 0.68 0.43 -0.08 0.33 0.13 0.02 0.07 0 0.04 0.03 0.04 0.27 1.03 0.93
Financial Services
2.9 0.69 0.43 -0.08 0.34 0.13 0.02 0 0 0.04 0.1 0.04 0.27 0.98 0.96
PANEL A: MANAGERIAL TIME 10%
PANEL B: PURCHASED DESIGN =0
Including all intangibles
Labour Productivity
Capital Deepening
Labour Quality
Intermed Input Deep TFP
Notes to table., please refer to note table 7 above.

33
Appendix C: list of managerial and IT occupational codes
Table A.2, below , presents the complete list of SOC code and description used to compute investment in own
account organisational capital following CHS, and the occupations chosen by ONS in their software estimates
Table A.2 “Full SOC description of Managers and IT professional”
SOC 2000 DescriptionManagers
1112 Directors and chief executives of major organisations1114 Senior officials of special interest organisations1121 Production, works and maintenance managers1122 Managers in construction1131 Financial managers and chartered secretaries1132 Marketing and sales managers1133 Purchasing managers1135 Personnel, training and industrial relations managers1136 ICT managers1137 Research and Development managers1151 Financial institution managers1152 Office managers1161 Transport and distribution managers1162 Storage and warehouse managers1163 Retail and wholesale managers1212 Natural environment and conservation managers1219 Managers in animal husbandry, forestry and fishing n.e.c.1231 Property, housing and land managers1234 Shopkeepers and wholesale/retail dealers1235 Recycling and refuse disposal managers
ICT Professional1136 Information and communication technology managers2131 IT strategy and planning professionals2132 Software professionals3131 IT operations technicians3132 IT user support technicians4136 Database assistants/clerks5245 Computer engineers, installation and maintenance
Source: ONS, Standard Occupational Classification 2000.
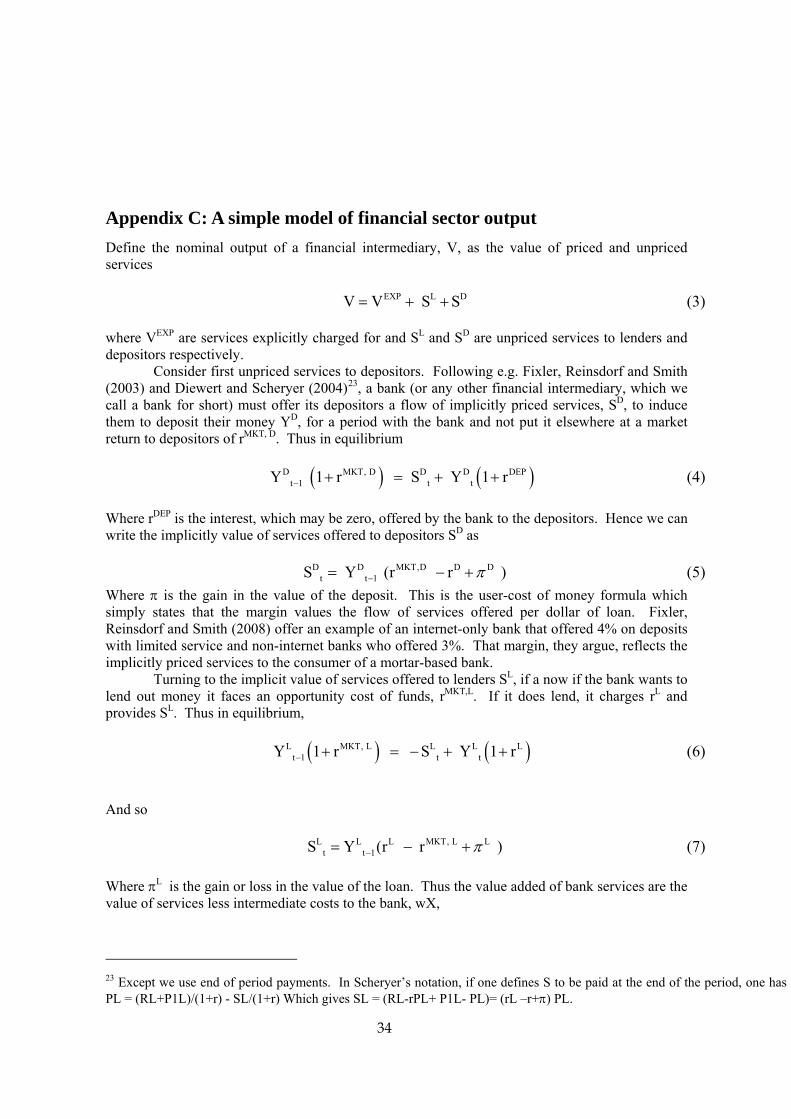
34
Appendix C: A simple model of financial sector output
Define the nominal output of a financial intermediary, V, as the value of priced and unpriced services EXP L DV V S S= + + (3) where VEXP are services explicitly charged for and SL and SD are unpriced services to lenders and depositors respectively. Consider first unpriced services to depositors. Following e.g. Fixler, Reinsdorf and Smith (2003) and Diewert and Scheryer (2004)23, a bank (or any other financial intermediary, which we call a bank for short) must offer its depositors a flow of implicitly priced services, SD, to induce them to deposit their money YD, for a period with the bank and not put it elsewhere at a market return to depositors of rMKT, D. Thus in equilibrium ( ) ( )D MKT, D D D DEP
t 1 t tY 1 r S Y 1 r − + = + + (4) Where rDEP is the interest, which may be zero, offered by the bank to the depositors. Hence we can write the implicitly value of services offered to depositors SD as D D MKT,D D D
t t 1S Y (r r )π−= − + (5) Where π is the gain in the value of the deposit. This is the user-cost of money formula which simply states that the margin values the flow of services offered per dollar of loan. Fixler, Reinsdorf and Smith (2008) offer an example of an internet-only bank that offered 4% on deposits with limited service and non-internet banks who offered 3%. That margin, they argue, reflects the implicitly priced services to the consumer of a mortar-based bank. Turning to the implicit value of services offered to lenders SL, if a now if the bank wants to lend out money it faces an opportunity cost of funds, rMKT,L. If it does lend, it charges rL and provides SL. Thus in equilibrium, ( ) ( )L MKT, L L L L
t 1 t tY 1 r S Y 1 r − + = − + + (6) And so L L L MKT, L L
t t 1S Y (r r )π−= − + (7) Where πL is the gain or loss in the value of the loan. Thus the value added of bank services are the value of services less intermediate costs to the bank, wX,
23 Except we use end of period payments. In Scheryer’s notation, if one defines S to be paid at the end of the period, one has PL = (RL+P1L)/(1+r) - SL/(1+r) Which gives SL = (RL-rPL+ P1L- PL)= (rL –r+π) PL.

35
( )
( )
EXP D L EXP D MKT, D DEP Dt t t 1
L L MKT,L Lt 1
V S S V Y r r
Y r r wX
wX π
π
−
−
+ + − = + − +
+ − + − (8)
From which we are now able to make the following observations. First, the second and third terms in the equation describe FISIM. Second, the (new) ONS procedure for implementing (6) is, following SNA93, to replace rM with a risk-free rate rF and exclude any capital gains, giving V=VEXP +SD
t + SLt = VEXP +YD
t-1 (rM, D –rF )+YLt-1(r L – rF )- wX where we note too that YL is
measured excluding loans to households for mortgages, since household mortgages are not considered to be financing productive activity (but financing a flow of housing services). Second, is it correct to replace rM with rF? As Basu, Diewert, Scheryer point out, theory provides a guide for rM, D and rM, L, namely the opportunity costs of financial capital for households depositing money with banks and banks lending money out. Briefly, if the bank absorbs the risk of the loan, it has for example a very large pool of loans so it can lend out at more or less the risk free rate, then rM,L = rF and value of services that the bank offers includes absorbing the risk. If the bank gets another party, such as a shareholder or the state, to absorb the risk of the loan, then rM,L > rF by a risk premium and so the value of services is less that measured FISIM. Note that the ONS uses different margins on a variety of different loans to in an attempt to better match the loan types with their correct opportunity costs in terms of risk premia and time to payback.
Third, it is standard in SNA to exclude capital gains and losses since they are not defined as returns on productive activity. Scheryer states that given however that a bank makes capital gains and loses on many items on its balance sheet, which might be associated with financial services. Fixler and Reinsdorf (2006, note 5) note that such gains and losses can be very significant, provisions for credit losses for example, ranging being around 10-20% of net interest income. We note here that the current financial crisis came too late for our data.24
Finally, Inklaar and Wang (2010) advocate measuring services by loan volumes weighted by their interest rate spreads. Again, whilst this might have considerable conceptual merit, though the spread measure is questioned by Fixler and Zhang (2010), we proceed on our data since it is available.
24 Over our data period margins are falling. Since 2007, Williams, Fender and Drew (2009) show that margins have risen on loans but fallen on deposits. According to the FISIM logic, such a widening of the premium over rF means that banks are providing more services and less services respectively. The popular discussion however, is that they are rebuilding balance sheets. How can this be reconciled or, are banks really providing different services? In the light of the above theory, a rise in rD-rF is consistent with a number of scenarios. First, it could be reflective of imperfect competition, in which case the margin incorporates a monopolistic mark-up (absent from the expression above since it assumes competition) and so there is no rise in SL. Second, it could be that banks absorb the risk so that rM=rF and indeed SL is rising. Third, banks are not absorbing the risk so that measured FISIM overstates SL and indeed that rM has grown relative to rF.

www.imperial.ac.uk/business-school
Imperial College Business School
Tanaka Building
South Kensington Campus
London SW7 2AZ
United Kingdom
T: +44 (0)20 7589 5111
F: +44 (0)20 7594 9184
This paper has been produced by the Healthcare Management Group
at Imperial College Business School
Copyright © the authors 2011
All rights reserved
ISSN: 1744-6783


