Using Data Mining and Bootstrapping to Develop Simple Models for Obtaining Confidence Intervals for the Percentage of Alcohol Related Crashes. Joni Nunnery and Helmut Schneider. Why Data Mining?. NHTSA Estimate is for the USA State estimates are not readily available - PowerPoint PPT Presentation
Using Data Mining and Using Data Mining and Bootstrapping to Develop Bootstrapping to Develop Simple Models for Obtaining Simple Models for Obtaining Confidence Intervals for the Confidence Intervals for the Percentage of Alcohol Related Percentage of Alcohol Related Crashes Crashes Joni Nunnery and Helmut Joni Nunnery and Helmut Schneider Schneider
Transcript
Using Data Mining and Using Data Mining and Bootstrapping to Develop Simple Bootstrapping to Develop Simple Models for Obtaining Confidence Models for Obtaining Confidence Intervals for the Percentage of Intervals for the Percentage of
Alcohol Related CrashesAlcohol Related Crashes
Using Data Mining and Using Data Mining and Bootstrapping to Develop Simple Bootstrapping to Develop Simple Models for Obtaining Confidence Models for Obtaining Confidence Intervals for the Percentage of Intervals for the Percentage of
Alcohol Related CrashesAlcohol Related Crashes
Joni Nunnery and Helmut Schneider Joni Nunnery and Helmut Schneider
Why Data Mining?• NHTSA Estimate is for the USA• State estimates are not readily available• Need for reliable standard errors for states
– 0.3% for USA 2% for LA• State estimate may be effected by local variab
les• Non-crash independent variables may change
over time – DWI versus pretrial diversion
• IM estimates complicated statistical technique• Data Mining tools are used in various
applications
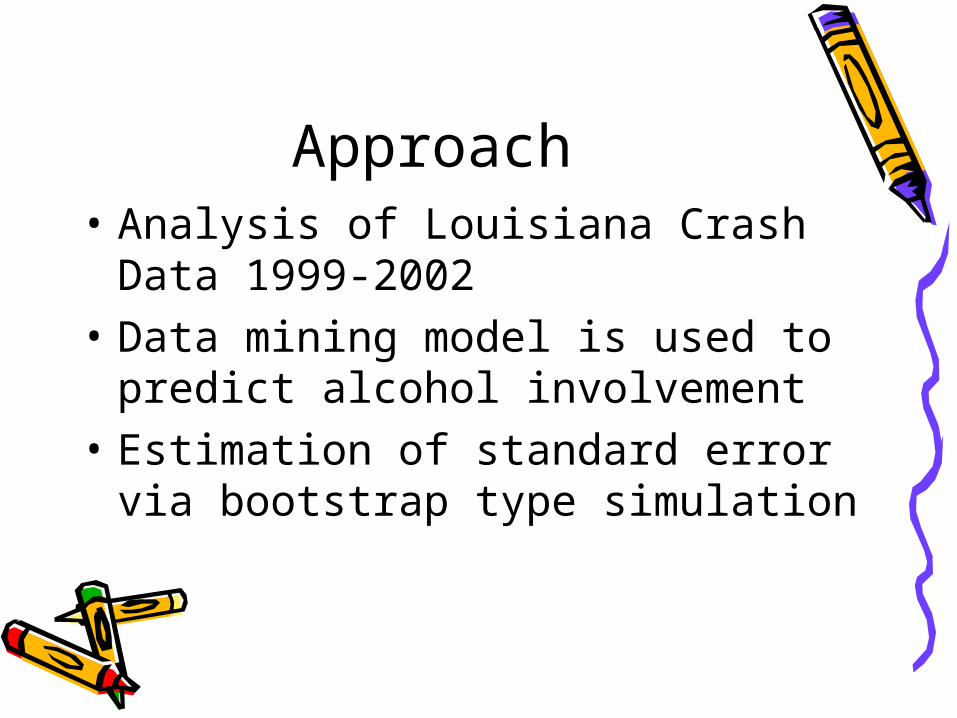
Approach• Analysis of Louisiana Crash Data
1999-2002• Data mining model is used to
predict alcohol involvement• Estimation of standard error via
bootstrap type simulation
KNOWN ALCOHOL TESTS RESULTS
LOUISIANAN 1999-2002
TEST RESULT
POLICEREPORT
No Alcohol Alcohol
Total Row
NO ALCOHOL 953 62 1015
ALCOHOL 51 508 559
UNKNOWN 400 268 668
Total Column 1404 838 2242
ROW PERCENTAGES
TEST RESULT
POLICE REPORT
No Alcohol Alcohol
Total Row
NO ALCOHOL 94% 6% 100%
ALCOHOL 9% 91% 100%
UNKNOWN 60% 40% 100%
All Drivers in Crashes
Louisiana 1999-2002 TEST RESULT
POLICEREPORT
No Alcoho
lAlcoh
ol
Alcoholunknow
n
NOALCOHOL 953 62 1044 2059
ALCOHOL 51 508 170 729
UNKNOWN 400 268 896 1564
Total Column 1404 838 2110 4352
Using Insightful Miner Data Mining Software
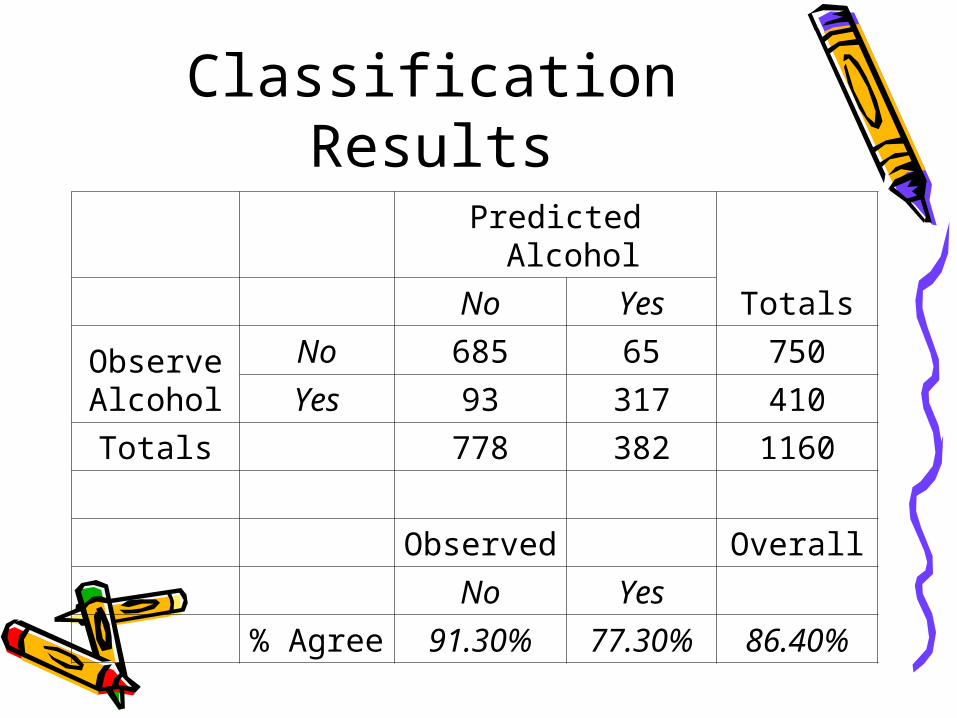
Classification Models• Logistic Regression• Naive Bayes• Neural Network• Classification Tree
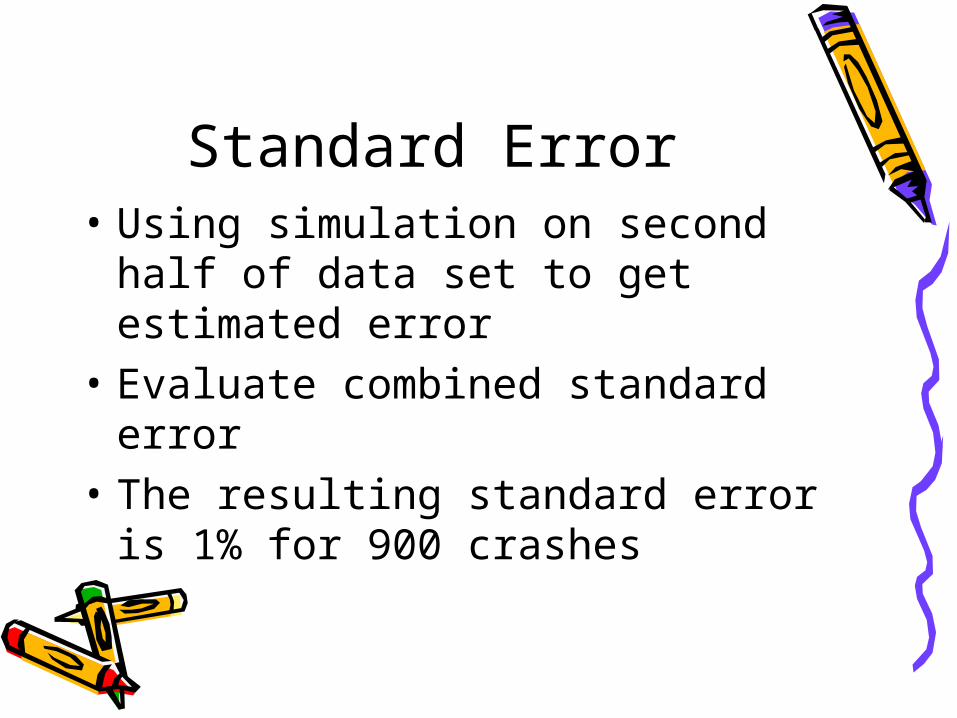
Classification Tree• Fit model to half the data• Tree model• What did we learn? –