1 THE ROLE OF SELF-REGULATION AS A META-COMPETENCY IN DEVELOPING LEADERS: A LONGITUDINAL FIELD EXPERIMENTAL STUDY JOOBEE, YEOW Doctor of Philosophy ASTON UNIVERSITY March 2011 This copy of the thesis has been supplied on condition that anyone who consults it is understood to recognise that its copyright rests with its author and that no quotation from the thesis and no information derived from it may be published without proper acknowledgement.
Transcript
1
THE ROLE OF SELF-REGULATION AS A META-COMPETENCY IN
DEVELOPING LEADERS: A LONGITUDINAL FIELD EXPERIMENTAL STUDY
JOOBEE, YEOW
Doctor of Philosophy
ASTON UNIVERSITY
March 2011
This copy of the thesis has been supplied on condition that anyone who consults it is understood to recognise that its copyright rests with its author and that no quotation from the thesis and no information derived from it may be published without proper acknowledgement.
2
Aston University
THE ROLE OF META-COMPETENCY IN DEVELOPING LEADERS: A LONGITUDINAL FIELD EXPERIMENTAL STUDY
JooBee, Yeow
Doctor of Philosophy
March 2011
THESIS SUMMARY
The question of how to develop leaders so that they are more effective in a variety of situations, roles and levels has inspired a voluminous amount of research. While leader development programs such as executive coaching and 360-degree feedback have been widely practiced to meet this demand within organisations, the research in this area has only scratched the surface. Drawing from the past literature and leadership practices, the current research conceptualised self-regulation, as a meta-competency that would assist leaders to further develop the specific competencies needed to perform effectively in their leadership role, leading to an increased rating of leader effectiveness and to enhanced group performance. To test this conceptualisation, a longitudinal field experimental study was conducted across ten months with a pre- and two post-test intervention designs with a matched control group. This longitudinal field experimental compared the difference in leader and team performance after receiving self-regulation intervention that was delivered by an executive coach. Leaders in experimental group also received feedback reports from 360-degree feedback at each stage. Participants were 40 leaders, 155 followers and 8 supervisors. Leaders’ performance was measured using a multi-source perceptual measure of leader performance and objective measures of team financial and assessment performance. Analyses using repeated measure of ANCOVA on pre-test and two post-tests responses showed a significant difference between leader and team performance between experimental and control group. Furthermore, leader competencies mediated the relationship between self-regulation and performance. The implications of these findings for the theory and practice of leadership development training programs and the impact on organisational performance are discussed. Keywords: Leadership development, competencies, self-regulation, coaching, self-regulatory intervention
3
Dedication
Firstly, this thesis is dedicated to my family who raised me up to be more than I can be and it is their belief in me that made it possible for me to be where I am. It is with a heavy heart that the man who raised me passed away on the last month of my writing up and the successful completion of this thesis is the least I could do to honour his love. I would like to include an excerpt from my eulogy in his memory:
“It breaks my heart that you could not attend any of my graduations because of your health, but this time, when I graduate for the last time, I know you will be watching me from above, just as you watched me on the first day you took me to school”. Secondly, I would also like to dedicate this thesis to Prof. Mike Grojean for having the faith in me to give me the opportunity to start this PhD. For this, I will be eternally grateful. Finally, I would like to dedicate this thesis to Yusuf Abowath, whose love, support and laughter I cherish, and showed me that good things come to those who persevere and wait.
4
Acknowledgement
This endeavour would not have been possible without the enormous help and guidance from so many individuals. First of all, I would like to thank my supervisor, Prof. Robin Martin, for his commitment, devotion, and patience in supervising my thesis. I am grateful to Prof. Nick Lee in his early guidance during my qualifying report and first year viva. In addition, I would also like to acknowledge Prof. Pawan Budhwar for his constructive feedback during my qualifying viva. I am deeply grateful to Dr. Ann Davis and Dr. Qin Zhou in their support and advice in obtaining the ethical approval for my research. Also, I would like to thank Dr. Gina Herzfeldt who took the time to integrate me into the Work and Organisational Psychology Group when I started my PhD. A special thank you to Prof. Helen Higson and Mr. John Overend for making it possible to conduct my research within the Business Strategy Game module. Chapter Four is made possible with the help of Mr. Jeremy Dawson the statistical genius of our department and Dr. Yves Guillaume for his words of advice. I am also deeply grateful to Jenny Thompson, Lynne Woolley, Sue Rudd and Jeanette Ikuomola for all their administrative help throughout this journey. I am deeply indebted to the friends and colleagues who read drafts of this document (Gareth Hughes, Ria Perkins, Klaus Thiele) and provided guidance throughout the completion of this research (Mariam Shebaya, Dr. Evmorfia Argyriou, Chris Chu, Anna Topakas). There were occasions when motivation was lost and I am grateful to those who spark it back in place. I would like to thank Thomas Bermudez, Stephanie Feiereisen, Kirsten Challinor, Elaine Foley, Jade Goh, Bob Maddox and Naresh Nihalani for their unwavering support. I want to express my gratitude to Dimah Sweis-Gentles, Julia Postnikova, Joanna Agathoklidi, Evelyn Kanda, Michael Ridger, Adam Frost, Pierre Prévot and Robin Ibbotson for the indirect help they gave which meant a lot to me.
5
Many thanks to Work and Organisational Psychology Group, ABS Research Degrees Programme (especially Prof. Sam Aryee) and Overseas Research Students Awards Scheme UK for their generous funding of my PhD in terms of scholarship, conference and research needs. Last but never the least, my eternal thanks to Charmi Patel who propelled me up and over the finish line. I will never forget your saying whilst I was writing up, “Joobee is getting hysterical and her sayings are becoming historical”. You made writing up fun!
Appendix I Pilot questionnaire .......................................................... 247
Appendix II Frequency analysis results from pilot study ................. 249
Appendix III Leader questionnaire ................................................... 250
Appendix IV Follower questionnaire ................................................ 256
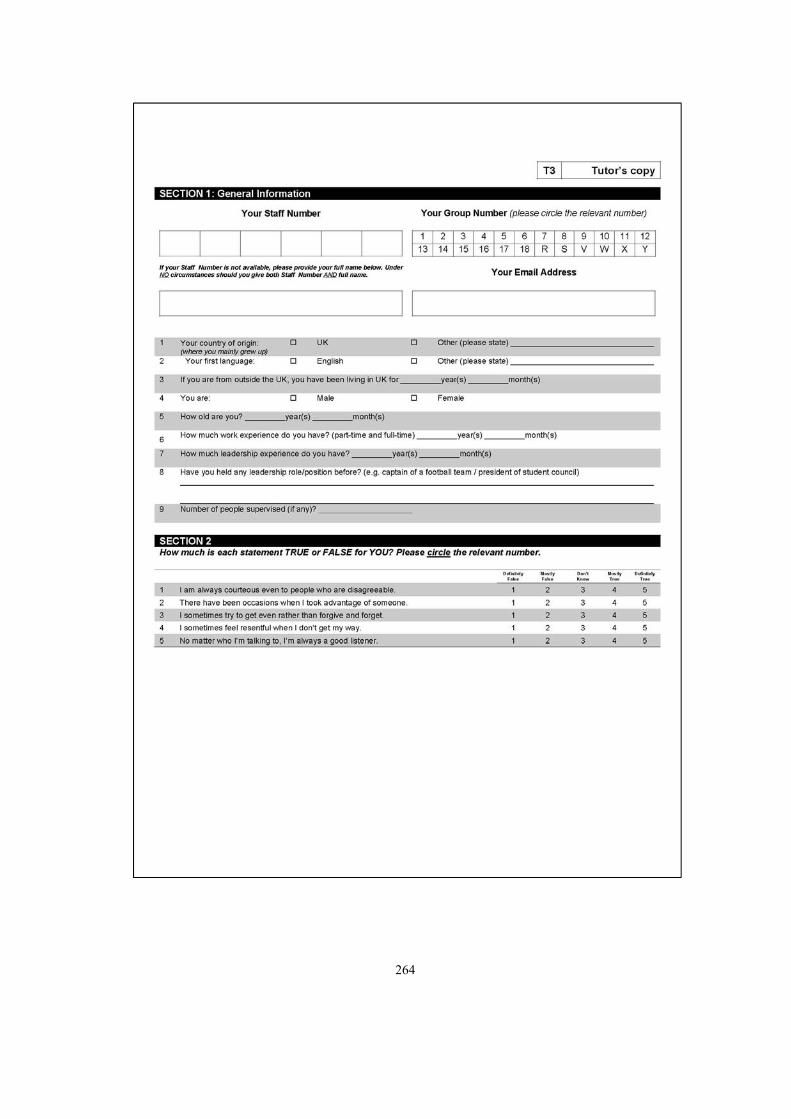
Appendix V Tutor questionnaire ....................................................... 262
Appendix VI Intervention invitation email ....................................... 267
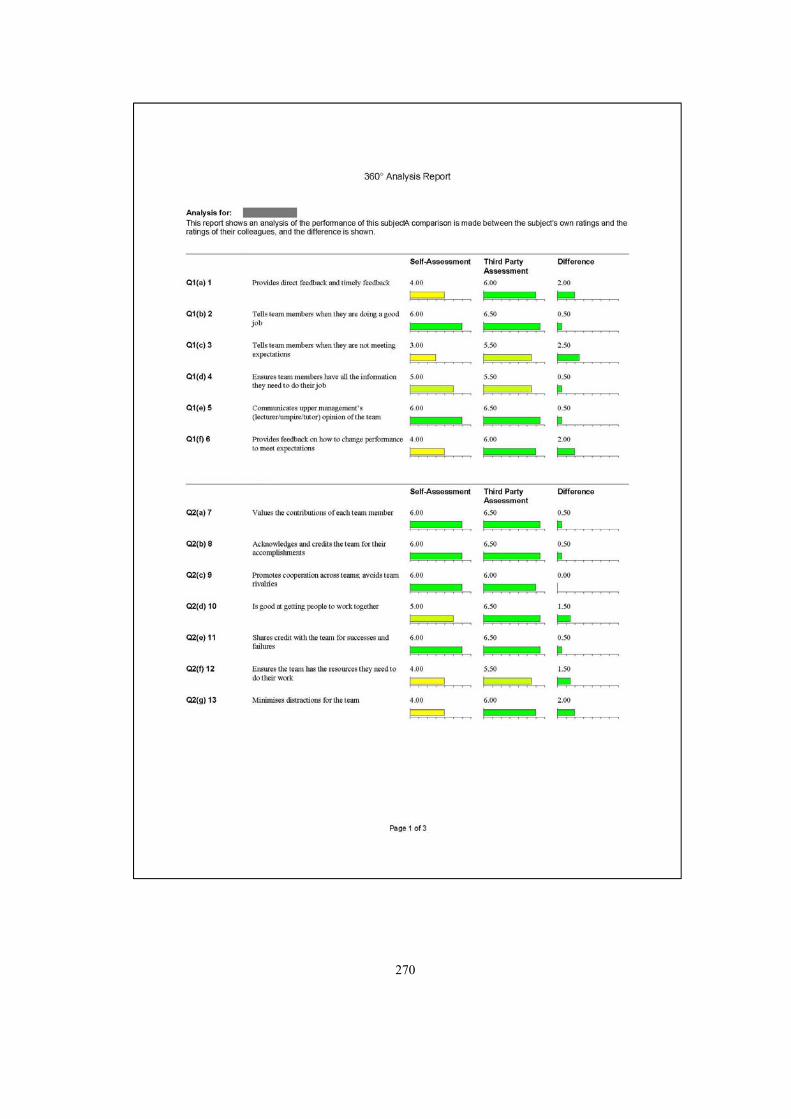
Appendix VII Sample of 360-degree feedback report for leaders .... 269
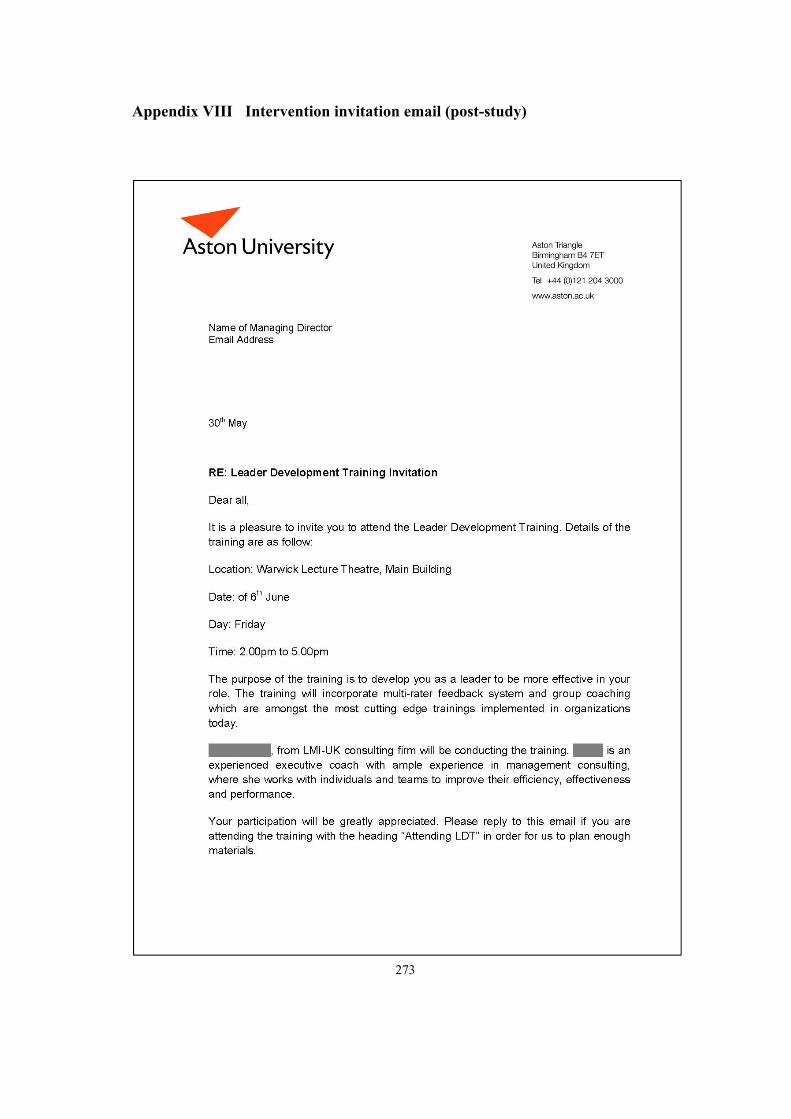
Appendix VIII Intervention invitation email (post-study) ................ 273
Appendix IX Email to prize draw winners ....................................... 275
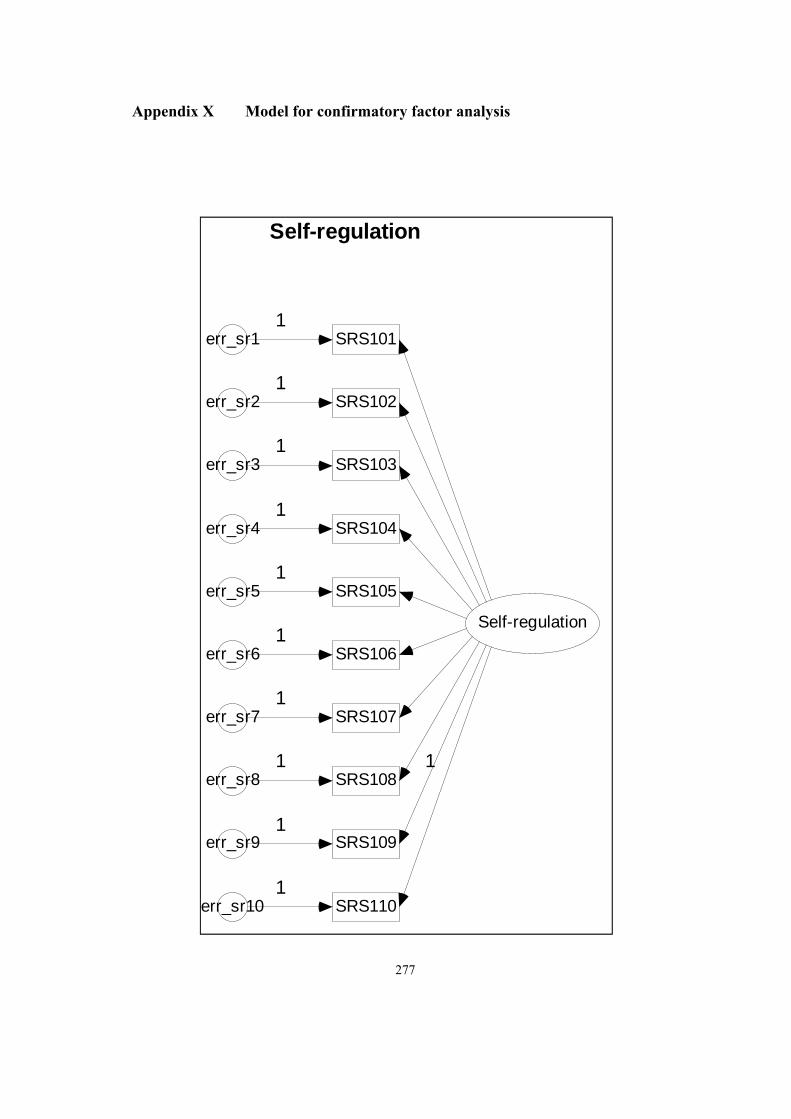
Appendix X Model for confirmatory factor analysis ........................ 277
10
List of Tables
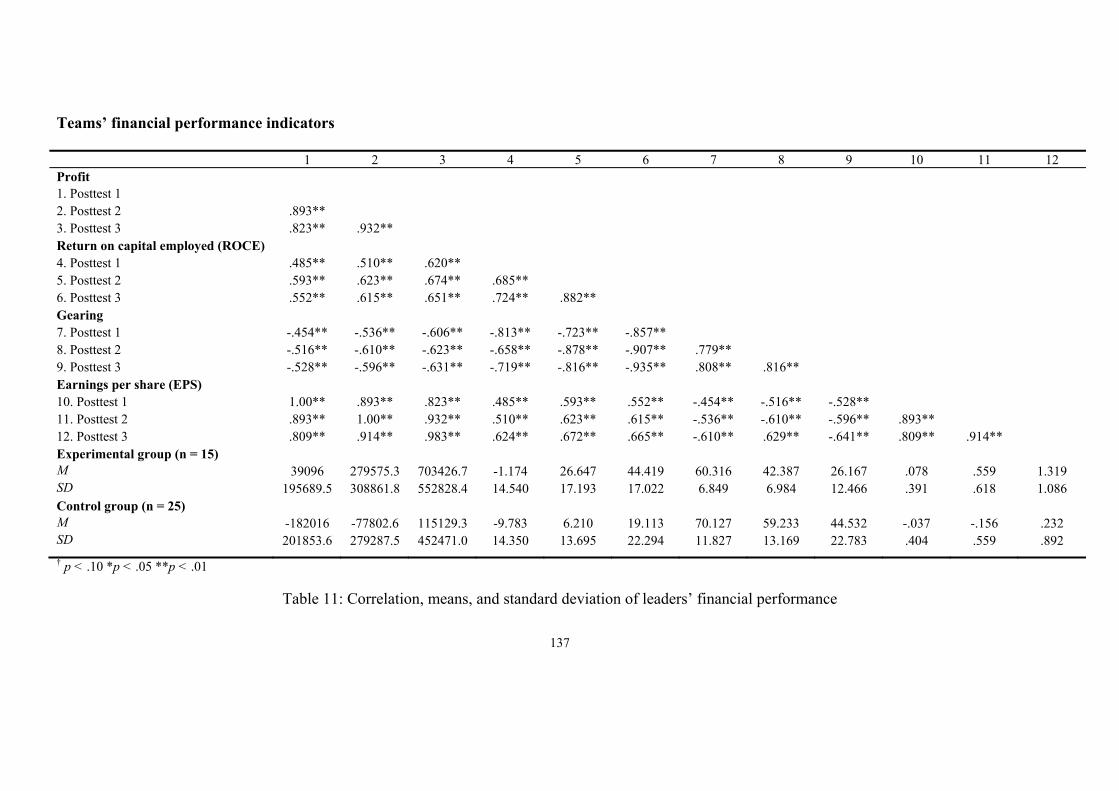
Table 1: Approaches in leadership research and implications for leadership development ............................................................................................................... 37 Table 2: Stages of executive coaching in comparison to stages of self-regulation ... 69 Table 3: Techniques for controlling external and internal validity of experimental design ......................................................................................................................... 92 Table 4: Role description for team members in the BSG module ............................. 95 Table 5: Weekly schedule and activities for the Business Strategy Game module ... 98 Table 6: Summary of data collection timeline for all variables ............................... 103 Table 7: Mean, standard deviation, rwg, F-values and, ICC values .......................... 129 Table 8: Results of Pearson chi-square and tests independent t-tests ...................... 133 Table 9: Participants’ characteristics ....................................................................... 134 Table 10: Correlation, means, and standard deviation of leaders’ performance (follower’s ratings) .................................................................................................. 136 Table 11: Correlation, means, and standard deviation of leaders’ financial performance ............................................................................................................. 137 Table 12: Correlation, means, and standard deviation of leaders’ assessments ...... 138 Table 13: Results of manipulation checks ............................................................... 139 Table 14: Results of repeated measures analysis of covariance (ANCOVA) for leadership outcomes rated by followers. .................................................................. 148 Table 15: Results of repeated measures analysis of covariance (ANCOVA) for financial performance. ............................................................................................. 158 Table 16: Results of analysis of covariance (ANCOVA) for assessment outcomes. ................................................................................................................................. 160 Table 17: Mediation analysis for the effects of self-regulation training on leadership outcomes, financial performances and assessment outcomes controlling for leader competencies as mediator ........................................................................................ 169 Table 18: Summary of hypotheses testing ............................................................... 175
11
List of Figures
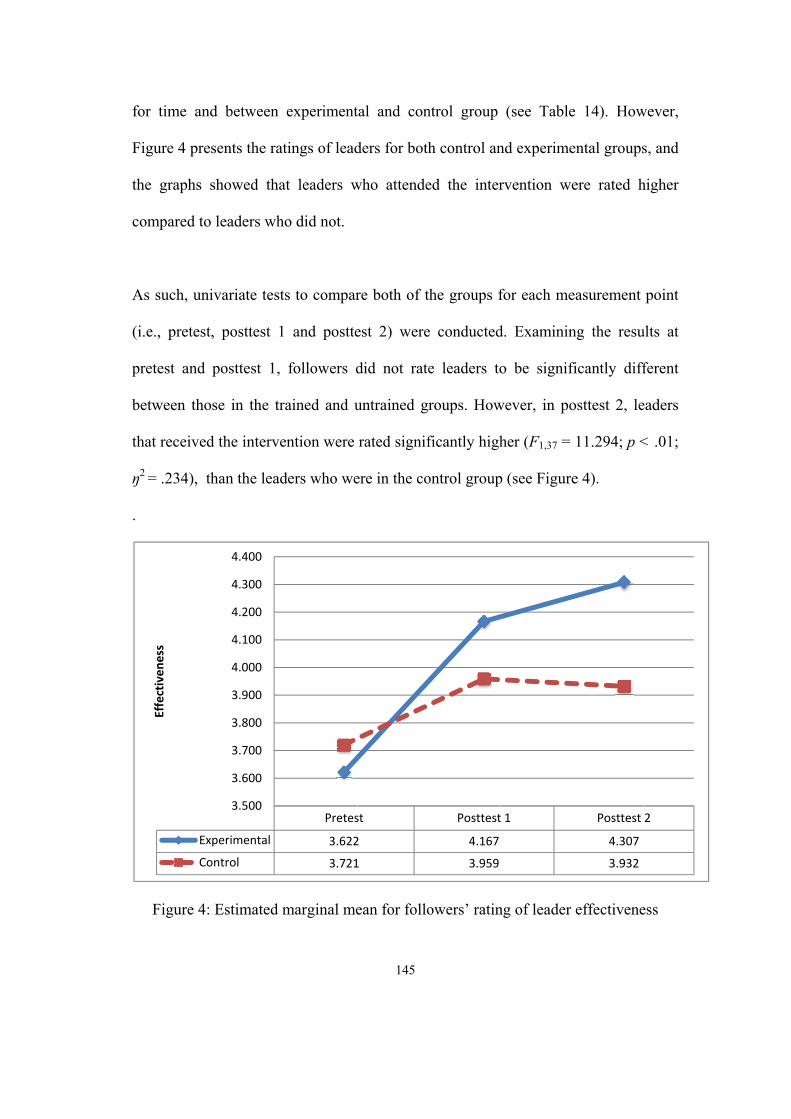
Figure 1: Research design model ............................................................................... 89 Figure 2: Estimated marginal mean for leaders’ self-regulation ............................. 140 Figure 3: Estimated marginal mean for followers’ rating of leader satisfaction ..... 143 Figure 4: Estimated marginal mean for followers’ rating of leader effectiveness ... 145 Figure 5: Estimated marginal mean for extra effort ................................................ 147 Figure 6: Estimated marginal mean for team profit (or loss) .................................. 150 Figure 7: Estimated marginal mean for team ROCE ............................................... 153 Figure 8: Estimated marginal mean for team Gearing ............................................. 155 Figure 9: Estimated marginal mean for team EPS ................................................... 157 Figure 10: Estimated marginal mean for teams’ assessments ................................. 161 Figure 11: Estimated marginal mean for leader competencies ................................ 164
12
CHAPTER 1
Introduction to the Research
This chapter aims to give an overview of the research reported in this thesis. Section 1.1 provides an introduction and background of leadership research and practice. Next, Section 1.2 states the main research problems, and establishes the research questions. Section 1.3 discusses the purpose and Section 1.4 gives an overview of the nature of this study. Finally, Section 1.5 puts forward the significance and contribution of the research to theory, methodology and practice are presented.
1.1. Introduction
Within the context of today’s increasingly competitive organisational environment,
leaders frequently need to confront crucial and relevant real time issues and come up
with the best solutions in the shortest period of the time (Day, 2000; Mumford,
Zaccaro, Harding, Jacobs, & Fleishman, 2000). To do so, leaders need work-related
competencies to develop and implement solutions with followers and senior
managers operating in these complex and dynamic contexts. Within this process,
leaders face complex interactions between them and the social and organisational
environment (Fiedler, 1996). Effective leaders need to have the social skills to
persuade not only followers, but various constituencies involved, to accept and
support their proposed solutions (Conger & Kanungo, 1987). Thus, it is very
important to possess the competencies required to deal with the variety of
interpersonal and organisational problems faced in the workplace (Mumford, Marks,
Connelly, Zaccaro, & Reiter-Palmon, 2000; Ulrich, Brockbank, Yeung, & Lake,
Executive coaching interventions are expensive, and the cost is continuing to rise
(Johnson, 2004). If self-regulation intervention is found to be an effective way to
improve leaders’ performance, where the leaders could regulate their own strategies
to develop relevant competencies to be effective rather than needing an executive
coach as the ‘regulator’, then many more leaders and organisations could benefit
from this cost effective leadership development intervention. 360-degree feedback
can be repeated anytime following the intervention to provide feedback to leaders.
Compared to the old saying, “Give a man a fish and you feed him for a day, teach a
man to fish, and you feed him for life;” leader intervention programmes designed to
develop leaders’ self-regulation is, in this case, a way to train leaders ‘to fish’.
Executive coaching, instead of adopting a myopic view of solving the immediate
problem e.g., regulating leaders’ actions to develop a particular competency which is
needed at that moment, should be taken advantage of by developing leaders’ meta-
competency i.e., self-regulation. This will allow leaders to perform effectively by
meeting the demands of various constituencies through awareness of what is needed,
and proactively engaging themselves to develop further competencies that are
needed. Thus, a leadership development intervention designed to increase self-
28
regulation will not only sustain a continuous cycle of leader development but also
reduce cost and expand the benefits of executive coaching to more leaders beyond
the upper echelons.
29
CHAPTER 2
Literature Review
CONTENT: This chapter presents an extensive literature review and a theoretical discussion of the approach used within leadership development. Section 2.1 is an introduction to leadership. This is followed by Section 2.2 which discusses the overview of the evolution of leadership theories. Section 2.3 distinguishes the difference between leader and leadership development. Next, Section 2.4 introduces the six widely practised leadership development programmes. This section focuses on 360-degree feedback and executive coaching, the limitations of current approaches are highlighted and an alternative approach, taking in the self-regulation perspective is discussed. Section 2.5 draws the arguments presented and proposed a set of hypotheses. Finally, Section 2.6 provides a conclusion to this chapter.
2.1. Introduction: Leadership defined
In his book, Rost (1993) discovered from his analysis of research on leadership, that
62% of researchers did not specify a definition of leadership. However, for those
who attempted to define leadership, it is a phenomenon in itself as there are countless
definitions (Yukl, 1989; Yukl, 2005). One notable definition of leadership which has
been cited many times in leadership research and literature stated that leadership is a
process whereby an individual influences a group of individuals to achieve a
common goal (Bass & Bass, 2008; Northouse, 2007; Yukl, 2005). This is a simple
definition of leadership but if we look closely, without (i) individual influencing, (ii)
a group of individuals being influenced or (iii) a common goal, the occurrence of
leadership does not exist. Leadership involves influence, it relates to how the leader
affects the followers. “Influence is the sine qua non of leadership” (Northouse, 2007,
30
p.3). Leadership occurs in groups, which is the context in which leadership takes
place. Leadership involves influencing a group of people who have a common
purpose. Groups can be small or big in size, from a work task group to the whole
organisation. Finally, leadership takes account of goals, whereby leadership involves
directing a group or individuals toward achieving a common objective. Thus,
leadership is a process whereby a shared desired outcome is achieved by a group of
individuals working together with the influence of a leader.
2.2. Overview of leadership research
As per the definition of leadership above, when applied successfully, leadership can
lead to the successful attainment of a goal. It is no wonder, that interest in leadership
can be considered as old as mankind. There are references to the topic in the history
of the majority of civilizations; from the ancient Egyptians and Chinese scriptures, to
the writings of Plato, Caesar and Homer’s Iliad (Bass, 1990). It is only in the early
1930s that systematic empirical research of the topic began (House & Aditya, 1997).
The most notable starting point of leadership research is the ‘Great Man’ approach
(Carlyle, 1907). The trait approach attempted to identify universal personal
characteristics of effective leaders based on the assumption that there are enduring
features that distinguish leaders and non-leaders. It gives rise to research into
personality using the ‘Big Five’ model as a way to interpret and categorise effective
leaders. Traits such as self-confidence, self-esteem, achievement are frequently
found to be correlated to leader effectiveness (Atwater, Dionne, Avolio, Camobreco,
31
& Lau, 1999; Judge, Erez, Bono, & Thoresen, 2002). Considering the long history of
research into leadership traits, only limited consensus has been reached. Recently,
Judge, Bono, Ilies and Gerhardt (2002), in their review, outlined that traits such as
extraversion and conscientiousness contribute to predicting leadership emergence.
Other research in leadership emergence also found self-monitoring, intelligence and
generalised self-efficacy to be contributing factors (Day, Schleicher, Unckless, &
Hiller, 2002; Lord, de Vader, & Alliger, 1986; Smith & Foti, 1998). Even more
recently, with the advancement of technologies such as functional magnetic
resonance imaging (fMRI) to investigate the biological underpinning of an effective
leader, a revival of the trait approach has brought forth again the question of whether
leaders are born or made.
To surmise, one of the main conclusions from the trait approach is that personality
does indeed matter and should be taken into consideration when predicting
leadership emergence. Thus, the accumulated research in this area indicates that there
are certain attributes to take into consideration when making selection decisions to
predict whether a more or less successful candidate will succeed in their current
leadership role within an organisation (McCauley & Van Velsor, 2004). However, as
put pertinently by Avolio and Chan (2008, p.198):
“…evidence of past reviews indicates that if one were to put the made part of
leadership over the born part as a fraction, then the denominator, although
important, would be relatively small compared to the numerator.”
32
The limitation to replicate and identify consistent traits contributing to leader
effectiveness led to the emergence of the behavioural approach to leadership.
Starting in the 1950s, researchers began a series of studies based on the assumption
that effective leaders performed certain identifiable behaviours towards their
followers. Two of the most prominent studies were conducted simultaneously at the
University of Michigan and Ohio State University. Findings from the studies
suggested that leadership behaviour could be divided into two dimensions;
consideration (focus on people) and initiation structure (focus on task). People
focused behaviour is when a leader takes a personal interest in subordinates, and
seeks to nurture strong interpersonal relationships. On the other hand, task focused
behaviour is when a leader is interested in developing a productive work group and
defines a structured work task for subordinates. Again, similar to the trait approach,
the underlying assumption of this approach is that there are universal characteristics
that could identify leaders – only this time, in the form of leaders’ behaviour instead
of leaders’ trait.
Even with the lack of empirical evidence supporting the link between the two
behaviours put forward by both studies (House, 1971), the approach can still be
observed in current leadership literature (House & Aditya, 1997). For instance, even
when the focal point of leadership theories focuses more on the psychological level
within the leader and how they actually think about and influence followers,
behavioural measures are still widely applied to assess leadership behaviour and
styles that are related to performance outcomes (Shamir, House, & Arthur, 1993;
33
Yukl, 2005). Charismatic leadership and transformational leadership are some
examples of leadership theories that were operationalised behaviourally (Bass &
Avolio, 1990; Conger & Kanungo, 1987) even though the focus of the theories is on
emotional appeal. On the other hand, cognitively based leadership theories such as,
attribution models of leadership rely on behavioural observations to explain how
leaders lead (Bresnen, 1995; Calder, 1977).
In addition, leadership development researchers and practitioners contributed to the
attention in behavioural approach through leadership training programmes which
often aimed at having impact on leaders’ behaviours and actions which can
positively impact performance outcomes. To illustrate this, many leadership
development training programmes have regularly combined a behavioural oriented
training focus with the use of feedback tools such as the 360-degree feedback
(Atwater & Waldman, 1998). Instead, the focus should be on changing the leaders’
mindsets in terms of self-awareness (Avolio, 2005).
Around the same time when the leadership field expanded to the behavioural
approach from the trait approach, Stogdill (1948) also agreed for more integration of
situational factors into the trait approach. His call was answered by the emergence of
the contingency approach in leadership research. Fiedler (1964) developed the
Least Preferred Coworker (LPC) Contingency Model, which focuses on the
relationship between a leadership style (determined from the LPC score) and the
situation in which leadership occurs. He proposed to match the most favourable
34
situations for leaders based on their characteristics that will allow leaders to become
more effective. On the other hand, House's (1971) Path-Goal Theory suggests that a
leader’s behaviour will affect followers’ job satisfaction and effort and this is
moderated by the situation characteristics. Similarly, Hersey and Blanchard (1972) in
their Situational Theory, also suggested that leaders should adapt their behaviour to
match the situation and followers’ maturity level. Thus, it is noticeable that
contingency theories converge into three main variables, the interaction between
leader, follower and situation which expand the understanding of leadership beyond
the ‘Great Man’ approach.
Within the contingency approach, Vroom and Yetton (1973) attempted to
conceptualise a model of seven decision-making styles (behaviours) depending on
the nature of the problem (situation) and the characteristic of the people being led
(followers) to identify a decision making style in which the leader could apply to be
more effective. In advertently, this model paved the first step towards the
information-processing approach of leadership because this model took into
consideration how leaders should process information in order to make decisions.
Also, Fiedler and Garcia (1987) in their research to better understand contingency
theory investigated the effect of situation induced stress on leaders and followers as a
form of a situational unfavourableness variable. As a result, they developed the
cognitive resource theory. The theory posits that under low stress, cognitive
capabilities are positively correlated with performance and experience is negatively
correlated with performance. On the contrary, under high stress, cognitive
35
capabilities are negatively correlated, and experience is positively correlated with
performance. Consequently, both perspectives within the contingency approach, have
led to a new direction for leadership research towards cognitive revolution in
leadership research.
Calder (1977) articulated that leadership is not directly observable because an
observer’s perceptions are based in part on attributions. This is put eloquently by
Bresnen (1995) that leadership is in the eye of the beholder. Leadership is a process
perceived by others and then labelled ‘leadership’ (Lord & Maher, 1990). There is
some degree of error or bias when attributing leadership effectiveness by followers
based on the implicit notion of leadership and this is coined Implicit Leadership
Theory (ILT) by Lord and Maher (1991), whose work is associated with the early
development of the cognitive processing approach. For example, an early empirical
study demonstrated that college students exposed to the same experimental
Assessment Feedback Planning Development integration
Receiving relevant information Evaluating the information &comparing it to the desired goal Triggering change Searching for options to change Formulating plans Implementing plans Assessing the effectiveness of plan
Table 2: Stages of executive coaching in comparison to stages of self-regulation
70
Therefore, leader development, instead of adopting a myopic view of solving the
immediate problem (e.g., by using an executive coach to regulate a leader’s action to
develop a particular competency which is needed at a particular moment in order to
be more effective), should be developing leaders’ self-regulation for long term
development. Interventions where leaders are trained with self-regulation should
allow leaders to perform effectively by meeting the demand of various constituencies
through awareness of what is needed through self-regulation, therefore proactively
engaging themselves to develop further competencies that are needed. Thus, it is
proposed that:
Hypothesis 1: A self-regulation intervention should lead to better leader and team
performance
Hypothesis 1a: A self-regulation intervention should lead to better leader
performance, measured as leader satisfaction, leader effectiveness and extra effort
Hypothesis 1b: A self-regulation intervention should lead to better team’s financial
performance, measured as retained profit, return on capital employed (ROCE),
earnings per share (EPS) and (negative) gearing
Hypothesis 1c: A self-regulation intervention should lead to better team’s assessed
performance, measured as presentation, business plan, group report, simulation
performance and reflective report.
Within the leadership development literature, it is acknowledged that time is crucial
in the study of leader development, ironically the limitation posed by time to conduct
longitudinal studies often prevent this (Gardner, Lowe, Moss, Mahoney, & Cogliser,
71
2010; Lowe & Gardner, 2000). Executive coaching as noted by practitioners as well
as researchers, always works within a time frame to attain change in leaders and
consequently, change in performance (Blattner, 2005; Ely et al., 2010; Feldman &
Lankau, 2005; Joo, 2005; Tobias, 1996).
Based on resource allocation theory (Kanfer & Ackerman, 1989), individuals possess
a limited store of cognitive and attentional resources. Attention will be diverted to a
resource demanding activity, and in contrast, fewer resources are needed if the task is
automated. Therefore, when a leader receives a self-regulation intervention, he or she
is exposed to multiple tasks (e.g., learning to self-regulate, at the same time as being
responsible for his/her regular tasks), and competing demands are likely to take
place. Furthermore, Kanfer and Ackerman (1989) state that a significant amount of
attentional resources are required to self-regulate. However, a study conducted by
DeShon, Brown and Greenis (1996) does not support the notion that self-regulatory
activities use a significant amount of attentional resources.
In congruence with the resource allocation theory, it is expected that after leaders are
trained on how to self-regulate, the leaders will divert attention and resources to
absorb new information, operationalise the new competency learned; lead their team,
and also strive to accomplish the goal expected of them as a leader. As suggested by
DeShon and colleagues, self-regulatory activities do not use up significant amount of
attentional resources and following this logic (DeShon, Brown, & Greenis, 1996), it
is expected that after the intervention, leaders would take some time (but not
72
significant amounts of time) to accumulate attentional resources necessary to
translate self-regulation learned into performance outcomes, and in time, demonstrate
increased performance. As the relationship between self-regulation training and
leader performance becomes more pronounced over time, it is proposed that it is
methodologically needed to measure benefits of self-regulation intervention over
time.
2.5.4. Leaders competency model
Competency models are the predominant approach to leadership development efforts
to identify those relevant competencies required for leading people toward
organizational goals (Wells, 2003, p.46). Competency models are useful for
articulating effective performance standards and aligning individual behaviours and
skills with organizational goals and strategies (Zenger & Folkman, 2002).
It is no wonder researchers and practitioners alike, have jumped onto the bandwagon
of the competency modelling movement to identify the taxonomy of competencies to
which leaders should have to meet such as the demands stated above. For example,
Moran and Riesenberger (1994) suggested that leaders should be able to work with
diversity, have long term vision, manage organisational change, motivate employees,
and manage conflicts. Srinivas (1995) defined eight competencies needed to meet
organisational challenges, they are; curiosity and concern with context, acceptance of
complexity and its contradictions, diversity consciousness and sensitivity, seeking
opportunity in surprises and uncertainties, faith in organizational processes, focus on
73
continual improvement, extended time perspective, and systems thinking.
Rhinesmith (1996), on the other hand, identified six competencies where leaders
need to manage complexity, be competitive, be adaptable, network, value
multicultural teamwork, manage uncertainty and manage learning. Brake (1997) put
forward four competencies in which leaders should have i.e., managing relationship,
business savvy, transformational and persona effectiveness. Jordan and Cartwright
(1998) identified the ability to maintain relational abilities, cultural sensitivity, and
ability to handle stress as some of the crucial competencies for leader effectiveness.
Goldsmith and Walt (1999) suggested that competence to thinking globally,
appreciating cultural diversity, demonstrating technological savvy, building
partnerships, and sharing leadership are all needed for future leaders. Conner (2000)
put forward six competencies; personal influence, business savvy, global perspective,
ability to motivate, entrepreneurship and strong character as needed by a good leader.
Mumford, Zaccaro, Harding, Jacobs and Fleishman (2000) proposed five
competencies that a leader needs to manage change. The first four are social
judgment skills, social skills, creative problem solving skills and knowledge. The
fifth competence is the willingness to exercise all the four competencies proposed.
Judge and Bono (2001) demonstrated that self-esteem and integrity predict
performance and similarly, Bueno and Tubbs (2004) identified communication skills,
motivation to learn, flexibility, open-mindedness, respect for others and sensitivity as
the most important leadership competencies. Battilana, Gilmartin, Sengul, Pache and
Alexander (2010) suggested that leadership competencies such as communicating the
74
need for change, mobilizing others to support the change, and evaluating the change
implementation is needed for leaders to implement change.
Competency models are the predominant approach to the leadership development
effort to identify the leadership competencies that are required for leading people
Mumford, Connelly, Marks, & Gilbert, 2000). Moreover, leaders need certain
knowledge sets in order to come to the solutions required in addressing these
challenges (Mumford, Zaccaro, Harding, Jacobs, & Fleishman, 2000). The
knowledge set also serves as a repertoire of behavioural responses from which the
leader can draw to solve problems effectively (Zaccaro, Foti, & Kenny, 1991).
Therefore the KSAO (knowledge, skills, abilities and other attributes) package of
leaders summarised in the form of competencies is crucial for leaders to perform
effectively in their role. Following this logic, it is proposed that:
Hypothesis 3: Leader competencies mediate the effect of training on performance in
that (i) self-regulation training leads to the leader developing relevant competencies
for his/her role and (ii) these competencies positively affects performance.
Hypothesis 3a: Leader competencies mediate the effect of training on performance in
that (i) self-regulation training leads to the leader developing relevant competencies
79
for his/her role and (ii) these competencies positively affects leader performance,
measured as leader satisfaction, leader effectiveness and extra effort.
Hypothesis 3b: Leader competencies mediate the effect of training on performance in
that (i) self-regulation training leads to the leader developing relevant competencies
for his/her role and (ii) these competencies positively affects the team’s financial
performance, measured as retained profit, return on capital employed (ROCE),
earnings per share (EPS) and (negative) gearing
Hypothesis 3c: Leader competencies mediate the effect of training on performance in
that (i) self-regulation training leads to the leader developing relevant competencies
for his/her role and (ii) these competencies positively affects the team’s assessed
performance, measured as presentation, business plan, group report, simulation
performance and reflective report.
2.6. Conclusion
The introduction of this chapter states the importance of leadership and the attempts
of leaders and practitioners to develop effective leaders. Next, the review of the
evolution of leadership theories informed the views and implications on leadership
development. It also highlighted that the practice of leadership development precedes
its scientific understanding (Avolio, 2005; Day, 2000) and there is a need to bridge
this gap.
In particular, the literature reviewed in leader and leadership development has
revealed that the phases of executive coaching reflect the process of self-regulation.
The executive coach plays the role of the ‘regulator’ in the equation of leader
development. Thus, it is not surprising that coaching has proved to be successful
80
especially when it is used to improve or gain specific leader competencies (Tobias,
1996). Looking at self-regulation theory, it explains the underlying mechanism
whereby individuals aim for congruence between their own and other’s perception of
their behaviour or competencies and therefore, will allocate resources and effort
towards reducing the discrepancies (Carver & Scheier, 2002). 360-degree feedback
applied on its own yields mixed positive findings because it only activates the first
stage of self-regulation i.e., it helps leaders to become more aware of cognitive
discrepancies between how the leaders sees themselves and how others see them,
hence helping them to recognise areas for development (Tornow & London, 1998;
Van Velsor, Taylor, & Leslie, 1993). However, the assumption here is, leaders who
are aware of the need for the development of certain competencies in order to
overcome their weaknesses and to perform better will change their behaviour
(McCarthy & Garavan, 1999), resulting in the conflicting findings as stated.
Self-regulation framework theorised that self-regulation consists of seven stages: (i)
receiving relevant information, (ii) evaluating the information and comparing it to
the desired goal, (iii) triggering change, (iv) searching for options to change, (v)
formulating plan(s), (vi) implementing the plan(s), and (vii) assessing the
effectiveness of plan(s) and interventions that can be designed to develop self-
regulation within individuals (Miller & Brown, 1991). Executive coaching when
applied was found to be effective because it completed the framework of self-
regulation, where it followed up from the stage of knowing to the stage of doing.
Following these, the current chapter synthesises a conceptual framework and
81
research hypotheses proposing the notion that self-regulation competency should be
developed in leaders instead, to facilitate development of relevant competencies
needed to be effective in their role, thus fostering a continuous development in
leaders.
The conceptual model theorised that 360-degree feedback and executive coaching,
together reflect the process of self-regulation. In other words, the executive coach
plays the role of the ‘regulator’ in the equation of leader development with the
application of 360-degree feedback during the start of the coaching process. With
this in mind, the author suggests that instead of adopting a myopic view of solving
the immediate problem e.g., using an executive coach to regulate leaders’ action to
develop a particular competency which is needed at a particular moment in order to
be more effective, leaders and organisations should be developing leaders’ self-
regulation for long term development. Interventions where leaders are trained with
self-regulation will allow leaders to perform effectively by meeting the demands of
various constituencies through awareness of what is needed through self-regulation,
and proactively engaging themselves to develop further competencies that are
needed. In turn, the relevant competencies developed will lead to better leader
performance.
The hypotheses proposed will be examined using a field experimental design with
control and experimental groups. Justification for the suitability of the
methodological approach will be discussed and justified in the next chapter.
82
CHAPTER 3
Methodology
CONTENT: This chapter provides a description of the methodological approach used to examine the hypotheses derived from the previous chapter. Section 3.1 is an introduction to the longitudinal field experiment. This is followed by Section 3.2, 3.3 and 3.4 which cover the research paradigm and design selected, as well as providing justifications for the suitability of the approach. Section 3.5 outlines the population and sampling techniques applied. Next, Section 3.6 discusses the steps involved in the data collection process; starting with a pilot study, a pretest, an intervention and lastly, two posttests. This is followed by Section 3.7 with the discussion of scale selection and Section 3.8 on how data will be analysed. Last but not least, Section 3.9 presents consideration of ethical issues involves in the research and, Section 3.10 gives a summary of this chapter.
3.1. Introduction
In the previous chapter, a conceptual model of leadership development, which
consists of a causal relationship between self-regulation training and leader
performance as well as the mediating effect of leadership competencies, was put
forward. In order to establish causal relationships within the model, typically an
experimental design is the most suitable as it allows manipulation and control of the
causality (Shadish, Cook, & Campbell, 2002). The current study will adopt a
longitudinal field experimental design to investigate the hypotheses proposed in
Chapter Two. As such, this chapter will discuss the generic philosophy, and
methodology of experimental designs, with justifications of the design selected.
83
3.2. Research paradigm
The purpose of this chapter is to discuss the research methodology; however, it
would be a gross oversight to ignore the influence of philosophy upon the
development of research design and the research process. Burrell and Morgan (1979)
define ‘paradigm’ as a general way to view the world or social reality. This social
world view is guided by basic theoretical assumptions, which will provide a frame of
reference, a form of theorising and an approach to research. The concept of paradigm
is useful since it allows theories to be grouped by common elements (Burrell &
Morgan, 1979). It further permits us to distinguish between the work of various
theorists and researcher, and allows us to become aware of our own frame of
reference and the implication this carries (Burrell & Morgan, 1979; Kirk, 1999).
Burrell and Morgan (1979) proposed four research paradigms; functionalist,
interpretivist, radical humanist, and radical structuralist. These paradigms are
primarily defined by three of the assumptions that Burrell and Morgan (1979) make;
ontology, epistemology and methodology. These assumptions, according to Gioia
and Pitre (1990) are the best way to characterise the four different paradigms.
Ontology refers to the assumption about the nature of social reality, in other words,
the phenomena being studied. Epistemology refers to the nature of how the
researcher understands the world and how knowledge can be acquired of the social
reality. Lastly, methodology refers to the ways in which to study social reality.
84
The functionalist paradigm underlies the current research. The functionalist paradigm
emphasises the seeking of causal explanation of social phenomenon with the
assumption that the researcher is objective and neglects the subjective state of the
Merlo, & Richver, 2004; Judge & Bono, 2000; van Knippenberg, van Knippenberg,
De Cremer, & Hogg, 2004; Seifert & Yukl, 2010).
A longitudinal field experimental design is selected for this research as it is deemed
most suitable as it allows evaluating interventions on leader’s performance as well as
89
its desired results between control and experimental groups. A field study allows the
researcher to conduct the experiment in real life settings (Christensen, 2007). The
Business Strategy Game (BSG) module was selected as a suitable setting for the
experiment. The structures and settings in which students interact in the simulation
program reflect the organisational setting. Group leaders lead and influence their
teams in developing competitive strategy, develop and manage the virtual company’s
portfolio, create a shareholder value, analyse the competitors and create customer
value. In addition to that the task, leaders need to manage the individuals and the
relationships between individuals within the team.
Figure 1: Research design model
All teams competed in the simulation and were graded in their performance for the
game simulation as well as the written assignments. The use of a business simulated
environment has been used previously (Rapp & Mathieu, 2007; Roux & Steyn, 2007)
to conduct experimental research to examine leadership and teamwork. The BSG
Pretest Randomly selected experimental group
Posttest 1
Pretest Randomly selected
control group
Posttest 2
Posttest 1
Posttest 2
Intervention
90
module provides a suitable setting for the current research to explore the relationship
between the independent and dependent variables by comparing between the control
and treatment group.
However, it has to be noted that this research does not fall under quasi-experimental
field design. The main difference between quasi-experiment and experiment is how
participants in the study are selected to receive the intervention. Shadish, Cook and
Campbell (2002) noted that “random assignment is not random sampling”. Within an
experiment, the researcher may use the most appropriate method to select individuals
who are representative and have similar characteristics of the overall population of
interest. However, the participants in the study must be randomly assigned into
control and experimental groups in order to qualify the study as experimental design,
which this study managed to follow (Section 3.6.3).
The field experiment approach is selected over a laboratory experiment because,
even though laboratory experiments allow for higher control of the variable under
investigation, it suffers artificiality and threatens external validity. This is due to the
fact that the highly controlled settings in the laboratory might not be transferable to a
real life context (Bryman, 2001). Thus, a field experiment design is closer to the
dynamics of the real world and inferences of the research findings are transferable
into practice.
91
On the other hand, it is arguable that a field experiment might suffer potential threats
of internal and external validity. Although the field experiment offers a fairly high
control over the study, the question of “did the intervention make the difference in
the outcome or other extraneous or confounding variables that caused the outcome?”
still stands (Shadish, Cook, & Campbell, 2002). Shadish and his colleagues have
identified a number of confounding factors such as history, maturation,
instrumentation, testing instruments, regression artefact, attrition and selection, that
can affect a study’s outcome. History, which are events occurring during the period
of the experiment and maturation, which is due to participants aging, could both
impact the changes at the end of the experiment (Bryman, 2001). However, in this
study, both factors were controlled by including a control group within the
experimental design. If both experimental and control groups are equally exposed,
then both groups are comparable (De Vaus, 2001). Testing instruments was not
applicable within this study as the researcher will use a questionnaire as a
measurement instrument and did not change the instrument selected. Regression
artefact refers to the measurement scores of participants tending to move towards the
mean, even without intervention (Shadish, Cook, & Campbell, 2002). Such incidents
need to be controlled in order to draw valid inferences from research findings. To
avoid this, the researcher used the proposed solution of a randomisation assignment.
Sometimes, some participants in an experimental study could not complete the study
due to certain circumstances and this is fairly common. The researcher controlled for
attrition during the data analysis. Finally, although the experiment randomly
allocated participants into control and experimental groups, there could be the threat
92
of self-selection biases where participants possessing certain characteristics are more
likely to turn up for the intervention. Participants were informed that the intervention
would improve their leadership skills, it is possible that participants who already
posses higher self-regulation are more likely to attend the intervention. Thus,
measurements for self-regulation and other performance measures were taken during
pretest and were analysed for any significant difference between groups. Results are
presented in Chapter Four.
Pretest Control Group Randomisation
Internal validity threats
History
Maturation
Testing instruments
Regression to mean
Attrition
Selection
External validity threats
Interactive effects of testing
Interactive effects of sampling
Table 3: Techniques for controlling external and internal validity of experimental
design
The researcher also considered the potential threats to external validity such as
interactive effects of testing and interactive effects of sampling (Bryman, 2001;
Christensen, 2007; Cooper & Schindler, 2003). As the current research consists of
pretesting, there is a possibility that participants could become more or less sensitive
93
to experiment variable or treatments. However, pretesting is crucial within an
experimental design to make an initial comparison between participants in control
and experimental groups so they are not significantly different on relevant variables.
Pretesting also allows for the control of interactive effects of sampling in case
random assignment of participants into teams showed to be fallible. Finally, Table 3
summarises the techniques by which the researcher applied to control any threats to
external and internal validity of the experimental design.
The use of a quantitative method permits generalisation and wider application of
results through the use of large, representative samples (Baum, 1995). In view of the
research aim, generalisability allows the application of results to the entire
population even though situations do not permit sampling of the entire population.
Furthermore, a quantitative method allows researchers to represent experiences and
other complex phenomena to numbers (Baum, 1995). This simplifies the data and
adds a degree of objectivity to analyses. Numbers are also valuable, since they permit
a range of statistical analyses to be carried out quickly. Doctoral research falls
within the constraint of a time frame and these methods are often not as time-
consuming as qualitative research methods hence allowing researchers to use a larger
sample size in a short period of time.
94
Since the questionnaire is the chosen technique for data collection, several scales
measuring the intended construct will be used. The aim of adopting this method is to
enhance the validity of measurement to produce more robust data for analysis.
3.5. Population and sample
Before proceeding with data collection, it is important to understand and identify the
samples that will be taken. Three basic steps were used in selecting the sample for
this research; (i) defining the population, (ii) specifying the sampling technique and
(iii) determining the sample size.
The first basic step was to define the target population, which refers to the set of
individual units which the research question seeks to find out about (Bryman, 2001).
Therefore, any individuals holding a leadership position was defined as a member of
the population for this research. It is extremely unlikely for a researcher to have the
time or resources to conduct research on the entire population, thus a representative
sample from the population should be selected using the most appropriate sampling
method. This sample allows the researcher to draw inference from the findings of the
sample and generalise the findings to the population (Clark-Carter, 2004).
Within purposive sampling, selected individuals needed to posses characteristics
specified by the researcher. In this case, the purposive sampling technique was
applied in selecting the sample. Using a purposive sampling technique, the researcher
is able to specify the characteristics of the population of interest and locate the
95
individuals who match those characteristics within the Business Strategy Game
(BSG) module. Characteristics such as: (i) participants need to hold the position of a
leader, (ii) participants are fairly new to the particular leadership tasks, position and
role requirements, and (iii) participants need to be leading team members to achieve
specific goals within a time frame, were considered during the selection process.
The BSG module is taken by all second year business degree students in Aston
Business School. Within each class, students were divided into a four- to five-person
team by the Business School programme administrator who balances the relative
ethnicity, gender, country of origin and different disciplines across the groups.
Within a team, apart from the leader, each team member has a specific task
(marketing, operations, human resource and finance) to reflect organisational
functions (see Table 4 for detailed role description of team member).
Role Role description
Managing Director
Managing and integrating strategies from all departments, planning and leading meetings, promote teamwork, manage conflict and relationship in team, lead team to achieve company’s goal
Marketing Director Conduct market research, identify target market, position product, plan promotional strategies, pricing of product
Operations Director Set up manufacturing factory, manage operational strategies, product quality control, reduce cost per car, manage supply chain
Human Resource Director Recruiting employees, manage wage and bonus, training and development, manage Human Resources issues such as motivation
Finance Director Reporting, forecasting, budgeting, control cost, managing company’s cash flow
Table 4: Role description for team members in the BSG module
96
The teams meet each week to manage a virtual European car manufacturing
company that runs across three virtual years. The work tasks include the strategic
planning and assessment of the markets and competitors; implementing marketing,
operation, human resource management and financial strategies; and at the same
time, to meet shareholders expectations to generate return on investment. For
detailed activities of the module, please refer to Table 5.
The selected sampling technique falls under non-probability sampling which has
been criticised for its limitation in representing the population (Clark-Carter, 2004).
However, as noted by Shadish, Cook, & Campbell (2002) within experimental
design, random sampling is uncommon and suffers practical constraints for the
researcher to randomly sample the population. Kish (1987), an advocate for random
sampling also admitted that random sampling is ideal but rarely feasible. Evidence of
this can be seen in previous research conducted using purposive sampling (c.f., Keith
However, for this research, based on the principles suggested by Shadish, Cook and
Campbell (2002), the researcher ensured the surface similarity and ruled out
irrelevancies when selecting a sample to ensure construct and external validity of
using purposive sampling. Surface similarity. Team leaders from the BSG modules
were identified to hold the position of a leader; are new to this leadership position
97
WEEK SCHEDULE ACTIVITIES* DATA COLLECTION
1 Lecture1 Overview of the module, learning objectives and learning outcomes
2 Lecture 2 Learning styles Tutorial 1 Team members meeting for the first time and getting to know each other
3 Lecture 3 Overview of car manufacturing industry and Business Plan (BP) proposal
4 Lecture 4 Overview of Business Strategy Game (BSG) simulation software PRESTEST 1 Tutorial 2 Tutorial on strategies of how to enter the car manufacturing industry.
Team members establish roles within the team (e.g. Managing Director, Finance Director, Operations Director, and Human Resource Director) and create brand image (company name, objectives and mission statement, vision to inform strategies, etc.)
5 Lecture 5 Overview of library resources and information system
Simulation 0 Test practice to get familiar with the BSG software
6 Lecture 6 Strategies for working in teams and working in diversity INTERVENTION Tutorial 3 Tutorial on how to give a good presentation. Teams refine strategy and prepare for BP presentation to examiners from the industry
acting as potential investors (from the industry)
7 Lecture 7 Writing styles, focussing on reflective writing Presentation Presentation of BP to examiners from the industry acting as potential investors (from the industry such as Vauxhall, Ford etc.)
8 BP deadline Submission of BP proposal
9 X 10 Tutorial 4 Tutorial provided feedback on presentations and business plan.
Teams refine strategies for the first simulation.
11 Simulation 1 Christmas Break (3 weeks)
98
12 X 13 X 14 Tutorial 5 Tutorial on the requirements for Managing Director’s presentation reflecting on strategies implement
Teams evaluate performance and feedback of first simulation.
15 Simulation 2 16 Tutorial 6 Tutorial on the requirements for Finance Director’s presentation to the first and second Annual General Meeting of the board of
directors (the tutors assumed the role of the board of directors) Managing Director presented performance of the company since its launch Teams evaluate performance and feedback of second simulation
POSTTEST 1
17 Simulation 3 18 Tutorial 7 Tutorial on the requirements for Finance Director’s presentation to the first Annual General Meeting of the board of directors (the
tutors assumed the role of the board of directors) Finance Director presented first year financial performance of the company Teams evaluate performance and feedback of third simulation.
19 Simulation 4 20 Tutorial 8 Tutorial on the requirements for group and reflective assessment report.
Teams evaluate performance and feedback of fourth simulation.
21 Simulation 5 Easter Break (4 weeks)
22 Tutorial 9 Finance Director presented first year financial performance of the company. Teams evaluate performance and feedback of fifth simulation
POSTTEST 2
23 Simulation 6 24 Tutorial 10 Tutorial provided further help on group and reflective report.
Teams evaluate performance and feedback of sixth simulation.
*Teams tend meet outside scheduled sessions at least once every week
Table 5: Weekly schedule and activities for the Business Strategy Game module
99
and role expectation, and they need to lead team members to achieve specific goals
within a specific time frame. Identifying the main characteristics of the participant
and settings allows findings from the study to be generalised to a population with
similar important characteristics. Ruling out irrelevancies. An example of a feature
of the sample that could be argued to be irrelevant is that the sample consists of
students. The study is interested in how self-regulation as a competency affects
leaders’ performance when faced with novel and complex tasks across situations. A
student based sample can be argued to be comparable. Team leaders in the BSG
teams, like leaders in general, were facing new and novel leadership tasks and
expectations in the position which they held. Hence, the use of a student sample has
minimal impact on the size or direction of a cause and effect relationship of the
research question.
Finally, the sample size required for the research depends on many possible
influences (Cooper & Schindler, 2003). The size of the sample needed can be
affected by the nature of the research and analysis, sampling techniques applied, time
constraints, non-response and completion rates, similar research in the past and
resource constraints (Bryman, 2001; Cooper & Schindler, 2003).
The BSG module consists of approximately 52 leaders and 196 team members,
which represent the population size of this study. Comparing to previous studies, this
size is more than sufficient with regards to completion rates, number of variables,
aggregation of levels, and using repeated measure of analysis of covariance (Avolio,
Follower work motivation. The measure of leaders’ influence on followers’ work
motivation was measured using 3-items within the MLQ-5X outcome measure. This
scale captures the willingness of followers to exert extra motivation as a result of the
influence. A sample of this item includes “Gets me to do more than I expected to
do”, which was rated on a 5-point scale ranging from “Not at all” to “Frequently, if
not always”. The reported Cronbach alpha for this scale was 0.87. Using Partial
Least Squares analysis, the developers reported a strong convergent validity (Bass &
Avolio, 1990; Sosik & Megerian, 1999).
3.7.2.3. Leaders’ competencies
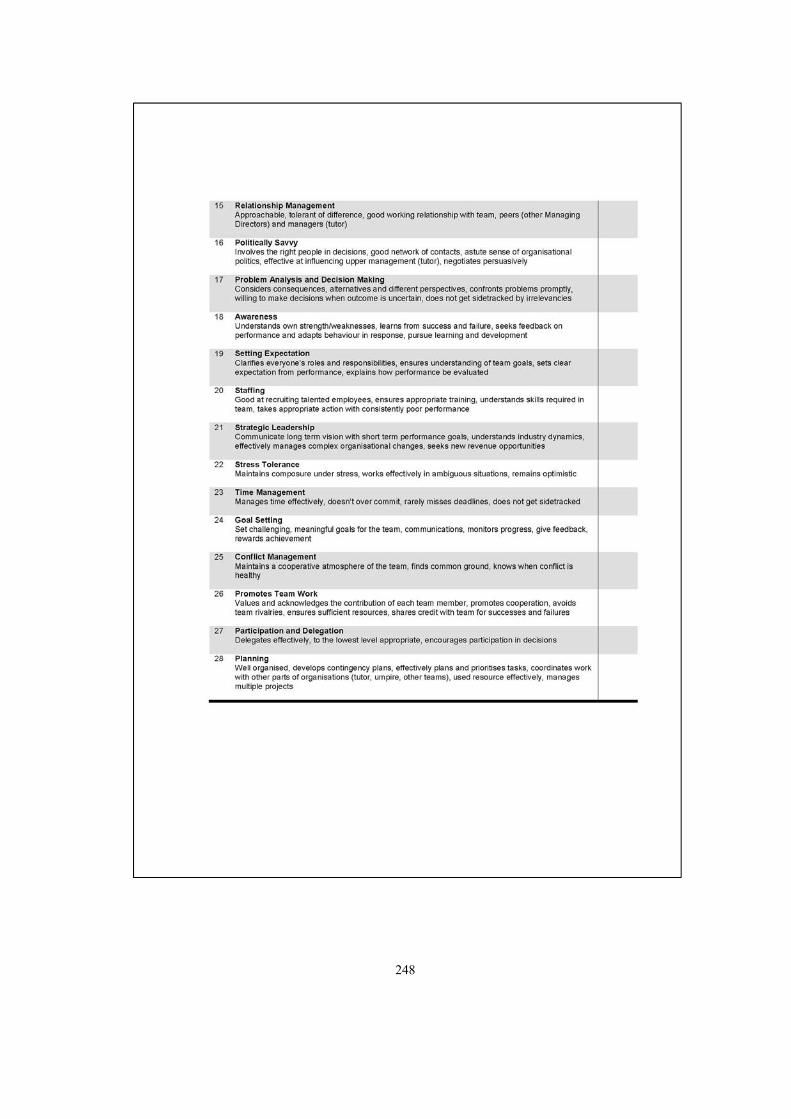
Thirty nine items from the 360° Professional Quest were used to measure leaders’
behaviours, corresponding to five competencies; basic leadership skills, relationship
management, planning, promote teamwork and keeping others informed. The five
competencies selected from a total of twenty-eight competencies listed in the 360-
degree feedback questionnaire. Selection was based on the ratings of importance and
relevance weighed by the module lecturer and tutors who taught the module and
students who had taken the module previously. The five selected competencies were
perceived to be highly relevant to the team leader to perform successfully in the
required tasks within the BSG module. Reliability and validity for this measure is
reported in Chapter Four.
112
3.7.2.4. Self-efficacy
General self-efficacy was measured using Chen, Gully and Eden's (2001) New
General Self-Efficacy (GSE) scale. This scale captures the construct of a person’s
belief in his or her “overall competence to effect requisite performance across a wide
variety of achievement situations” (Eden, 2001, p.75). As self-efficacy within
individual leaders may influence the outcome of leader intervention (Gist, Stevens, &
Baveita, 1991; Judge, Jackson, Shaw, Scott, & Rich, 2007; Tai, 2006), the measure
of self-efficacy was used to control for the effect of individual differences to ensure
that the outcome of the intervention is not influence by the leaders’ initial individual
beliefs in their competence to achieve the desired outcome.
The scale consists of eight items that are rated on a 5-point scale with the indicators
from “Strongly Disagree” to “Strongly Agree”. Examples of these items are; “I will
be able to achieve most of the goals that I have set for myself,” “I will be able to
successfully overcome challenges” and “When facing difficult tasks, I am certain
that I will accomplish them”. Chen, Gully and Eden (2001) reported a Cronbach
alpha of 0.92 and stability coefficients between r = 0.62 to 0.65. This range is
reasonably high for variables capturing individual differences (Crocker & Algina,
1986). The GSE also showed strong convergent validity.
3.7.2.5. Team financial performance indicators
The leaders’ team financial performance was assessed using four financial measures;
retained profit, return on capital employed (ROCE), gearing, and earnings per share
113
(EPS). Data was obtained from the BSG simulation. Firstly, profit is the remaining
profit retained by the team after all deductions have been made (e.g. tax, interest,
dividends, etc.). If the team is not performing well, the team may retain a loss
(negative profit) instead of a profit. The second financial performance indicator,
ROCE is calculated from the profit as a percentage of the capital employed thus
signifying how well the money invested into the business is providing a return to the
investors. Thirdly, gearing is calculated as the ratio that compares the company’s
equity or capital to borrowed funds. In brief, gearing refers to the extent to which the
company is funded by debt. The higher the gearing of the company, the more the
company is considered risky. Finally, EPS is calculated by the total profit of the
company divided by the number of shares. EPS serves as an indicator of a company’s
profitability. All four financial indicators are useful in making comparison across
companies in terms of company performance (Waldman, Javidan, & Varella, 2004).
The financial performances of the team hold high consequence to the module
assessment.
3.7.2.6. Team assessment
Students taking the BSG module undertook five different assessments; writing a
business plan proposal, presentation of the business plan, group report, reflective
report, and simulation performance. All five assessments contributed to one hundred
percent of the module’s marks. The business plan proposal assessed the teams’
strategies and planning for their company based on their research of the market,
application of knowledge from different areas such as marketing, operations, human
114
resource management and financial management to compete with their competitors
and be successful. Next, based on the business plan, the team was assessed by
external examiners on their presentation skills in convincing potential investors to
invest money into their company. After operationalising their strategies into the
computer simulated business environment, teams then produced a report reflecting
upon their strategies. Also, each individual within the team reflected upon their
experience of working as a team the report. Both reports were also assessed. Finally,
the performance of the teams during the simulation was also graded by their tutors.
Each of the assessments was graded based on percentage system.
3.8. Data analysis
The purpose of this study is to analyse how self-regulation is related to outcome
variables of leaders’ performance and team performance and to ascertain whether
leaders trained in self-regulatory process are more effective. To do so, the computer
software program, Statistical Package for Social Science (SPSS) version 16 was
used.
The process used to test the research hypotheses was fourfold. First, Cronbach’s
alphas (Nunally, 1978) were calculated to check for internal consistency and to
determine test-re-test reliability (Zeller & Carmines, 1979), Pearson correlation was
used to compare data collected in three stages. In addition, Confirmatory Factor
Analysis (CFA) using SPSS and AMOS was conducted to measure scale validity
115
(Byrne & Crombie, 2003). Second, descriptive and correlational results were
reviewed for statistically significant relationships between variables.
Third, the data was analysed using a repeated measures ANCOVA (Field & Hole,
2003; Maxwell & Delaney, 2004). The significance of main effects of intervention
leader and team performance measures were used to test the hypotheses with leaders’
and teams’ performance measures as dependent variables. This analysis was
appropriate for three main reasons. Firstly, this study is interested in measuring the
effects of the intervention relative to the control subjects and this method of analysis
permit the researcher to make such comparison. Also, the two groups (experimental
and control) might start off with different scores during pretest thus the analysis
selected allowed the comparison of both groups. Finally, this method allows for the
analysis of the increase in performance captured in the longitudinal measures of the
constructs i.e., repeated measures of the participants and outcomes.
Fourth, a series of analyses were conducted to test for mediating effects of leaders’
competencies on performance. According to Baron & Kenny (1986), three series of
regression analyses need to demonstrate; (i) the independent variable must
significantly predict the mediating variable; (ii) the mediator variable must then
significantly predict the dependent variable; and finally, (iii) the relationship between
the independent variable and dependent variable should be not significant or weaker
when the mediator is controlled for. However, the current study is a field
experimental design, thus the conventional approach to conduct mediation analysis is
116
not the most appropriate. However, in accordance to Yzerbyt, Muller and Judd
(2004), to evaluate the presence of a mediation effect in the current field
experimental study, the mediator variable (i.e., leaders’ competencies) was included
as a covariate in the repeated measure analysis of covariance (ANCOVA). The effect
of the mediating variable must be significantly related to the main effect. At the same
time, the F-value for interaction effect must diminish and become non-significant
when the mediator is included as a covariate. Perfect mediation, as explained by the
authors, occurs when the independent variable has no effect on the dependent
variable when the mediator is controlled. Perhaps more relevant to applied research,
a partial mediating effect becomes tenable when the relationship between the
independent variable and dependent variable is reduced or lessened when the
mediator is controlled. Finally, a Sobel (1982) test was then conducted to further
assess the significance of the mediation.
3.9. Ethical considerations
This research met the ethical requirements of Aston Business School and conformed
to the UK Integrity Research Office (UKRIO) Code of practice for research. Prior to
conducting the study, the methodology and procedures were reviewed by the
Research Ethics Committee (REC). The following issues were considered and
respected when the research was conducted.
117
3.9.1. Informed consent
Signed informed consent was obtained from all of the participants in the study. The
essence of informed consent is to allow participants to make an informed decision
whether to agree or refuse to take part in the current study after being given
comprehensive information regarding the nature of the research (Homan, 1991).
Thus, participants were informed of the purpose of the study, how the research
process would unfold, the length of time they would be required to participate, what
would be expected of each participant, how the data would be collected and treated,
how anonymity of their identity would be maintained when reporting data collected,
and finally, the voluntary nature of the research was also emphasised. A consent
form was provided for participants to sign prior to the start of the research (Appendix
III and Appendix IV).
3.9.2. Risk and benefit analysis
When research is conducted, it is important to predict that the foreseeable risk does
not outweigh the anticipated benefits (Oliver, 2003). A good experimental design
often requires the use of a control group where a group of participants do not receive
the intervention (treatment) while the participants are being studied. This highlights a
specific ethical issue that when the intervention proves to be beneficial, participants
assigned to control group may perceived that they are disadvantaged (Homan, 1991).
As the current research proposed an intervention to improve leaders’ performance
which consequently should lead to better team performance, REC raised this
potential concern. REC stated that there was a potential risk that students in the
118
control group did not receive the potential benefit of the intervention. The researcher
had foreseen such a risk and had therefore integrated a leader training intervention
for all students (not only the leaders from control group, but all students taking the
BSG module) after the study was completed. After rigorous evaluation of the risk
and benefits, the researcher received approval from the REC and the Director of
Undergraduate Programmes (gatekeeper) that the benefits outweigh the risk in the
long run. If the proposed intervention was successful and had positive effects on
students’ performance, it could be integrated within the module in the future.
3.9.3. Confidentiality, anonymity and data protection
In keeping with the Data Protection Act (1998), under which the data handling
procedures at Aston Business School are registered, participants were informed
verbally and in writing on how their confidentiality and anonymity will be upheld.
All electronic data will be kept for 5 years and physical data (questionnaires) will be
kept for 2 years. Homan (1991) suggested that all research materials were kept in
secure and locked setting. Only the researcher has the access to identify the data. All
data collected were sanitised by allocating a unique code to remove all identifying
information of participants. Participants were also informed that they were free to
withdraw their informed consent to participate in this study. Once notified, the
researcher will then delete any relevant data immediately from the database.
119
3.9.4. Safety of researchers
After evaluating any potential risks that the researcher may encounter when
conducting the research, it was concluded that the researcher faced minimal risk of
threat or abuse, psychological trauma as a result of interaction, accusations of
improper behaviour, exposure to risks of everyday life and social interactions, and
causing psychological or physical harm to others.
3.9.5. Research involving university staffs or students
As the research was conducted on Aston Business School students and some
members of staff, it was important to minimise the risks whereby they may perceive
that they were coerced into participating, especially if there is a hierarchical
relationship between researcher and participants (e.g., student-tutor relationship). To
ensure that students participating in the research did not have an academic advantage
compared to students choosing not to participate, any assessment for students that
participated in the study were cross marked by another 2 members of staff. This is to
ensure fairness between participating and non-participating student.
3.9.6. Research plan for collection, storage and analysis of data
As mentioned in Section 3.9.3, all research materials were kept in a secure and
locked setting and only the researcher has the access to identify the data. All data
collected was sanitised by allocating a unique code to remove all identifying
information of participants. Participants were also informed that they were free to
120
withdraw their informed consent to participate in this study. Once they notified the
researcher, their data would be deleted immediately from the database.
3.10. Conclusion
The purpose of this quantitative, field experimental research study was to discover
the effect self-regulation intervention (independent variable) had on leaders’ and
team’s performance (dependent variables). The self-regulation measures of leaders
who participated in the intervention were compared, via a pretest and two posttest
survey questionnaires using carefully selected scale, with leaders who were assigned
to the control group. Forty leaders took part in the study, with twenty-five acting as a
control group. The other fifteen leaders took part in a leadership development
workshop (experimental group) to improve their self-regulatory competency. The
control and experimental groups’ leaders and their followers completed a pretest and
two posttest survey questionnaires to determine each leader’s performance measure.
Also, data from objective measures such as, financial measures generated by BSG
software package and group assessments were obtained.
The raw data collected was recorded on SPSS using all pretest and posttest
information. The demographic data of age, sex, leader experience, and work
experience was gathered from each participant in this study. Chapter Four reports
and analyses the results generated by this research.
121
CHAPTER 4
Analyses and Research Findings
CONTENT: This chapter presents the analyses and findings from the longitudinal field experiment. Section 4.1 is an introduction to the longitudinal field experiment. This is followed by Section 4.2 on data screening, Section 4.3 on reliability and validity of construct and Section 4.4 on aggregating data to group level. Next, Section 4.5 presents the descriptive data of the study and Section 4.6 on the correlation among the study variables. Section 4.7 discusses the manipulation check of the intervention. This is followed by Section 4.8 which reports the analyses of the intervention effects on performance and Section 4.9 reports the analyses of intervention effects on leader competencies. Section 4.10 presents the analyses of mediation relationships and finally, the results are summarised in Section 4.11.
4.1. Introduction
In Chapter Two, a set of hypotheses was put forward about the effect of self-
regulation intervention on leader and team performance. In order to test the
hypotheses empirically, a longitudinal field experimental study was design as
proposed in Chapter Three. In this current chapter, data is analysed and the results
are presented from the study. The longitudinal field experimental study manipulated
the leadership training program to develop self-regulation of the leaders in an
experimental group. The objective of this experiment is to establish whether leaders
trained in self-regulation will yield better leader performance as well as better team
performance. In this experiment, a control group was included where randomly
selected leaders did not receive the intervention. Performance measures were taken
122
across three stages (once before the intervention and twice after the intervention). As
such, the longitudinal field experiment study provides an investigation of the causal
link between self-regulation intervention and leader as well as team performance.
The following sections report this experiment.
4.2. Data screening
Handling of missing data is crucial as it could cause biases in results obtained.
Therefore, missing data was identified prior to statistical analyses. There could be
several reasons for missing data, the main one being participants not answering
several items of questions; to participants not answering the entire section of
questionnaire (Saunders, Lewis, & Thornhill, 2000). The current study treated
missing data with caution, as having to delete an entire case due to missing data
could lead to reduction of effective sample size.
Across the three stages of data collection, all participating tutors completed their
questionnaires without any missing data. There were a total of 52 questionnaires
from participating leaders and 196 for participating followers. Seven out of 52 leader
cases were removed either due to an entire section of the questionnaire not having
been completed or over 5% of data were missing from all three questionnaires
collected during the longitudinal study. Twenty-two cases from the followers’
responses were deleted for similar reasons. Thus, the final sample size of consisted of
45 leaders and 174 of followers.
123
From the remaining cases, rather than eliminating the cases that had less than 5% of
data missing, values were imputed using the Expectation-Maximisation (EM)
algorithm in SPSS. This method was recommended by Hair, Black, Babin, Anderson
and Tatham (2006) for data that are missing randomly. As the values were found to
be randomly missing across both variables and cases, it is assumed, therefore to be
missing completely at random. Most importantly, using this method allows the
preservation of the sample size for both leaders and followers.
4.3. Reliability and validity of construct
Before performing analyses to test proposed hypotheses, a series of preliminary
analyses were conducted to examine the reliability and validity of measures
associated with independent, control, mediating, and dependent variables. The aim of
performing reliability test is to assess the scale reliability and the homogeneity of
items in a multi-item scale to ensure high internal consistency. In other words, the
scale is consistently reflects the construct it is measuring (Field, 2005). A scale that
is high in internal consistency should have a reliability estimate (Cronbach’ alpha, α)
of above .70 as suggested by Nunally (1978).
After ensuring a high level of internal consistency, construct validity was tested
using Confirmatory Factor Analysis (CFA) with AMOS 16. CFA is a theory based
analysis that evaluates the latent variables as identified by measured factors that has
been developed by previous researchers (Byrne, 2001). Factor loading identifies the
latent variables as they could not be directly measured and theory determines how
124
the latent variables are expected to relate to the factors. Several indicators are used to
assess the fit of the model such as, chi-square (χ2) statistic, Comparative Fit Index
(CFI), Root Mean Square Error of Approximation (RMSEA), Normed Fit Index
(NFI) and Goodness of Fit Index (GFI) (Bentler & Bonett, 1980; Byrne, 2001;
Schumacker & Lomax, 2004).
Chi-square is a frequently used as a fit statistic. For a good fit of the model, a lower
value and a non-significant chi-square indicates a better fit of the model to the data
(Byrne, 2001; Schumacker & Lomax, 2004). However, chi-square has a limitation
where it is sensitive to sample size. A large sample size will tend to cause chi-square
to become large and significant and may lead to a rejection of a model with good fit
(Schumacker & Lomax, 2004). Therefore, additional fit statistics are used for
evaluation and support the conclusion drawn for the model to data fit. RMSEA
values of .05 indicate a close fit and also RMSEA values in the range of up .05 to .08
indicate fair fit (Browne & Cudeck, 1989). A CFI value of above .90 indicates a
good model fit to the data (Byrne, 2001; Hu & Bentler, 1999). NFI is an incremental
fit index which measures the improvement of a target model to a more restricted
baseline model and therefore, NFI is indicative of a good model fit when its value
approaches .90 and above (Hu & Bentler, 1999). NFI indicates good fit of the model
to the data when its value approaches 1.0. GFI is based on the ratio of the sum of
squared differences between the observed and reproduced matrices to the observed
variances and does not depend upon the sample size to measure the model fit (Byrne,
125
2001). GFI equal or exceeding a value of .90 is an indication of good fit of the model
(Hu & Bentler, 1999).
Based on the above, the following section evaluates and reports the reliability and
validity of the independent, control, mediating, and dependent variables.
4.3.1. Independent variable
Self-regulation. Leaders in both control and experimental groups were asked to
complete a 10-item questionnaire on self-regulation once before and twice after the
intervention. The reliability (Cronbach alpha, α) for self-regulation was .75,
exceeding the recommended reliability estimates recommended by Nunally (1978).
The confirmatory factor analysis showed that the one-factor model of self-regulation
provided acceptable fit to the data, χ2 (33, N = 79) = 38.63, p > .05, CFI = .95,
RMSEA = .05, NFI = .76 and GFI = .91.
4.3.2. Mediator
Leader competencies. Next, the reliability analysis was conducted on the mediator,
i.e., leader competencies. The 39-item scale for leader competencies, which was
completed by team members and tutors (supervisors), yielded a Cronbach alpha of
.97, which is above the threshold of .70. Examining the fit indices suggests that the
five-factor model (χ2 (685, N = 411) = 1891.68.00, p < .05, CFI = .91, RMSEA =
.06, NFI = .86 and GFI = .90) provided an adequate fit for the leader competencies
data. The chi-square for the model is significant. However, the chi-square value is
126
sensitive to sample size (Schumacker & Lomax, 2004). Medsker, Larry and Gina
(1994) recommended the use of CFI value which is less sensitive to sample size to
determine the quality of the model fit. In this case, the CFI is above the
recommended value, therefore the model is concluded to be a good fit.
4.3.3. Dependent variables
Team members in both, control and experimental groups were asked to complete a 9-
item questionnaire on leader performance once before and twice after the
intervention. Leader performance is a three factor scale consisting of leader
satisfaction, leader effectiveness and extra effort (3-items for each respective factor).
The Cronbach’ alpha (α) for leader satisfaction was .81, leader effectiveness was .85
and extra effort was .73, all exceeding the recommended reliability estimates. The
confirmatory factor analysis showed a significant chi-square value (χ2 (24, N = 286)
= 47.00, p < .05) as chi-square value is sensitive to sample size (Schumacker &
Lomax, 2004). Therefore, CFI value which is less sensitive to sample size is used to
determine the quality of the fit of the model (Medsker Larry & Gina, 1994).
Examining the rest of the fit indices (CFI = .98, RMSEA = .05, NFI = .96 and GFI =
.97), suggests an adequate fit for the leader performance data. Thus, the results
support the discriminant validity of the leader satisfaction, leader effectiveness and
extra effort measures.
127
4.3.4. Control variable
Self-efficacy. Next, the reliability analysis was conducted on the control variable,
self-efficacy. The 8-item scale for self-efficacy yielded a Cronbach alpha of .90,
which is above the threshold of .70. Fit indices (χ2 (18, N = 79) = 24.63, p > .05, CFI
= .98, RMSEA = .06, NFI = .93 and GFI = .93) for the five-factor model of leader
performance provided acceptable fit to the data. These results support the
discriminant validity of the leader satisfaction, leader effectiveness and extra effort
measures.
4.4. Aggregation to group level
From a theoretical point of view, this study was designed at a leader level. However,
some of the measures of leader’s performances (dependent variables) were collected
at the follower’s (team member) level. The number of followers providing ratings for
each leader ranged from three to four. To ensure the congruency of the level of
theory, measurement and statistical analyses (Klein, Dansereau, & Hall, 1994), it is
necessary first to aggregate the data in order to obtain the leader’s level construct by
taking the average of followers’ ratings of the leaders. The aggregated followers’
ratings will subsequent hypothesis testing to tap into the shared followers’ perception
of leaders’ performance.
To justify aggregating followers’ ratings for each leader, James, Demaree, and
Wolf's (1984) agreement index (rwg) of within-group interrater agreement was
calculated for each dependent variable and rwg values above .70 indicate acceptable
128
consensual validity. Then, the intraclass correlation coefficients (ICCs) were
examined. ICC(1)2 assesses the reliability of individual ratings. A one-way ANOVA
with the leader’s team as the independent variable and the followers’ rating for each
the dependent variable was conducted. If ANOVA’s results displayed that within-
group variances are homogeneous while variances across groups are significantly
different, this would indicate that aggregation is appropriate (Dansereau, Alutto, &
Yammarino, 1984). ICC(2)3 assesses the reliability of the leader’s group average
rating and ICC(2) values above .50 are suggestive of acceptable discriminant validity
(Klein, Conn, Smith, & Sorra, 2001). However, ICC(2) value is strongly proportional
to team size (Bliese, 2000). Hence, in this study, the decision to aggregate followers’
ratings mainly depended upon ICC(1). Statistics of agreement (rwg) and reliabilities
(ICCs) of ratings by followers are reported in Table 7.
Leader satisfaction. Initial examination of rwg index showed five teams’ scores were
unacceptable and they were excluded from further analyses. The mean rwg index
before intervention was .726, and after intervention was .763 and .745 respectively.
One-way ANOVA detected significant leader level effects in all three measurements
(F(40,84) = 1.787; p < .05), (F(40,72) = 2.164; p < .01) and F(40,75) = 2.103; p < .01)
2 The ICC(1)s were determined by using the following: Level 1 variance component/intercept variance component + Level 1 variance component. 3 The ICC(2)s were determined by using the following: Level 1 variance component/mean square between groups
129
Time 1 (Pretest) Time 2 (Posttest 1) Time 3 (Posttest 2)
Variable Mean
(SD)
Mean
rwg F (40,84) ICC(1) ICC(2)
Mean
(SD)
Mean
rwg F (40,72) ICC(1) ICC(2)
Mean
(SD)
Mean
rwg F (40,75) ICC(1) ICC(2)
Leader Competencies 5.328
(.754) .808 4.146** .522 .758
5.480
(582) .753 2.010** .280 .502
5.631
(.624) .732 1.856* .245 .461
Leader performance
Leader satisfaction 3.662
(.609) .726 1.787* .218 .440
4.011
(.544) .763 2.164** .312 0.538
4.163
(.571) .745 2.103** .295 .524
Leader effectiveness 3.677
(.644) .703 2.131** .286 .531
4.048
(.512) .769 1.325† .113 0.246
4.080
(.543) .708 1.475* .153 .322
Leader extra effort 3.280
(.719) .715
2.031**
.267 .508
3.616
(.672) .714 1.441* .147 0.306
3.769
(.665) .750 1.316† .107 .240
Note. N = 40 leaders; n = 155 followers. † p < .10 *p < .05 **p < .01
Table 7: Mean, standard deviation, rwg, F-values and, ICC values
130
as shown in Table 7. The ICC(1) was .218, .312 and .295 in the first, second and
third measurements, indicating that 78%, 69% and 70% of the variability in the
leader satisfaction score existed in intra-individual level, respectively. This can be
concluded that leader satisfaction ratings by followers can be aggregated to leader
level.
Leader effectiveness. Across all three measurement times, average rating agreement
(rwg) of followers on leader effectiveness were .703, .769 and .708, respectively.
Similar to the above, five teams were omitted as they did not achieve acceptable
team level rwg index. One-way ANOVA detected significant leader level effects in all
three measurements (F(40,84) = 2.131; p < .01), (F(40,72) = 1.326; p < .10) and (F(40,75)
= 1.475; p < .05). In the first, second and third time measurements, the ICC(1) was
.286, .113 and .153, indicating that 71%, 89% and 85% of the variability in leader
effectiveness score existed in intra-individual level. All results are shown in Table 7.
Given these sufficient levels of agreement, it is justifiable to compute average
follower ratings for each leader.
Extra effort. rwg index, F-value and ICCs(1) were calculated for followers’
agreement on leader’s influence on the extra effort they had put into team
performance. The team level rwg index showed five teams’ scores to be unacceptable
and they were excluded from further analyses. The mean rwg index for pre
intervention was .715, and for post intervention were .714 and .750. One-way
ANOVA detected significant leader level effects in all three measurements (F(40,84) =
131
2.031; p < .01), (F(40,72) = 1.441; p < .05) and (F(40,75) = 1.316; p < .10) as shown in
Table 7. ICC(1) was .267, .147 and .107 in the first, second and third measurements,
indicating that 75%, 85% and 89% of the variability in extra effort score existed in
intra-individual level, respectively. Aggregation of dependent variables for the
followers' ratings of leadership was justified based on results demonstrated.
Leader competencies. Across all three measurement times, average rating agreement
(rwg) of followers and tutors (supervisors) on leader effectiveness were .808, .753 and
.732. Similar to the above, five teams were omitted as they did not achieve
Note. df for F shown in parentheses; SD for M shown in parentheses a n = 25. b n = 15. c Pre-intervention measurement was used a covariate to eliminate confounds † p < .10 *p < .05 **p < .01
Table 13: Results of manipulation checks
Ta
m
R
co
si
p
.1
.2
=
re
4 P
able 13 disp
manipulation
F
esults of th
ovariance (A
gnificant in
< .01; ŋ2 =
94). There
230) and sig
2.886; p <
egulation is
Planned contra
Exp
Con
Self‐regulation
plays the me
n check and
igure 2: Est
he manipula
ANCOVA)
nteraction ef
= .159) with
is also a si
gnificant ma
.10; ŋ2 = .0
higher in th
ast (or trend a
perimental
ntrol
2.500
2.600
2.700
2.800
2.900
3.000
3.100
3.200
3.300
3.400
3.500
eans, standa
Figure 2 pr
timated mar
ation check
with age,
ffect betwee
h a signific
ignificant m
ain effect be
069). Figure
he experime
analysis) is use
Pretes
2.781
2.841
140
ard deviatio
resents grap
rginal mean
k showed th
gender and
en experime
ant high co
main effect
etween the
e 2 demonst
ental groups
ed to explore w
st
1
1
ons, F statist
ph of the ma
n for leaders
hat the inte
d self-effica
ental and co
ontrast4 (F1,
of time (F
experiment
trates that th
s compared
whether a line
Posttest
3.091
2.901
tics and effe
arginal mean
s’ self-regul
ervention, u
acy as cova
ontrol group
,34 = 11.61
F1,74 = 9.36
tal and cont
he increase
to the contr
ear function fi
t 1
ect size for
n for the da
lation
using analys
ariates, yield
ps (F1,74 = 5
18; p < .05;
66; p < .01;
trol groups
in mean of
rol group.
its the data we
Posttest
3.420
3.032
the
ata.
sis of
ded a
5.943;
; ŋ2 =
; ŋ2 =
(F1,37
f self-
ell.
2
141
In order to interpret the significant effects of training on self-regulation in detail (see
Table 13), the pretest and posttest means were compared at each three measurement
point. Results show that there is no significant difference between control and
experimental group (F1,37 = .817; p > .05) during pretest. As expected, after
receiving the intervention, the results in posttest 1 revealed a statistical significant
difference (F1,37 = 2.854; p < .10) between the control and experimental groups. At
posttest 2, leaders who received the intervention scored significantly higher (F1,37 =
8.938; p < .01) in self-regulation in comparison to those who did not receive
intervention.
A Tukey HSD (Honestly Significant Difference) test was conducted for both
experimental and control groups to compare if the increase in self-regulation between
pretest and posttest 1 as well as posttest 1 and posttest 2 is significant. This test is
generally considered a more robust test to compare all possible pairs of means while
controlling for Type I error (Pagano, 1994). Analyses for the experimental group
demonstrated that the increase from pretest to posttest 1 (2.781 vs. 3.091,
respectively, p < .05) and posttest 1 and posttest 2 (3.091 vs. 3.420, respectively, p <
.05) are significant. On the contrary, the control group demonstrated a non-
significant increase from pretest to posttest 1 (2.841 vs. 2.901, respectively, p > .05)
and posttest 1 to posttest 2 (2.901 vs. 3.032, respectively, p > .05).
Although the main effect between self-regulation training and self-regulation was
significant at p < .10, the results for the comparisons at each time point for gearing
142
between the two groups still supports that self-regulation over the three times.
Overall, the results showed that both groups possessed a similar level of self-
regulation during pretest and that there is an increase in self-regulation for
experimental and control groups. However, there is a significantly higher increase in
leaders’ self-regulation for the leaders in the experimental group after receiving the
intervention when compared to the control group, leading to the conclusion that the
manipulation was successful.
4.8. Effects of training condition on leaders performance measures
4.8.1. Leadership outcomes
Effects for leader satisfaction
The influence of self-regulation training on leader satisfaction was tested using
repeated measures analysis of covariance (ANCOVA) with age, gender and self-
efficacy as covariates. Leader satisfaction ratings by followers was the dependant
variable. The leaders that received self-regulation intervention versus those that did
not represented the between-group factor, and the rating of leader satisfaction taken
at three different intervals was the within-group measures. Consistent with
Hypothesis 1a, the analysis yielded a significant main effect for differences between
experimental and control groups (F1,37 = 4.343; p < .05; ŋ2 = .110). The within
subject results did not reveal a significant overall effect of time (See Table 14).
However, a significant interaction effect (F1,74 = 6.401; p < .01; ŋ2 = .155) with a
high contrast of (F1,37 = 7.472; p < .01; ŋ2 = .76) was evident. This effect
de
si
Fi
In
po
sa
fr
to
le
1
1
emonstrated
gnificantly
igure 3).
n addition,
osttest 1 as
atisfaction b
om pretest
o posttest 2
eader satisfa
(3.669 vs. 3
to posttest 2
Figure 3:
Exp
Con
Satisfaction
d that follow
different to
a Tukey H
s well as p
by follower
to posttest
(4.282 vs. 4
action by fo
3.926, respe
2 (3.926 vs.
Estimated
perimental
ntrol
3.400
3.600
3.800
4.000
4.200
4.400
4.600
wers of the
o those leade
HSD test fo
posttest 1 a
rs in the ex
1 (3.696 vs
4.443, respe
llowers sho
ectively, p <
. 4.036, resp
marginal m
Pretes
3.696
3.669
143
leaders wh
ers who did
for each gr
and posttest
xperimental
s. 4.282, res
ectively, p <
owed a sign
< .05) but a
pectively, p
mean for foll
st
6
9
ho received
d not receive
oup to com
t 2 was co
l group sho
spectively, p
< .05). For t
ificant incre
a non-signif
p > .05).
lowers’ ratin
Posttest
4.282
3.926
the interve
e the interve
mpare betw
nducted. R
owed a sign
p < .05) and
the control
ease from p
ficant increa
ng of leader
t 1
ention were
ention (show
ween pretest
Ratings of l
nificant inc
d from post
group, ratin
pretest to po
ase from po
r satisfactio
Posttest
4.443
4.036
rated
wn in
t and
leader
crease
ttest 1
ngs of
osttest
osttest
on
2
144
Additionally, in order to interpret the significant interaction of self-regulation
training on leader satisfaction in details (see Table 14), the pretest and posttest means
were compared for each three measurement points. As demonstrated in Figure 3,
there was no significant difference between leaders in the trained and untrained
groups at pretest. However, starting in posttest 1, leaders that received intervention
were rated significantly higher (F1,37 = 8.559; p < .01; ŋ2 = .189) than the leaders
who were in the control group, and continued to receive significantly higher ratings
in posttest 2 measurement (F1,37 = 8.932; p < .01; ŋ2 = .194).
Consistent to expectation, the results demonstrated that followers are more satisfied
with leaders’ performance across time in the experimental group, as compared to the
control group. This result is attributable to leaders who had a higher level of self-
regulation and therefore use methods of leadership which are more satisfying than
leaders who had a lower level of self-regulation.
Effects for leader effectiveness
A repeated measures analysis of covariance (ANCOVA) with age, gender and self-
efficacy as covariates was performed on the leader effectiveness data. Leaders who
received self-regulation intervention versus those that did not represented the
between-subjects factors and the follower ratings of leaders’ effectiveness taken at
three different intervals were the within-subject factor. There was a significant
interaction effect (F1,37 = 9.198; p < .01; ŋ2 = .208) with a highly significant contrast
of (F1,37 = 13.204; p < .01; ŋ2 = .274). However, no main effect of time was obtained
fo
Fi
th
co
A
(i
pr
be
th
ŋ2
.
or time and
igure 4 pres
he graphs s
ompared to
As such, univ
.e., pretest,
retest and p
etween thos
hat received
2 = .234), th
Figure 4:
Exp
Con
Effectiven
ess
d between
sents the rat
showed that
leaders who
variate tests
posttest 1
posttest 1,
se in the tra
the interve
han the lead
Estimated m
perimental
ntrol
3.500
3.600
3.700
3.800
3.900
4.000
4.100
4.200
4.300
4.400
experiment
tings of lead
t leaders w
o did not.
s to compar
and postte
followers d
ained and u
ention were
ders who we
marginal me
Pretes
3.622
3.721
145
tal and con
ders for both
who attende
re both of t
est 2) were
did not rate
untrained gr
rated signif
ere in the co
ean for follo
st
2
1
ntrol group
h control an
ed the inter
he groups f
e conducted
e leaders to
roups. How
ficantly high
ontrol group
owers’ ratin
Posttest
4.167
3.959
(see Table
nd experime
rvention we
for each me
d. Examinin
o be signif
wever, in po
her (F1,37 =
p (see Figure
ng of leader
t 1
e 14). How
ental groups
ere rated h
easurement
ng the resu
ficantly diff
osttest 2, le
11.294; p <
e 4).
effectivene
Posttest
4.307
3.932
wever,
s, and
higher
point
ults at
ferent
eaders
< .01;
ess
2
146
In addition, Tukey HSD analyses were also conducted for each group independently
to test for a significant increase in leader effectiveness ratings between pretest and
posttest 1 as well as posttest 1 and posttest 2. The test revealed that leader
effectiveness, as rated by followers in the experimental group, showed a significant
increase from pretest to posttest 1 (3.622 vs. 4.167, respectively, p < .05) but was not
significantly different from posttest 1 to posttest 2 (4.167 vs. 4.307, respectively, p >
.05). On the contrary, ratings of leader effectiveness by followers in the control
group showed a significant increase from pretest to posttest 1 (3.721 vs. 3.959,
respectively, p < .05) but a slight decrease from posttest 1 to posttest 2 that is not
statistically significant (3.959 vs. 3.932, respectively, p > .05).
To summarise, the results of receiving self-regulation training caused leaders to be
perceived as more effective across time as rated by their followers. Leaders in the
intervention training group self regulate more in comparison to leaders in the control
group, which ultimately resulted in them being more effective.
Effects for extra effort
Next, an examination of whether leaders with higher self-regulatory competency
(after receiving intervention) relate significantly with leadership outcome in
increasing followers’ effort to try harder to perform. A repeated measures analysis of
covariance (ANCOVA) with age, gender and self-efficacy as covariates was
conducted. The analysis did not yield a significant main effect between the
experimental and control groups and time (see Table 14). However, a significant
ef
by
de
ex
In
co
po
an
in
th
ffect for inte
y the contra
emonstrated
xperimental
n view of th
ontrol group
osttest 1 yie
nd untraine
ntervention
he leaders w
Exp
Con
Extra Effort
eraction (F1
ast test whic
d that follow
l group com
he results a
ps were con
elded signi
ed groups
were rated
who were in
Figure
perimental
ntrol
3.100
3.200
3.300
3.400
3.500
3.600
3.700
3.800
3.900
4.000
4.100
1,74 = 4.507;
ch was signi
wers’ willin
mpared to the
above, univ
nducted at
ficant diffe
(See Figur
significantl
the control
5: Estimate
Pretes
3.270
3.254
147
; p < .05; ŋ2
ificant (F1,37
ngness to e
e control gr
variate comp
each of the
erences betw
re 5). Duri
ly higher (F
group.
ed marginal
st
0
4
2 = .114) wa
7 = 5.386; p
exert extra
roup.
parison bet
e three time
ween rating
ing posttes
F1,37 = 6.864
l mean for e
Posttest
3.746
3.602
as evident. T
p < .05; ŋ2 =
motivation
ween the e
e points. Ne
gs for leade
st 2, leader
4; p < .01;
extra effort
t 1
This is supp
= .133). Fig
is higher i
experimenta
either pretes
ers in the tr
rs that rec
ŋ2 = .156)
Posttest
4.032
3.656
ported
gure 5
in the
al and
st nor
rained
ceived
than
2
148
Main and interaction effects (F) a Between subject effect (F) a
Group effect b Time effect c Interaction effect c Contrast b Pretest b Posttest 1 b Posttest 2 b
Note. n = 15 (experimental group), n = 25 (control group). Partial ŋ2 shown in parentheses. a Self efficacy was used a covariate to eliminate confounds b df = 1,37; c df = 1,74 † p < .10 *p < .05 **p < .01
Table 14: Results of repeated measures analysis of covariance (ANCOVA) for leadership outcomes rated by followers.
149
Next, a Tukey HSD test for the control and experiment groups to compare follower
ratings of extra effort between pretest and posttest 1 as well as posttest 1 and posttest
2 was conducted. Ratings of extra effort by followers in the experimental group
showed a significant increase from pretest to posttest 1(3.270 vs. 3.746, respectively,
p < .05 and from posttest 1 to posttest 2 (3.746 vs. 4.032, respectively, p < .05. For
the control group, ratings of extra effort by followers showed a significant increase
from pretest to posttest 1 (3.254 vs. 3.602, respectively, p < .05) but no significant
increase from posttest 1 to posttest 2 (3.602 vs. 3.656, respectively, p > .05).
In summary, contrary to the expectations that leaders would receive higher ratings
from followers after the intervention in posttest 1, the results revealed a lag in the
effect of training. However, overall these results still support that leaders with higher
self-regulation yield higher leadership outcomes in increasing followers’ effort to try
harder to perform, as demonstrated during posttest 2.
4.8.2. Financial performances5
Effects for profit
The impact of self-regulation training on the financial outcome of the leaders’ team
was tested using repeated measures analysis of covariance (ANCOVA) treating age,
gender and self-efficacy as covariates. Profit, which is the remaining profit retained
by the team after all deductions have been made (e.g. tax, interest, dividends, etc.)
was obtained from the Business Strategy simulation software. This was the
5 All financial measures were measured at yearly intervals (in virtual time line) corresponding to subjective measures collected for followers and supervisors ratings
de
th
ta
H
co
in
.0
R
sh
in
ependant v
hose that did
aken at thre
Hypothesis 1
ontrol group
nteraction be
01; ŋ2 = .17
esults did n
hows that
ntervention i
Exp
Con
‐30
‐20
‐10
10
20
30
40
50
60
70
80
Profit (£
)
ariable. Th
d not repre
ee different
1b, a signif
ps was evid
etween self-
1) with high
not reveal a
the profit
is higher co
Figure 6: E
perimental
ntrol
00000.00
00000.00
00000.00
0.00
00000.00
00000.00
00000.00
00000.00
00000.00
00000.00
00000.00
00000.00
he leaders t
esented the
t intervals w
ficant main
dent (F1,37 =
f-regulation
h significan
a significan
of the te
ompared to l
Estimated m
Posttest
39096.0
‐182015
150
that receive
between gr
was the wi
effect for
= 12.992; p <
training and
nt contrast t
nt effect for
am where
leaders who
marginal mea
t 1
00
.93
ed self-regu
roup factor
ithin-group
differences
< .01; ŋ2 =
d profit was
test (F1,37 =
r time (see
the leader
o did not.
an for team
Posttest
279575.3
‐77802.5
ulation inte
and the me
measures.
between e
.260). Mor
s evident (F
= 7.472; p
Table 15).
rs attended
profit (or lo
t 2
33
59
ervention v
easures of p
Consistent
experimenta
reover, a po
F1,74 = 7.610
< .01; ŋ2 =
Figure 6 cl
d self-regul
oss)
Posttest
703426.6
115129.2
versus
profit
with
al and
ositive
0; p <
= .76).
learly
lation
3
67
26
151
Next, a Tukey HSD test for each group to compare profit between posttest 1 and
posttest 2 as well as posttest 2 and posttest 3 was conducted. Profit for the
experimental group showed a significant increase from posttest 1 to posttest 2
(39096.00 vs. 279575.33, respectively, p < .05) and from posttest 2 to posttest 3
(279575.33 vs. 703426.67, respectively, p < .05). The control group showed a
significant increase from posttest 1 to posttest 2 (-182015.93 vs. -77802.59,
respectively, p < .05) but not a significant increase from posttest 2 to posttest 3 (-
77802.59 vs. 115129.26, respectively, p < .05).
Additionally, in order to interpret the significant interaction of self-regulation
training and profit in detail (see Table 15), the three posttest means6 were compared
for each of the three time points. As demonstrated in Figure 6, there was a significant
difference between profit achieved by leaders in trained and untrained groups, in
comparison to the leaders who were in the control group during posttest 1 (F1,37 =
10.081; p < .01; ŋ2 = .214), posttest 2 (F1,37 = 13.113; p < .01; ŋ2 = .262), and posttest
3 (F1,37 = 11.821; p < .01; ŋ2 = .242).
As predicted, the results demonstrated that leaders in the experimental group who
received intervention training were able to lead their teams to achieve higher profit
across time, as compared to the control group. This result is attributable to leaders
who had a higher level of self-regulation and there use of methods of leadership
which are more effective in attaining higher profit than leaders who did not receive
the intervention. 6 There is no pretest financial measure as all teams started at the same level
152
Effects for return on capital employed (ROCE)
ROCE signifies how well the money invested into the business is providing a return
to the investors. A repeated measures analysis of covariance (ANCOVA) with age,
gender and self-efficacy as covariates was performed on the ROCE data, with
experimental and control groups as the between-subjects factors and the measure of
ROCE at three different intervals as a within-subject factor. As predicted (see Table
15), a significant main effect between self-regulation training and ROCE emerged
(F1,37 = 13.212; p < .01; ŋ2 = .263). Interaction effect was significant (F1,74 = 9.741; p
< .01; ŋ2 = .208) with significant high contrast (F1,37 = 15.066; p < .01; ŋ2 = .289).
Results did not reveal a significant effect for time (see Table 15). Figure 7 presents
the ROCE for both, control and experimental group, and the graph showed that
leaders who attended the intervention achieved higher ROCE compared to leaders
who did not.
The groups were also compared independently between posttest 1 and posttest 2 as
well as posttest 2 and posttest 3 using a Tukey HSD test. Results showed that ROCE
for the experimental group showed a significant increase from posttest 1 to posttest 2
(-1.740 vs. 26.647, respectively, p < .05) and from posttest 2 to posttest 3 (26.647 vs.
44.420, respectively, p < .05). On the contrary, ratings of leader satisfaction by
followers in the control group showed a significant increase from posttest 1 to
posttest 2 (-9.783 vs. 6.210, respectively, p < .05) but a slight decrease from posttest
2 to posttest 3 that is not statistically significant (6.210 vs. 19.113, respectively, p <
.05).
Fu
Ex
be
at
re
ŋ2
te
H
fo
in
urther univ
xamining th
etween team
ttend the in
eceived inte
2 = .328) an
eams where
Hence, the re
or teams led
n the control
Exp
Con
ROCE
Figure
variate insp
he results o
ms where l
ntervention.
rvention we
nd posttest
the leaders
esults of re
d by leaders
l group. Par
perimental
ntrol
‐2.000
‐1.500
‐1.000
‐0.500
0.000
0.500
1.000
1.500
7: Estimate
pections w
of posttest
leaders atte
However,
ere significa
3 (F1,37 =
were in the
ceiving self
s who were
rticipants in
Posttest
‐1.740
‐0.364
153
ed marginal
were condu
1, there wa
ended the i
the mean fo
antly higher
14.452; p <
e control gro
f-regulation
in the expe
n the training
t 1
0
4
mean for te
ucted for
as no signi
intervention
for ROCE f
r in posttest
< .01; ŋ2 =
oup (see Fig
n training le
erimental gr
g group self
Posttest
0.559
‐0.156
eam ROCE
each meas
ificant diffe
n and leade
for teams w
t 2 (F1,37 =
= .281), as c
gure 4).
ead to a bet
roup than le
f regulate th
t 2
6
surement p
erence in R
ers who did
where the le
18.080; p <
compared t
tter ROCE
eaders who
heir perform
Posttest
1.319
0.232
point.
ROCE
d not
eaders
< .01;
to the
score
were
mance
3
154
as a leader better which ultimately resulted in leading their team to manage the
capital employed in the business more effectively to yield a higher return.
Effects for gearing
Gearing ratio is calculated as the ratio that compares the company’s equity or capital
to borrowed funds. In brief, gearing refers to the extent to which the company is
funded by debt. The higher the gearing of the company, the more the company is
considered risky. To test Hypothesis 1b an examination of whether leaders with
higher self-regulation (after receiving intervention) relate significantly with the
leaders’ team gearing ratio, was conducted using a repeated measures analysis of
covariance (ANCOVA) with age, gender and self-efficacy as covariates. Consistent
with Hypothesis 1c which predicted an inverse relationship between self-regulation
training and gearing ratio, the analysis demonstrated a significant difference between
group effect (F1,37 = 11.851; p < .01; ŋ2 = .243) and a significant interaction effect
(F1,74 = 2.906; p < .10; ŋ2 = .073). This is supported by the fact that the contrast test
is significant (F1,37 = 3.216; p < .10; ŋ2 = .080). Results did not reveal a significant
effect for time (see Table 15). Figure 8 demonstrates that gearing ratio is lower in the
experimental group compared to the control group.
Next, a Tukey HSD test for each group to compare gearing between posttest 1 and
posttest 2 as well as posttest 2 and posttest 3 was conducted. Gearing for teams in
which leaders were allocated into the experimental group showed a significant
decrease from posttest 1 to posttest 2 (60.316 vs. 42.387, respectively, p < .05) and
fr
fo
si
.0
re
To
tra
co
le
po
om posttest
or teams in
gnificant de
05) and a s
espectively,
o facilitate
aining and
ompared at
eaders recei
osttest 1 (F
Exp
Con
Gearing
(%)
t 2 to postte
n which the
ecrease from
significant d
p < .05).
Figure 8
the infere
gearing (s
each of th
ived the in
1,37 = 7.310
perimental
ntrol
20.000
30.000
40.000
50.000
60.000
70.000
80.000
est 3 (42.38
e leaders w
m posttest 1
decrease fr
8: Estimated
nce of the
see Table
he three tim
ntervention
; p < .01; ŋ
Posttest
60.316
70.127
155
7 vs. 26.16
were alloca
to posttest
rom posttes
d marginal m
significant
15) the ex
me points. I
achieved
ŋ2 = .165), p
1
6
7, respectiv
ted into th
2 (70.127 v
st 2 to post
mean for tea
t main effe
xperimental
In all three
significant
posttest 2 (F
Posttest 2
42.387
59.233
vely, p < .05
he control g
vs. 59.233,
ttest 3 (59.
am Gearing
ect between
and contr
e time poin
tly lower g
F1,35 = 21.0
5). Also, ge
group show
respectively
.233 vs. 44
g
n self-regul
rol groups
nts, teams w
gearing rat
16; p < .01
Posttest 3
26.167
44.532
earing
wed a
y, p <
4.532,
lation
were
where
tio in
; ŋ2 =
156
.362), and posttest 3 (F1,37 = 7.012; p < .01; ŋ2 = .159), in contrast to the teams
where leaders were in the control group. Refer to Figure 8.
Although the main effect between self-regulation training and gearing ratio was
significant at p < .10, the results for the comparisons at each time point for gearing
between the two groups still supports Hypothesis 1c. Leaders with higher self-
regulation lead their team to perform better financially as demonstrated in the
reduction of gearing ratio within the company which in turn reduces their company’s
financial risk.
Effects for earnings per share (EPS)
EPS is calculated by the total profit of the company divided by the number of shares.
EPS serves as an indicator of a company’s profitability. The effect of self-regulation
training on the financial outcome of the leaders’ team was tested using repeated
measures analysis of covariance (ANCOVA) including age, gender and self-efficacy
as covariates. The EPS measure was used as the dependant variable. Groups that
received self-regulation intervention versus groups that did not represent the
between-group factor, and the EPS at three different time interval were the within-
group measures. There was a significant main effect of training between
experimental and control groups (F1,37 = 12.385; p < .01; ŋ2 = .251). Also, a
significant effect for interaction (F1,74 = 5.562; p < .05; ŋ2 = .131) was observed with
highly significant contrast (F1,37 = 6.380; p <.01; ŋ2 = .147). However, results did
not reveal a significant effect for time (see Table 15). This result demonstrates that
th
ea
th
at
Fu
in
gr
p
C
po
fr
he team fina
arnings per
he control gr
ttended self-
urther inspe
ncrease in th
roup increas
< .05) and
onversely, t
osttest 1 to
om posttest
Exp
Con
EPS
ancial perfor
share as co
roup. Figur
f-regulation
Figure
ection was
he EPS. Th
sed signific
d from post
the EPS for
posttest 2 (
t 2 to postte
perimental
ntrol
‐0.500
‐0.300
‐0.100
0.100
0.300
0.500
0.700
0.900
1.100
1.300
1.500
rmance of le
ompared to
re 9 clearly
intervention
e 9: Estimat
also conduc
he Tukey H
antly from p
ttest 2 to p
r the contro
(-.364 vs. -.
st 3 (-.156 v
Posttest
0.078
‐0.364
157
eaders who
the followe
shows that
n is higher c
ted margina
cted for eac
SD test sho
posttest 1 to
posttest 3 (.
ol group did
156, respec
vs. .232, res
t 1
8
4
attended th
ers with lea
the EPS of
compared to
al mean for t
ch group in
owed that th
o posttest 2
559 vs. 1.3
d not show
ctively, p >
spectively, p
Posttest
0.559
‐0.156
he interventi
aders who w
f the team w
o leaders wh
team EPS
ndependentl
he EPS in t
(.078 vs. .5
320, respec
a significa
.05). Howe
p < .05) wa
t 2
6
ion yields h
were allocat
where the le
ho did not.
ly for signif
the experim
559, respecti
tively, p <
ant increase
ever, the inc
s significan
Posttest
1.320
0.232
higher
ted to
eaders
ficant
mental
ively,
.05).
from
crease
nt.
3
158
Main and interaction effects (F) a, b Between subject effect (F) a, b
Group effect b Time effect c Interaction effect c Contrast b Posttest 1 Posttest 2 Posttest 3
Note. n = 15 (experimental group), n = 25 (control group). Partial ŋ2 shown in parentheses. a Self efficacy was used a covariate to eliminate confounds b df = 1,37; c df = 1,74 † p < .10 *p < .05 **p < .01
Table 15: Results of repeated measures analysis of covariance (ANCOVA) for financial performance.
159
In order to interpret the significant main effect of self-regulation intervention on the
EPS (see Table 15), the three posttest means were contrasted for each of the three
measurement points. As demonstrated in Figure 9, there was a significant difference
between profit achieved by leaders in the trained group in comparison to the leaders
who were in the control group shown in posttest 1 (F1,37 = 10.081; p < .01; ŋ2 =
.214), posttest 2 (F1,37 = 13.113; p < .01; ŋ2 = .262), and posttest 3 (F1,37 = 10.349; p
< .01; ŋ2 = .219).
As predicted, the results demonstrated that leaders in the experimental group who
received the intervention training were able to lead their teams to achieve higher
profit across time, as compared to the control group. This result is attributable to
leaders who had a higher level of self-regulation (in comparison to leaders who did
not receive the intervention) and therefore used methods of leadership which are
more effective in not just attaining higher profit, but also focus on satisfying
shareholders.
4.8.3. Assessments outcomes
Testing for differences in means for self-regulation was carried out initially using
multivariate analysis of covariance (MANCOVA) with leaders in groups who
received self-regulation intervention and leaders in control groups as the independent
variables, the five assessment outcomes as the dependent variables, and treating age,
gender and self-efficacy as covariates. Specifying age, gender and self-efficacy in
this way filters out variance in the dependent variables that is attributable to these
160
variables. Also, a MANCOVA is performed prior to univariate analysis of
covariance ANCOVA to control for inflated Type I error rates and takes into account
the correlations among the dependent variables (Stevens, 2002) as the five
assessment measures are part of the 100% overall final assessment. A significant
effect for Group (Wilks’s λ = .644; F1,37 = 3.651; p < .01; ŋ2 = .356) established that
any differences due to self-regulation should be regarded as consistent across the five
assessment measured.
F a, b p ŋ2
Presentation 8.831 .005 .193
Business plan 2.665 .111 .067
Group report 10.330 .003 .218
Simulation performance 5.018 .031 .119
Reflective report 10.076 .003 .214
Note. n = 15 (experimental group), n = 25 (control group). Wilk’s Lambda = .644 a Self efficacy was used a covariate to eliminate confounds b df = 1,37
Table 16: Results of analysis of covariance (ANCOVA) for assessment outcomes.
Given the significant main effects of leaders in the experimental and control group,
further univariate testing was undertaken with each assessment outcome compared.
Results from ANCOVA are reported in Table 16.
161
Effects for the Presentation assessment
Examination of whether leaders who attended self-regulation training related
significantly to Presentation marks obtained by the team using ANCOVA with age,
gender and self-efficacy as covariates. The main effect demonstrates a significant
difference (F1,37 = 8.831 ; p < .01; ŋ2 = .193) in the higher Presentation marks for
teams where leaders attended the training as shown in Figure 10. This result provides
support for Hypothesis 1c, which suggests that leaders who were trained would
exhibit competency to lead their team to achieve higher Presentation marks than
leaders who were not trained.
Figure 10: Estimated marginal mean for teams’ assessments
Presentation Business PlanGame
PerformanceGroup Report
Reflective Report
Experimental 69.80 67.60 7.53 73.73 70.33
Control 63.48 62.30 6.56 63.19 64.52
0.00
10.00
20.00
30.00
40.00
50.00
60.00
70.00
80.00
Experimental Control
162
Effects for the Business Plan assessment
The effects of the intervention on self-regulation on Business Plan marks was tested
using ANCOVA treating age, gender and self-efficacy as covariates. Although the
mean for Business Plan marks were higher (see Figure 10) for the experimental
group compared to the control group, the effect was not significant. Thus, no support
was found for the predicted effect suggested by Hypothesis 1c.
Effects for the Game Simulation Performance
Next, using the Game Simulation Performance mark as the dependant variable, the
effect of whether leaders who attended self-regulation training was tested using
ANCOVA, specifying age, gender and self-efficacy as covariates. The ANCOVA
yielded a significant main effect for training on the Game Simulation Performance
marks (F1,37 = 10.330 ; p < .01; ŋ2 = .218). This analysis revealed that leaders who
were trained in self-regulation (compared to leaders who were not trained) are able to
lead their teams to achieve notably higher Game Simulation Performance marks as
shown in Figure 10.
Effects for the Group Report assessment
The effect of whether leaders who attended self-regulation training related
significantly to the Group Report marks was analysed using ANCOVA with age,
gender and self-efficacy as covariates. The main effect demonstrates a significant
difference (F1,37 = 5.018; p < .05; ŋ2 = .119) in the higher Group Report marks for
team whose leaders attended the training as shown in Figure 10. This result provides
163
support for Hypothesis 1c, which suggested that leaders who were trained would
exhibit competency to lead their team to achieve higher Group Report marks than
leaders who were not trained.
Effects for the Reflective Report assessment
To test Hypothesis 1c, an examination of whether leaders with higher self-regulation
(after receiving intervention) relate significantly with their team’s average Reflective
Report marks was carried out using an ANCOVA with age, gender and self-efficacy
as covariates. As predicted, the analysis demonstrated that leaders in the
experimental group, who received intervention training, were able to lead their teams
to achieve significantly higher Reflective Report marks (F1,37 = 10.076; p < .01; ŋ2 =
.214), as compared to the control group as shown in Figure 10. Support for the
hypothesis above is confirmed.
4.9. Effects of training condition on leaders competencies
A repeated measures analysis of covariance (ANCOVA) with age, gender and self-
efficacy as covariates was performed on the leader competencies data. The
experimental and control groups served as the between-subjects factors and the
measure of followers ratings of leaders’ competencies at three different interval was
the within-subject factor. There was no main effect of leader competencies (F1,37 =
.509; p > .05; ŋ2 = .014). However, Figure 11 presents the ratings of leaders for both,
control and experimental groups, and the graphs showed that leaders who attended
the intervention were rated higher compared to leaders who did not.
A
m
pr
2.
tra
in
th
In
to
as
th
F
As such, the
measurement
retest (F1,37
342), leade
ained and
ntervention w
he leaders w
n addition, T
o test for a s
s well as po
he experime
Exp
Con
Lead
er com
petencies
Figure 11: E
e experime
t point at p
= 1.045; p
ers were no
untrained g
were rated
who were in
Tukey HSD
ignificant in
osttest 1 and
ental group
perimental
ntrol
5.000
5.100
5.200
5.300
5.400
5.500
5.600
5.700
5.800
5.900
6.000
Estimated m
ental and c
pretest, pos
p > .05; ŋ2 =
ot rated to
groups. Ho
significantl
the control
D analyses w
ncrease in l
d posttest 2
p showed a
Pretest
5.058
5.222
164
marginal me
control grou
sttest 1 and
= .029) and
be significa
owever, in
ly higher (F
group (see
were also co
eader comp
2. The resul
a significan
t
an for leade
ups were f
d posttest 2
d posttest 1
antly differ
posttest 2,
F1,37 = 4.419
Figure 11).
onducted fo
petencies be
lts showed
nt increase
Posttest 1
5.726
5.439
er competen
further com
2. Examinin
(F1,37 = .06
rent betwee
, leaders th
9; p < .05;
.
or each grou
etween prete
that leader
from prete
ncies
mpared for
ng the resu
63; p > .05
en leaders i
hat received
ŋ2 = .112),
up independ
est and post
competenc
est to postt
Posttest 2
5.859
5.523
each
ults at
; ŋ2 =
in the
d the
than
dently
ttest 1
ies in
test 1
165
(5.058 vs. 5.726, respectively, p < .05) but not from posttest 1 to posttest 2 (5.726 vs.
5.859, respectively, p > .05). Ratings of leader competencies in the control group
showed a significant increase from pretest to posttest (5.222 vs. 5.439, respectively, p
< .05) but not a significant increase from posttest 1 to posttest 2 (5.439 vs. 5.522,
respectively, p > .05).
To summarise, the results of receiving self-regulation training caused leaders to be
perceived as possessing the relevant competencies for their roles across time as rated
by their followers and tutors. Participants in the intervention developed relevant
competencies which were needed to perform in their role, which ultimately resulted
in them developing their competencies from pretest to posttest 1 and 2.
4.10. Leader competencies as mediator of leaders performance
The current study is a field experimental design, thus the conventional approach to
conduct mediation analysis is not the most appropriate. According to Baron and
Kenny (1986), three series of regression analyses to demonstrate; (i) the independent
variable must significantly predict the mediating variable; (ii) the mediator variable
must then significantly predict the dependent variable; and finally, (iii) the
relationship between the independent variable and dependent variable should be not
significant or weaker when the mediator is controlled for.
However, in accordance to Yzerbyt, Muller, and Judd (2004), to evaluate the
presence of a mediation effect in the current experimental study, the mediator
166
variable was included as a covariate in the repeated measure analysis of covariance
(ANCOVA). The effect of the mediating variable must be significantly related to the
interaction effect. At the same time, the F-value for the main effect must diminish
and become non-significant when the mediator is included as a covariate. Finally, a
Sobel (1982) test was then conducted to further assess the significance of the
mediation.
4.10.1. Leadership outcomes
Mediation analysis for leader satisfaction
To investigate whether leader competencies mediated the effect of self-regulation
training on leader satisfaction, the mediating variable was controlled for by adding it
as covariate in the analysis. Results of the analysis are show in Table 17. The effect
of the leader competencies was significant (F1,37 = 13.591; p < .01; ŋ2 = .286).
Moreover, the interaction effect of self-regulation training on leader satisfaction
diminished (F1,37 = 5.119; p < .05; ŋ2 = .131), although it stayed significant. The
Sobel test conducted, confirmed the reduction in the significance level was reliable
of the mediation (z = 1.833, p < .01).
Mediation analysis for leader effectiveness
For leader effectiveness, including the leader competencies as covariate, reduced the
previously significant effect to F1,37 = 8.869; p < .01; ŋ2 = .204 as shown in Table 17.
The effect of the mediating variable was significant on leader effectiveness (F1,37 =
167
5.299; p < .05; ŋ2 = .135). The Sobel test conducted, confirmed the reduction in
significance level was reliable of the mediation (z = 2.253, p < .05).
Mediation analysis for extra effort
The examination of the main effect of whether leaders with higher self-regulatory
competency (after receiving intervention) relate significantly with leadership
outcomes in increasing followers’ effort to try harder to perform, when leader
competencies were controlled for as a covariate, revealed a significant effect a p <
.10 (F1,37 = 3.450; p < .10; ŋ2 = .092). Although the effect of leader competencies on
followers’ rating that leader influenced followers to increase their effort to try harder
to perform is significant (F1,37 = 8.447; p < .01; ŋ2 = .199), the Sobel test did not
reveal a significant mediation effect.
4.10.2. Financial performances7
Mediation analysis for profit
An ANCOVA analysis of profit, with leader competencies as covariate, revealed a
significant effect for the covariate (F1,37 = 16.966; p < .01; ŋ2 = .326), showing that
leader competencies relate to profit. Importantly, the analysis also showed that the
effect of intervention on profit reduced (F1,37 = 3.170; p > .05; ŋ2 = .083) as shown in
Table 17. This reduction is significant (z = 2.865, p < .01), suggesting that the effect
on profit was mediated by leader competencies.
7All financial measures are measured at yearly intervals (in virtual time line) corresponding to subjective measures collected for followers ratings
168
Mediation analysis for return on capital employed (ROCE)
For ROCE, adding the leader competencies as a covariate, reduced the previously
significant effect to F1,37 = 16.076; p < .01; ŋ2 = .315 as demonstrated in Table 17.
The effect of the mediating variable was significant on ROCE (F1,37 = 131.146; p <
.01; ŋ2 = .789). The Sobel test confirmed that leader competencies significantly
mediated the effect of self-regulation on leader effectiveness (z = 2.581, p < .01).
Mediation analysis for gearing
When leader competencies is added as a covariate in an ANCOVA analysis of
gearing, the analysis revealed a significant effect for the covariate (F1,37 = 75.758; p
< .01; ŋ2 = .684), showing that leader competencies related to gearing. Essentially,
the analysis also showed that the effect of the intervention on gearing reduced (F1,37
= 24.506; p < .01; ŋ2 = .412) as shown in Table 17. This reduction is significant (z = -
.3.366, p < .01), suggesting that the effect on gearing was mediated by leader
competencies.
Mediation analysis for earnings per share (EPS)
The examination of the main effect of whether leaders with a higher self-regulatory
competency (after receiving intervention) related significantly with EPS, when leader
competencies were controlled for as a covariate, revealed a significant effect at p <
.10 (F1,37 = 3.170; p < .10; ŋ2 = .083). Although the effect of leader competencies on
EPS is significant (F1,37 = 16.966; p < .01; ŋ2 = .326), the Sobel test did not reveal a
significant mediation effect.
169
Main effect Main effect controlling for mediator d Mediation
IV → M IV → DV M IV → DV (controlling M) Sobel α Sα F F F β S β z Leaders’ performance Leader satisfaction .378** .120 15.154 (.302)** 13.591 (.286)** 5.119(.131)* .239 .106 1.833† Leader effectiveness .401** .116 20.436 (.369)** 5.299 (.135)* 8.869 (.207)** .297 .100 2.253* Leader extra effort .392** .120 11.487(.247)** 8.447 (.199)** 3.450 (.092)† .230 .124 1.613 Leaders’s financial performance Profit .398** .180 13.106 (.267)** 16.966 (.326)** 3.170 (.083)† 169732.371 95333.242 2.865** ROCE .398** .180 26.288 (.422)** 131.146 (.789)** 16.076 (.315)** 9.385 2.341 2.581** Gearing .398** .180 36.199 (.501)** 75.758 (.684)** 24.506 (.412)** -10.381 2.097 -3.366** EPS .398** .180 13.106 (.267)** 16.966 (.326)** 3.170 (.083)† .339 .191 1.571 Leader’s assessment Presentation .347** .125 8.533 (.192)** 3.872 (.100)* 3.714 (.096)† 4.269 2.215 1.583 Business plan .347** .125 4.700 (.115) * 26.269 (.429)** .170 (.005)† .962 2.335 .408 Simulation performance .398** .118 7.047 (.164)** 5.024 (.126)* 1.811 (.049)† .594 .441 1.251 Group report .398** .118 15.266 (.298)** 8.569 (.197)** 5.375 (.133)* 7.070 3.050 1.910* Reflective report .398** .118 16.810 (.318)** 8.615 (.198)** 6.258 (.152)* 4.122 1.644 2.001* Note. n = 15 (experimental group), n = 25 (control group). Partial ŋ2 shown in parentheses. a Age, gender and self-efficacy were used covariates to eliminate confounds b df = 1,37 † p < .10 *p < .05 **p < .01
Table 17: Mediation analysis for the effects of self-regulation training on leadership outcomes, financial performances and assessment outcomes controlling for leader competencies as mediator
170
4.10.3. Assessments outcomes
Assessment outcomes were not measured repeatedly, but one time after intervention.
Univariate testing was undertaken with each assessment outcome as the dependent
variable and leader competencies as the covariate. The effect of the covariate must be
significantly related to the interaction effect to indicate the covariate is a mediator.
Simultaneously, the F-value for the interaction effect must reduce and become non-
significant when the mediator is included as a covariate. Finally, a Sobel (1982) test
was then conducted to further assess the significance of the mediation.
Mediation analysis for Presentation assessment
For Presentation marks, adding the leader competencies as covariate, led the
previously significant effect to disappear (F1,37 = 3.714; p > .05; ŋ2 = .096) as
demonstrated in Table 17. The effect of the mediating variable was significant on
presentation assessment (F1,37 = 3.872; p < .05; ŋ2 = .100). In spite of this, the Sobel
test did not confirm that leader competencies significantly mediated the effect of
self-regulation training on presentation marks (z = 1.583, p > .10).
Mediation analysis for Business Plan assessment
When leader competencies were added as a covariate in an ANCOVA analysis on
Business Plan marks, the analysis revealed a significant effect for the covariate (F1,37
= 26.269; p < .01; ŋ2 = .126), showing that leader competencies relate to Business
Plan marks. Although, the analysis also showed that the interaction between group
and business plan marks diminished (F1,37 = .170; p > .05; ŋ2 = .005) as shown in
171
Table 17, this reduction was not significant (z = .408, p > .10), suggesting that the
effect on Business Plan marks was not significantly mediated by leader
competencies.
Mediation analysis for Simulation Performance assessment
The examination of the main effect of whether leaders with higher self-regulatory
competency relate significantly with Simulation Performance assessment marks,
when leader competencies were controlled for as a covariate, revealed a significant
main effect at p < .10 (F1,37 = 1.811; p < .10; ŋ2 = .049). Although there is a
significant effect of leader competencies on Simulation Performance assessment
marks (F1,37 = 5.204; p < .05; ŋ2 = .126), the Sobel test did not reveal a significant
mediation effect.
Mediation analysis for Group Report assessment
An ANCOVA analysis on the Group Report marks, with leader competencies as a
covariate, revealed a significant effect for the covariate (F1,37 = 8.569; p < .01; ŋ2 =
.197), showing that leader competencies relate to the Group Report marks. In
addition, the analysis also showed that the effect of self-regulation on the Group
Report marks reduced (F1,37 = 5.375; p < .05; ŋ2 = .133) as shown in Table 17. This
reduction is significant (z = 1.910, p < .05), suggesting that the effect on Group
Report was mediated by leader competencies.
172
Mediation analysis for Reflective Report assessment
To investigate whether leader competencies mediated the interaction effect of self-
regulation training on leader’s team Reflective Report marks, the mediating variable
was controlled for by adding it to the analysis as a covariate. Results of the analysis
are shown in Table 17. The effect of leader competencies was significant (F1,37 =
8.615; p < .01; ŋ2 = .198). Moreover, the interaction effect of self-regulation training
on Reflective Report marks reduced (F1,37 = 6.258; p < .05; ŋ2 = .152), although it
remained significant. The Sobel test conducted confirmed the significance of the
mediation (z = 2.001, p < .05).
4.11. Conclusion
The current chapter has analysed and presented results from the longitudinal field
experimental study that tested the influence of self-regulation on leader and team
performances. The field study, which manipulated self-regulation training, randomly
allocated leaders to an experimental or control group and were trained in self-
regulatory process by an executive coach. As expected, the results demonstrated that
leaders who attended the intervention yield better performance as rated by followers
in terms of leader satisfaction, leader effectiveness and followers’ willingness to
exert extra effort. The results also suggest that team performance measured by the
four financial indicators (i.e., profit, ROCE, gearing ratio, EPS) were significantly
affected by the intervention. Four out of five measures (i.e., presentation, business
plan, group report, simulation performance) of team assessments were significantly
related to the self-regulation intervention. In addition, the intervention also
173
significantly contributed to the increase in leaders’ competencies within the
experimental group as compared to the control group. Finally, the analyses also
showed that leader competencies mediated the leaders’ performance (leader
H1b: A self-regulation intervention should lead to better team’s financial performance, measured as:
• retain profit Supported • return on capital employed (ROCE) Supported • earnings per share (EPS) Supported • gearing (negative relationship) Supported
H1c: A self-regulation intervention should lead to better team’s assessed performance, measured as
• presentation Supported • business plan Not supported • group report Supported • simulation performance and Supported • reflective report Supported
H2: Leaders who attended self-regulation training would exhibit greater improvement in the competencies required in their leadership role compared to leaders who have not been trained.
H2a: Leaders who attended self-regulation training would exhibit greater improvement in the competencies required in their leadership role, measured as promoting teamwork, planning, basic leadership, relationship management and keeping others informed. Supported
H2b: Leaders who did not attend self-regulation training would exhibit less improvement in the competencies required in their leadership role, measured as promoting teamwork, planning, basic leadership, relationship management and keeping others informed. Supported
175
H3: Leader competencies mediate the effect of training on performance in that (i) self-regulation training leads to the leader developing relevant competencies for his/her role and (ii) these competencies positively affects performance.
H3a: Leader competencies mediate the effect of training on performance in that (i) self-regulation training leads to the leader developing relevant competencies for his/her role and (ii) these competencies positively affects leader performance, measured as leader satisfaction, leader effectiveness and extra effort.
• leader satisfaction Supported • leader effectiveness Supported • extra effort Not supported
H3b: Leader competencies mediate the effect of training on performance in that (i) self-regulation training leads to the leader developing relevant competencies for his/her role and (ii) these competencies positively affects the team’s financial performance, measured as retain profit, return on capital employed (ROCE), earnings per share (EPS), and (negative) gearing
• retain profit, Supported • return on capital employed (ROCE) Supported • earnings per share (EPS) Not supported • gearing (negative relationship) Supported
H3c: Leader competencies mediate the effect of training on performance in that (i) self-regulation training leads to the leader developing relevant competencies for his/her role and (ii) these competencies positively affects the team’s assessed performance, measured as presentation, business plan, group report, simulation performance and reflective report.
• presentation Not supported • business plan Not supported • group report Not supported • simulation performance and Supported • reflective report Supported
Table 18: Summary of hypotheses testing
176
CHAPTER 5
Discussion
This chapter discusses the findings and the implications of this research. Section 5.1 presents a summary of the research questions, data collection and methodology of the study. Next, Section 5.2 discusses the findings of analysis and Section 5.3 outlines the implications of the findings in terms of contribution to theory, methods and practice. Limitations of the research are discussed in Section 5.4, followed by recommendations for future research in Section 5.5. Last but not least, Section 5.6 provides a conclusion to this thesis.
5.1. Introduction: Key research questions
The current research seeks to examine the effect of a self-regulation intervention on
leaders’ and their team’s performance. The main research questions in this research
were; (i) does leaders’ self-regulation increase after receiving an intervention on how
to self-regulate, (ii) are there significant differences in followers’ ratings of leaders’
performance and objectives team performance between leaders who receive a self-
regulation intervention and leaders who do not receive the intervention, (iii) after
receiving a self-regulation intervention, does it increase relevant competencies that
are needed by the leader in order to perform effectively in his/her current role and
finally, (iv) what relationship exists between self-regulatory processes, leadership
competencies and leadership outcomes.
177
The first hypothesis of this research was that, a self-regulation intervention should
lead to better leader and team performance. This hypothesis was further divided into
three sub-hypotheses as stated below:
Hypothesis 1a: A self-regulation intervention should lead to better leader
performance, measured as leader satisfaction, leader effectiveness and extra effort.
Hypothesis 1b: A self-regulation intervention should lead to better team’s financial
performance, measured as retained profit, return on capital employed (ROCE),
earnings per share (EPS) and (negative) gearing.
Hypothesis 1c: A self-regulation intervention should lead to better team’s assessed
performance, measured as presentation, business plan, group report, simulation
performance and reflective report.
The second hypothesis of this research posited that leaders who attend self-regulation
training would exhibit greater improvement in the competencies required in their
leadership role compared to leaders who have did not have the training. This
hypothesis was further divided into two sub-hypotheses as stated below:
Hypothesis 2a: Leaders who attended self-regulation training would exhibit greater
improvement in competencies required in their leadership role, measured as
promoting teamwork, planning, basic leadership, relationship management and
keeping others informed.
Hypothesis 2b: Leaders who did not attend self-regulation training would exhibit less
improvement in competencies required in their leadership role, measured as
178
promoting teamwork, planning, basic leadership, relationship management and
keeping others informed.
Finally, the third hypothesis of this research was that, leader competencies should
mediate the effect of self-regulation training on performance in that (i) self-
regulation training leads to leader developing relevant competencies for his/her role
and (ii) these competencies positively affect performance. This hypothesis was
further divided into three sub-hypotheses as stated below:
Hypothesis 3a: Leader competencies mediate the effect of training on performance in
that (i) self-regulation training leads to leader developing relevant competencies for
his/her role and (ii) these competencies positively affect leader performance,
measured as leader satisfaction, leader effectiveness and extra effort.
Hypothesis 3b: Leader competencies mediate the effect of training on performance in
that (i) self-regulation training leads to leader developing relevant competencies for
his/her role and (ii) these competencies positively affect team’s financial
performance, measured as retained profit, return on capital employed (ROCE),
earnings per share (EPS) and (negative) gearing.
Hypothesis 3c: Leader competencies mediate the effect of training on performance in
that (i) self-regulation training leads to leader developing relevant competencies for
his/her role and (ii) these competencies positively affect team’s assessed
performance, measured as presentation, business plan, group report, simulation
performance and reflective report.
Longitudinal field experimental research was conducted to compare the effects of the
self-regulation intervention on leaders’ and team’s performance. Forty leaders and
179
their teams took part in this research; fifteen leaders attended the self-regulation
intervention (experimental group) while twenty-five leaders did not attend the self-
regulation intervention (control group). The intervention trained leaders on self-
regulation strategies. All leaders in the experimental group were provided with a
360-degree feedback report (generated from ratings of their followers and
supervisors) during the intervention, and twice after the intervention (three and six
months after the intervention).
The control and experimental groups’ leaders and their followers filled out a pretest
and two posttest survey across nine months. The leaders performance measures were
divided into three areas; (i) leader performance, measured as leader satisfaction,
leader effectiveness and extra effort, (ii) team’s financial performance, measured as
retained profit, return on capital employed, earnings per share, and gearing (from
BSG simulation) and (iii) team’s assessed performance, measured as presentation,
business plan, group report, simulation performance and reflective report. Leaders’
competencies were also measured. Leaders’ self-regulation was measured at all three
time points to act as manipulation checks. The next section will evaluate and
interpret the findings from the data analyses performed in Chapter Four.
180
5.2. Interpretation of findings
The intervention led to an increase in leaders’ self-regulation
The results from the manipulation check showed that prior to intervention, there was
no significant difference in self-regulation between leaders who attended the
intervention and those who did not. Although the experiment study randomly
allocated leaders into control and experimental groups, it is still important to
establish that there was no difference in self-regulation between the two groups at
pre-test. The analyses yielded a non-significant difference when comparing both
groups during pre-test which indicated that there is no difference in the level of self-
regulation prior to the leader receiving the intervention and leaders in both groups.
The level of self-regulation for leaders in both groups increased over the three time
measures taken, as one might expect when individuals mature across a period of time
in longitudinal design. However, as expected, the leaders who attended the
intervention demonstrated a greater increase in self-regulation at both posttests, when
compared to leaders in the control group. It is thus concluded that, self-regulation
training was successful and positively improved leaders’ self-regulation competency.
181
The self-regulation intervention led to better leader and team performance
Hypothesis 1a: A self-regulation intervention should lead to better leader
performance, measured as leader satisfaction, leader effectiveness and extra effort.
Leader satisfaction. For the change over time in the ratings of leaders’ satisfaction,
there was a significant difference between the ratings for leaders who attended the
intervention and those that did not. An initial comparison between the ratings of
followers prior to the intervention yielded a non-significant difference between both
groups indicating that followers were similar in their satisfaction ratings towards
their leaders. Ratings for leaders who attended the intervention increased from
pretest to posttest 1 and posttest 2. Consistent with Hypothesis 1a, this effect
demonstrated that followers of leaders who attended the intervention were more
satisfied with the leaders’ performance as compared to the followers with leaders
who were in the control group. The findings indicated that, leaders who attended the
intervention met the expectations of their followers, used methods of leadership that
are satisfactory and work with their followers in a satisfying way thus supporting
Hypothesis 1a.
Leader effectiveness. The results showed that the followers of leaders who attended
the intervention perceived their leaders as significantly higher on effectiveness at
meeting task demands, resolving task problems and effective at leading the team than
followers of leaders who did not attend the intervention. The results from the
182
analyses of leader effectiveness overtime between leaders in the experimental and
control groups, suggests that leaders who are trained in self-regulation strategies are
able to regulate their behaviour to be more effective in their role.
Extra effort. The outcome of the data analyses supported the fact that followers of
leaders who attended the intervention were able to get their followers to work harder
than they expected, increase their desire to succeed on task and makes them more
willing to try harder as a result of the influence of their leaders than followers of
leader who was in the control group. Although contrary to expectations that after the
intervention, leaders would receive higher ratings from followers in posttest 1,
posttest 1 yielded no significant difference between ratings of followers between
leaders in experimental and control groups. The data suggests there was a lag in the
effect of training. Extra effort measures the construct of whether leaders were able to
motivate followers to perform above and beyond their normal work level in their
current task. The initial causal change from the intervention training should be on the
leader, which is why leaders’ performance (satisfaction and effectiveness) in the
previous two sections was observed to have increased significantly. However, it is
not surprising that to influence change in the followers, once the leaders received the
intervention would need time to be manifested upon the followers, as demonstrated
in the lag within these findings. Hence, the results still support the view that leaders
with higher self-regulation yield higher leadership outcome in increasing followers’
effort to try harder to perform as demonstrated during posttest 2.
183
Overall, Hypothesis 1a which predicted that a self-regulation intervention should
lead to better leader performance was supported. The three facets of leader
performance, measured as leader satisfaction, leader effectiveness and extra effort,
significantly increase for leaders who attended the intervention as compared to
leaders who did not. Followers were more satisfied with leaders who attended the
intervention because the leaders displayed behaviours that met their expectations,
used methods of leadership that were satisfactory and worked with their followers in
a satisfying way. In addition, followers of leaders who attended the intervention
perceived their leaders as significantly higher on effectiveness at meeting task
demands, resolving task problems and effective at leading the team than followers of
leaders who did not receive the intervention. Finally, although there was a lag in the
effect of the intervention on extra effort, leaders were still able to get their followers
to work harder than they expected, increase their followers’ desire to succeed on task
and make them more willing to try harder as a result of the influence of their leaders.
Hypothesis 1b: A self-regulation intervention should lead to better team’s financial
performance, measured as retained profit, return on capital employed (ROCE),
earnings per share (EPS) and (negative) gearing.
Profit. Consistent with Hypothesis 1b which predicted a positive relationship
between self-regulation training and profit, the results from the analyses
demonstrated that leaders in the experimental group who received intervention
training were able to lead their teams to achieve higher profit across time, as
184
compared to the control group. This result is attributable to leaders who have higher
level of self-regulation uses methods of leadership which are more effective in
attaining higher profit than leaders who did not receive the intervention.
Return on capital employed (ROCE). The results of receiving self-regulation
training lead to a higher ROCE measure for teams led by a leader who was in the
experimental group than leaders who were in the control group. Participants in the
training group self regulate their performance as a leader better, which ultimately
resulted in leading their team to manage the money invested into the business
efficiently which in turn provides a higher return to the investors.
Gearing. For the change over time in the measure of gearing ratio, results yielded a
significant difference at p < 0.1 between teams where leaders attended the
intervention and those that did not. Although the significant level was at p = 0.052, it
is closely approaching the level of significance at p < 0.05. Gearing ratio is
calculated as the ratio that compares the company’s equity or capital to borrowed
funds. In brief, gearing refers to the extent to which the company is funded by debt.
The fact that the companies have only been in operation for three (virtual) years, the
companies are still in the earlier stages of growth and hence, still funded by debt
such as loan. It is not unexpected for car manufacturing companies, that have been
operating in the industry for a while such as BMW, Peugeot, Daimler, Renault and
Volkswagen, to have a gearing ratio between 20% to 70% (BMW annual report,
Knippenberg, & Wisse, 2010; Vancouver, More, & Yoder, 2008), there was still a
potential limitation of generalisability of the findings to organisational contexts and
this needs to be considered. However, the BSG module served as a backdrop for this
study as it shared a number of characteristics that would be found in organisational
settings. For example, the teams worked in a diverse group to complete work tasks
such as strategic planning and assessment of the markets and competitors;
implementing marketing, operation, human resource management and financial
strategies; and at the same time, to meet shareholders expectation to generate return
on investment. Also, the team leader shared characteristics such as; they hold the
position of a leader, they were fairly new to the particular leadership tasks, position
and role requirements, and they needed to lead team members to achieve a specific
goals within a time frame. The module was completed over a ten month period, and
the level of performance holds high consequence to their degree result. The intention
of these carefully selected characteristics is to make it more probable that the current
findings will generalise to other contexts. The next step suggested would be to
replicate these findings with non-student sample to provide further support.
217
5.5. Avenues for future research
The current research serves as a solid foundation for future inquiries that could
further advance the understanding on leadership development. Within this section,
the additional possibilities for future research, to add to the depth and breadth of the
present findings will be discussed.
While the successful manipulation of self-regulation as a form of meta-competency
allows individual leaders to be aware of what competencies are required to perform
effectively and regulate their behaviour into developing the relevant competencies to
achieve the desired results, organisational support may enhance or decrease the
effectiveness of the relationship. As such, it is recommended for future research to
examine if organisational support moderates this relationship. Organisational support
in the form of resources made available by the organisation could reinforce
development amongst individuals (Tracey, Tannenbaum, & Kavanagh, 1995) and
foster a continuous learning environment (Noe & Wilk, 1993). Previous research has
demonstrated a link between organisational support practices and performance
(Baldwin, Magjuka, & Loher, 1991; Tharenou, 2001). Thus, further research could
investigate the effect of organisational level support on the leaders’ tendency to
develop relevant competencies after self-regulation training and inform how
organisation could facilitate leader developments.
In addition, research is also needed to identify individual characteristics that predict
leaders’ readiness for development and understand how these characteristics affect
218
the success of the self-regulation intervention. Certain traits are proposed to promote
how leaders develop from experience. For example, Tesluk and Jacobs (1998)
suggested that traits such as ‘openness to experience’ and ‘risk tolerance’ can
influence the likelihood that leaders will accept developmental interventions (Tesluk
& Jacobs, 1998). More recently, an individual difference in terms of ‘developmental
readiness’ was put forward as a potential moderator that could serve to accelerate
leadership development (Hannah & Avolio, 2010). Individuals with higher
developmental readiness are proposed to develop quicker and more efficiently
(Shebaya, 2010). Identifying the moderators between the leadership development
intervention and outcomes would provide more a holistic insight to the current
findings as to how much individual differences influence the success of leader
developmental effort.
One-on-one coaching is the most commonly practiced method in the leadership field
compared to group coaching (Manfred & Kets, 2005). However, group coaching is
the fastest growing segment of the coaching profession. According to the research
conducted by Manfred and Kets (2005), group coaching yields a higher pay-off.
Future research should examine the relative effectiveness of group versus one-on-one
coaching by including both these two modalities in the experimental design. Besides
extending knowledge on which method yields the most effective coaching process
and outcomes, it will also be beneficial to inform practice if group coaching is equal
or more effective compared to one-on-one coaching because group coaching will
incur less cost and time.
219
The sample in this research study was students in the Business School who take the
Business Strategy Game (BSG) module performing an interactive computer
simulation. Future research needs to continue exploring the effects of a self-
regulation intervention using other samples from organisations. Although the
characteristics of the sample and field settings were carefully selected to make it
more probable that the current findings will generalise to other contexts, a replication
of the findings from this research in the context of organisations could provide
further support. In addition, researchers are often advised to use multiple methods to
confirm data and understand the data further (Smith, 1996). Therefore, methods such
as interviews with participants or others (e.g., followers, supervisors, clients, etc.),
observation of team meetings, or tracking of action plans could provide additional
information to confirm pretest/posttest scores and lead to an enriched explanation of
the research problem (Martineau, 2004).
220
5.6. Epilogue
The present research compared a leadership development intervention based on self-
regulation training and its impact on leader performance. Specifically, it examined
the intervention’s effect on followers’ perceptual measures of leader effectiveness as
well as objective measures of teams’ financial performance and independent
assessment measures. Leader competencies were also tested as a mediator. Overall,
the empirical findings revealed that the self-regulation intervention had a positive
impact on leader and team performance. Leaders trained in self-regulation developed
relevant competencies for their role and these competencies positively affected
performance.
This thesis adds to the growing line of leadership development research in terms of
theory and practical implications. The conceptual framework suggested in this thesis
begins to shed lights on the underlying mechanism of why the practice of 360-degree
feedback and executive coaching are successful because the practice of both, has far
preceded its theoretical understanding. Additionally, this thesis puts forward the
unique contribution of conceptualising self-regulation as a meta-competency that
allows leaders to be aware of what competencies are required to perform effectively
and regulate their behaviour into developing relevant competencies to achieve the
desired results to meet the complex demands of leadership. Furthermore, the robust
design of the longitudinal field experimental study advocates the change that has
been called for in leadership developmental research. The findings also highlight
several important implications for organisations and practitioners of leadership
221
development, in which the intervention designed to increase self-regulation, will not
only sustain a continuous cycle of leader development but also reduce costs and
expand the benefits of executive coaching to more leaders beyond the upper
echelons.
To conclude, and return to the saying in the introduction of this thesis, instead of
saying “Give a man a fish and you feed him for today, teach a man to fish and you
feed him for life”, this research suggests “Give a leader an executive coach and you
solve his problem for today, teach a leader to self-regulate and you develop him for
life”.
222
Bibliography
2010 Training industry report. (2010). Training, 47(6), 18-31.
Adair, J. (2009). Not Bosses but leaders, how to lead the way to success (pp. 1-208). Guildford: Kogan Page Limited.
Anderson, C. R., & Schneier, C. E. (1978). Locus of Control, Leader Behavior and Leader Performance among Management Students. Academy of Management Journal, 21(4), 690-698.
Atwater, L. E., Dionne, S. D., Avolio, B. J., Camobreco, J. F., & Lau, A. W. (1999). A longitudinal study of the leadership development process: Individual differences predicting leader effectiveness. Human Relations, 52(12), 1543–1562.
Atwater, L. E., Ostroff, C., Yammarino, F. J., & Fleenor, J. W. (1998). Self-other agreement: Does it really matter? Personnel Psychology, 51, 577-598.
Atwater, L. E., & Waldman, D. A. (1998). 360 degree feedback and leadership development. Leadership Quarterly, 9(4), 423-426.
Atwater, L. E., & Yammarino, F. J. (1992). Does self-other agreement on leadership perceptions moderate the validity of leadership and performance predictions. Personnel Psychology, 45, 141-165.
Avolio, B. J. (2005). Leadership development in balance: Made / Born. New Jersey: Lawrence Erlbaum Associates.
Avolio, B. J. (2007). Promoting more integrative strategies for leadership theory-building. American Psychologist, 62(1), 25-33.
Avolio, B. J., Avey, J. B., & Quisenberry, D. (2010). Estimating return on leadership development investment. Leadership Quarterly, 21(4), 633-644.
Avolio, B. J., & Chan, A. (2008). The dawning of a new era for genuine leadership development. In G. P. Hodgkinson & J. K. Ford (Eds.), International Review of Industrial and Organizational Psychology (23rd ed., pp. 197-238). Wiley-Blackwell.
Avolio, B. J., & Gardner, W. L. (2005). Authentic leadership development: Getting to the root of positive forms of leadership. Leadership Quarterly, 16(3), 315-338.
223
Avolio, B. J., Reichard, R. J., Hannah, S. T., Walumbwa, F., & Chan, Adrian. (2009). A meta-analytic review of leadership impact research: Experimental and quasi-experimental studies. Leadership Quarterly, 20(5), 764-784.
Avolio, B. J., Walumbwa, F., & Weber, T. J. (2009). Leadership: Current theories, research, and future directions. Annual Review Psychology, 60, 421-49.
Baldwin, T. T., Magjuka, R. J., & Loher, B. T. (1991). The perils of participation: Effects of choice of training on trainee motivation and learning. Personnel Psychology, 44(1), 51-65.
Bandura, A. (1991). Social cognitive theory of self-regulation. Organizational Behavior and Human Decision Processes, 50, 248-287.
Barnes, D. (2001). Research methods for the empirical investigation of the process of formation of operations strategy. International Journal, 21(8), 1076-1096.
Baron, R. M., & Kenny, D. (1986). The moderator-mediator variable distinction in social psychological research: conceptual, strategic, and statistical considerations. Journal of Personality and Social Psychology, 51(6), 1173-1182.
Bass, B. M. (1990). Bass & Stogdill’s handbook of leadership: Theory, research, and managerial application (3rd ed.). New York: Free Press.
Bass, B. M., & Avolio, B. J. (1990). Transformational leadership development: Manual for multifactor leadership questionnaire. Consulting Psychologists Press. CA: Palo Alto.
Bass, B. M., & Bass, R. (2008). The Bass handbook of leadership: Theory, research, and managerial applications (4th ed.). New York: Free Press.
Bass, B. M., & Yammarino, F. J. (1991). Congruence of self and othersʼ leadership ratings of naval officers for understanding successful performance. Applied Psychology: An International Review, 40(4), 437-454.
Battilana, J., Gilmartin, M., Sengul, M., Pache, A., & Alexander, J. (2010). Leadership competencies for implementing planned organizational change. Leadership Quarterly, 21(3), 422-438.
Baum, F. (1995). Researching public health: Behind the qualitative-quantitative methodological debate. Social Science & Medicine, 40(4), 459-468.
Bender, R., & Ward, K. (2008). Corporate financial strategy (3rd ed., pp. 1-408). Oxford: Elsevier Butterworth-Heinemann.
224
Bentler, P. M., & Bonett, D. G. (1980). Significance tests and goodness of fit in the analysis of covariance structures. Psychological Bulletin, 88(3), 588-606.
Binswanger, H. (1991). Volition as cognitive self-regulation. Organizational Behavior and Human Decision Processes, 50, 154-178.
Blancero, D., Boroski, J., & Dyer, L. (1996). Key competencies for a transformed human resource organization: Results of a field study. Human Resource Management, 35(3), 383-403.
Blattner, J. (2005). Coaching: The successful adventure of a downwardly mobile executive. Consulting Psychology Journal: Practice and Research, 57(1), 3-13.
Bliese, P. D. (2000). Within-group agreement, non-independence, and reliability: Implications for data aggregation and analysis. In K. J. Klein & S. W. J. Kozlowski (Eds.), Multilevel theory, research, and methods in organizations (p. 349−381). San Francisco: Jossey- Bass.
BMW annual report. (2009). BMW Group.
Boekaerts, M., Maes, S., & Karoly, P. (2005). Self-regulation across domains of applied psychology: Is there an emerging consensus? Applied Psychology: An International Review, 54(2), 149-154.
Bonfield, H. (2003). Executive coaching is not just for big companies. British Journal of Administrative Management, 36, 18-20.
Bouty, I. (2000). Interpersonal and interaction influences on informal resource exchanges between R&D researchers across organizational boundaries. Academy of Management Journal, 43(1), 50-66.
Boyatzis, R. E. (1999). Self-directed change and learning as a necessary meta-competency for success and effectiveness in the 21st century. In R. Sims & J. G. Veres (Eds.), Keys to Employee Success in the Coming Decades (pp. 15-31). Westport, CT: Greenwood Publishing.
Boyce, L. a, Zaccaro, S. J., & Wisecarver, M. Z. (2010). Propensity for self-development of leadership attributes: Understanding, predicting, and supporting performance of leader self-development. Leadership Quarterly, 21(1), 159-178.
Bracken, D. W., Timmereck, C. W., & Church, A. H. (2001). The handbook of multisource feedback. San Francisco: Jossey-Bass.
Bracken, David W, Dalton, M. A., Jako, R. A., McCauley, C. D., Pollman, V. A., & Degree, S. H. (1997). Should 360-degree feedback be used only for
225
developmental purposed? Victoria. North Carolina: Center for Creative Leadership.
Bradley, J., Nicol, A., Charbonneau, D., & Meyer, J. (2002). Personality correlates of leadership development in Canadian Forces officer candidates. Canadian Journal of Behavioural Science, (1993), 92-103.
Brake, T. (1997). The global leader: Critical factors for creating the world class organization. Chicago: Irwin Professional Publishing.
Bresnen, M. (1995). All things to all people? Perceptions, attributions, and constructions of leadership. Leadership Quarterly, 6(4), 495-513.
Brotman, L. E., Liberi, W. P., & Wasylyshyn, K. M. (1998). Executive coaching: The need for standards of competence. Consulting Psychology Journal: Practice and Research, 50(1), 40-46.
Brown, J. M., Miller, W. R., & Lawendowski, L. A. (1999). The self-regulation questionnaire. In L. VandeCreek & T. L. Jackson (Eds.), Innovations in clinical practice: A source book (Vol 17) (pp. 281-289). Sarasota: Professional Resource Press.
Brown, J. M., Miller, W. R., & Lawendowski, L. A. (1999). Innovations in clinical practice: A sourcebook. (L. VandeCreek & T. L. Jackson, Eds.). Sarasota: Professional Resource Press.
Browne, M. W., & Cudeck, R. (1989). Single sample cross-validation indices for covariance structures. Multivariate Behavioral Research, 24(4), 445–455.
Bryman, A. (2001). Social research methods. Bath: Oxford University Press.
Bueno, C., & Tubbs, S. (2004). Identifying global leadership competencies: An exploratory study. Journal of American Academy of Business, (September), 80-88.
Burke, M. J., & Day, R. R. (1986). A cumulative study of the effectiveness of managerial training. Journal of Applied Psychology, 71(2), 232-245.
Burrell, G., & Morgan, G. (1979). Sociological paradigm and organisational analysis. London: Heinemann Educational Books Ltd.
Byrne, B. (2001). Structural equation modeling with AMOS: Basic concepts, applications and programming. Mahwah, New Jersey: Lawrence Erlbaum.
Byrne, B., & Crombie, G. (2003). Modeling and testing change: An introduction to the latent growth curve model. Understanding Statistics, 2(3), 177-203.
226
Calder, B. J. (1977). An attribution theory of leadership. In B. Staw & G. Salancik (Eds.), New directions in organizational behavior (pp. 179-204). Chicago: Clair Press.
Campbell Quick, J., & Macik-Frey, M. (2004). Behind the mask coaching through deep interpersonal communication. Consulting Psychology Journal: Practice and Research, 56(2), 67-74.
Carlyle, T. (1907). Heroes and hero worship. Boston: Adams.
Carver, C. S., & Scheier, M. F. (1998). On self-regulation of behaviour. New York: Cambridge University Press.
Carver, C. S., & Scheier, M. F. (2000). Scaling back goals and recalibration of the affect system are processes in normal adaptive self-regulation: Understanding “response shift” phenomena. Social Science and Medicine, 50(12), 1715-22.
Carver, C. S., & Scheier, M. F. (2002). Control processes and self-organization as complementary principles underlying behavior. Personality and Social Psychology Review, 6(4), 304-315.
Catona, V. M., Cronshaw, S. F., Wiesner, W. H., Hackett, R. D., & Methot, L. L. (2001). Recruitment and selection in Canada (2nd ed.). Scarborough: Nelson.
Chen, G., Gully, S. M., & Eden, D. (2001). Validation of a new general self-efficacy scale. Organizational Research Methods, 4(1), 62-83.
Christensen, L. B. (2007). Experimental methodology (10th ed.). USA: Pearson.
Chung, M.-K. (2000). The development of self-regulated learning. Asia Pacific Education Review, 1(1), 55-66.
Church, A. (1997). Managerial self-awareness in high-performing individuals in organizations. Journal of Applied Psychology, 82(2), 281-292.
Clark-Carter, D. (2004). Quantitative psychological research: A studentʼs handbook. Hove: Psychology Press.
Clutterbuck, D., & Megginson, D. (1999). Mentoring executives and directors. Oxford: Butterworth Heinemann.
Cocivera, T., & Cronshaw, S. F. (2004). Action frame theory as a practical framework for the executive coaching process. Consulting Psychology Journal: Practice and Research, 56(4), 234-245.
227
Collins, D. B., & Holton III, E. (2004). The Effectiveness of managerial leadership development programs: A meta-analysis of studies from 1982 to 2001. Human Resource Development Quarterly, 15(2), 217-248.
Conger, J., & Benjamin, B. (1999). Building leaders: How successful companies develop the next generation. Building. San Francisco: Jossey-Bass.
Conger, J., & Kanungo, R. (1987). Toward a behavioral theory of charismatic leadership in organizational settings. Academy of Management Review, 12(4), 637-649.
Conger, J., & Toegel, G. (2003). Action learning and multi-rater feedback as leadership development interventions: Popular but poorly deployed. Journal of Change Management, 3(4), 332-348.
Conner, J. (2000). Developing the global leaders of tomorrow. Human Resource Management, 39(23), 147-157.
Cooper, D. R., & Schindler, P. S. (2003). Business research methods. Singapore: McGraw Hill.
Covey, S. (2004). The seven habits of highly effective people. London: Simon & Schuster UK Ltd.
Creswell, J. (1994). Research design: Quanlitative and quatitative approaches. Thousand Oaks, CA: SAGE publications.
Crocker, L., & Algina, J. (1986). Introduction to classical and modern test theory. NewYork: Rinehart & Winston.
Cronshaw, S. F., & Lord, R. G. (1987). Effects of categorization, attribution, and encoding processes on leadership perceptions. Journal of Applied Psychology, 72(1), 97-106.
Daimler annual report. (2010). Daimler Group.
Dansereau, F., Alutto, J., & Yammarino, F. J. (1984). Theory testing in organizational behavior: The varient approach. Englewood Cliffs, NJ: Prentice Hall.
Day, D. (2000). Leadership development: A review in context. Leadership Quarterly, 11(4), 581-613.
Day, D., Schleicher, D., Unckless, A., & Hiller, N. (2002). Self-monitoring personality at work: A meta-analytic investigation of construct validity. Journal of Applied Psychology, 87(2), 390 - 401.
228
De Vaus, D. (2001). Research design in social research. Surrey: SAGE publications.
DeRue, D. S., & Morgeson, F. P. (2007). Stability and change in person-team and person-role fit over time: The effects of growth satisfaction, performance, and general self-efficacy. Journal of Applied Psychology, 92(5), 1242-1253.
DeShon, R. P., Brown, K. G., & Greenis, J. L. (1996). Does self-regulation require cognitive resources? Evaluation of resource allocation models of goal setting. Journal of Applied Psychology, 81(5), 595-608.
Deshpande, R. (1983). "Paradigms lost": On theory and method in research in marketing. Journal of Marketing, 47(4), 101-111.
Diedrich, R. C. (1996). An iterative approach to executive coaching. Consulting Psychology Journal: Practice and Research, 48(2), 61-66.
Diedrich, R. C., & Kilburg, R. R. (2001). Further consideration of executive coaching as an emerging competency. Consulting Psychology Journal: Practice and Research, 53(4), 203-204.
Diehl, M., Semegon, A. B., & Schwarzer, R. (2006). Assessing attention control in goal pursuit: A component of dispositional self-regulation. Journal of Personality Assessment, 86(3), 306-317.
Dignath, C., Buettner, G., & Langfeldt, H. (2008). How can primary school students learn self-regulated learning strategies most effectively?A meta-analysis on self-regulation training programmes. Educational Research Review, 3(2), 101-129.
Douglas, C. A., & Morley, W. H. (2000). Executive coaching: An annotated bibliography (pp. 1-60). Greensboro, NC: Center for Creative Leadership.
Dragoni, L., Tesluk, P.E., Russell, J. E. A., & Oh, I. S. (2009). Understanding managerial development: Integrating developmental assignments, learning orientation, and access to developmental opportunities in predicting managerial competencies. Academy of Management Journal, 52(4), 731–743.
Dvir, T., & Shamir, B. (2003). Follower developmental characteristics as predicting transformational leadership: A longitudinal field study. Leadership Quarterly, 14(3), 327-344.
Eden, D. (2001). Means efficacy: External sources of general and specific efficacy. In M. Erez, U. Kleinbeck, & H. Thierry (Eds.), Work motivation in the context of a globalizing economy (pp. 73-85). New Jersey: Lawrence Erlbaum.
229
Edwards, M. R., & Ewen, A. J. (1996). 360° Feedback: The powerful new model for employee assessment & performance improvement. New York: AMACOM American Management Association.
Ehrhart, M., & Klein, K. (2001). Predicting followersʼ preferences for charismatic leadership: The influence of follower values and personality. Leadership Quarterly, 12(2), 153-179.
Eisenberg, N., Fabes, R., Guthrie, I., & Reiser, M. (2000). Dispositional emotionality and regulation: Their role in predicting quality of social functioning. Journal of Personality and Social Psychology, 78(1), 136-157.
Ely, K., Boyce, L. a, Nelson, J. K., Zaccaro, S. J., Hernez-Broome, G., & Whyman, W. (2010). Evaluating leadership coaching: A review and integrated framework. Leadership Quarterly, 21(4), 585-599.
Feldman, D. C., & Lankau, M. J. (2005). Executive coaching: A review and agenda for future research. Journal of Management, 31(6), 829-848.
Fiedler, F. E. (1964). A contingency model of leadership effectiveness. In L. Berkowitz (Ed.), Advances in experimental social psychology (Vol 1). New York: Academic Press.
Fiedler, F. E., & Garcia, J. E. (1987). New approaches to leadership effectiveness. New York: John Wiley & Sons.
Fiedler, P. E. (1996). Research on leadership selection and training: One view of the future. Administrative Science Quarterly, 41, 241-250.
Field, A. P. (2005). Discovering statistics using SPSS (2nd ed.). London: SAGE publications Ltd.
Field, A. P., & Hole, G. (2003). How to design and report experiments. Wiltshire: Sage Thousand Oaks.
Fisher, A. (2001). Executive coaching-With returns a CFO could love. Fortune, 250.
Fleenor, J. W., McCauley, C. D., & Brutus, S. (1996). Self-other rating agreement and leader effectiveness. Leadership Quarterly, 7(4), 487-506.
Fleenor, J. W., Smither, J. W., Atwater, L. E., Braddy, P. W., & Sturm, R. E. (2010). Self–other rating agreement in leadership: A review. Leadership Quarterly, 21(6), 1005-1034.
230
Fletcher, C., & Baldry, C. (2000). A study of individual differences and self-awareness in the context of multi-source feedback. Journal of Occupational and Organizational Psychology, 73(3), 303-319.
Gangestad, S., & Snyder, M. (1985). "To carve nature at its joints": On the existence of discrete classes in personality. Psychological Review, 92(3), 317-349.
Gardner, H. (1993). Multiple intelligences: The theory in practice. New York: Basic Books.
Gardner, W. L., Avolio, B. J., Luthans, F., May, D., & Walumbwa, F. (2005). “Can you see the real me?” A self-based model of authentic leader and follower development. Leadership Quarterly, 16(3), 343-372.
Gardner, W. L., Lowe, K. B., Moss, T. W., Mahoney, K. T., & Cogliser, C. C. (2010). Scholarly leadership of the study of leadership: A review of The Leadership Quarterlyʼs second decade, 2000–2009. Leadership Quarterly, 21(6), 922-958.
Garman, A. N., Whiston, D. L., & Zlatoper, K. W. (2000). Media perceptions of executive coaching and the formal preparation of coaches. Consulting Psychology Journal: Practice and Research, 52(3), 201-205.
Gaudine, A. P., & Saks, A. M. (2004). A longitudinal quasi-experiment on the effects of posttraining transfer interventions. Human Resource Development Quarterly, 15(1), 57-76.
Gegner, C. (1997). Coaching: Theory and practice. PhD Thesis. University of California.
Ghorpade, J. (2000). Managing five paradoxes of 360-degree feedback. Academy of Management Executive, 14(1), 140-152.
Gibler, D., Carter, L., & Goldsmith, M. (2000). Best practices in leadership development handbook. San Francisco: Jossey-Bass.
Gioia, D. A., & Pitre, E. (1990). Multiparadigm perspectives on theory building. Academy of Management Review, 15(4), 584-602.
Gist, M. E., Stevens, C. K., & Baveita, A. G. (1991). Effects of self-efficacy and post-training intervention on the acquisition and maintenance of complex interpersonal skills. Personnel Psychology, 44, 837-861.
Goleman, D. (1998). Working with emotional intelligence. London: Bloomsbury.
231
Griffiths, A. (1999). Organizational interventions: facing the limits of the natural science paradigm. Scandinavian Journal of Work, Environment & Health, 25(6), 589-596.
Hair, J., Black, B., Babin, B., Anderson, R., & Tatham, R. (2006). Multivariate data analysis (6th ed.). Upper Saddle River: Prentice Hall.
Hall, D. T., Otazo, K. L., & Hollenbeck, G. (1999). What Really Happens in Executive Coaching. Organizational Dynamics, Winter, 39-53.
Hammersley, M. (1996). The relationship between qualitative and quantitative research: Paradigm loyalty versus methodological eclecticism. In J. T. E. Richardson (Ed.), Handbook of qualitative research methods for psychology and the social sciences (pp. 159-174). Leicester: BPS Books.
Hannah, S. T., & Avolio, B. J. (2010). Ready or not: How do we accelerate the developmental readiness of leaders? Journal of Organizational Behavior, 31(March), 1181-1187.
Hernez-Broome, G., & Hughes, R. L. (2004). Leadership Development: Past, present, and future. Human Resource Planning, 27(1), 24–33.
Hersey, P., & Blanchard, K. H. (1972). Management of organizational behavior: Utilizing human resources. Englewood Cliffs, NJ: Prentice-Hall.
Hirst, G., Mann, L., Bain, P., Pirola-Merlo, A., & Richver, A. (2004). Learning to lead: The development and testing of a model of leadership learning. Leadership Quarterly, 15(3), 311-327.
Homan, R. (1991). The ethics of social research. New York: Longman.
Hooijberg, R. J. (2009). Using multisource feedback coaching effectively in executive education. Academy of Management Learning and Education, 8(4), 483-494.
Hooijberg, R. J., Hunt, J. G., & Dodge, G. E. (1997). Leadership complexity and development of the leaderplex model. Journal of Management, 23(3), 375-408.
Hooijberg, R. J., & Schneider, M. (2001). Behavioural complexity and social intelligence: How executive leaders use stakeholders to form a system perspective. In S. Zaccaro & R. Klimoski (Eds.), The nature of organisational leadership (p. 104-131). (pp. 104-131). San Francisco, CA: Jossey-Bass.
House, R. (1971). A path goal theory of leader effectiveness. Administrative Science Quarterly, 16(3), 321-341.
232
House, R., & Aditya, R. (1997). The social scientific study of leadership: Quo vadis? Journal of management, 23(3), 409-473.
Howell, J., & Avolio, B. J. (1993). Transformational leadership, transactional leadership, locus of control, and support for innovation: Key predictors of consolidated-business-unit performance. Journal of Applied Psychology, 78(6), 891-902. doi: 10.1037/0021-9010.78.6.891.
Hu, L. T., & Bentler, P. M. (1999). Cutoff criteria for fit indexes in covariance structure analysis: Conventional criteria versus new alternatives. Structural Equation Modeling: A Multidisciplinary Journal, 6(1), 1-55.
Hudson, F. M. (1999). The handbook of coaching: A resource guide to effective coaching with individuals and organisations. San Francisco: Jossey-Bass.
Hunt, J. G. (1991). Leadership: A new synthesis. Newbury Park: SAGE publications.
Hussey, J., & Hussey, R. (1997). Business Research: A practical guide for undergraduate and postgraduate students. Chippenham: Antony Rowe Ltd.
Ilies, R., Morgeson, F., & Nahrgang, J. (2005). Authentic leadership and eudaemonic well-being: Understanding leader–follower outcomes. Leadership Quarterly, 16(3), 373-394.
Jacobs, T. O., & Jacque, E. (1987). Leadership in complex systems. In J. A. Zeidner (Ed.), Human productivity enhancement (pp. 7-65). New York: Praeger.
Jacobs, T. O., & Jacque, E. (1990). Military executive leadership. In E. K. Clark & M. B. Clark (Eds.), Measures of leadership (pp. 281-295). Greensboro, NC: Center for Creative Leadership.
James, L. R., Demaree, R. G., & Wolf, G. (1984). Estimating within-group interrater reliability with and without response bias. Journal of Applied Psychology, 69(1), 85-98.
Johnson, H. (2004). The ins and outs of executive coaching. Training, 41(May), 36-42.
Joo, B. K. (2005). Executive coaching: A conceptual framework from an integrative review of practice and research. Human Resource Development Review, 4(4), 462-488.
Jordan, J., & Cartwright, S. (1998). Selecting expatriate managers: Key traits and competencies. Leadership & Organization Development Journal, 19(2), 89-96.
233
Judge, T., & Bono, J. E. (2000). Five-factor model of personality and transformational leadership. Journal of Applied Psychology, 85(5), 751-765.
Judge, T., & Bono, J. E. (2001). Relationship of core self-evaluations traits — self-esteem, generalized self-efficacy, locus of control , and emotional stability — with job satisfaction and job performance: A meta-analysis. Journal of Applied Psychology, 86(1), 80-92.
Judge, T., Bono, J. E., Ilies, R., & Gerhardt, M. (2002a). Personality and leadership: A qualitative and quantitative review. Journal of Applied Psychology, 87(4), 765-780.
Judge, T., Erez, A., Bono, J. E., & Thoresen, C. J. (2002b). Are Measures of self-esteem, neuroticism, locus of control, and generalized self-efficacy indicators of a common core construct? Journal of Personality and Social Psychology, 83(3), 693-710.
Judge, T., Jackson, C. L., Shaw, J. C., Scott, B. A., & Rich, B. L. (2007). Self-efficacy and work-related performance: The integral role of individual differences. Journal of Applied Psychology, 92(1), 107-127.
Judge, W. Q., & Cowell, J. (1997). The brave new world of executive coaching. Business Horizons, 40(4), 71–77.
Jung, D. I., & Avolio, B. J. (1999). Effects of leadership style and followersʼ cultural orientation on performance in group and individual task conditions. Academy of Management Journal, 42(2), 208-218.
Kampa-Kokesch, S. (2001). Executive coaching as an individually tailored consultation intervention: Does it increase leadership? PhD Thesis. Western Michigan University.
Kampa-kokesch, S., & Anderson, M. Z. (2001). Executive coaching: A comprehensive review of the literature. Consulting Psychology Journal: Practice and Research, 53(4), 205-228.
Kanfer, F., & Karoly, P. (1972). Self-Control: A behavioristic excursion into the lionʼs den. Behavior Therapy, 3(3), 398-416.
Kanfer, F. H. (1970). Self-monitoring: Methodological limitations and clinical applications. Journal of Consulting and Clinical Psychology, 35(2), 148-152.
Kanfer, R., & Ackerman, P. (1989). Motivation and cognitive abilities: An integrative/aptitude-treatment interaction approach to skill acquisition. Journal of Applied Psychology, 74(4), 657-690.
234
Kanfer, R., & Heggestad, E. (1997). Motivational traits and skills: A person-centered approach to work motivation. Research in Organizational Behavior, 19, 1-56.
Karoly, P. (1993). Mechanism of self-regulation: A systems view. Annual Review Psychology, 44, 23-52.
Keith, N., & Frese, M. (2005). Self-regulation in error management training: Emotion control and metacognition as mediators of performance effects. Journal of Applied Psychology, 90(4), 677-691.
Keys, B., & Wolfe, J. (1988). Management education and development: Current issues and emerging trends. Journal of Management, 14(2), 205-229.
Kiel, F., Rimmer, E., Williams, K., & Doyle, M. (1996). Coaching at the top. Consulting Psychology Journal: Practice and Research, 48(2), 67-77.
Kilburg, R. R. (1996). Toward a conceptual understanding and definition of executive coaching. Consulting Psychology Journal: Practice and Research, 48(2), 134-144.
Kilburg, R. R. (1997). Coaching and executive character: Core problems and basic approaches. Consulting Psychology Journal: Practice and Research, 49(4), 281-299.
Kilburg, R. R. (2001). Facilitating intervention adherence in executive coaching model and methods. Consulting Psychology Journal: Practice and Research, 53(4), 251-267.
King, N. (2000). Marking ourselves heard: The challenges facing advocates of qualitative research in work and organizational psychology. European Journal of Work and Organizational Psychology, 9(4), 589-596.
Kirk, R. (1999). Relativism and reality: A contemporary introduction. London: Routledge.
Kish, L. (1987). Statistical design for research. New York: Wiley.
Klein, K. J., Conn, A. B., Smith, D. B., & Sorra, J. S. (2001). Is everyone in agreement? An exploration of within-group agreement in employee perceptions of the work environment. Journal of Applied Psychology, 86(1), 3–16.
Kluger, A. N., & DeNisi, A. (1996). Effects of feedback intervention on performance: A historical review, a meta-analysis, and a preliminary feedback intervention theory. Psychological Bulletin, 119(2), 254-284.
235
Kluger, A. N., & DeNisi, A. (1998). Feedback interventions: Toward the understanding of a double-edged sword. Current Directions in Psychological Science, 7(3), 67-72.
Knippenberg, D. van, Knippenberg, B. van, De Cremer, D., & Hogg, M. A. (2004). Leadership, self, and identity: A review and research agenda. Leadership Quarterly, 15(6), 825-856.
Koene, B., Vogelaar, A. L. W., & Soeters, J. L. (2002). Leadership effects on organizational climate and financial performance: Local leadership effect in chain organizations. Leadership Quarterly, 13(3), 193-215.
Koestner, R., Bernieri, F., & Zuckerman, M. (1992). Self-regulation and consistency between attitudes, traits, and behaviors. Personality and Social Psychology Bulletin, 18(1), 52–59.
Kombarakaran, F. a, Yang, J. a, Baker, M. N., & Fernandes, P. B. (2008). Executive coaching: It works! Consulting Psychology Journal: Practice and Research, 60(1), 78-90.
Koonce, R. (1994). One on one. Training and Development, February, 34-42.
Kozlowski, S. W. J., & Bell, B. S. (2006). Disentangling achievement orientation and goal setting: Effects on self-regulatory processes. Journal of Applied Psychology, 91(4), 900-916.
Kralj, M. M. (2001). Coaching at the top : Assisting a chief executive and his team. Consulting Psychology Journal: Practice and Research, 53(2), 108-116.
Latham, G. P., & Locke, E. A. (1991). Self-regulation through goal-setting. Organizational Behavior and Human Decision Processes, 50, 212-247.
Lee, N. (2008). Doing business research: A guide to theory and practice. Cornwall: SAGE publications.
Levinson, H. (1996). Executive coaching. Taking leadership development to the next level. Consulting Psychology Journal: Practice and Research, 22(1), 115-123.
London, M., & Smither, J. W. (1995). Can multi-source feedback change Perceptions of goal accomplishment, self-evaluations, and performance-related outcomes? Theory-based applications and directions for research. Personnel Psychology, 48(4), 803-839.
Lord, R. D., & Maher, K. J. (1991). Leadership and information processing: Linking perceptions and performance. Boston: Unwind Hyman.
236
Lord, R. G., Foti, R. J., & DeVader, C. L. (1984). A test of leadership categorization theory: Internal structure, information processing, and leadership perceptions. Organizational Behavior and Human Performance, 34, 343–378.
Lord, R. G., & Maher, K. J. (1990). Alternative information-processing models and their implications for theory, research, and practice. Academy of Management Review, 15(1), 9-28.
Lord, R. G., Vader, C. L. de, & Alliger, G. M. (1986). A meta-analysis of the relation between personality traits and leadership perceptions: An application of validity generalization procedures. Journal of Applied Psychology, 71(3), 402-410.
Lowe, K. B., & Gardner, W. L. (2000). Ten years of The leadership quarterly: Contributions and challenges for the future. Leadership Quarterly, 11(4), 459-514.
Luthans, F., & Peterson, S. J. (2003). 360-degree feedback with systematic coaching: Empirical analysis suggests a winning combination. Human Resource Management, 42(3), 243-256.
Mabe, P. A., & West, S. G. (1982). Validity of self-evaluation of ability : A review and meta-analysis. Journal of Applied Psychology, 67(3), 280-296.
Manfred, F. R., & Kets, D. V. (2005). Leadership group coaching in action : The Zen of creating high performance teams. Academy of Management Executive, 19(1), 61-78.
Martineau, J. W. (2004). Evaluating the impact of leader development. In C. D. McCauley & E. Van Velsor (Eds.), The Center for Creative Leadership handbook for leadership development (2nd ed., pp. 234-267). San Francisco: Jossey-Bass.
Maxwell, S., & Delaney, H. D. (2004). Designing experiments and analyzing data: A model comparison perspective. Mahwah, New Jersey: Laurence Erlbaum Associates.
Mazutis, D., & Slawinski, N. (2008). Leading organizational learning through authentic dialogue. Management Learning, 39(4), 437-456.
McCall, M., & Lombardo, M. (1983). Off the track: Why and how successful executives get derailed. Greensboro: Center for Creative Leadership.
Mccall, M. W. (2004). Leadership development through experience. Academy of Management Executive, 18(3), 127-132.
237
McCarthy, A. M., & Garavan, T. N. (1999). Developing self-awareness in the managerial career development process: the value of 360-degree feedback and the MBTI. Journal of European Industrial Training, 23(9), 437-445.
McCauley, C. D., & Van Velsor, E. (2004). The center for creative leadership handbook of leadership development. Leadership (2nd ed., pp. 1-10). San Francisco: Jossey-Bass.
McDermott, M., & Levenson, A. (2007). What coaching can and cannot do for your organization. Human Resource Planning, 30(2), 30-37.
McLagan, P. (1996). Competency system in the new world of work mclagan. Third International Linkage Inc., conference on Using Competency-Based Tools and Applications to Drive Organizational Performance. Chicago.
Medsker Larry, J., & Gina, J. (1994). A review of current practices for evaluating causal models in organizational behavior and human resources management research. Journal of Management, 20(2), 439–464.
Miller, W. R., & Brown, J. M. (1991). Self-regulation as a conceptual basis for the prevention and treatment of addictive behaviors. In N. Heather, W. R. Miller, & J. Greely (Eds.), Self-control and the addictive behaviours (pp. 3-79). Sydney: Maxwell Macmillan.
Minichiello, V., Aroni, R., Timewell, E., & Alexander, L. (1992). In-depth interviewing: Researching people. Melbourne: Longman.
Mirabile, R. J. (1997). Everything you wanted to know about competency modeling. Training and development, 51(8), 73–77.
Moran, R. T., & Riesenberger, J. R. (1994). The global challenge: Building the new worldwide enterprise. London: McGraw-Hill Book Company.
Moss, S., Dowling, N., & Callanan, J. (2009). Towards an integrated model of leadership and self regulation. Leadership Quarterly, 20(2), 162-176.
Mumford, M., Hunter, S. T., Eubanks, D. L., Bedell, K. E., & Murphy, S. T. (2007). Developing leaders for creative efforts : A domain-based approach to leadership development. Human Resource Management Review, 17, 402 - 417.
Mumford, M., Marks, M., Connelly, M., Zaccaro, S. J., & Reiter-Palmon, R. (2000). Development of leadership skills: Experience and timing. Leadership Quarterly, 11(1), 87-114.
238
Mumford, M., Zaccaro, S. J., Harding, F., Jacobs, T., & Fleishman, E. (2000). Leadership skills for a changing world: Solving complex social problems. Leadership Quarterly, 11(1), 11-35.
Mumford, T., Campion, M., & Morgeson, F. (2007). The leadership skills strataplex: Leadership skill requirements across organizational levels. Leadership Quarterly, 18(2), 154-166.
Nagoshi, C. T. (1999). Perceived control of drinking and other predictors of alcohol use and problems in a college student sample. Addiction Research & Theory, 7(4), 291–306.
Neck, C. P., & Houghton, J. D. (2006). Two decades of self-leadership theory and research: Past developments, present trends, and future possibilities. Journal of Managerial Psychology, 21(4), 270-295.
Nenniger, P. (2005). Commentary on self-regulation in the classroom: A perspective on assessment and intervention. Applied Psychology: An International Review, 54(2), 239-244.
Noe, R. A., & Wilk, S. L. (1993). Investigation of the factors that influence employeesʼ participation in development activities. Journal of Applied Psychology, 78(2), 291-302.
Northouse, P. G. (2007). Leadership: Theory and practice (4th ed.). Thousand Oaks, CA: SAGE publications.
Nunally, J. (1978). Psychometric theory. New York: McGraw-Hill.
Oettingen, G., Hönig, G., & Gollwitzer, P. (2000). Effective self-regulation of goal attainment. International Journal of Educational, 33(7-8), 705-732.
Ohlott, P. J. (2004). Job assignments. In C. D. Mccauley & E. Van Velsor (Eds.), The Center for Creative Leadership handbook of leadership development (2nd ed., p. 151–182). San Francisco: Wiley.
Oliver, P. (2003). The studentʼs guide to research ethics. Glasgow: Open University Press.
Olivero, G., Bane, K. D., & Kopelman, R. E. (1997). Executive coaching as a transfer of training tool: Effects on productivity in a public agency. Public Personnel Management, 26(4), 461-469.
Orenstein, R. L. (2002). Executive coaching: Itʼs not just about the executive. The Journal of Applied Behavioral Science, 38(3), 355-374.
239
Orvis, K. A., & Ratwani, K. L. (2010). Leader self-development: A contemporary context for leader development evaluation. Leadership Quarterly, 21(4), 657-674.
Owen, J. (2009). How to lead: What you actually need to do to manage, lead and succeed. Harlow: Pearson Education Limited.
Pagano, R. (1994). Understanding statistics in the behavioral sciences. USA: West publishing company.
Paris, S., & Paris, A. (2001). Classroom applications of research on self-regulated learning. Educational Psychologist, 36(2), 89-101.
Perels, F., Gurtler, T., & Schmitz, B. (2005). Training of self-regulatory and problem-solving competence. Learning and Instruction, 15(2), 123-139.
Pernick, R. (2001). Creating a leadership development program: Nine essential tasks. Public Personnel Psychology, 30(4), 429-445.
Peterson, D. B. (1996). Executive coaching at work: The art of one-on-one change. Consulting Psychology Journal: Practice and Research, 48(2), 78-86.
Phillips, J. S., & Lord, R. G. (1981). Causal attributions and perceptions of leadership. Organizational Behavior and Human Performance, 28, 143–163.
Pittenger, K. K. S., & Heimann, B. A. (2000). Building effective mentoring relationships. Review of Business, 21(1/2), 38-43.
Podsakoff, P. M., MacKenzie, S. B., Lee, J., & Podsakoff, N. P. (2003). Common method biases in behavioral research: A critical review of the literature and recommended remedies. Journal of Applied Psychology, 88(5), 879-903. doi: 10.1037/0021-9010.88.5.879.
Poston, S., Manning, S., & Barrow, S. (2001). Do you need an executive coach? American Gas, 8, 15-18.
Prewitt, V. (2003). Leadership development for learning organizations. Leadership & Organization Development Journal, 24(2), 58-61.
Rapp, T. L., & Mathieu, J. E. (2007). Evaluating an Individually Self-Administered Generic Teamwork Skills Training Program Across Time and Levels. Small Group Research, 38(4), 532-555.
240
Reichard, R. J., & Avolio, B. J. (2005). Where are we? The status of leadership intervention research: A metaanalytic summary. In W. L. Gardner, B. J. Avolio, & F. OWalumbwa (Eds.), In Authentic Leadership and Practice: Origins, Effects, and Development (p. 203–226). Oxford, UK: Elsevier.
Reichard, R. J., & Johnson, S. K. (2011). Leader self-development as organizational strategy. Leadership Quarterly, 22(1), 33-42.
Renault annual report. (2009). Renault Group.
Revans, R. W. (1980). Action learning. London: Blond & Briggs.
Rhinesmith, S. H. (1996). A manager’s guide to globalization: Six skills for success in a changing world (2nd ed.). New York: McGraw-Hill.
Richard, J. T. (2003). Ideas on fostering creative problem solving in executive coaching. Consulting Psychology Journal: Practice and Research, 55(4), 249-256.
Richardson, J. T. E. (1996). Handbook of qualitative research methods for psychology and the social sciences. Leicester: BPS Books.
Riggio, R. E. (2008). Leadership development: The current state and future expectations. Consulting Psychology Journal: Practice and Research, 60(4), 383-392.
Rost, J. C. (1993). Leadership for the twenty-first century. London: Praeger.
Rosti, R. T., & Shipper, F. (1998). A study of the impact of training in a management development program based on 360 feedback. Journal of Managerial Psychology, 13(1), 77-89.
Roux, I., & Steyn, B. (2007). Experiential learning and critical reflection as a tool for transfer of business knowledge: An empirical case study of a start-up simulation intervention for nascent entrepreneurs. SAJEMS NS, 10(3), 330-347.
Rush, M. C., Thomas, J. C., & Lord, R. G. (1977). Implicit leadership theory: A potential threat to the internal validity of leader behaviors. Organizational Behavior and Human Performance, 20, 93–110.
Saporito, T. J. (1996). Business-linked executive development: Coaching senior executives. Consulting Psychology Journal: Practice and Research, 48(2), 96-103.
Saunders, M., Lewis, P., & Thornhill, A. (2000). Research methods for business students (2nd ed.). England: Prentice Hall.
241
Savage, C. M. (2001). Executive coaching: Professional self-care for nursing leaders. Nursing Economics, 4, 178-182.
Schlosser, B., Steinbrenner, D., Kumata, E., & Hunt, J. (2006). The coaching impact study: Measuring the value of executive coaching. International Journal of Coaching in Organizations, 4(3), 8-26.
Scholl, R., & Zimmerman, B. J. (2001). Self-regulation training enhances dietary self-efficacy and dietary fiber consumption. RESEARCH, 101(9), 1006-1011.
Schumacker, R. E., & Lomax, R. G. (2004). A beginnerʼs guide to structural equation modeling (2nd ed.). Mahwah, New Jersey: Lawerence Earlbaum Associates.
Schwarz, N. (1999). How the questions shape the answers. American Psychologist, 54(2), 93-106.
Seifert, C. F., & Yukl, G. A. (2010). Effects of repeated multi-source feedback on the influence behavior and effectiveness of managers: A field experiment. Leadership Quarterly, 21(5), 856-866.
Seifert, C. F., Yukl, G. A., & McDonald, R. A. (2003). Effects of multisource feedback and a feedback facilitator on the influence behavior of managers toward subordinates. Journal of Applied Psychology, 88(3), 561-569.
Shadish, W., Cook, T., & Campbell, D. (2002). Experimental and quasi-experimental designs for generalized causal inference (2nd ed.). Berkeley: Houghton Mifflin Company.
Shamir, B., House, R., & Arthur, M. B. (1993). The motivational effects of charismatic leadership: A self-concept based theory. Organization Science, 4(4), 577-594.
Shea, C., & Howell, J. (1999). Charismatic leadership and task feedback: A laboratory study of their effects on self-efficacy and task performance. Leadership Quarterly, 10(3), 375-396.
Shebaya, M. (2010). Leadership development: How can developmental readiness explain and influence outcomes? Academy of Management Annual Conference (pp. 1-33). Montreal, Canada.
Sherin, J., & Caiger, L. (2004). Rational-emotive behavior therapy: A behavioral change model for executive coaching? Consulting Psychology Journal: Practice and Research, 56(4), 225-233.
242
Shippmann, J. S., Ash, R. A., Batjtsta, M., Carr, L., Eyde, L. D., Hesketh, B., et al. (2000). The practice of competency modeling. Personnel Psychology, 53(3), 703-740.
Skipton Leonard, H., & Lang, F. (2010). Leadership development via action learning. Advances in Developing Human Resources, 12(2), 225-240.
Smith, A. (1996). Evolving issues for qualitative psychology. In J. T. E. Richardson (Ed.), Handbook of qualitative research methods for psychology and the social sciences (pp. 289-202). Leicester: BPS Books.
Smith, J., & Foti, R. J. (1998). A pattern approach to the study of leader emergence. Leadership Quarterly, 9(2), 147-160.
Smith, L. (1993). The executiveʼs new coach: Believe it or not , he (or often she) can help cure those little behavioral defects you suffer from and make you a better manager. Smart companies pay the bill gladly. Fortune, 126-134.
Smither, J. W., London, M., Flautt, R., Vargas, Y., & Kucine, I. (2003). Can working with an executive coach improve multisource feedback ratings over time? A quasi-experimental field study. Personnel Psychology, 56(1), 23–44. John Wiley & Sons.
Smither, J. W., London, M., & Reilly, R. R. (2005). Does performance improve following multisource feedback? A theoretical model, meta-analysis, and review of empirical findings. Personnel Psychology, 58(1), 33-66.
Sobel, M. E. (1982). Asymptotic confidence intervals for indirect effects in structural equation models. In S. Leinhart (Ed.), Sociological methodology (p. 290–312). San Francisco: Jossey-Bass.
Solansky, S. T. (2010). The evaluation of two key leadership development program components: Leadership skills assessment and leadership mentoring. Leadership Quarterly, 21(4), 675-681.
Sosik, J. J. (2001). Self-other agreement on charismatic leadership: Relationships with work attitudes and managerial performance. Group & Organization Management, 26(4), 484-511.
Sosik, J. J., & Megerian, L. E. (1999). Understanding leader emotional intelligence and performance: The role of self-other agreement on transformational leadership perceptions. Group & Organization Management, 24(3), 367-390.
Sosik, J. J., Potosky, D., & Jung, D. I. (2002). Adaptive self-regulation: Meeting othersʼ expectations of leadership and performance. Journal of Social Psychology, 142(2), 211-32.
243
Sperry, L. (1997). Leadership dynamics: Character and character structure in executives. Consulting Psychology Journal: Practice and Research, 49(4), 268-280.
Srinivas, K. M. (1995). Globalization of business and the Third World Challenge of expanding the mindsets. Journal of Management Development, 14(3), 26-49.
Stam, D., Knippenberg, D. van, & Wisse, B. (2010). Focusing on followers: The role of regulatory focus and possible selves in visionary leadership. Leadership Quarterly, 21(3), 457-468.
Stevens, J. (2002). Applied multivariate statistics for the social sciences (4th ed.). Mahwah, New Jersey: Lawerence Earlbaum Associates.
Stogdill, R. M. (1948). Personal factors associated with leadership: A survey of the literature. The Journal of Psychology, 25, 35-71.
Streufert, S., & Nogami, G. (1989). Cognitive style and complexity: Implications for I/O psychology. In C. L. Cooper & I. Robertson (Eds.), International review of industrial and organizational psychology (pp. 93-143). England: Wiley.
Streufert, S., & Swezey, R. W. (1986). Complexity, managers and organizations. Orlando: Academic Press.
Sue-Chan, C., & Latham, G. P. (2004). The relative effectiveness of external, peer, and self-coaches. Applied Psychology: An International Review, 53(2), 260-278.
Tai, W. T. (2006). Effects of training framing, general self-efficacy and training motivation on traineesʼ training effectiveness. Personnel Review, 35(1), 51-65.
Tapsell, S. (1999). With a little help from my friend. New Zealand Management, 46(2), 45-48.
Tesluk, P E, & Jacobs, R. R. (1998). Toward an Integrated Model of Work Experience. Personnel Psychology, 51(2), 321-355.
Thach, E. C. (2002). The impact of executive coaching and 360 feedback on leadership effectiveness. Leadership & Organization Development Journal, 23(4), 205-214.
Tharenou, P. (2001). The relationship of training motivation to participation in training and development. Journal of Occupational and Organizational Psychology, 74(5), 599-621. doi: 10.1348/096317901167541.
Thomas, A. (2002). Seeking direction. Personnel Today, June(1), 22-23.
244
Ting, S., & Hart, E. W. (2004). Formal coaching. In C. D. Mccauley & E. Van Velsor (Eds.), The Center for Creative Leadership handbook of leadership development (pp. 116-150). San Francisco: John Wiley & Sons.
Tobias, L. L. (1996). Coaching executives. Consulting Psychology Journal: Practice and Research, 48(2), 87-95.
Top 10 best companies for leadership. (2010). Popular Something. Retrieved February 21, 2010, from http://www.popularsomething.com/2010/02/top-10-best-companies-for-leadership.html.
Tornow, W. W., & London, M. (1998). Maximizing the value of 360-degree feedback. San Francisco: Jossey-Bass.
Tracey, C., & Nicholl, H. (2007). The multifaceted influence of gender in career progress in nursing. Journal of Nursing Management, 15(7), 677-82.
Tracey, J. B., Tannenbaum, S., & Kavanagh, M. J. (1995). Applying trained skills on the job: The importance of the work environment. Journal of Applied Psychology, 80(2), 239-252.
Tsai, W., & Ghoshal, S. (1998). Social capital and value creation: The role of intrafirm networks. Academy of Management Journal, 41(4), 464-477.
Tsui, A. S., & Ashford, S. J. (1994). Adaptive self-regulation: A process view of managerial effectiveness. Journal of Management, 20(1), 93–121.
Ulrich, D., Brockbank, W., Yeung, A. K., & Lake, D. G. (1995). Human resource competencies: An empirical assessment. Human Resource Management, 34(4), 473-495.
Van Velsor, E., Taylor, S., & Leslie, Jean B. (1993). An examination of the relationships among self-perception accuracy, self-awareness, gender, and leader effectiveness. Human Resource Management, 32(2-3), 249-263.
Vancouver, J. B., & Day, D. (2005). Industrial and organisation research on self-regulation: From constructs to applications. Applied Psychology: An International Review, 54(2), 155-185.
Vancouver, J. B., More, K. M., & Yoder, R. J. (2008). Self-efficacy and resource allocation: Support for a nonmonotonic, discontinuous model. Journal of Applied Psychology, 93(1), 35-47.
Velsor, E. V., & Leslie, J. B. (1995). Why executives derail: Perspectives across time and cultures. Academy of Management Executive, 9(4), 62-72.
Vroom, V. H., & Yetton, P. W. (1973). Leadership and decision-making. New York: John Wiley & Sons.
Waldman, D. A., Javidan, M., & Varella, P. (2004). Charismatic leadership at the strategic level: A new application of upper echelons theory. Leadership Quarterly, 15(3), 355-380.
Walker, A. G., Smither, J. W., Atwater, L. E., Dominick, P. G., Brett, J. F., & Reilly, R. R. (2010). Personality and multisource feedback improvement: A longitudinal investigation. Institute of Behavioral and Applied Management, 175-204.
Wasylyshyn, K. M. (2003). Executive coaching: An outcome study. Consulting Psychology Journal: Practice and Research, 55(2), 94-106.
Wasylyshyn, K. M. (2008). Behind the door: Keeping business leaders focused on how they lead. Consulting Psychology Journal: Practice and Research, 60(4), 314-330.
Wechsler, H., Dowdall, G. W., Davenport, A., & Rimm, E. B. (1995). A gender-specific measure of binge drinking among college students. American Journal of Public Health, 85(7), 982-985.
Weick, K. E. (1995). What theory is not, theorizing is. Administrative Science Quarterly, 40(3), 385–390.
Wells, S. J. (2003). Who’s next? HRMagazine, 44-50.
Wexley, K. N., & Baldwin, T. T. (1986). Management development. Journal of Management, 12(2), 277-294.
Wills, T. A., & Stoolmiller, M. (2002). The role of self-control in early escalation of substance use: A time-varying analysis. Journal of Consulting and Clinical Psychology, 70(4), 986-997.
Winum, P. C. (2006). Effectiveness of a high-potential African American executive: The anatomy of a coaching engagement. Consulting Psychology Journal: Practice and Research, 57(1), 71–89.
Witherspoon, R., & White, R. P. (1996). Executive coaching: A continuum of roles. Consulting Psychology Journal: Practice and Research, 48(2), 124-133.
246
Wohlers, A. I., & London, M. (1989). Ratings of managerial characteristics: Evaluation difficulty, co-worker agreement, and self-awareness. Personnel Psychology, 42(2), 235-261.
Yost, P. R., & Plunkett, M. M. (2002). Turn business strategy into leadership development. Training and Development, 56(3), 49-51.
Yukl, G. A. (1989). Managerial leadership: A review of theory and research. Journal of Management, 15(2), 251-289.
Yukl, G. A. (1998). Leadership in organizations (4th ed.). London: Prentice Hall.
Yukl, G. A. (2005). Leadership in organizations (6th ed.). London: Prentice Hall.
Yzerbyt, V. Y., Muller, D., & Judd, C. (2004). Adjusting researchersʼs approach to adjustment: On the use of covariates when testing interactions. Journal of Experimental Social, 40(3), 424-431.
Zaccaro, S. J., & Banks, D. (2004). Leader visioning and adaptability: Bridging the gap between research and practice on developing the ability to manage change. Human Resource Management, 43(4), 367-380.
Zaccaro, S. J., Foti, R. J., & Kenny, D. (1991). Self-monitoring and trait-based variance in leadership: An investigation of leader flexibility across multiple group situations. Journal of Applied Psychology, 76(2), 308-315.
Zaccaro, S. J., & Horn, Z. (2003). Leadership theory and practice: Fostering an effective symbiosis. Leadership Quarterly, 14(6), 769-806.
Zaccaro, S. J., Mumford, M., Connelly, M., Marks, M., & Gilbert, J. A. (2000). Assessment of leader problem-solving capabilities. Leadership Quarterly, 11(1), 37–64.
Zeller, R. A., & Carmines, E. G. (1979). Reliability and validity assessment. Newbury Park, CA: Sage.
Zenger, J. H., & Folkman, J. (2002). The extraordinary leader: Turning good managers into great leaders. New York: McGraw-Hill.
Zimmerman, B. J. (2000). Self-regulatory cycles of learning. In G. A. Straka (Ed.), Conceptions of self-directed learning (pp. 221-234). Muster, Germany: Waxmann.
Zimmerman, B. J., & Bandura, A. (1994). Impact of self-regulatory influences on writing course attainment. American Educational Research Journal, 31(4), 845-863. Sage Publications.
247
Appendix I Pilot questionnaire
248
249
Appendix II Frequency analysis results from pilot study
0
10
20
30
40
50
60
70
Freq
uencies in percentages (%
)
Leader competencies
250
Appendix III Leader questionnaire
251
252
253
254
255
256
Appendix IV Follower questionnaire
257
258
259
260
261
262
Appendix V Tutor questionnaire
263
264
265
266
267
Appendix VI Intervention invitation email
268
269
Appendix VII Sample of 360-degree feedback report for leaders
270
271
272
273
Appendix VIII Intervention invitation email (post-study)