JoumalofPhilippineDevelopment Number38,Volume XXI,Nos.1 &2, First&SecondSemesters1994 TARGETING TRANSFERS TO THE POOR: THE CASE OF FOOD SUBSIDIES" Arsenio M. Balisacan INTRODUCTION Providing safety nets to the poor is a popular call in development policy discussions. The provision is viewed to be even more critical for developing countries pursuing structural and macroeconomic adjustment reforms aimed at bringing an economy to a stable and sustainable growth path. Such reforms often accompany changes which have disruptive effects on the poor's welfare such as sharp increases in the prices of goods and basic services. For instance, when an exchange rate realignment in the form of devaluation is resorted to in an effort to alter the pattern of domestic spending and restore the competitiveness of the country's exports, food subsidies are the common safety nets suggested to minimize the short-run effects of the adjustment on the poor. A tight budgetary constraint, however, does not permit a generous amount for food subsidies. Two issues stand out: How much of the limited budget should be allocated for food subsidies? Given this amount, how can food subsidies be designed in such a way that a maximum reduction in aggregate poverty is achieved? Put differently, what is the optimal pattern •Thispaperdrawslargelyfromareportpreparedby theauthorforthe AgribusinessSystem AssistanceProgram(ASAP)supportedby the UnitedStates Agencyfor International Development (USAID).Theopinionsexpressedhereinarethoseofthe author and do not necessarilyreflecttheviewsof USAIDor ASAP.
Providing safety nets to the poor is a popular call in development policydiscussions. The provision is viewed to be even more critical for developing
countries pursuing structural and macroeconomic adjustment reforms
aimed at bringing an economy to a stable and sustainable growth path. Such
reforms often accompany changes which have disruptive effects on the
poor's welfare such as sharp increases in the prices of goods and basic
services. For instance, when an exchange rate realignment in the form ofdevaluation is resorted to in an effort to alter the pattern of domestic
spending and restore the competitiveness of the country's exports, food
subsidies are the common safety nets suggested to minimize the short-run
effects of the adjustment on the poor.
A tight budgetary constraint, however, does not permit a generousamount for food subsidies. Two issues stand out: How much of the limited
budget should be allocated for food subsidies? Given this amount, how can
food subsidies be designed in such a way that a maximum reduction in
aggregate poverty is achieved? Put differently, what is the optimal pattern
•Thispaperdrawslargelyfroma reportpreparedby theauthorfortheAgribusinessSystemAssistanceProgram(ASAP)supportedby the UnitedStatesAgencyfor InternationalDevelopment(USAID).The opinionsexpressedhereinarethoseofthe authorand do notnecessarilyreflecttheviewsof USAIDorASAP.
180 JOURNAL OF PHILIPPINE DEVELOPMENT
of food subsidies when the objective is poverty minimization? If the poor
can be identified costlessly, "leakages" of subsidies to the nonpoor are
minimal, and hence poverty alleviation is achieved at least cost. In practice,
the identification of the poor is not cheap: the administrative costs involved
in periodically getting information from hundreds of thousands, if notmillions, of households are potentially enormous. This paper shows howthese costs and other considerations affect the optimal pattern and design
of poverty-focused food subsidies.Food subsidy programs may have other objectives apart from directly
providing income transfers to the poor. Such objectives may include foodprice stabilization in the context of a sharp fluctuation in international prices
and domestic supply shocks, the provision of benefits to politically vocal
interest groups (e.g., the urban working class), and an improvement in thenutritional status of the population. An evaluation of the relative efficiency
of alternative policy instruments in achieving these multiple objectives is
desirable, but this necessarily makes the analysis much more complex thanthe one being pursued here. It bears noting, however, that food price subsidy
programs in the Philippines have beenjustified primarily in terms of poverty
alleviation objectives, at least as gleaned from official policy statements
(Balisacan et al. 1993). Moreover, since the recent policy discussion regard-
ing macroeconomic adjustment reforms, including exchange rate realign-ment, recognized the need to cushion the short-term impact of these policies
on the poor, especially on their food consumption, the design of a food
subsidy program is certainly worth (re)examining.
DEFINING AND QUANTIFYING POVERTY
Assessing the impact of income transfers on poverty requires the proper
identification of the poor as well as the aggregation of data on the poor into
a single measure of poverty. These requirements have been widely dis-cussed in the literature; no attempt is made to repeat the discussion here.I
I. For an excellent introduction to poverty and measurement, see Ravallion (1992).
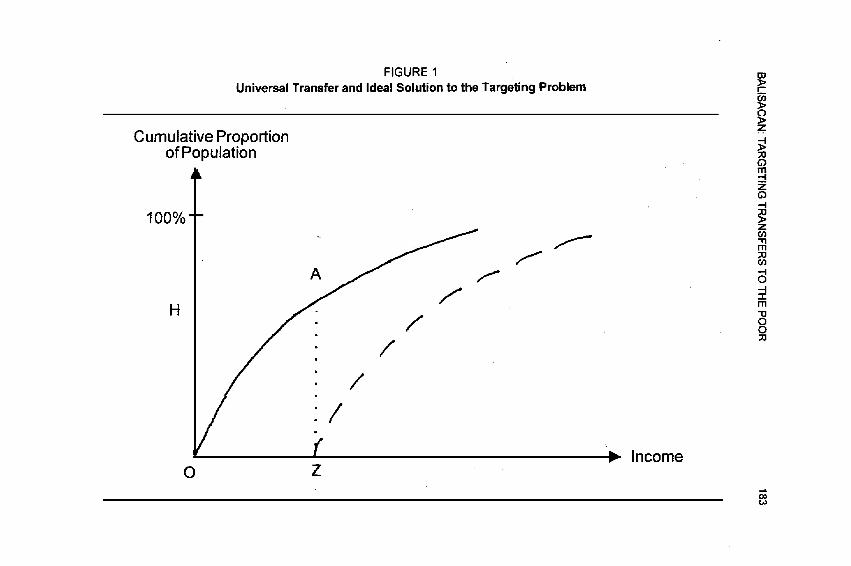
FIGURE 1 gO
Universal Transfer and Ideal Solution to the Targeting Problem
Z
Cumulative Proportion _>ofPopulation _0c)m.-I
G3--I
lOO%ZtJ)
m
A _ _0f _Im
'13
H f o0
/
/
( P, Income0 Z
,oo
184 JOURNALOF PHILIPPINEDEVELOPMENT
the population size times the poverty line. In imposing a balanced budget,
the higher outlay suggests that the tax rate of the nonpoor under this scheme
will be greater than that under the ideal solution.Universal subsidy is thus a costly scheme precisely because of the
leakage of subsidies to the nonpoor as well as the excess in the amounts
required to alleviate if not eliminate the income shortfalls of the not-so-poor.
Acquiring information about the potential beneficiaries' eligibility to sub-sidies reduces the leakage and, hence, the required outlay. But as more
information is acquired to improve the fineness of targeting (i.e., to further
reduce leakage), the administrative cost of targeting is likely to rise. Forexample, the administrative cost of targeting subsidies by area of residence
may be relatively low, but leakages of the benefits to the nonpoor in the
targeted area may still be considerable. The acquisition of other household
welfare indicators (e.g., level and sources of income of household members)
will reduce the leakage but only at the expense of rising administrative costs.
This suggests that an optimal solution to the targeting problem is likelysomewhere between the ideal solution and the universal scheme.
The targeting problem is illustrated in Figure 2. The line E traces thecombination of the number of targeting indicators employed in identifying
the potential beneficiaries and the remaining external (or social) cost of
poverty, given the povertyalleviation budget. Its vertical intercept B is theremaining social cost if the budget is allocated universally, i.e., no targeting
indicator is employed. The cost falls as the number of targeting indicators,rn, increases, possibly reaching zero as m becomes very large. If poverty is
measured in terms of the poverty gap index, then E is simply the sum of the
income shortfalls of the poor. The line A, on the other hand, is the admin-
istrative cost of targeting; this cost rises with the number of targeting
indicators employed. The problem is how to choose m so that the sum of A
and E, given by the line C, is minimized. Clearly, the optimal solution is
m*, determined by the equality of the (absolute) slopes of the A and E lines.This solution also suggests that it is never optimal to completely eliminate
poverty through targeting considering the administrative costs involved.
FIGURE 2
Optimal Targeting
_>c)_>z
Cost 73O
-t
z
'11rrlJo
B _ C O
-1-m"oOO73
E• m
m*
186 JOURNAL OF PHILIPPINEDEVELOPMENT
TARGETING SUBSIDIES
BASED ON EASILY OBSERVABLE CHARACTERISTICS
Given limited information about individual incomes and responses, food
subsidies can be given using categorical targeting, meaning subsidiesare
targeted based on easily observable household characteristics, such as place
of residence or age of household head. One such scheme uses ration shopsfor food, whereby a certain amount of food is made available to a certain
location at a below-market price. If resale cannot be prevented, then all
purchasers of this shop, in effect, receive a lump-sum income transfer equalto the ration quantity times the difference between the market price and the
ration price. Thus, if the patrons of ration shops are, on average, the socially
deserving ones, the Scheme serves as a targeted transfer program. The
benefits of the program are maximized if ration shops are located in areas
or regions where the incidence of poverty is greatest. In contrast to transfer
programs that depend on information such as the applicants' incomes and
expenditures, the administrative cost under this scheme need not be high.Kanbur (1987) discusses a targeting rule for a case where the policy
instrument is a set of lump-sum transfers differentiated by certain easily
observable characteristics. The problem is to target these transfers to
(mutually exclusive) population groups so as to minimize aggregate ex-
pected poverty, as measured by a suitable index (in this Case, the class of
poverty measures discussed in the second section, p. 180). It turns out that
the budgetary rule is fairlY simple: if the objective of public policy is tominimize the distribution-sensitive measure, more of the transfers should
be directed towards groups for which the average poverty gap is greater. 3On the other hand, if the objective is to minimi.ze the poverty gap, the
head-count index is the appropriate indicator for budget allocation, with
maximum benefit directed to the group with the highest head-count index.
3. Thorbecke and Berrian (1992) provide a generalization of the Kanbur budgetary rule by
allowing both direct and indirect effects of an exogenously supplied budget on aggregatepoverty. The information required to implement the general rule is, however, much more
complex than the Kanbur rule.
BALISAGAN:TARGETINGTRANSFERSTO THEPOOR 187
TABLE 1
Priority Provinces for PovertyAlleviation
Head-count Poverty gap EGCDP
PriorityProvince Incidence Rank Incidence Rank provinces
Abra 91.66 1 43.60 3 *
Romblon 89.74 2 43,79 2 *
Ifugao 88,25 3 47.26 1 *
DavaoOriental 83.62 4 37,10 6
Camiguin 81.77 5 35.93 8
Zamboanga del Notre 80.63 6 35.91 9
Misamis Occidental 80.07 7 38.32 4
Agusan del Sur 79.70 8 36,99 7 *
Bohol 78.26 9 33.77 10
Quirino 78.09 10 31.33 14
Masbate 77.66 11 37.64 5 *
Capiz 77.49 12 29.57 16
North Cotabato 77,40 13 32.14 11
Palawan 77.02 14 29,27 17
Marinduque 76,30 15 27.36 22
Sorsogon 75.12 16 26.17 24
Antique 74,23 17 31.64 12 *,
Northern Samar 73,66 18 22,89 41
Oriental Mindoro 73,47 19 29.14 18
Samar (Western) 73.26 20 26.94 23
Bukidnon 72,46 21 31.61 13
Albay 72.39 22 28,12 19
Basilan 71.06 23 23,57 38 *
Sulu 70.74 24 21.49 44 *
Surigao del Norte 70,05 25 24.91 29
Kalinga Apayao 70,04 26 25.88 26 *
188 JOURNAL OF PHILIPPINE DEVELOPMENT
TABLE 1 (continued)
Head-count Poverty gap EGCDP
PriorityProvince Incidence Rank Incidence Rank provinces
Surigao del Sur 68.56 27 25.34 27 *
Negros Oriental 68.40 29 27.82 20
Lanao del Norte 65.67 35 25.95 25
Agusan del Norte 64.51 37 27.60 21
Siquijor 64.49 38 29,68 15
Aurora 60.23 44 19,81 49 *
Eastern Samar 59,16 47 24.66 30 *
Mt. Province 56.67 50 17,81 57 *
Southern Leyte 55.68 53 14.68 64 *
Benguet 52,79 60 15.02 63 *
Batanes 40.86 67 11.16 66 *
Tawi-tawi a 77 77 *
Biliran - *
Guimaras - *
aEstimates not reported due to data discrepancy.
Source: National Statistics Office. Family Income and Expenditures Sun/ey _991.
BALISACAN: TARGETING TRANSFERS TO THE POOR 189I.
Table i shows the top 25 "most depressed" provinces (out of 76) based
on the poverty gap and head-count indices. The resulting lists of most
depressed provinces are not identical for the two rankings. Four of the 25
"most depressed" provinces based on the poverty gap index are not classi-fied as such under the head-count index. Moreover, the ranking of the
provinces varies substantially for the two indices. Abra, for example, is themost depressed province if the ranking is based on the head-count index,
but Ifugao acquires this label if such ranking is based on the poverty gapindex. Put differently, Abra gets the highest priority for the poverty allevia-
tion budget if the objective of public policy is to obtain from the (limited)
budget the highest reduction of the aggregate poverty gap index. If the
objective is to minimize the distribution-sensitive measure, then lfugao gets
the highest priority.The last column of Table 1 fists the 19 provinces recently identified by
the Ramos administration as priority areas under the Employment Genera-
tion Through Countryside Development Program (EGCDP). This program
is a pump-priming activity aimed at stimulating employment, increasing
production, and generating.domestic capital and consumption. It is set to
run for three years and estimated to cost approximately P23 billion. Out of
the 19 provinces, only eight belong to the top 25 most depressed provincesidentified using the two poverty-based ranking approaches. Even more
noteworthy is that five of the provinces (excluding Tawi-Tawi) included in
EGCDP are among those with the lowest poverty in the country.
it is useful to have a monetary measure of the gains from categorical
targeting. For this purpose, we specify the gains in terms of the additional
budgetary outlay required under a universal (untargeted) transfer scheme to
obtain the same aggregate poverty reduction as that achieved by categorical
targeting. 4 We assume that the objective of public policy is to minimize thedistribution-sensitive poverty index.
Figure 3 shows the monetary gains for the case of regional targeting,
i.e., the only household characteristic used in identifying the potential
4. For this purpose, we follow Ravallion's (1993) extension of the Kanbur approach.
FIGURE 3Monetary Gains of Targeting o
(in biltion pesos)
Gain
160
140 Gain120
100¢...
8O co• _
60 _0-'rl
40 .-7-m
2O _I m
0 N<
0 5 10 15 20 25 ,.-m0"0
TRANSFER _=mz--I
BALISACAN:TARGETING TRANSFERSTO THE POOR 191
beneficiaries of the subsidy is the region of residence. For the data used, the
gains from regional targeting are very large.For example, a budget of P2
billion, if properly targeted, will achieve the same poverty reduction as thatof P18 billion of untargeted transfers, or P16 billion of gain. Note that the
gains increase with the size of the budget but at a decreasing rate.
One can take further steps in improving the gains from categoricaltargeting. For example, in addition to region of residence, information on
province of residence of the household can be employed to refine the
targeting scheme. The addition of this information increases the monetarygains from targeting since, as shown in Table 1, substantial variation in
provincial poverty levels exists. This additional variable should shift up-
ward the targeting gain curve in Figure 3. Measuring this shift is an
interesting exercise, but is not pursued here. Even though the only informa-
tion employed is the household's region of residence, estimates of the gains
from targeting are relatively large.i
ADMINISTRATIVE COSTS OF FOOD SUBSIDY PROGRAMS
The administrative costs of a food subsidy program depend on the imple-
menting agency's administrative capability as well as on the type of admin-
istrative scheme employed in providing the subsidy. One widely employed
scheme requires the use of program personnel to screen each potentialbeneficiary on the basis of various criteria, such as household income or
nutritional status. This is referred to as means testing (alternatively referred
to in this paper as income testing). Another scheme relies upon individual
decision, leaving the choice to participate or not to the potential applicant. In
principle, the program is available to all, but is designed in such a way that
the nonpoor are discouraged from availing themselves of the subsidy. Thetime involved in acquiring the subsidy, the low quality of the food subsidized,
or the stigma attached to being dependent on a food subsidy program, are
some of the devices used to encourage this so-called self-targeting. In
between the two schemes are various types of categorical targeting mecha-nisms, such as the one discussed in the fourth section (p. 186). The central
192 JOURNAL OF PHILIPPINEDEVELOPMENT
feature of these schemes is that eligibility is granted to groups of potential
beneficiaries who share some easily identifiable characteristics.
Available estimates of the administrative costs of food subsidy pro-
grams are scanty. In the Philippines, the only careful analysis of these coststhat we are aware of is that on the Pilot Food Discount Program imple-
mented by the National Nutrition Council of the Department of Agriculture
in the early 1980s. This program covered three villages in each of the three
selected provinces (Abra, Antique, and Cotabato). Only villages where 25
percent of preschoolers had moderate or severe malnutrition, based on
weight for age, were included. All bonafide residents of the selected villages
were automatically eligible for a ration (discount) card which guaranteed a
monthly quota of rice and cooking oil at a subsidized price of 32 and 50
percent of the market price, respectively. The subsidized commodities wereelivered through existing retailers in program areas; in return for the
urden of seeking for reimbursement of discount value from participating
aral banks, retailers received an incentive of 3 percent of the gross sale ofle subsidized commodities.
The administrative overhead costs of this program covered part of the
alaries of the extension workers (who devoted 50 percent of their time to
_eprogram), travel costs for monitoring officers, salaries for central office
roject administration, printing costs for the discount cards, and the cost of_pplies. These costs amounted to 9.4 percent of the program cost; retailers'icentives accounted for another 7.2 percent (Garcia and Pinstrup-Andersen
987: 71). Note that these estimates pertain to a pilot program. It is likely
lat in a nationai program, severa ! layers of supervisory infrastructure, from_ecentral office to the region, province, and villages, would be necessary,
tereby raising further the administrative costs.
Comparative cost estimates based on the experiences of other countries
_uldprovide some indications of the relative administrative cost advantage
a targeted subsidy program. Moreover, intercountry comparison ofcperiences, while not exhaustive, provides an international perspective on
,e administrative cost of food-subsidy targeting in the Philippines. The
)mparison is, of course, a potentially hazardous exercise since different
BALISACAN:TARGETINGTRANSFERSTO THE POOR 193
countries have different administrative capacities, political and social insti-
tutions, and objectives in providing assistance to certain population groups.Nonetheless, in the absence of administrative cost estimates of delivering
food assistance to the poor in the Philippines apart from the aforementioned
pilot program, the comparison provides a better informed basis for the
estimation of the likely gains from targeting food subsidy to certain popu-
lation groups.
In Latin American countries, for programs making use of individual
assessment (including income testing), total administrative cost as a pro-portion of total program cost ranged from 0.4 to 29 percent (Grosh 1993).In the case of geographic targeting, the range was from 4 to 16 percent. For
self-targeting mechanisms, the range was from 3 to 10 percent. The medianfor these countries was 9 percent for individual assessment schemes, 7
percent for geographic targeting, and 6 percent for self-targeted schemes.The Mexican milk subsidy program aimed at the urban poor was
means-tested. Using complex administrative procedures. Targeting indica-
tors were income and the presence of children under twelve years old or of
pregnant women in the household. The program had an administrative costof 26 percent of total program cost (Kennedy 1988: 150).
Entitlement to the Sri Lankan food stamp program in the 1980s was
means-tested. Stamps were issued to households based on income andnumber of children. Prior to this, Sri Lanka had a universal rice, wheat and
sugar subsidy. The administrative costs of the food stamp program were
estimated to be only 2 percent of the program cost (Cornia and Stewart
1993). A major factor that contributed to the low cost was the implementing
agencies' high administrative competence partly made possible by the
country's relatively long experience with food subsidy programs.The means-tested Jamaican food stamp program in the 1980s had an
administrative cost of about 4 percent of total costs (Cornia and Stewart
1993). Another estimate put the administrative cost at around 10 percent of
program cost (Grosh 1993).
In seven UK programs, administrative cost was about 3.5 percent of
program cost for universal programs, but between 5 percent and 15 percent
"194 JOURNALOF PHILIPPINEDEVELOPMENT
for means-tested programs. In the US, administrative cost represented about
2.5 percent for universal programs and 12 percent for means-tested pro-
grams (Comia and Stewart 1993). In one extreme case, a targeted US
veterans' program had an administrative cost amounting to 95 percent ofthe benefits transferred (World Bank 1988).
Based on this (limited) evidence, the administrative cost of a targeted
food subsidy program is greater than that of a universal (general) program.
It also appears that the administrative cost of the pilot food subsidy programin the Philippines was high by international standards, but not so much
higher. A similar program implemented nationwide is, however, likely to
require much higher administrative costs. Based on Other countries' expe-
riences, it is reasonable to assume that a national poverty-focused food
subsidy program employing categorical targeting schemes would have an
administrative cost of anywhere from 10 to 30 percent of total programcosts.
It would require extremely large• administrative costs to outweigh the
monetary gains from categorical targeting of infra-marginal income transfer
programs, at least in the case of the Philippines. Take, for instance, the upperlimit of the range of administrative costs given earlier, i.e., 30 percent of
total •program costs (administrative plus transfer costs). This translates to
about 43 percent of the total amount of budgetary transfer. This costschedule is depicted as 1AC1 in Figure 4 which also shows the incremental
monetary gain of a regional targeting scheme. Clearly, in this case, the
incremental gains of regional targetingare exceeded by increases in admin-
istrative costs only if the total amount of budgetary transfers exceeds P48
billion. The optimal budgetary transfer corresponds to about 6 •percent ofpretransfer total expenditures. Doubling the administrative cost of a targetedtransfer program m depicted by IAC2 m reduces but not eliminates the netgains from regionally differentiated transfers. In this case, the optimal
budgetary transfer is P43 billion. This amount is huge, representing about
19 percent of the national government budget in 1991. Other considerations,
left unspecified so far, are likely to work against a generous poverty
alleviation budget (seventh section, p. 204). •
FIGURE 4Incremental Gain and Administrative Cost of Targeting
(In billion pesos) >(3;>Z
18 tG >;0G')
16 - • _14 _--I
12 _
10'.-to
8 _:m"o
6 ooIAC_ :_
4
,0 I I J r I " B I =
0 5 10 15 20 25 30 35 40 45 50 55TRANSFER
IG - IncrementatGain
tAC - IncrementalAdministrativeCost ,_
196 JOURNALOF PHILIPPINE DEVELOPMENT
' THE CHOICE OF COMMODITY TO SUBSIDIZE
Thus far, the assumption has been that afixed quantity of food is provided
at below-market prices, lfresale of rations cannot be prevented, the subsidyis, therefore, equivalent to an income transfer to all those eligible for the
program. In many instances, however, food subsidy has been provided
through a reduction in the market price for every unit that is purchased. TheNational Food Authority's rice stock management-cum-monopoly of rice
trade has the effect of reducing the market price vis-_.-vis the world price.
In this case, the size of the income transfer to each person (or household)
depends on the quantity purchased. Thus, if the commodity is a normal good
(i.e., the household's demand for it rises with household income), the
subsidies received by the rich are greater than those received by the poor inabsolute terms. On the other hand, if the subsidized commodity is an inferior
good (i.e., household's demand for it falls with household income), moreof the benefits would accrue to the poor.
Kanbur and Besley (1988) have provided budgetary rules for the choice
of commodities to subsidize. For the simple case where the objective of
policy is to minimize poverty at the national level, the appropriate indicatoris simply the ratio of the quantity consumed by the poor to the total
consumption of the population. Food commodities that are ranked highestin the list based on this indicator should be prime candidates for price
subsidy. We will employ this indicator in examining the likely distributionalincidence of food price subsidies.
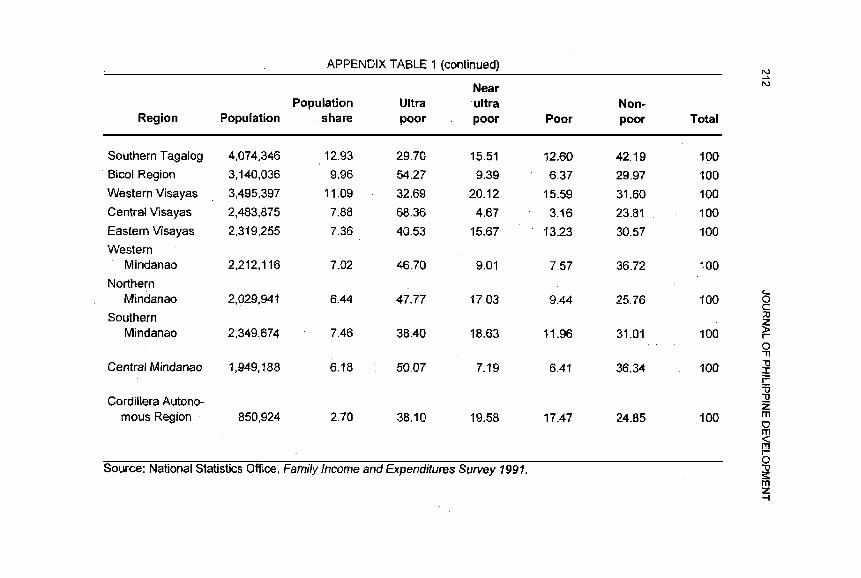
For our purposes, we characterize the poor according to the severity of
their poverty. Denote the food threshold and the poverty threshold set byNSCB-TWG on Poverty Determination as zl and z3, respectively. Also,
denote the average of zl and z3 as z2. On this basis, the "ultra poor" are
defined as those whose per capita expenditures fall short of zl. The "near
ultra poor" are those whose per capita expenditures are less than z2 but
greater than zl. The "marginal poor" are those having expenditures less
than the z3 but greater than z2. Finally, the "nonpoor" are those with a
standard of living greater than z3. Based on the 1991 FIES consumption
BALISACAN:TARGETINGTRANSFERSTO THE POOR 197
data, for the whole country, 32 percent of the population are ultra poor, 13
percent near ultra poor, 11 percent marginally poor, and 44 percent nonpoor.
The rice price subsidy has been justified on the ground of alleviating
poverty, but clearly, political economy considerations have likewise beena factor. The price of rice, the main staple of the bulk of the population, has
become a politically sensitive issue.
L Table 2 shows the respective shares of the four population groups intotal rice consumption. The consumption of the ultra poor represents barely
one-fourth of the national total, while that of the nonpoor comprises about
one-half (about two-thirds of which are by the urban nonpoor). The Con-
sumption shares of the near ultra poor and the marginal poor correspond to
about the same percentages as their respective shares in the total population.
Thus, if the objective is to reduce national poverty, then the rice price
subsidy is unlikely to do a good job because of the potentially high leakage
of the benefits to the nonpoor.
Table 3 shows similar calculations for corn, a staple food for a segment
of the population in the Visayas and Mindanao. Unlike in rice, the corn
consumption of the ultra poor--mostly from rural areas -represents 62
percent of the national consumption. The consumption of the near ultra poorcomprise 11 percent. The nonpoor's consumption represents only one-fifth
i of total consumption. Thus, on this basis, corn appears to be a goodcandidate for price subsidy. However, corn price subsidy as a vehicle for
poverty alleviation may not receive enough political support since corn isnot a staple food for most of the population.
There are limitations in using the "consumption by the poor" ratios
given in Tables 2 and 3 to assess the impact of a food price subsidy. First,
the assessment has to take account of possible changes in the commodity
mix of consumption as a result of relative price changes induced by the
subsidy. There are ample evidences showing that the poor are responsive
to changes in the relative food prices, even much more so than the nonpoor
(Alderman 1986). Second, as shown by Besley and Kanbur (1988), the
"consumption by the poor" ratios are strictly valid only if the poverty
198 JOURNALOFPHILIPPINEDEVELOPMENT
TABLE2Shares of the Poor in National RiceConsumption
alleviation objective is the minimization of aggregate poverty gap, and the
Engel curves for food show a significant nonlinearity.
In this paper, we employ a simple, yet flexible, model of consumer
demand system to further assess the probable impact 0f food price changes
on household welfare. The varied responses of the various income groups
of urban and rural households to price changes-based on estimates of
Balisacan (1994b) -are incorporated in the model. 5 For our purposes, we
have classified expenditures into five groups: rice, corn, other cereals, other
foods, and nonfood. Two simulations are performed: one for a 20 percent
decrease in the price of rice, and another for a similar decrease in the price
of corn. The changes in real income owing to the price change are aggre-
gated at the national level, and then the shares of the four population groups
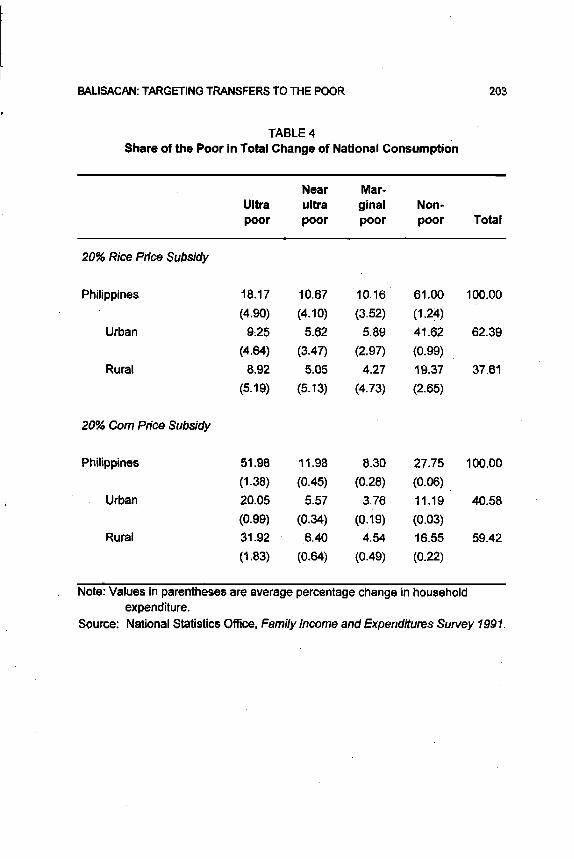
in the total Change are calculated. Theresults are summarized in Table 4.
In the case of the rice price subsidy, the share of the ultra poor in the
national increase in equivalent incomes is only about 20 percent, while that
of the nonpbor is about 60 percent. The 40 percent share of all the poorcombined is even lower than that indicated in Table 2. About two-fifths of
the increase in aggregate income is captured by the urban nonpoor. Clearly,
a rice price subsidy has substantial leakage to the nonpoor.
Note, however, that while the share of the ultra poor in the total increase
in aggregate income is much smaller than their share in population, theaverage percentage increase in their income level is higher than for the rest
of the population, as clearly indicated by the figures in parentheses in Table
4. This arises from the greater expenditure share of rice for the ultra poor
and from their greater responsiveness tO rice price changes.
The extent Of benefit leakage is less for the corn price subsidy. About
three-fourths of the aggregate increase in equivalent income accrues to the
poor, with the ultra poor benefiting the most. The rural ultra poor who
comprise,about 39 percent of the rural population, capture 38 percent of the
increase. Note also that, as in the rice price subsidy, the proportionatechanges in incomes are higher for the poor than for the nonpoor in bothurban and rural areas.
5. See Balisacan(1994b)for detailsof theestimation.
BALISACAN:TARGETINGTRANSFERSTOTHEPOOR 203
TABLE4Share of the Poor in Total Change of National Consumption
Near Mar-Ultra ultra ginal Non-poor poor poor poor Total
Source: NationalStatisticsOffice,Family/ncome and Expenditures Survey 1991.
204 JOURNAL OF PHILIPPINE DEVELOPMENT
OTHER CONSIDERATIONS IN ASSESSING THE BENEFITS
AND COSTS OF TARGETED FOOD SUBSIDY PROGRAMS
There are other considerations that may weaken the conclusion reached so
far about the monetary benefits of categorically targeted subsidy programs.
First, there is the possibility that, with the presence of the food subsidy,
recipients may not work so hard to earn income (wage), i.e., they may reducetheir labor supply. Under the standard theory of household utility maximi-
zation over leisure and commodities, a change in exogenous income or in
the prices of commodities affects the demand for leisure (i.e., labor alloca-
tion) as well as the choice of commodities. If there is a high marginal
propensity to demand leisure, work effort will fall with an increase inhousehold income. Thus, if the reduction in work effort is significant, the
net impact of a targeted food subsidy program on income-based povertyestimates may be quite different from that given earlier. The disincentive
effects are likely to be greater for subsidy programs which impose a
"benefit-reduction rate" on the level of work performed, i.e., the benefit
decreases when the income of the recipient increases.
No study has yet been made of how food-related income transfers have
affected the labor supply in the Philippines, and the same is true with other
developing countries. The only empirical analysis in this area is that by Sahnand Alderman (1993) for Sri Lanka. They found out that men receiving a
rice ration worked 2.4 and 2 fewer days per month in urban and rural areas,
respectively, while the comparable figures for women were 3 and 0.8. This
reduction in the level of work effort corresponded to about 50 percent of
the value of the subsidy for males, and around 40 percent for females.The reduction in net benefit of the subsidy program owing to the
disincentive effects on labor supply is not necessarily a loss in social
welfare. The available evidence in developing countries also indicates that
higher calorie intakes result in greater productivity (Gertler and Rahman
1993). Thus, to the extent that the food subsidy increases calorie intake, the
program has a positive productivity effect. Moreover, the reduction in work
effort may increase the time available for home production activities,
BALISACAN:TARGETINGTRANSFERSTO THE POOR 205
possibly raising home-produced consumption. Finally, to the extent that thehousehold's utility rises 'with the reduction in work effort, the reduction
represents, in a strict welfare sense, an increase in household welfare.
Nonwelfarist advocates of food subsidy programs are, of course, moreconcerned with the attainment of a certain level of food consumption (e.g.,to achieve nutritional goals) than with utility per se.
Another consideration in designing a food subsidy program is its
funding. It is unrealistic to assume that huge fiscal resources are available
for direct poverty intervention programs, especially during a period ofmacroeconomic adjustment. Program costs may worsen the government
budget deficit, which'may have been partly the raison d'etre for an adjust-
ment program. The foregoing estimates of the monetary gains from poverty-focused targeting schemes do not take into account the effects of the
program costs on macroeconomic aggregates, including exchange rate,price level, and interest rate. These effects are difficult to ignore once the
program costs eat up a sizeable chunk of the governmentbudget.
The social cost of a food subsidy program depends partly on the waythe program is financed. If the program's budgetary requirement is rela-
tively small, there may be no need to raise additional revenue; the required
budget may be obtained from existing (untargeted) budgetary allocation. Atargeted rice subsidy program of P2 billion, for example, may be funded
from the budget allocated to the National Food Authority for its various
programs. This agency which is vested with too many functions, has not
been effective instabilizing food prices, providing income transfers to palayand corn farmers, and conferring rice price subsidies to poor consumers
(Balisacan et al. 1993). Therefore, channeling this amount for food subsidyto the Department of Social Welfare and Development which has theadministrative capability for identifying deserving beneficiaries, can con-
siderably improve the poverty alleviation impact of the government's foodsubsidy program.
As the budgetary requirements of a food subsidy program rise, addi-
tional revenues will have to be generated. In a developing country with pooradministrative capacity'for the collection of real property and business
206 JOURNALOF PHILIPPINE DEVELOPMENT
income taxes, trade-based taxes as well as commodity taxes are significant
revenue-raising devices. However, the incremental welfare costs Ofraisingadditional revenues from trade-based taxes, such as tariffs, are large and
rapidly rising. Assuming an initial tariff rate on import substitutes of 30
percent (roughly the average rate prevailing in recent years), Clarete and
Whalley (1987) estimated these costs to be close to P6 per peso of additionalrevenues raised. Thus, a food subsidy program funded by such tax devices
is likely to be extremely costly to society.
Finally, one also has to be concerned about the possible displacement
of private transfers by public transfers. If private and public transfers areclose substitutes, an increase in public transfers could induce a reduction in
private transfers, thereby diluting the effectiveness of the public transfer
program. For example, if the coverage of rural works programs is expanded,remittances of relatives residing in urban areas may be reduced, so that the
well-being of rural households is hardly affected by the transfer program
meant for them. Evidence on the Philippines indicates.that private transfers
are large and responsive to household characteristics that can be affected
by government policy (Cox and Jimenez 1993). The evidence furtherindicates that, while crowding-out of interhousehold transfers by public
transfers is not complete, simple analyses that do not account for private-
transfer responses to public transfer programs could exaggerate the effec-
tiveness of these programs in alleviating poverty.
CONCLUDING REMARKS
Food price increases that may arise from a macroeeonomic adjustment
program are especially inimical to the poor. Food subsidies are commonly
suggested safety nets intended to minimize the impact of the program on
the poor. Tight fiscal constraint doesnot, however, permit a generous budgetfor food subsidies. There is, therefore, a need to design food subsidy
programs that maximize, for a given budget, the reduction in aggregate
poverty.
BALISACAN:TARGETINGTRANSFERSTO THE POOR ' 209
An assessment of the effectiveness of food policy in reducing poverty
is incomplete without also looking at other policy oPtions tOachieve povertyalleviation objectives. Is a targeted food price subsidy program, for exam-ple, superior to public works programs, schooling subsidy, or investment in
public health?
Finally, an analysis of the public •provision of social safety nets has to
go beyond the economic environment and include as well the political
landscape. Past efforts to design, institutionalize, and implement poverty-
focused programs have failed partly because of the failure tO explicitly
consider political economy issues. How do the •various food subsidy pro-grams, for example, affect the goals and behavior of various government
agencies, rent-seeking by public- and private-sector agents, and opportuni-
ties for coalition by program supporters (as well as by opponents)? To what
extent does the outward appearance of policies matter? If it matters a great
deal, political support for in-kind transfer programs (e.g_, food stamps and
public works programs) is likely broader than for pure cash transfers to
households. Only after political economy issues such as these have been
adequately understood can one be confident in the effectiveness of thepoverty-alleviation planning effort.
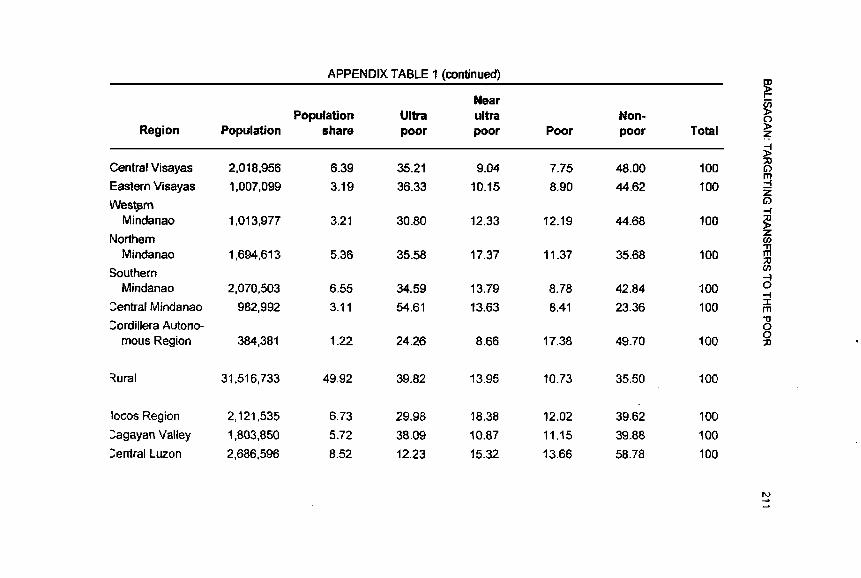
APPENDIX TABLE 1
Population Distribution by Poverty Type and Region, 1991 o