32
Jordan Neighbourhood SME financing February 2016

Jordan Neighbourhood SME financing
February 2016


Neighbourhood SME financing: Jordan
February 2016
Neighbourhood SME financing: Jordan
© European Investment Bank, February 2016 2
Lead authors
Frank Betz, Economist, European Investment Bank Geoff Frewer, Deputy Head of Division, European Investment Bank
Economics editor
Debora Revoltella, Director, Economics Department, European Investment Bank
Editorial, linguistic and statistical support
Tamar Baiashvili, Economist, European Investment Bank and National Bank of Georgia Polyxeni Kanelliadou, European Investment Bank
This report is based on a survey of the intermediaries conducted by the Economics Department of the European Investment Bank. Information about the market context draws on the EIB/EBRD/WB Enterprise Survey and the World Bank’s Doing Business as well as national sources. About the Economics Department of the EIB
The mission of the EIB Economics Department is to provide economic analyses and studies to support the Bank in its operations and in its positioning, strategy and policy. The Department, a team of 35 economists and assistants, is headed by Debora Revoltella, Director of Economics.
Disclaimer
The views expressed in this document are those of the authors and do not necessarily reflect the position of the EIB.
Neighbourhood SME financing: Jordan
© European Investment Bank, February 2016 3
Contents 1. SUMMARY .................................................................................................................................................... 4
1.1. ECONOMIC AND FINANCIAL SITUATION ............................................................................................. 4 1.2. ASSESSMENT OF THE FINANCIAL SECTOR ........................................................................................... 4 1.3. GAPS IN SME FINANCE ........................................................................................................................ 5
2. THE MACROECONOMIC ENVIRONMENT ..................................................................................................... 6 2.1. THE STRUCTURE OF THE ECONOMY AND EU RELATIONS ................................................................... 6 2.2. RECENT MACROECONOMIC DEVELOPMENTS .................................................................................... 7
3. FINANCIAL SECTOR OVERVIEW .................................................................................................................... 8 3.1. BANKING SECTOR ................................................................................................................................ 8
3.1.1 THE STRUCTURE OF THE BANKING SECTOR/RECENT DEVELOPMENTS ...................................... 8 3.1.2 SOUNDNESS AND PERFORMANCE .............................................................................................. 9 3.1.3 REGULATORY FRAMEWORK ..................................................................................................... 10
3.2. MICROFINANCE ................................................................................................................................. 10 3.3. PRIVATE EQUITY AND VENTURE CAPITAL ......................................................................................... 11 3.4. LEASING ............................................................................................................................................. 12 3.5. TRADE FINANCE................................................................................................................................. 12
4. THE SME SEGMENT ................................................................................................................................... 13 4.1. SME ACTIVITY .................................................................................................................................... 13 4.2. INSTITUTIONAL AND REGULATORY ENVIRONMENT ......................................................................... 14 4.3. SME ACCESS TO FINANCE .................................................................................................................. 16
5. SME FINANCING ........................................................................................................................................ 19 5.1. INTERMEDIARIES ............................................................................................................................... 19 5.2. FINANCING INSTRUMENTS ............................................................................................................... 20 5.3. FUNDING OF THE INTERMEDIARIES .................................................................................................. 22
6. GAPS/MARKET FAILURES .......................................................................................................................... 23 6.1. GAPS IN THE AVAILABILITY OF FINANCIAL PRODUCTS: .................................................................... 23 6.2. CONSTRAINTS ON THE GROWTH OF SME FINANCE .......................................................................... 23

Neighbourhood SME financing: Jordan
© European Investment Bank, February 2016 4
1. SUMMARY
1.1. Economic and Financial Situation
• Jordan is an upper-middle income country with a GDP per capita of USD 5,600 in 2015. The economy has been adversely affected by conflict in Syria and Iraq which disrupted trade routes, reduced tourism, increased investment uncertainty and imposed additional costs related to aid for refugees. However, growth has picked up and is expected to come in at 2.9% in 2015, while inflation declined to 0.2%, the current account deficit remained low in comparison to recent years at 7.4% of GDP and the banking sector remains robust.
• However, economic growth has been insufficient to bring about substantial increases in real incomes or reductions in unemployment. The modest economic recovery in 2014 was driven mainly by the agriculture mining and construction sectors, while activity in other sectors stalled. With the rate of population growth running at 2.2%, the modest levels of economic growth imply only slow improvement in real incomes with growth of aggregate GDP per capita of less than 1% per year. Moreover, while employment increased in 2014, the rate of unemployment increased to 13.8% in the third quarter of 2015.
• The economy remains vulnerable to exogenous shocks and although the current account has benefited from falling oil prices the economy has been particularly affected by instability in neighbouring countries. Prior to the completion in 2015 of the new Aqaba LNG terminal, repeated disruptions to the flow of natural gas from Egypt due to damage to the Sinai Peninsula pipeline required imports of more expensive fuel products for electricity generation. In addition, tourism revenues, workers’ remittances, and foreign direct investment have all been adversely affected by global economic developments.
• Public debt increased from 60% in 2008 to 90% in 2015, and fiscal consolidation remains the main macroeconomic challenge for the government. In April 2015 the sixth review of the Stand-by Arrangement with the IMF confirmed that the program remains broadly on track.
1.2. Assessment of the Financial Sector
• The Jordan’s financial sector is dominated by banks. The banking sector is relatively large with total assets equalling 170% of GDP in mid-2015. At 76% the ratio of private credit to GDP is above the regional average.
• Financial soundness indicators suggest that the Jordanian banking sector has remained relatively strong despite the recent external shocks. The sector is profitable and well-capitalized. The minimum capital adequacy ratio of 12% required by the CBJ has been consistently exceeded over the last years and stood at 18.5% in June 2015. Non-performing loans declined to 5.5%, their lowest level since 2008.
• The substantial refinancing needs of the government have clearly had an impact on private investment and the banking sector asset structure. However, with the government requiring less credit in the future the challenge for the banks will be to re-focus lending activity on the private sector without compromising asset quality.

Neighbourhood SME financing: Jordan
© European Investment Bank, February 2016 5
1.3. Gaps in SME finance
• Macroeconomic considerations: the government budget absorbs a large proportion of the
plentiful liquidity in the banking system; SMEs identify tax rates and macroeconomic uncertainty as key constraints.
• From the point of view of the intermediaries, the major constraint on SME lending is not a
lack of liquidity but lack of risk-bearing capacity. o The existing loan guarantee corporation has serious shortcomings and is used at
only a modest level. o Guarantee or risk-sharing mechanisms such as portfolio guarantees could help to
offset some of the deficiencies in the financial infrastructure (relating to credit information, secured transactions and insolvency) and improve incentives for intermediaries.
• Startups have poor access to equity finance and debt. Building closer links between banks
and private equity providers would reinforce the entrepreneurial ecosystem.
• Capacity building at the enterprise level is needed to fill gaps in business skills and to promote the generation of high-quality investments. These enterprise skills may be supported through capacity-building linked to loans or through independent capacity-building initiatives.
• Legal and institutional failures will require government initiatives to improve the business
environment and incentives for the private sector, which will run in parallel with measures to improve access to finance.
Neighbourhood SME financing: Jordan
© European Investment Bank, February 2016 6
2. THE MACROECONOMIC ENVIRONMENT
2.1. The Structure of the Economy and EU relations
Jordan is an upper-middle income country with an expected GDP per capita of USD 5,600 in 2015 and a population of 6.8million. Jordan’s population is very young with over one third being below the age of 15, while less than 5% are above 65. Social indicators such as life expectancy (73.5 years) and years of schooling (9.9 years) characterize Jordan as a high human development country with a rank of 77 out of 187 countries in the 2014 UNDP Human Development Report.
The kingdom is one of the few economies in the Middle East with relatively scant natural resources, with phosphates being its only extensive natural deposit. The country has no oil and lacks water. Agriculture accounts for only 3% of GDP and is dependent on climatic conditions, as water supplies are problematic. Production is concentrated around the Jordan valley, and agricultural exports are primarily destined for neighbouring states. The manufacturing industry accounts for 17% of GDP with textiles being its key component, and the tourism industry is of growing importance to the economy, currently accounting for around 10% of GDP.
In recent years, Jordan has made relatively little progress with governance and the business environment. Even though Jordan compares well with the MENA average in the World Bank governance indicators, the Voice and Accountability and Political Stability / Absence of Violence scores remain weak. In terms of ease of doing business, Jordan ranks 113th out of 189 countries included in the 2015 Doing Business Report. Jordan gained 4 places compared to the previous year, although there are still difficulties in getting credit, resolving insolvency and protecting investors.
Jordan’s sovereign rating derives support from the government’s coherent economic policy framework and strong donor support. It is however constrained by the country’s vulnerability to exogenous shocks, high public debt, and the volatile regional political environment. Moody’s assigns a sovereign risk rating of B1, while S&P rates Jordan at Ba3.
Jordan has extensive trade relations with EU. The EU's Association Agreement with Jordan, that was signed in 1997 and entered into force in 2002, progressively moves towards closer trade relations between the EU and Jordan. Further agreement on liberalisation of agricultural products entered into force in 2007. Jordan runs a trade deficit with the EU economies. In 2014, the EU countries accounted for approximately 20% of goods imports and 4% of exports according to the Jordan Department of Statistics. Data from the European Commission indicate that EU goods exports to Jordan mainly consist of machinery and transport equipment, while EU imports from Jordan are dominated by chemicals, machinery and transport equipment.1
1 European Commission.

Neighbourhood SME financing: Jordan
© European Investment Bank, February 2016 7
2.2. Recent Macroeconomic Developments Growth has picked up only slowly and has been insufficient to bring about substantial increases in real incomes or reductions in unemployment. Real GDP growth is expected to come in at 2.9% in 2015. Economic activity has been supported by agriculture, mining and construction. With the rate of population growth running at 2.2%, the modest levels of economic growth imply only slow improvement in real incomes. Moreover, while employment increased in 2014, the rate of unemployment increased to 13.8% in the third quarter of 2015.
The current account deficit has narrowed from 15.2% of GDP in 2012 to an expected 7.4% in 2015. The improvement has been supported by lower oil prices. Energy imports fell by one third year-on-year in the first quarter of 2015. The resilience of exports has helped to sustain the current account as exports to Iraq were diverted to other markets and there was a rebound in the demand for mining products and fertilizers. At the same time, import demand remained moderate due to the sluggish economic recovery. Foreign exchange reserves outperformed expectations, reaching USD 14.1 billion at the end of Nov 2015, equivalent to 7.5 months of imports.
Fiscal consolidation has been aided by lower international oil prices and the consequent reduction in the losses of the national power company NEPCO. The general government deficit declined from 11.5% of GDP in 2013 to 10.0% in 2014 and a further reduction to 3.0% of GDP is anticipated for 2015. Additional public investment could be envisaged depending on the availability of financing sources that do not lead to additional public debt, such as grants or privatization receipts. One major uncertainty over the medium term is the level of GCC grants which have played an important part in budget finance over recent years.
Jordan hosts continues to host the third largest population of Syrian refugees. More than 630,000 refugees have been registered in Jordan, accounting for slightly less than 10% of the population. Estimates of the fiscal costs of hosting the refugees range from 1% of GDP to 2.4% of GDP. The largest costs relate to security and water. In terms of output growth, the negative effects from blocked export routes, reduced tourism revenues and weak investor sentiment outweigh any benefits from increased consumption by the refugee population. Competition between Syrians and Jordanians in the labour market contributes to social tensions.
A three year Stand-By Arrangement with the IMF has been concluded in August 2015. The programme has contributed to restoring macroeconomic stability. A significant fiscal adjustment has been achieved based on a number of measures including subsidy reform. Fuel pump subsidies have been eliminated in 2012 and replaced by an automatic pricing mechanism. The measure was accompanied by a system of conditional cash transfers covering about 70% of the population. The Jordanian authorities have expressed interest in a successor programme.
Jordan benefits from foreign assistance also from other sources. European MFA (macro-financial assistance) amounts to EUR 180m. Disbursement of the second and final tranche of EUR 80m has been approved in August. In 2012, the Gulf Cooperation Council pledged USD 5billion over a period of 5 years , but payments turned out somewhat irregular. France has provided UR 850mn in grants and loans.
Neighbourhood SME financing: Jordan
© European Investment Bank, February 2016 8
3. FINANCIAL SECTOR OVERVIEW
3.1. Banking sector
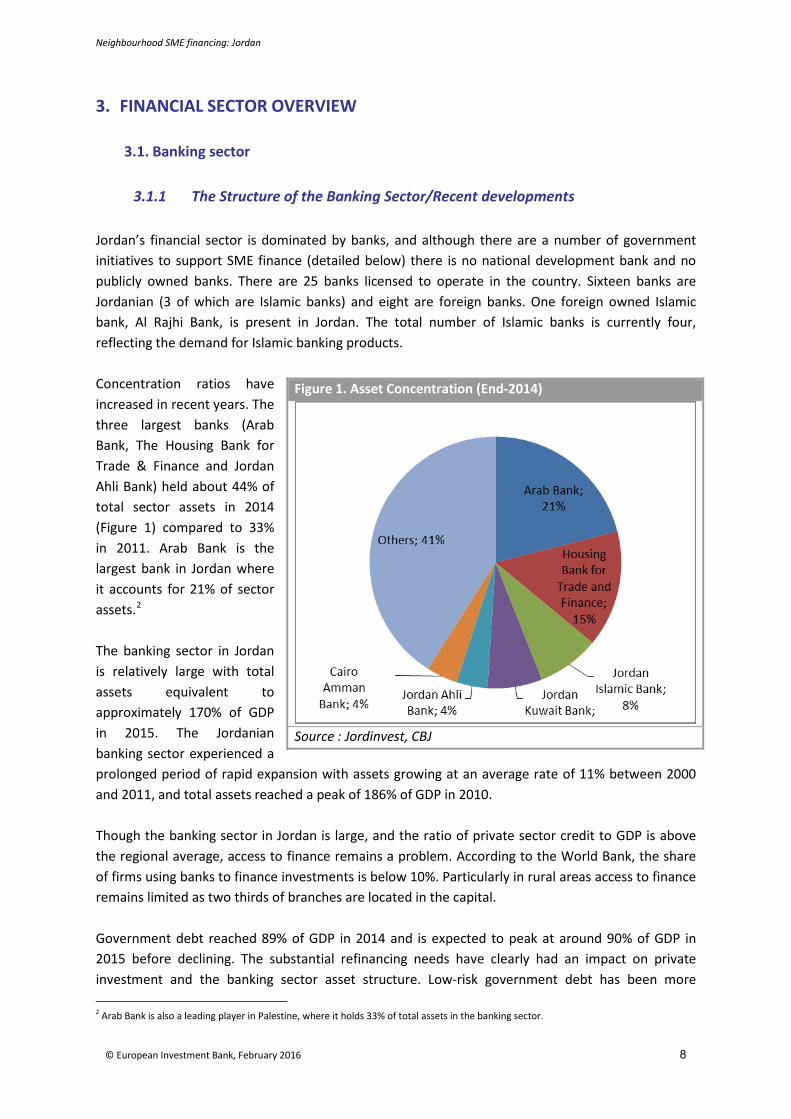
3.1.1 The Structure of the Banking Sector/Recent developments Jordan’s financial sector is dominated by banks, and although there are a number of government initiatives to support SME finance (detailed below) there is no national development bank and no publicly owned banks. There are 25 banks licensed to operate in the country. Sixteen banks are Jordanian (3 of which are Islamic banks) and eight are foreign banks. One foreign owned Islamic bank, Al Rajhi Bank, is present in Jordan. The total number of Islamic banks is currently four, reflecting the demand for Islamic banking products. Concentration ratios have increased in recent years. The three largest banks (Arab Bank, The Housing Bank for Trade & Finance and Jordan Ahli Bank) held about 44% of total sector assets in 2014 (Figure 1) compared to 33% in 2011. Arab Bank is the largest bank in Jordan where it accounts for 21% of sector assets.2 The banking sector in Jordan is relatively large with total assets equivalent to approximately 170% of GDP in 2015. The Jordanian banking sector experienced a prolonged period of rapid expansion with assets growing at an average rate of 11% between 2000 and 2011, and total assets reached a peak of 186% of GDP in 2010. Though the banking sector in Jordan is large, and the ratio of private sector credit to GDP is above the regional average, access to finance remains a problem. According to the World Bank, the share of firms using banks to finance investments is below 10%. Particularly in rural areas access to finance remains limited as two thirds of branches are located in the capital. Government debt reached 89% of GDP in 2014 and is expected to peak at around 90% of GDP in 2015 before declining. The substantial refinancing needs have clearly had an impact on private investment and the banking sector asset structure. Low-risk government debt has been more 2 Arab Bank is also a leading player in Palestine, where it holds 33% of total assets in the banking sector.
Figure 1. Asset Concentration (End-2014)
Source : Jordinvest, CBJ

Neighbourhood SME financing: Jordan
© European Investment Bank, February 2016 9
attractive to banks than more resource-intensive and risky SME lending. However, with the government requiring less credit in the future the challenge for the banks will be to re-focus credit on the private sector without compromising asset quality. Table 1. Banking Soundness indicators
2007 2008 2009 2010 2011 2012 2013 2014 Jun-15 Dec-15
Risk-weighted capital adequacy ratio 20.8 18.4 19.6 20.3 19.3 19.0 18.4 18.4 18.5 -
Non-performing loans (NPLs) (in millions of JD) 453 550 877 1,159 1,315 1,336 1,285 1,064 1,082 -
NPLs (in percent of total loans) 4.1 4.2 6.7 8.2 8.5 7.7 7.0 5.6 5.5 -
Provisions (in percent of classified loans) 67.8 63.4 52.0 52.4 52.3 69.4 77.0 77.6 79.7 -
NPLs net of provisions (in percent of equity) 4.3 5.7 10.6 12.6 13.4 8.3 5.6 4.3 3.9 -
Liquidity ratio 157.5 141.2 159.1 161.4 152.9 143.5 149.1 152.2 150.6 -
Return on assets 1.6 1.4 1.1 1.1 1.1 1.1 1.2 1.4 1.4 -
Return on equity 12.6 11.5 8.8 8.8 8.3 8.6 9.9 11.0 11.1 -
FX-denominated loans to total loans ratio 9.7 12.8 11.6 11.8 11.4 12.9 14.1 13.3 13.4
FX-denominated deposits to total deposits ratio 33.6 26.3 21.8 21.7 21.6 29.1 23.9 20.6 - 20.2
Loans to deposits ratio 70.7 72.1 65.6 64.2 65.0 71.4 68.6 63.7 - 64.7
Construction lending to deposits ratio 12.1 12.7 12.7 14.1 14.2 14.7 14.8 15.0 - -
Margin trading and financial services (share in total loans) 7.2 7.1 6.9 5.8 5.3 4.5 4.1 3.9 - -
Loans to GDP ratio (in percent of GDP) 93.1 83.7 78.7 77.0 77.4 81.2 79.4 76.0 - 79.1Source: Central Bank of Jordan and IMF.
(In percent, unless otherwise indicated)
3.1.2 Soundness and Performance Financial soundness indicators suggest that the Jordanian banking sector has remained relatively strong despite the recent economic turmoil. The sector is profitable and well-capitalized. The minimum capital adequacy ratio of 12% required by the CBJ has been consistently exceeded over the last years and stood at 18.5% in mid-2015. Non-performing loans declined to their lowest level since 2008. The share of NPLs in total loans fell to 5.5% in June 2015 from a peak of 8.5% in 2011. Meanwhile provisions have increased to 79.7% of classified loans. Liquidity in the sector remains high, as indicated by a loan-to-deposit ratio of 65%. Owing to the CBJ requirement to keep liquid assets above the level of short-term liabilities, the liquidity ratio of the sector stands well above the required level of 100%, reaching 151% in mid-2015. The sector’s profitability has improved despite higher loan loss provisions. The domestic return on assets averaged 1.4% in June 2015, which is the highest for the last five years. The return on equity followed a similar trend reaching 11.1% in comparison to an average of 9% in recent years. Dollarization has moderated over recent years. Foreign currency loans as a percentage of total loans declined from 14.1% in 2013 to 13.4% in 2015. Foreign currency deposits as a percentage of total deposits declined from 23.9% in 2013 to 20.2% in 2015.
Neighbourhood SME financing: Jordan
© European Investment Bank, February 2016 10
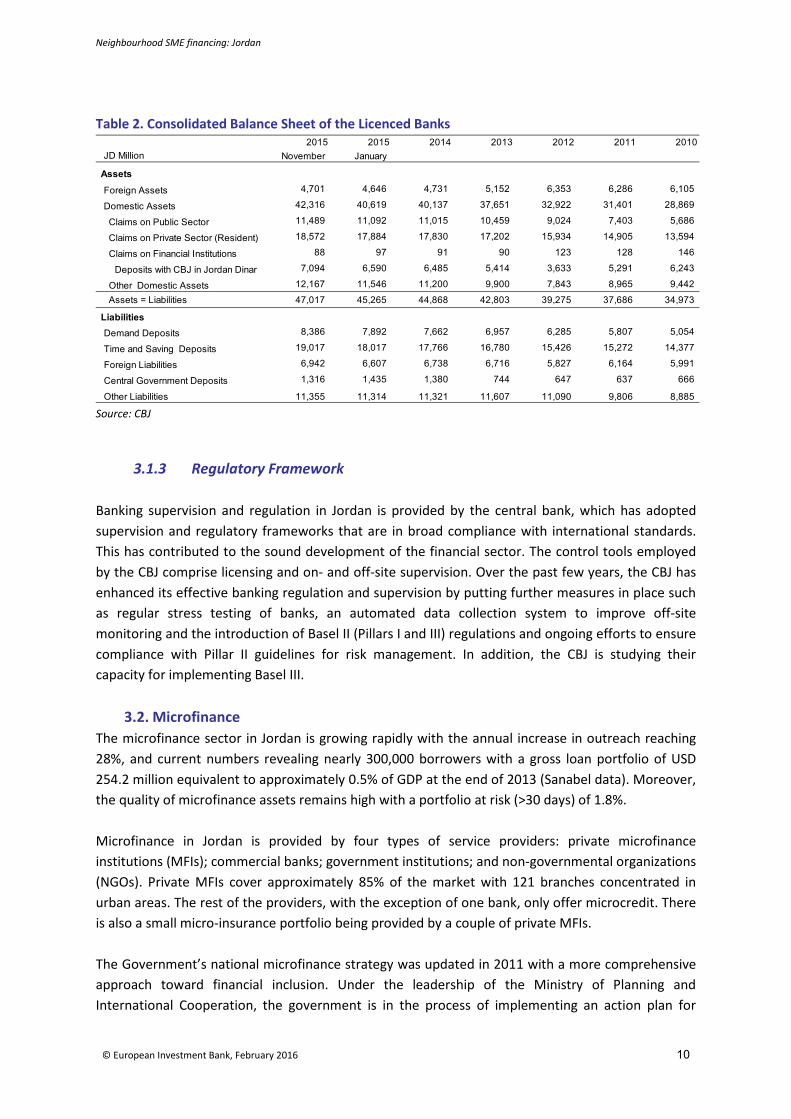
Table 2. Consolidated Balance Sheet of the Licenced Banks
2014 2013 2012 2011 2010JD Million November January
Foreign Assets 4,701 4,646 4,731 5,152 6,353 6,286 6,105
Domestic Assets 42,316 40,619 40,137 37,651 32,922 31,401 28,869
Claims on Public Sector 11,489 11,092 11,015 10,459 9,024 7,403 5,686
Claims on Private Sector (Resident) 18,572 17,884 17,830 17,202 15,934 14,905 13,594
Claims on Financial Institutions 88 97 91 90 123 128 146
Deposits with CBJ in Jordan Dinar 7,094 6,590 6,485 5,414 3,633 5,291 6,243
Other Domestic Assets 12,167 11,546 11,200 9,900 7,843 8,965 9,442 Assets = Liabilities 47,017 45,265 44,868 42,803 39,275 37,686 34,973
Demand Deposits 8,386 7,892 7,662 6,957 6,285 5,807 5,054
Time and Saving Deposits 19,017 18,017 17,766 16,780 15,426 15,272 14,377
Foreign Liabilities 6,942 6,607 6,738 6,716 5,827 6,164 5,991
Central Government Deposits 1,316 1,435 1,380 744 647 637 666
Other Liabilities 11,355 11,314 11,321 11,607 11,090 9,806 8,885
Liabilities
Assets
20152015
Source: CBJ
3.1.3 Regulatory Framework
Banking supervision and regulation in Jordan is provided by the central bank, which has adopted supervision and regulatory frameworks that are in broad compliance with international standards. This has contributed to the sound development of the financial sector. The control tools employed by the CBJ comprise licensing and on- and off-site supervision. Over the past few years, the CBJ has enhanced its effective banking regulation and supervision by putting further measures in place such as regular stress testing of banks, an automated data collection system to improve off-site monitoring and the introduction of Basel II (Pillars I and III) regulations and ongoing efforts to ensure compliance with Pillar II guidelines for risk management. In addition, the CBJ is studying their capacity for implementing Basel III.
3.2. Microfinance The microfinance sector in Jordan is growing rapidly with the annual increase in outreach reaching 28%, and current numbers revealing nearly 300,000 borrowers with a gross loan portfolio of USD 254.2 million equivalent to approximately 0.5% of GDP at the end of 2013 (Sanabel data). Moreover, the quality of microfinance assets remains high with a portfolio at risk (>30 days) of 1.8%. Microfinance in Jordan is provided by four types of service providers: private microfinance institutions (MFIs); commercial banks; government institutions; and non-governmental organizations (NGOs). Private MFIs cover approximately 85% of the market with 121 branches concentrated in urban areas. The rest of the providers, with the exception of one bank, only offer microcredit. There is also a small micro-insurance portfolio being provided by a couple of private MFIs. The Government’s national microfinance strategy was updated in 2011 with a more comprehensive approach toward financial inclusion. Under the leadership of the Ministry of Planning and International Cooperation, the government is in the process of implementing an action plan for

Neighbourhood SME financing: Jordan
© European Investment Bank, February 2016 11
financial inclusion in cooperation with the CBJ. Since mid-2013 CBJ has taken the lead in regulation and supervise of the microfinance sector. Following industry consultations, the CBJ is moving ahead with new regulations in line with international best practices. A private credit bureau, licensed by the CBJ, is also expected to begin operations, which would deal with the gap in credit information in the financial system. Currently, MFIs have their own credit information sharing platform because they are not allowed to participate in the public credit registry, which is available only for banks and has a high threshold of about USD 30,000. The absence of a comprehensive credit information system is considered one of the major challenges facing the microfinance sector in Jordan. This is expected to be solved with the launch of the recently tendered private credit bureau. The government has put in place infrastructure that supports mobile banking, but it has not yet taken off. The country has a high mobile penetration, of 1.39 subscriptions per person. In addition, banking regulations allow both banks and non-banks to engage in electronic money and mobile banking. This supportive environment has made it possible for two mobile network operators to launch mobile wallet services.
3.3. Private equity and Venture capital The regulatory environment for private equity in Jordan dates back to 2000 and the sector has been growing albeit from a small base. Jordan attracts investment from regional funds, most of which are Gulf based, as well as funds with a more specific focus on Jordan such as Foursan and Badia, in which the EIB has invested. The private equity funds active in Jordan tend to focus on specific sectors such as real estate and telecoms, where the investment horizon is relatively short. However they are also active in longer term infrastructure and the SME sector. While some of the funds target early and growth stage investments their focus is on specific niches and their impact on the SME sector in general remains limited. Venture capital could be particularly beneficial given the structure of the Jordanian economy. SMEs account for the vast majority of private enterprise in the economy. There is a general lack of bank finance and start-ups with no credit history and limited collateral are especially constrained. Moreover, although business angels are present they are understood to support only a small proportion of entrepreneurs. Despite this gap in the market, venture capital remains a nascent asset class in Jordan. The government of Jordan is active in supporting the entrepreneurial ecosystem for startups and the venture capital industry. Government backed entrepreneurship development initiatives include the Jordan Enterprise Development Corporation (JEDCO), King Abdullah II Fund for Development, Queen Rania Center for Entrepreneurship and iPARK as well as partially government-funded incubator Oasis500. Jordan is one of the main hubs for private equity funds in the MENA region, but despite the government initiatives there is still a lack of financing for startups. In particular, there is a lack of follow-up funding after incubation and loans for startups (venture debt), which is not being provided
Neighbourhood SME financing: Jordan
© European Investment Bank, February 2016 12
on a commercial basis by the banks. There is also a need for additional business development services exceeding the current level of supply.
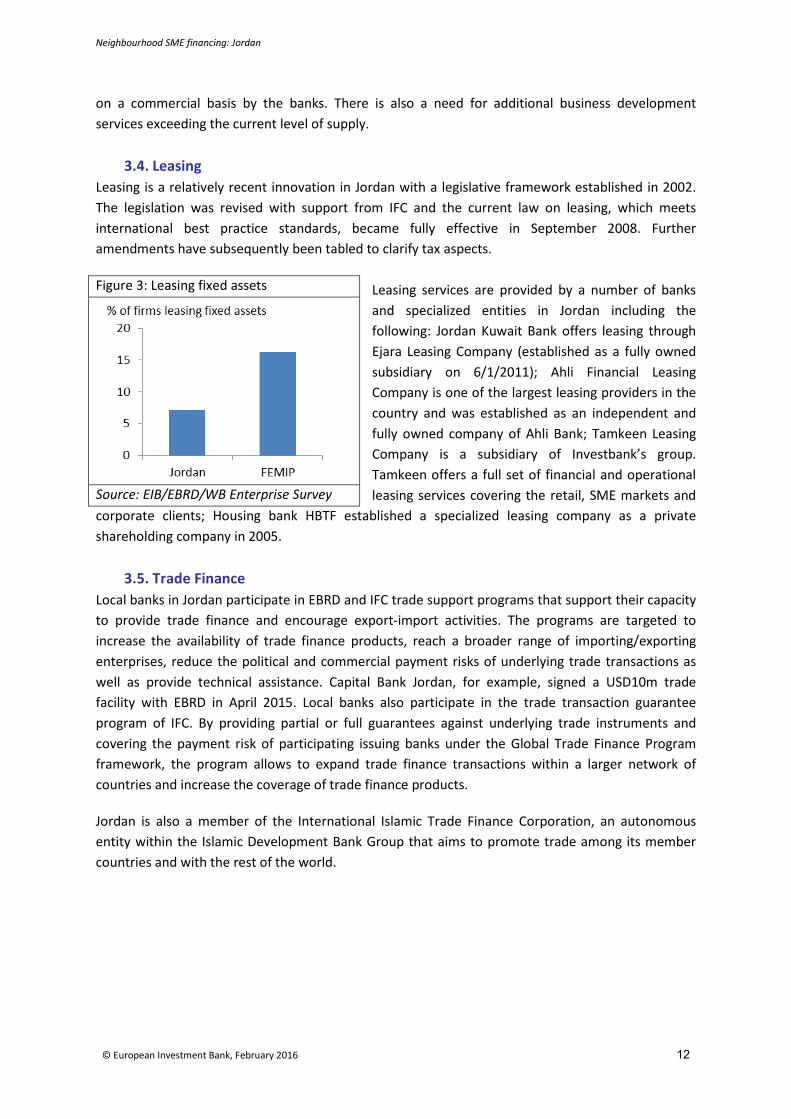
3.4. Leasing Leasing is a relatively recent innovation in Jordan with a legislative framework established in 2002. The legislation was revised with support from IFC and the current law on leasing, which meets international best practice standards, became fully effective in September 2008. Further amendments have subsequently been tabled to clarify tax aspects.
Leasing services are provided by a number of banks and specialized entities in Jordan including the following: Jordan Kuwait Bank offers leasing through Ejara Leasing Company (established as a fully owned subsidiary on 6/1/2011); Ahli Financial Leasing Company is one of the largest leasing providers in the country and was established as an independent and fully owned company of Ahli Bank; Tamkeen Leasing Company is a subsidiary of Investbank’s group. Tamkeen offers a full set of financial and operational leasing services covering the retail, SME markets and
corporate clients; Housing bank HBTF established a specialized leasing company as a private shareholding company in 2005.
3.5. Trade Finance Local banks in Jordan participate in EBRD and IFC trade support programs that support their capacity to provide trade finance and encourage export-import activities. The programs are targeted to increase the availability of trade finance products, reach a broader range of importing/exporting enterprises, reduce the political and commercial payment risks of underlying trade transactions as well as provide technical assistance. Capital Bank Jordan, for example, signed a USD10m trade facility with EBRD in April 2015. Local banks also participate in the trade transaction guarantee program of IFC. By providing partial or full guarantees against underlying trade instruments and covering the payment risk of participating issuing banks under the Global Trade Finance Program framework, the program allows to expand trade finance transactions within a larger network of countries and increase the coverage of trade finance products.
Jordan is also a member of the International Islamic Trade Finance Corporation, an autonomous entity within the Islamic Development Bank Group that aims to promote trade among its member countries and with the rest of the world.
Figure 3: Leasing fixed assets
Source: EIB/EBRD/WB Enterprise Survey

Neighbourhood SME financing: Jordan
© European Investment Bank, February 2016 13
4. THE SME SEGMENT
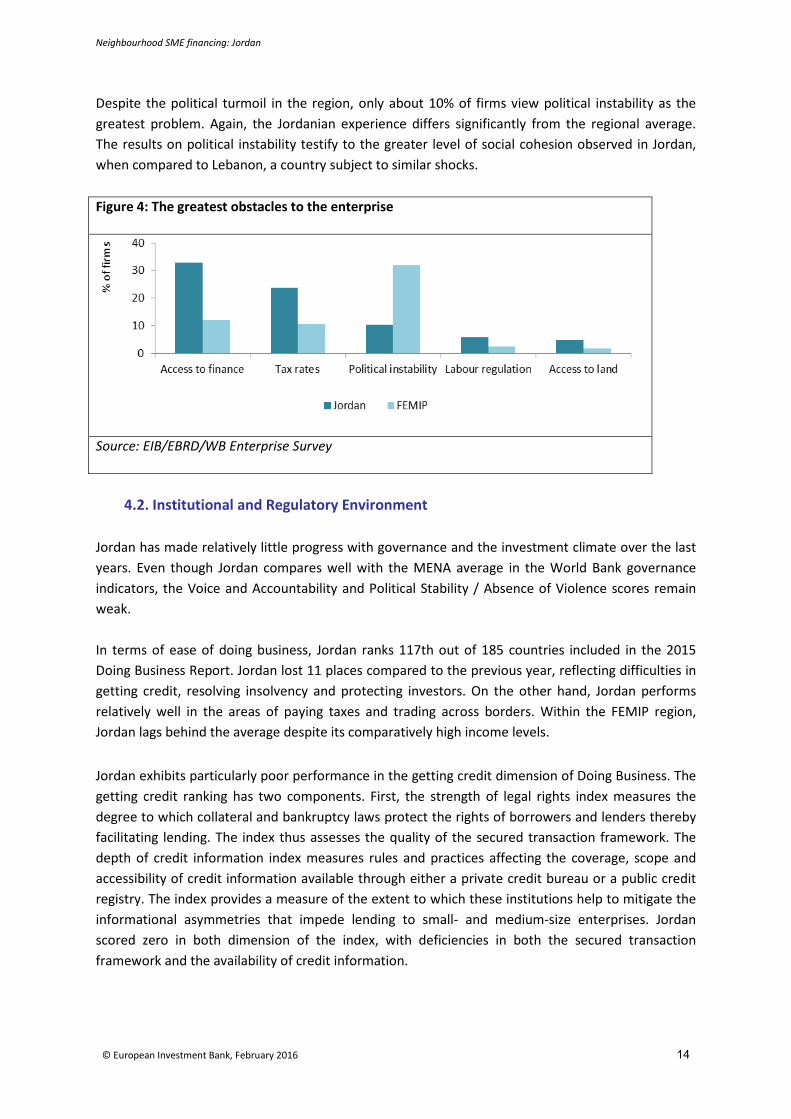
4.1. SME activity Economic structure and contribution of the SME sector SMEs account for a substantial share of economic activity in Jordan. The relatively small scale of the economy means that few large corporate enterprises are present. The last official census in 2011 found that 98% of all enterprises are MSMEs3, 66 percent of which have less than 19 employees. They employ 71% of the total private sector labor force (SMEs 33% and microenterprises 39%); contribute 40% of GDP, and account for 45% of total exports. According to the MENA Enterprise Surveys4 (MENA ES), the overall structure and composition of the SME segment5 is broadly comparable to the other FEMIP countries. Jordan has a somewhat higher share of SME activity in manufacturing, which accounts for 43% of the SME population, but Jordanian SMEs are relatively young, with an average age of 15 years and they make a relatively low contribution to product or process innovation (see Table 3). Table 3: SME structure Jordan FEMIP SMEs, in percent 93.7 93.1 Manufacturing firms, in percent 42.7 37.9 Average age in years 15.3 17.9 Exporters, in percent 23.0 18.5 Foreign owned firms, in percent 3.8 5.5 Female owners, percent 13.1 16.8 Product or process innovation 18.1 27.6 Source: EIB/EBRD/WB Enterprise Survey The MENA ES asks respondents what they consider the greatest obstacle to their firm. Figure 4 presents the obstacles that were most frequently mentioned as the greatest obstacle, and compares the Jordanian average to that for the wider region. About 33% of Jordanian firms consider access to finance as the most pressing obstacle compared to a regional average of about 12%. The results refer to firms’ fiscal year 2012. During that period Jordan experienced several adverse shocks. Reductions in gas supply form Egypt, forced Jordan to resort to more expensive fuel imports, putting pressure on the current account, foreign exchange reserves as well as the budget. These tensions led Jordan to sign a Stand-By Arrangement with the International Monetary Fund (IMF). Public debt increased from 71% of GDP in 2011 to 82% in 2012, potentially crowding out lending to the private sector. As macroeconomic tensions have eased it is therefore not clear to what extent the results still hold.
3 See annex for SME definitions. 4 EIB, EBRD and the World Bank have recently financed a wave of Enterprise Surveys in the FEMIP region. The surveys are representative of the formal, non-agricultural sector. They comprise a wide range of business environment measures and a broad set of firm demographics. The Jordanian sample was fielded in 2013 and covers 561 enterprises. 5 MENA ES definition of SME: small firms < 20 employees, medium-size firms 20-99 employees. For other SME definition used in Jordan see Table A2.
Neighbourhood SME financing: Jordan
© European Investment Bank, February 2016 14
Despite the political turmoil in the region, only about 10% of firms view political instability as the greatest problem. Again, the Jordanian experience differs significantly from the regional average. The results on political instability testify to the greater level of social cohesion observed in Jordan, when compared to Lebanon, a country subject to similar shocks. Figure 4: The greatest obstacles to the enterprise
Source: EIB/EBRD/WB Enterprise Survey
4.2. Institutional and Regulatory Environment
Jordan has made relatively little progress with governance and the investment climate over the last years. Even though Jordan compares well with the MENA average in the World Bank governance indicators, the Voice and Accountability and Political Stability / Absence of Violence scores remain weak. In terms of ease of doing business, Jordan ranks 117th out of 185 countries included in the 2015 Doing Business Report. Jordan lost 11 places compared to the previous year, reflecting difficulties in getting credit, resolving insolvency and protecting investors. On the other hand, Jordan performs relatively well in the areas of paying taxes and trading across borders. Within the FEMIP region, Jordan lags behind the average despite its comparatively high income levels. Jordan exhibits particularly poor performance in the getting credit dimension of Doing Business. The getting credit ranking has two components. First, the strength of legal rights index measures the degree to which collateral and bankruptcy laws protect the rights of borrowers and lenders thereby facilitating lending. The index thus assesses the quality of the secured transaction framework. The depth of credit information index measures rules and practices affecting the coverage, scope and accessibility of credit information available through either a private credit bureau or a public credit registry. The index provides a measure of the extent to which these institutions help to mitigate the informational asymmetries that impede lending to small- and medium-size enterprises. Jordan scored zero in both dimension of the index, with deficiencies in both the secured transaction framework and the availability of credit information.

Neighbourhood SME financing: Jordan
© European Investment Bank, February 2016 15
CREDIT BUREAU As just highlighted Jordan lacks broad-based credit information systems, but this gap is being addressed by the Central Bank, which is in the process of establishing the country’s first credit bureau. The current credit information system covers less than 5% of the adult population, according to the World Bank Doing Business Survey. This level of coverage is significantly behind the FEMIP average. The Central Bank of Jordan issued a tender in March 2015 to establish the first credit bureau in the country. This initiative has the backing of the country’s banking association, lending organizations and the Government. CRIF, which is a leading provider of credit information systems worldwide, has been awarded the contract. The credit bureau platform will gather positive and negative credit information on individuals and businesses from eligible Jordanian lending institutions, banks, microfinance organizations, telco, and retailers. After a test phase, the credit bureau is due to be operational by the end of 2015.
REGISTRATION OF ASSETS Jordanian banks typically require collateral in the form of land, machinery or receivables. SMEs report that for approximately 60% of loans they are required pledge land or machinery and approximately 30% of loans require pledge over receivables.
Figure 4: Doing Business 2015
Source: Doing Business
Neighbourhood SME financing: Jordan
© European Investment Bank, February 2016 16
Figure 5: Type of collateral required
Source: EIB/EBRD/WB Enterprise Survey
Procedures for land registration in Jordan are slow and costly in comparison with regional benchmarks. Jordan ranks 107th for registering property in the Doing Business Survey with procedures taking 21 days and costing 7.5% of the asset value.
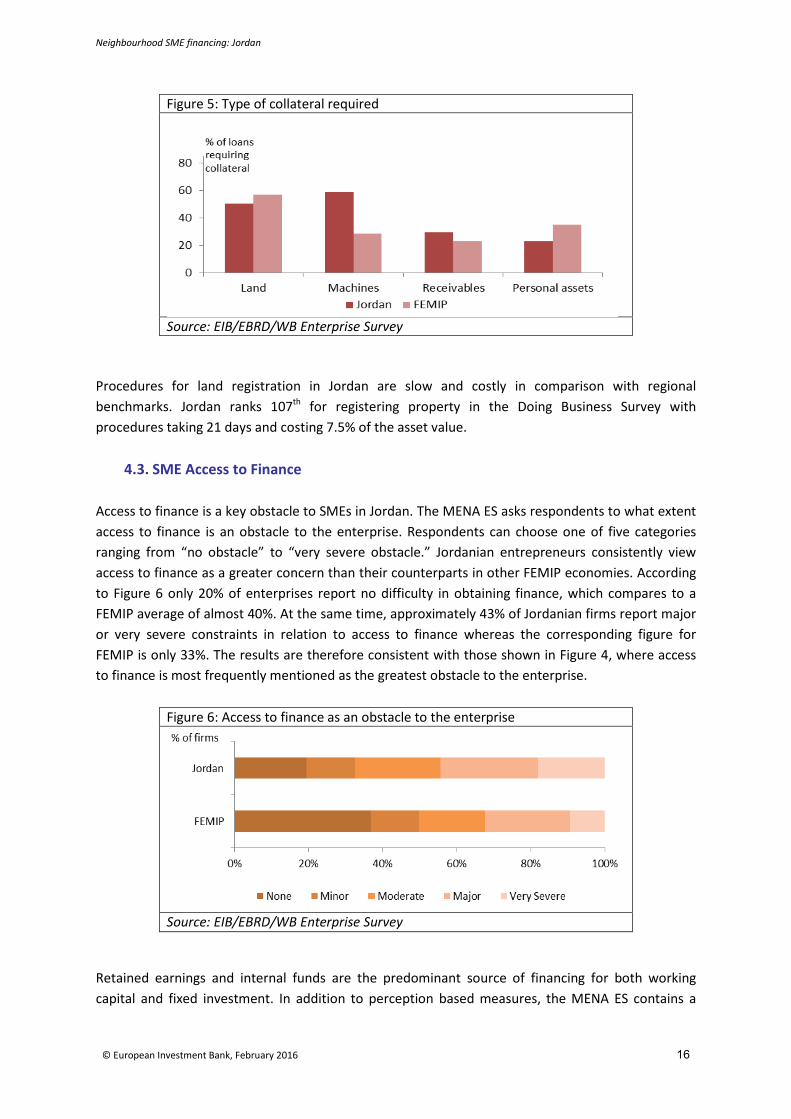
4.3. SME Access to Finance Access to finance is a key obstacle to SMEs in Jordan. The MENA ES asks respondents to what extent access to finance is an obstacle to the enterprise. Respondents can choose one of five categories ranging from “no obstacle” to “very severe obstacle.” Jordanian entrepreneurs consistently view access to finance as a greater concern than their counterparts in other FEMIP economies. According to Figure 6 only 20% of enterprises report no difficulty in obtaining finance, which compares to a FEMIP average of almost 40%. At the same time, approximately 43% of Jordanian firms report major or very severe constraints in relation to access to finance whereas the corresponding figure for FEMIP is only 33%. The results are therefore consistent with those shown in Figure 4, where access to finance is most frequently mentioned as the greatest obstacle to the enterprise.
Figure 6: Access to finance as an obstacle to the enterprise
Source: EIB/EBRD/WB Enterprise Survey
Retained earnings and internal funds are the predominant source of financing for both working capital and fixed investment. In addition to perception based measures, the MENA ES contains a
Neighbourhood SME financing: Jordan
© European Investment Bank, February 2016 17
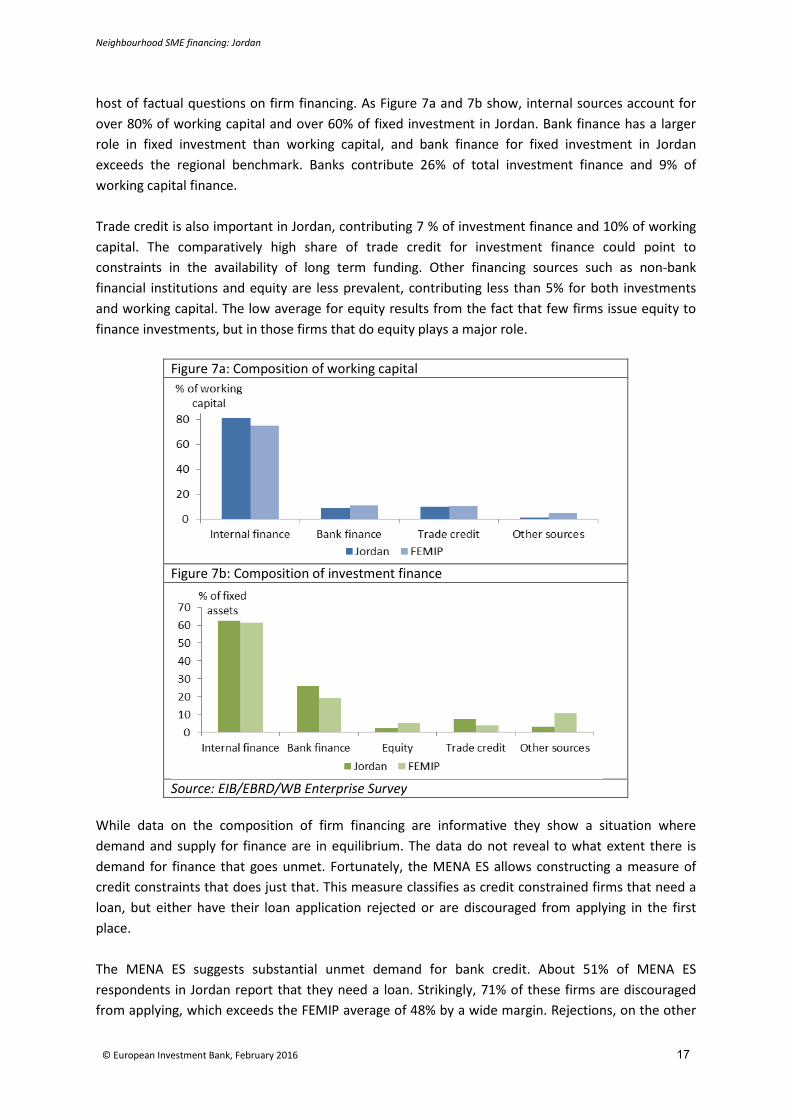
host of factual questions on firm financing. As Figure 7a and 7b show, internal sources account for over 80% of working capital and over 60% of fixed investment in Jordan. Bank finance has a larger role in fixed investment than working capital, and bank finance for fixed investment in Jordan exceeds the regional benchmark. Banks contribute 26% of total investment finance and 9% of working capital finance. Trade credit is also important in Jordan, contributing 7 % of investment finance and 10% of working capital. The comparatively high share of trade credit for investment finance could point to constraints in the availability of long term funding. Other financing sources such as non-bank financial institutions and equity are less prevalent, contributing less than 5% for both investments and working capital. The low average for equity results from the fact that few firms issue equity to finance investments, but in those firms that do equity plays a major role.
Figure 7a: Composition of working capital
Figure 7b: Composition of investment finance
Source: EIB/EBRD/WB Enterprise Survey
While data on the composition of firm financing are informative they show a situation where demand and supply for finance are in equilibrium. The data do not reveal to what extent there is demand for finance that goes unmet. Fortunately, the MENA ES allows constructing a measure of credit constraints that does just that. This measure classifies as credit constrained firms that need a loan, but either have their loan application rejected or are discouraged from applying in the first place. The MENA ES suggests substantial unmet demand for bank credit. About 51% of MENA ES respondents in Jordan report that they need a loan. Strikingly, 71% of these firms are discouraged from applying, which exceeds the FEMIP average of 48% by a wide margin. Rejections, on the other

Neighbourhood SME financing: Jordan
© European Investment Bank, February 2016 18
hand, play only a marginal role. Less than 2% of loan applications in Jordan are rejected. It follows that about 73% of firms that need a loan are credit constrained. Again, this is much higher than the regional average. With 51% of firms needing a loan, 36% of the entire population of firms in Jordan is credit constrained. The experience based credit constrained indicator supports the results coming from the perception based measure: Access to finance in a problem for Jordanian firms. The high share of discouraged firms makes it worthwhile to explore the factors that drive discouragement. Figure 9 suggests that unfavourable interest rate played a prominent role in discouraging firms from applying for loans, ahead of complex application procedures and collateral requirements. This is consistent with what could be expected given the cyclical position of the Jordanian economy during the reference period. At that time the CBJ was raising interest rates to defend the currency peg with the US dollar. At the same time, the importance of complex application procedures and collateral requirements suggest that the high level of discouragement also has a structural dimension.
Figure 9: Reason for discouragement
Source: EIB/EBRD/WB Enterprise Survey
Figure 8a: Firms needing a loan Figure 8b: Firms discouraged from applying
Figure 8c: Rejected loan applications Figure 8d: Credit constrained firms

Neighbourhood SME financing: Jordan
© European Investment Bank, February 2016 19
5. SME FINANCING
5.1. Intermediaries There are significant differences across banks in terms of their approach to the SME sector. Most banks have a dedicated SME unit, and none of the respondents to the EIB survey reported the banks own human resources as a significant constraint on the development of the business. However, there are clear differences between banks in terms of the priority that they place on SME development. On the one hand some banks are taking a proactive approach, in some cases supported by technical assistance from IFIs to develop their SME lending models. On the other hand some banks appear to have a problem with the SME sector. Some are still using corporate teams and there appears to be a lack in some banks of teams to assess SME risks. Activity of the banks is concentrated in the urban areas and the situation in the Governorates is much more challenging. There fewer bank branches located in the governorates and the government authorities responsible for SME support also tend to be under-represented. Lending to SMEs remains a relatively small proportion of total bank lending. For the sample of banks in the EIB Survey of Enterprise Lending, loans to SMEs account for between 6% and 12% of total lending. Figure 6: Which of the following are acting as a constraint on the supply of credit?
0%10%20%30%40%50%60%70%80%90%
100%
Low profitability Human resources- eg not enoughloan officers to
process theapplications
Overall lack offunding
Lack of localcurrency funding
Lack of long termfunding
Lack of capital Interest rates
Not a constraint Slight constraint Moderate constraint Significant constraint Very significant constraint Source: EIB Bank Survey of Enterprise Lending (2015) The demand for credit by SMEs is constrained by a number of factors within the SMEs themselves. Lack of business skill in the MSMEs holds back their access to finance. Enterprises often lack transparency, and do not have audited financial statements. SMEs are typically family businesses lacking professional management, and are hence considered more risky. Enterprises do not have sufficient collateral, or their assets are not registered, making foreclosure problematic. Some SMEs are discouraged from applying for bank loans or have moral objections to interest-based borrowing.

Neighbourhood SME financing: Jordan
© European Investment Bank, February 2016 20
Figure 7: Which of the following are acting as a constraint on the demand for credit?
0%10%20%30%40%50%60%70%80%90%
100%
Lack ofcreditworthy
customers
Inadequate credithistory
Lack of capacityon the side of the
applicant toprepare a loan
application
Tighteningbanking sector
regulations
Globalmacroeconomic
conditions
Localmacroeconomic
conditions
Lack ofacceptablecollateral
Capacity toprepare business
plans
Not a constraint Slight constraint Moderate constraint Significant constraint Very significant constraint Source: EIB Bank Survey of Enterprise Lending (2015) Regulatory and policy uncertainties have a disproportionate impact on smaller enterprises. In surveys SMEs highlight business licensing, municipal inspections and regulatory policy uncertainties as key factors hindering their growth prospects. The supply of credit by banks is constrained by a number of supply side factors. MSME lending is hampered by inadequacies in the legal and institutional framework. There has been a lack of credit reporting and information which is only now being addressed by the establishment of the credit bureau. Secured transactions are constrained by shortcomings in the legal system relating to ownership and transfer of assets and insolvency. In addition there are weaknesses in regulation and supervision of financial services. Most SMEs are family businesses and the typical project cost is less than 5MJD and there are few corporate loans with investments over 10 MJD. Therefore the cost of credit assessment and loan administration weigh heavily on the SME sector. Nevertheless, the sector is becoming increasingly competitive in Amman and other centres, and the market is highly liquid. The oil price decline has boosted the liquidity of the banking system as a whole as loans to the refining and energy sectors were repaid. The major constraint on SME lending is not therefore a lack of liquidity but lack of risk-bearing capacity in the intermediaries to take SME risk.
5.2. Financing instruments Banks in Jordan offer a fairly wide range of products to SMEs. In response to the EIB survey, financial intermediaries confirmed that credit products are widely available in the market. SME credit, trade finance, and leasing products are all widely available. In addition, long term credit (more than one year) and short term credit (less than one year) are also widely available in both local and foreign currency. Equity finance has limited availability and partial credit guarantees are available through

Neighbourhood SME financing: Jordan
© European Investment Bank, February 2016 21
the Jordanian Loan Guarantee Corporation although the uptake remains low. However, the full range of products is not available to microfinance clients and the small group of banks that target this market segment provide only credit products to micro-enterprises. Figure 9: How do you rate the availability in the market of the following instruments?
0%
20%
40%
60%
80%
100%
Credit Trade finance Leasing Guarantees Private equity
Very widely available Widely available Sometimes availableSeldom available Very seldom available N/A
Source: EIB Bank Survey of Enterprise Lending (2015) The terms of investment finance provided to SMEs typically includes high collateral requirements but projects that are eligible for interest rate subsidies can attract low rates of interest. Collateral requirements are high because of the lack of audited statements, weak feasibility studies, and general lack of transparency. Collateral requirements are typically over 120% of the loan value, and difficult for the SMEs to meet. As a result some creditworthy SMEs remain unfinanced. Moreover, the enforcement of basic contractual rights is cumbersome, time consuming and costly, representing a significant disincentive when lending to SMEs. To address this, several Jordanian banks use internal ratings systems for SME lending, which are based on a financial and qualitative analysis of SMEs. Figure 10: How do you rate the availability in the market of the following types of credit?
0%
20%
40%
60%
80%
100%
Local currency, short termloans < 1 year
Local currency, long termloans > 1 year
Foreign currency, shortterm loans < 1 year
Foreign currency, longterm loans > 1 year
Very widely available Widely available Sometimes availableSeldom available Very seldom available N/A
Source: EIB Bank Survey of Enterprise Lending (2015) Representative interest rates for SME lending are in the range 9 to 11%, which compares to rates for housing loans of 6-7% housing, and 7-8% for corporate clients. However, with interest subsidies provided through the central bank (see below) for eligible projects SME rates are more affordable at around 5%.

Neighbourhood SME financing: Jordan
© European Investment Bank, February 2016 22
In the microfinance sector there is an overlap between personal and enterprise lending. Entrepreneurs who offer personal assets or real estate as collateral have access to long term finance that would not be available on the basis of purely enterprise-based lending.
5.3. Funding of the intermediaries The sector has a strong deposit base with deposits accounting for 118% of GDP in 2014. Deposits are the main source of funding for Jordanian banks accounting for over half of total liabilities. 70% of deposits are term deposits, with 66% out of them coming from the private sector. Jordanian banks have been highly successful in attracting deposits from other countries in the region, such as Iraq, Palestine, and Syria. Deposit growth continued at 7% in 2014 and the loan deposit ratio fell to 64%. Government and IFI support for the SME sector includes provision of funding to banks. The CB support program channels low-cost funding to the banks, sourced from EBRD, Arab Banks, and World Bank6. The Central Bank lends to banks in the range 2% to 2.5% with maturity of 10 years for up to 5% of the performing loan portfolio of each bank. These funds are earmarked for lending to eligible customers at a fixed margin and fixed rate. As a consequence the normal SME interest rates in the range of 9 to 12% are reduced to 5% to 5.5%. Most Jordanian banks participate in the program. Eligible sectors include renewable energy, tourism, and industry. The Jordanian Loan Guarantee Corporation is a public company sponsored by the Central Bank with commercial banks as shareholders. It provides partial credit guarantee (first loss) up to 70% for SMEs. It provides lines for general SME lending and also supports special loans for specific uses. Use of the guarantees by banks has been low because the one-by-one approval process slows loan approval. The contribution to SME lending remains low. The outstanding guaranteed portfolio at the end of 2014 was valued at JD64.6 million spread over 3,599 credits. At the end of 2013, the guaranteed value was JD59.1 million spread over 3,306. The Jordan Enterprise Development Corporation (JEDCO) was set up to address specific gaps in access to finance in the Governorates where the business environment is particularly difficult. JEDCO provides technical assistance and access to finance for SMEs. A total of 150 MJD was allocated to JEDCO over an 8 year period with an annual investment ceiling of 25MJD/y. Terms to enterprises are on a profit-sharing basis with no interest charges. Typical terms include a 2-year grace period, 6-year repayment, no interest, and 10-25% share of profit. The IRR threshold for investments is 5%. The investment committee of JEDCO includes government ministries, and unions. JEDCO has not succeeded in co-financing with commercial banks.
6 The World Bank channels funding to SMEs via the Central Bank under the MSME Development Project for Inclusive Growth.
Neighbourhood SME financing: Jordan
© European Investment Bank, February 2016 23
6. GAPS/MARKET FAILURES
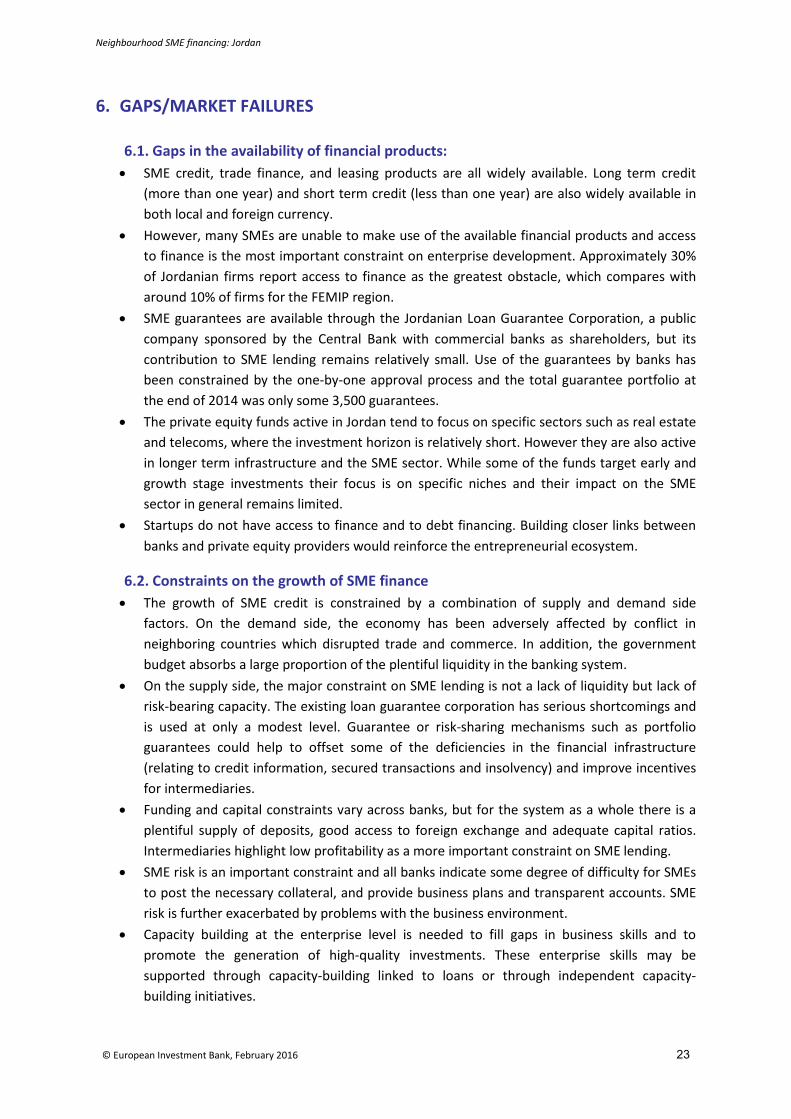
6.1. Gaps in the availability of financial products: • SME credit, trade finance, and leasing products are all widely available. Long term credit
(more than one year) and short term credit (less than one year) are also widely available in both local and foreign currency.
• However, many SMEs are unable to make use of the available financial products and access to finance is the most important constraint on enterprise development. Approximately 30% of Jordanian firms report access to finance as the greatest obstacle, which compares with around 10% of firms for the FEMIP region.
• SME guarantees are available through the Jordanian Loan Guarantee Corporation, a public company sponsored by the Central Bank with commercial banks as shareholders, but its contribution to SME lending remains relatively small. Use of the guarantees by banks has been constrained by the one-by-one approval process and the total guarantee portfolio at the end of 2014 was only some 3,500 guarantees.
• The private equity funds active in Jordan tend to focus on specific sectors such as real estate and telecoms, where the investment horizon is relatively short. However they are also active in longer term infrastructure and the SME sector. While some of the funds target early and growth stage investments their focus is on specific niches and their impact on the SME sector in general remains limited.
• Startups do not have access to finance and to debt financing. Building closer links between banks and private equity providers would reinforce the entrepreneurial ecosystem.
6.2. Constraints on the growth of SME finance • The growth of SME credit is constrained by a combination of supply and demand side
factors. On the demand side, the economy has been adversely affected by conflict in neighboring countries which disrupted trade and commerce. In addition, the government budget absorbs a large proportion of the plentiful liquidity in the banking system.
• On the supply side, the major constraint on SME lending is not a lack of liquidity but lack of risk-bearing capacity. The existing loan guarantee corporation has serious shortcomings and is used at only a modest level. Guarantee or risk-sharing mechanisms such as portfolio guarantees could help to offset some of the deficiencies in the financial infrastructure (relating to credit information, secured transactions and insolvency) and improve incentives for intermediaries.
• Funding and capital constraints vary across banks, but for the system as a whole there is a plentiful supply of deposits, good access to foreign exchange and adequate capital ratios. Intermediaries highlight low profitability as a more important constraint on SME lending.
• SME risk is an important constraint and all banks indicate some degree of difficulty for SMEs to post the necessary collateral, and provide business plans and transparent accounts. SME risk is further exacerbated by problems with the business environment.
• Capacity building at the enterprise level is needed to fill gaps in business skills and to promote the generation of high-quality investments. These enterprise skills may be supported through capacity-building linked to loans or through independent capacity-building initiatives.

Neighbourhood SME financing: Jordan
© European Investment Bank, February 2016 24
• Legal and institutional failures will require government initiatives to improve the business environment and incentives for the private sector, which will run in parallel with measures to improve access to finance.
Neighbourhood SME financing: Jordan
© European Investment Bank, February 2016 25
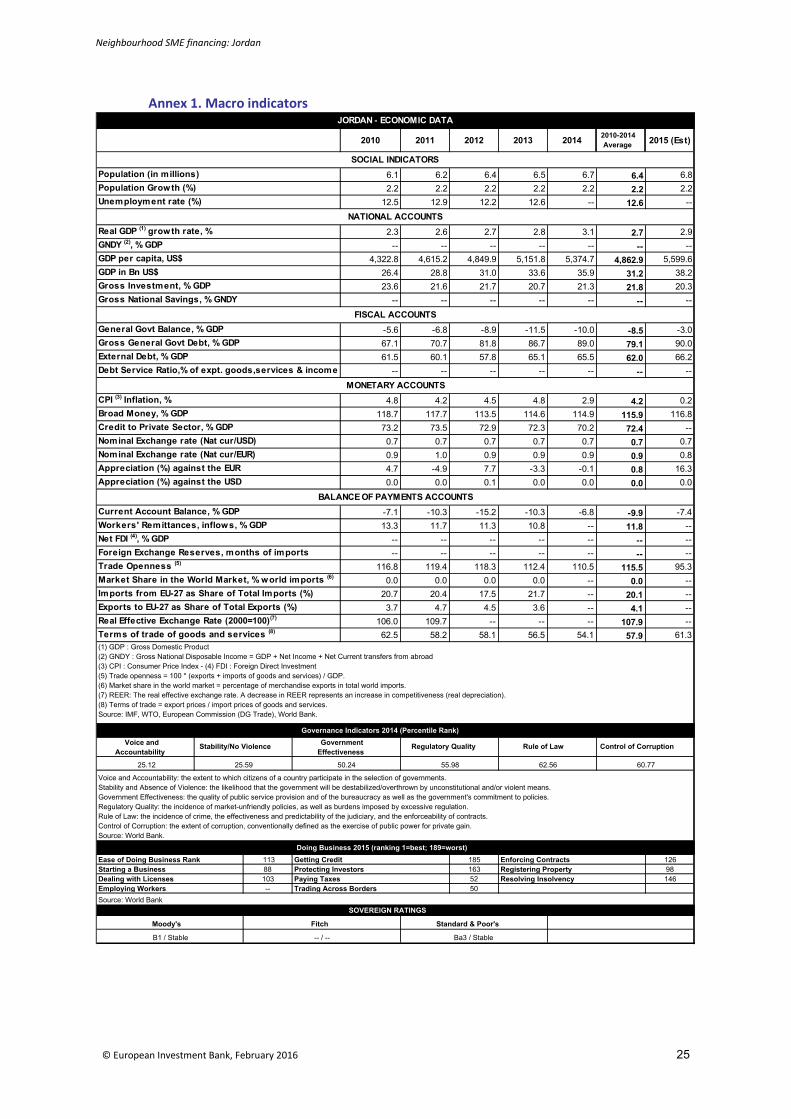
Annex 1. Macro indicators
2010 2011 2012 2013 2014 2010-2014 Average 2015 (Est)
6.1 6.2 6.4 6.5 6.7 6.4 6.82.2 2.2 2.2 2.2 2.2 2.2 2.2
12.5 12.9 12.2 12.6 -- 12.6 --
2.3 2.6 2.7 2.8 3.1 2.7 2.9-- -- -- -- -- -- --
4,322.8 4,615.2 4,849.9 5,151.8 5,374.7 4,862.9 5,599.626.4 28.8 31.0 33.6 35.9 31.2 38.223.6 21.6 21.7 20.7 21.3 21.8 20.3
-- -- -- -- -- -- --
-5.6 -6.8 -8.9 -11.5 -10.0 -8.5 -3.067.1 70.7 81.8 86.7 89.0 79.1 90.061.5 60.1 57.8 65.1 65.5 62.0 66.2
-- -- -- -- -- -- --
4.8 4.2 4.5 4.8 2.9 4.2 0.2118.7 117.7 113.5 114.6 114.9 115.9 116.873.2 73.5 72.9 72.3 70.2 72.4 --0.7 0.7 0.7 0.7 0.7 0.7 0.70.9 1.0 0.9 0.9 0.9 0.9 0.84.7 -4.9 7.7 -3.3 -0.1 0.8 16.30.0 0.0 0.1 0.0 0.0 0.0 0.0
-7.1 -10.3 -15.2 -10.3 -6.8 -9.9 -7.413.3 11.7 11.3 10.8 -- 11.8 --
-- -- -- -- -- -- ---- -- -- -- -- -- --
116.8 119.4 118.3 112.4 110.5 115.5 95.30.0 0.0 0.0 0.0 -- 0.0 --
20.7 20.4 17.5 21.7 -- 20.1 --3.7 4.7 4.5 3.6 -- 4.1 --
106.0 109.7 -- -- -- 107.9 --62.5 58.2 58.1 56.5 54.1 57.9 61.3
113 185 12688 163 98103 52 146-- 50Employing Workers
Getting CreditProtecting InvestorsPaying TaxesTrading Across Borders
BALANCE OF PAYMENTS ACCOUNTS
25.12 50.24
(1) GDP : Gross Domestic Product(2) GNDY : Gross National Disposable Income = GDP + Net Income + Net Current transfers from abroad(3) CPI : Consumer Price Index - (4) FDI : Foreign Direct Investment(5) Trade openness = 100 * (exports + imports of goods and services) / GDP.(6) Market share in the world market = percentage of merchandise exports in total world imports.(7) REER: The real effective exchange rate. A decrease in REER represents an increase in competitiveness (real depreciation).(8) Terms of trade = export prices / import prices of goods and services.Source: IMF, WTO, European Commission (DG Trade), World Bank.
JORDAN - ECONOMIC DATA
Ease of Doing Business RankStarting a BusinessDealing with Licenses
Enforcing ContractsRegistering PropertyResolving Insolvency
NATIONAL ACCOUNTS
SOCIAL INDICATORS
MONETARY ACCOUNTS
Current Account Balance, % GDP
Rule of Law
CPI (3) Inflation, %Broad Money, % GDPCredit to Private Sector, % GDPNominal Exchange rate (Nat cur/USD)
Foreign Exchange Reserves, months of importsTrade Openness (5)
Market Share in the World Market, % world imports (6)
Governance Indicators 2014 (Percentile Rank)
60.77
Control of Corruption
55.98
Voice and Accountability
Stability/No Violence
25.59 62.56
Government Effectiveness
Regulatory Quality
Doing Business 2015 (ranking 1=best; 189=worst)
Source: World BankSOVEREIGN RATINGS
Voice and Accountability: the extent to which citizens of a country participate in the selection of governments. Stability and Absence of Violence: the likelihood that the government will be destabilized/overthrown by unconstitutional and/or violent means.Government Effectiveness: the quality of public service provision and of the bureaucracy as well as the government's commitment to policies.Regulatory Quality: the incidence of market-unfriendly policies, as well as burdens imposed by excessive regulation. Rule of Law: the incidence of crime, the effectiveness and predictability of the judiciary, and the enforceability of contracts. Control of Corruption: the extent of corruption, conventionally defined as the exercise of public power for private gain.Source: World Bank.
Population (in millions)Population Growth (%)Unemployment rate (%)
Real GDP (1) growth rate, %
Moody's Fitch
Exports to EU-27 as Share of Total Exports (%)Real Effective Exchange Rate (2000=100)(7)
Terms of trade of goods and services (8)
Imports from EU-27 as Share of Total Imports (%)
GNDY (2), % GDPGDP per capita, US$GDP in Bn US$
Debt Service Ratio,% of expt. goods,services & incomeExternal Debt, % GDP
Gross Investment, % GDPGross National Savings, % GNDY
General Govt Balance, % GDPGross General Govt Debt, % GDP
FISCAL ACCOUNTS
B1 / Stable -- / -- Ba3 / Stable
Nominal Exchange rate (Nat cur/EUR)Appreciation (%) against the EURAppreciation (%) against the USD
Net FDI (4), % GDPWorkers' Remittances, inflows, % GDP
Standard & Poor's
Neighbourhood SME financing: Jordan
© European Investment Bank, February 2016 26
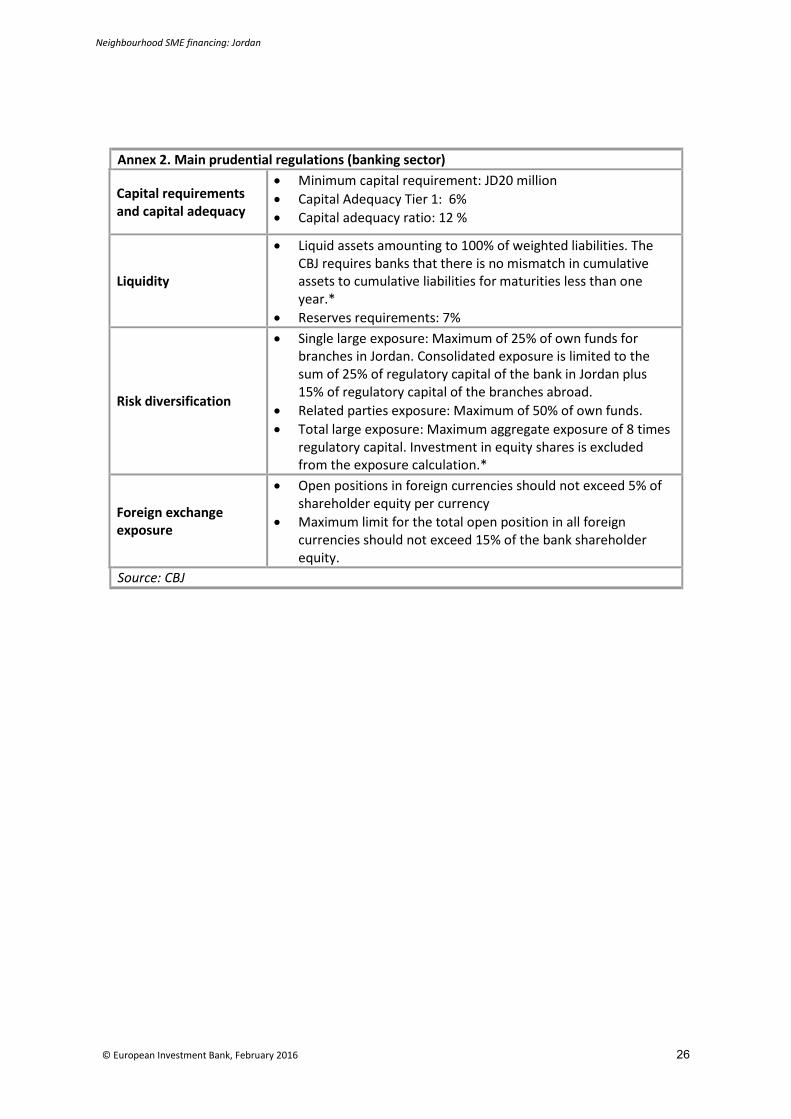
Annex 2. Main prudential regulations (banking sector)
Capital requirements and capital adequacy
• Minimum capital requirement: JD20 million • Capital Adequacy Tier 1: 6% • Capital adequacy ratio: 12 %
Liquidity
• Liquid assets amounting to 100% of weighted liabilities. The CBJ requires banks that there is no mismatch in cumulative assets to cumulative liabilities for maturities less than one year.*
• Reserves requirements: 7%
Risk diversification
• Single large exposure: Maximum of 25% of own funds for branches in Jordan. Consolidated exposure is limited to the sum of 25% of regulatory capital of the bank in Jordan plus 15% of regulatory capital of the branches abroad.
• Related parties exposure: Maximum of 50% of own funds. • Total large exposure: Maximum aggregate exposure of 8 times
regulatory capital. Investment in equity shares is excluded from the exposure calculation.*
Foreign exchange exposure
• Open positions in foreign currencies should not exceed 5% of shareholder equity per currency
• Maximum limit for the total open position in all foreign currencies should not exceed 15% of the bank shareholder equity.
Source: CBJ

Neighbourhood SME financing: Jordan
© European Investment Bank, February 2016 27
Annex 3: International Trade Jordan is an open economy, with substantial share of international trade. Jordan started opening its domestic markets in the 1990’s and has preferential trade agreements with a number of members of the League of Arab States, bilateral agreements with Egypt and Tunisia, and in 2000 became a member of the World Trade Organization (Ministry of Industry, Trade and Supply of Jordan). In 2011, the Council of the EU adopted negotiating directives for the DCFTA for Tunisia. In 2013, exports of goods and services amounted to 42% of GDP, while imports accounted for a higher share of 71%. Merchandise trade constituted 88% of GDP (World Bank, world development indicators). Against the background of regional geopolitical conflicts, Jordan continues to show signs of gradual steady improvements in economic activity. However, ongoing conflict in Syria and Iraq has negative spillover to the economy, impeding its external trade and investment sentiment.
Mineral fuels, agricultural products, machinery and chemicals account are the largest commodity groups in the international trade structure of Jordan. The two largest exporting industries in Jordan are the pharmaceuticals and the phosphate and potash extraction industries. About 75% of Jordan's pharmaceutical production is exported. Jordan's phosphate and potash extraction industry is among the largest in the world (European Commission). In 2014, “Chemicals”, “Miscellaneous manufactured articles” and “Food, live animals and beverages, tobacco”, the top commodity groups of Jordan’s domestic exports, accounted for 25%, 24% and 20%, respectively. As for the imports, “Mineral fuels and lubricants” - being the largest contributor - makes up 27% of imports, including crude oil and petroleum products. It is followed by “Machinery and transport equipment” with 18% of goods imports and “Food, live animals and beverages, tobacco” – 17% (Jordan Department of Statistics).
Jordan’s major trading partners are the Arab countries, accounting for more than one third of its external trade. The other important region is composed of Non Arab Asian Countries. From the country perspective, Saudi Arabia, the US and China – being the largest contributors - account for about one third of Jordan’s external trade. The US, Iraq and Saudi Arabia were the top three export destinations, accounting for 48% of goods exports. Due to the ongoing conflict, exports to Iraq have considerably decreased. Saudi Arabia, China and the US are the major importers in Jordan, contributing 20%, 11% and 6%, respectively (Jordan Department of Statistics).
Jordan’s external trade analysis suggests that one of the most important challenges for the country is to implement measures that will open new markets for exporting enterprises. Jordan has various free trade agreements and could get higher benefits from these arrangements. Given the vulnerable political and economic situation in the region, the diversification of export destinations has become even more crucial. Therefore, it is necessary to improve international competitiveness by strengthening innovative and production capacities and access to financing. The Ministry of Industry, Trade and Supply of Jordan has developed the National Export Strategy for the years 2014-2019 to support engagement in international trade. The document highlights that access to various types of finance to facilitate exports is limited. On the demand side, poor awareness of trade finance opportunities imposes further constraints on trade capacity. Absence of official trade finance statistics holds back the comprehensive analysis of this segment.
Neighbourhood SME financing: Jordan
© European Investment Bank, February 2016 28
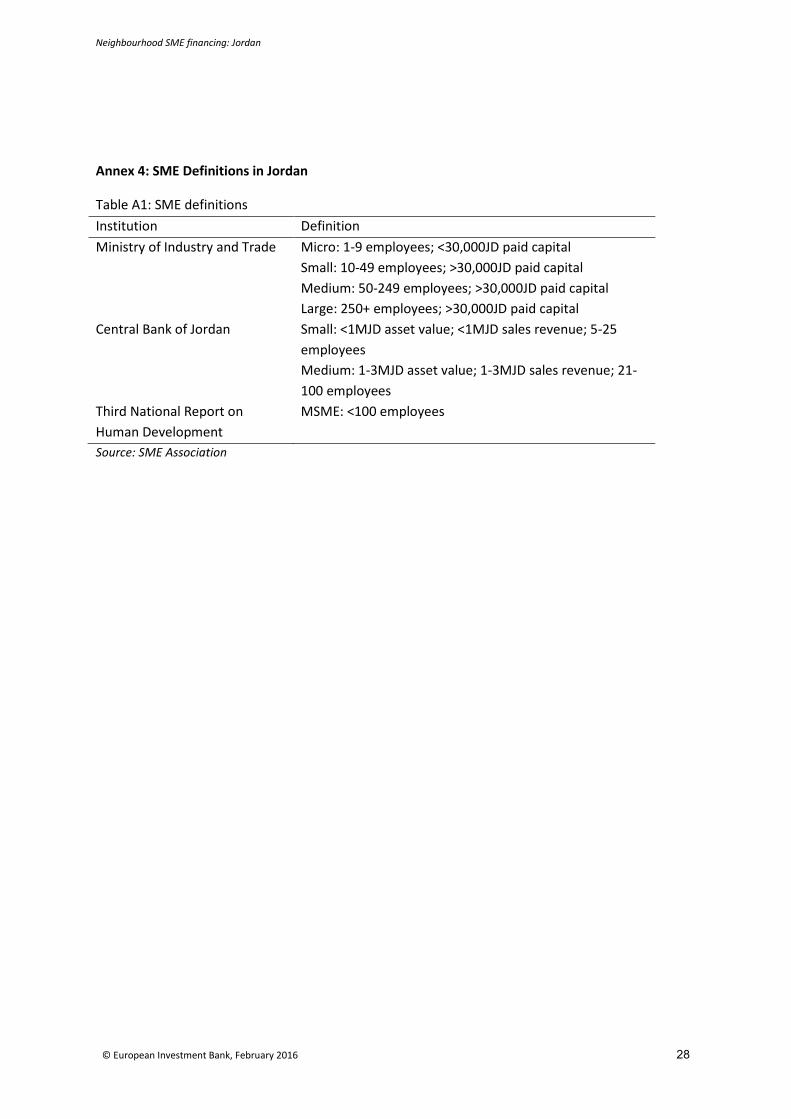
Annex 4: SME Definitions in Jordan
Table A1: SME definitions Institution Definition Ministry of Industry and Trade Micro: 1-9 employees; <30,000JD paid capital
Small: 10-49 employees; >30,000JD paid capital Medium: 50-249 employees; >30,000JD paid capital Large: 250+ employees; >30,000JD paid capital
Central Bank of Jordan Small: <1MJD asset value; <1MJD sales revenue; 5-25 employees Medium: 1-3MJD asset value; 1-3MJD sales revenue; 21-100 employees
Third National Report on Human Development
MSME: <100 employees
Source: SME Association


Economics DepartmentU [email protected]/economics
Information Desk3 +352 4379-220005 +352 4379-62000U [email protected]
European Investment Bank98-100, boulevard Konrad AdenauerL-2950 Luxembourg3 +352 4379-15 +352 437704www.eib.org
© EIB 04/2016 EN © EIB GraphicTeam


