Page 1
1
Jordan rollover system test results
D Friedman, J Paver, Ph.D., S Bozzini, C Shipp
Center for Injury Research, Goleta, California
Abstract - Initial static measurements identified vehicle parameters affecting roof crush performance such as pitch and lateral
loading. The JRS fixture itself was designed to replicate an on-the-road rollover, one roll at a time in a laboratory setting with a
small footprint. Since 2004, more than 50 dummy-occupied vehicles have been tested dynamically with the JRS. Up to 50 data
channels were collected and examined as possible metrics. These included vehicle structural, geometric, dummy injury measures
and kinematic data. The selection of parameters as possible test criteria, independently or in combination, was based upon results
of dynamic tests by CfIR and other laboratories, case studies, and real-world crash databases.
This study examined 1.) Vehicle structural and geometric measures and 2.) Dummy injury measures. The degree of residual roof
crush was selected as the vehicle structural injury risk measure. The Integrated Bending Moment (IBM) and criteria were selected
as the dummy neck injury measure. Research on other body part injury measures is in process. A major observation was that the
severity and pattern of injury is dependent on the variable and unknown musculature tension and flexibility of the human spinal
column during the rollover and the dummy’s ability to replicate it in dynamic tests.
Keywords: Rollover, testing, protocol, biomechanics
INTRODUCTION
Government regulatory and manufacturers’ efforts to reduce rollover injuries and fatalities
Rollover injury potential and manufacturer’s efforts to reduce casualties were highlighted by
congressional testimony in 1965 and incorporated into the Safety Act of 1966 [1]. An advanced notice of
proposed rulemaking in 1968 highlighted the intrusion as a major contributor to injury [2]. The 1970
notice of proposed rulemaking of FMVSS 208 incorporated an unrestrained occupant containment
provision in a 30 mph dolly rollover test [3]. In 1971, the notice of proposed rulemaking of FMVSS 216
called for two sided static platen test and 10° of pitch requiring the strength to weight ratio of 1.5 before 5
inches of platen displacement [4]. Chrysler sued in federal court claiming the containment test was not
repeatable [5]. Manufacturers objected to the size and pitch angle of the static test platen requesting a one
sided test with a large platen and a 5° pitch angle, which was then temporarily authorized in 1973 as
FMVSS 216 [6]. In spite of these efforts rollover fatalities increased from 1,400 in 1965 to 5,000 in 1980
and 7,000 in 1990 [7].
Through a series of large-scale experimental rollover tests with 1983 Malibu vehicles, manufacturers
claimed that peak neck load occurred before significant roof crush suggesting that injury occurs from
diving into the roof prior to roof deformation. The National Highway Traffic Safety Administration,
NHTSA, in 1990, applied the FMVSS 216 test to light trucks and vans. In 1995 NHTSA required padding
to the upper interior in FMVSS 201 to prevent head injury. After nine years of study in 2001, NHTSA
reported on alternate means of mitigating ejections [8]. Industry sponsored statistical studies in 1995 and
2005 suggests that there was no relationship between incapacitating and fatal injury and vehicle strength to
weight ratio (SWR). In 2001 NHTSA requested comment on what to do about the 10,000 fatalities and
26,000 severe injuries in rollover accidents [9]. Ford sponsored the development of the Controlled
Research Impact System (CRIS), a repeatable means of testing dummies in vehicles dynamically [10]. By
precisely locating the head of the dummy on the roof panel at the point of touchdown, it was shown that
the same dummy injury measures would occur in a production and a roll caged vehicle. In 2007 NHTSA
issued an NPRM for FMVSS 126 to incorporate electronic stability control in all vehicles In 2009 NHTSA
Page 2
2
adjusted FMVSS 216 to require two sided testing with a minimum SWR of 3. [11,12] In 2010 it issued
FMVSS 226 to require tests to mitigate ejection [13].
Independent, academic, advocate, and litigation research on behalf of rollover victim
catastrophic injuries and fatalities
Post accident investigations during the 1960’s characterized a relationship between roof crush and
head/neck injury. However, establishing a causal relationship required proof of the structural deformation
and the dynamic dummy interaction during the rollover event. Means were not available until the late
1970s to conduct experimental tests with anthropomorphic dummies. In 1978 NHTSA's Minicars
Research Safety Vehicle proved that retained composite glazing in a strong roofed vehicle could contain
unrestrained occupants in the FMVSS 208 Dolly rollover test [14]. Analyzing, clarifying and publishing
corrections to the misleading statements regarding the Malibu tests were hampered by data confidentiality.
In 1996 a statistical study of the NASS files indicated that for restrained occupants the amount of roof
crush was directly related to head and neck injury [15]. In 1998 the specific relationship was detailed and a
series of human subject drop tests to a non-deforming roof from 12 inches, 20 inches and 36 inches were
published [16]. It was not until 2000 when in a Lambert versus General Motors litigation, a causal
relationship was established and the jury verdict was affirmed by opinion of the appeals court [17].
In response to the NHTSA request for comment in 2001, Dr. Carl E. Nash and Mr. Donald Friedman co-
founded the nonprofit Center for Injury Research (CfIR) in Santa Barbara, California. Through donations,
CfIR purchased a Jordan Rollover System, a laboratory test fixture capable of repeatable rollover testing
of full-size vehicles and dummy occupants. Over the next nine years CfIR conducted over 300 rolls of 50
different vehicles and submitted to NHTSA over 100,000 pages of data, analysis, video and commentary
on all aspects of rollover research [18]. In 2008, 21 JRS test results were compared to IIHS statistical
injury rate data and confirmed a substantial benefit from increased roof SWR [19].
METHODS
There were four different aspects to the research: 1.) Structural; 2.) Biomechanical; 3.) Test protocols; 4.)
Interpretation and analysis of results. Each aspect of the work performed including methodology,
assumptions, hardware, observations and analysis are discussed separately.
Structural research methods
The claw survey tool
Observations from some 400 serious injury rollover accident investigations prior to 2000 described a
rollover as a series of contacts with the ground by the nearside roof rail, then to the far side roof rail, then
the far side wheels, etc. The crush is most extensive at the A-pillar on the far side due to the nature of the
rollover. FMVSS 216 static test platen data was available for many vehicles measured at 5° of pitch and
25° of roll. A survey tool was developed to measure the force required to crush the roof on the far side
12.5 cm (5”) when loaded from the sill on the nearside at an approximately 45° angle. Some 30 vehicle
compartments were measured.
In all of the vehicles tested the roof strength as measured by the Claw was 25 to 50% less than the FMVSS
216 test results. As a survey tool, the Claw results were only indicative of a problem, but inexpensively
identified a roof strength geometry effect not previously described [20].
Page 3
3
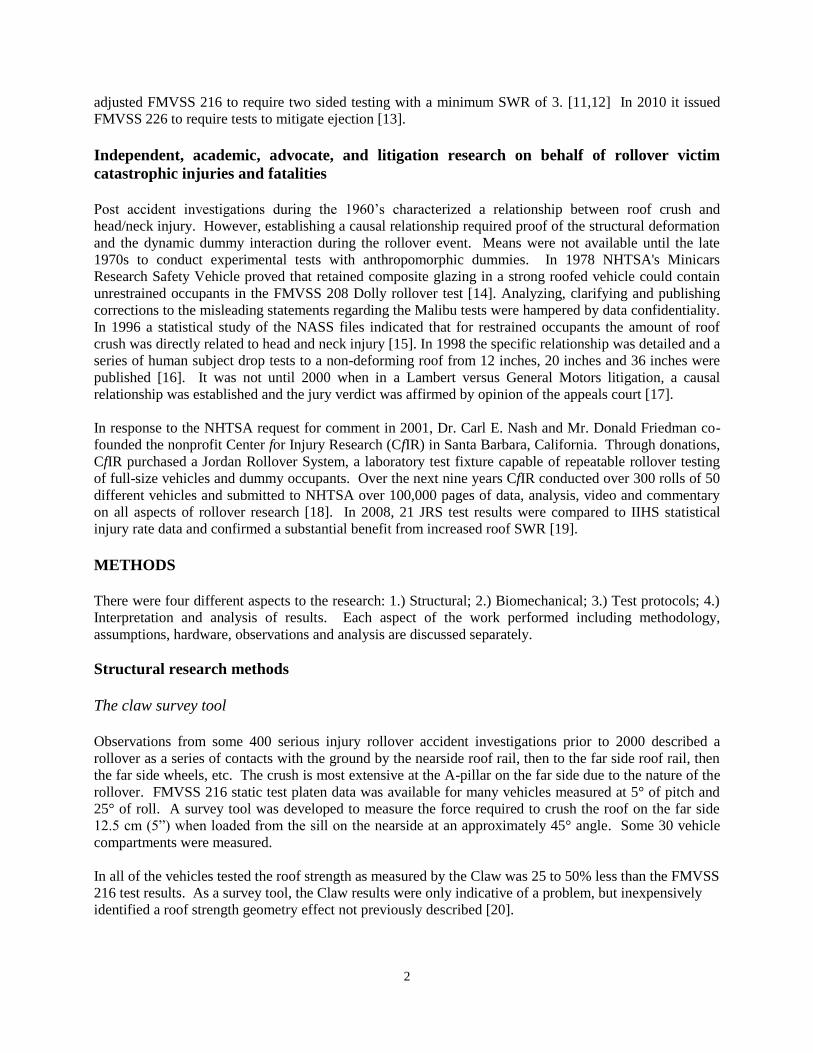
The M216 two sided static test fixture
The Claw results were encouraging enough such that a precision repeatable fixture, the M216, was
constructed in 2002 to conduct static tests like FMVSS 216, but sequentially on both sides of the roof and
with variable pitch and roll angles in 5 degree increments as shown in Figure 1. After some
experimentation the angles chosen were 10° pitch at 25° of roll on the first side and 10° pitch and 40° of
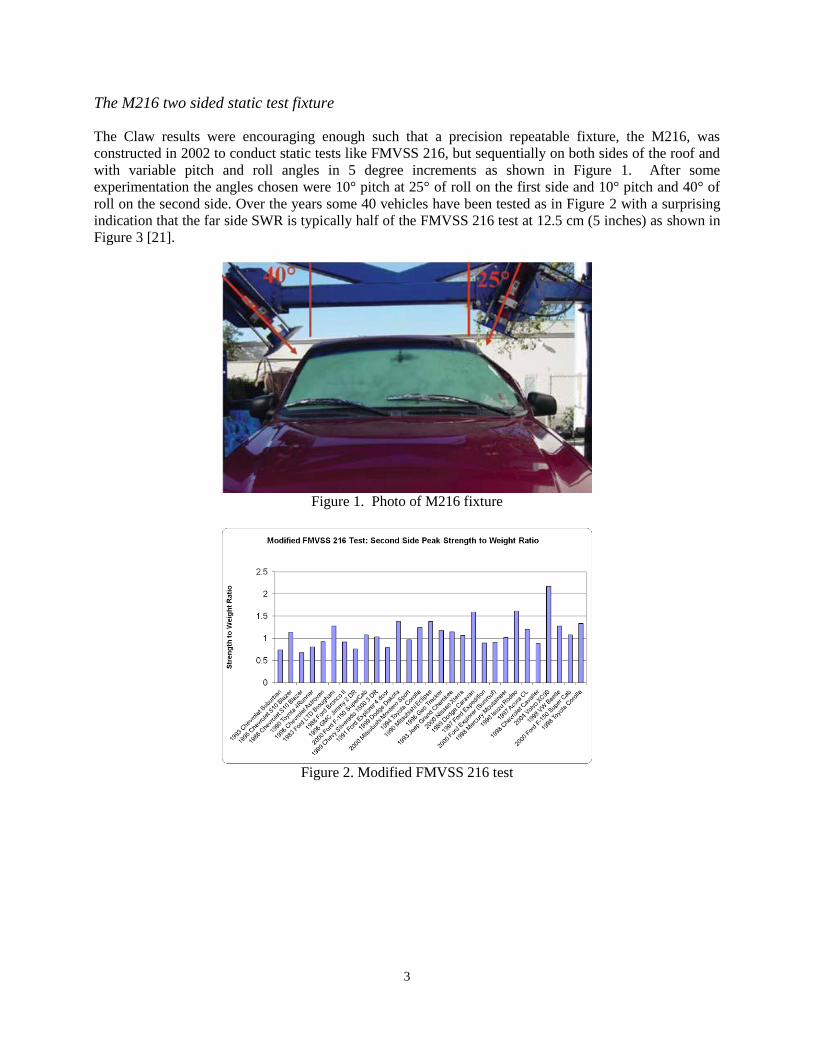
roll on the second side. Over the years some 40 vehicles have been tested as in Figure 2 with a surprising
indication that the far side SWR is typically half of the FMVSS 216 test at 12.5 cm (5 inches) as shown in
Figure 3 [21].
Figure 1. Photo of M216 fixture
Figure 2. Modified FMVSS 216 test
Page 4
4
Figure 3. M216 test results
Those results and the publication of a paper in 2002 about the Controlled Rollover Impact System (CRIS)
fixture warranted the commissioning of the development and construction of a laboratory rollover fixture
[22].
The Jordan Rollover System (JRS) dynamic test fixture
The system was designed by Mr. Acen Jordan, a well-known test equipment engineer who had built,
delivered and installed crash sleds for major manufacturers around the world. The system came online in
Santa Barbara, California in 2004 and can be seen in Figure 4.
Figure 4. Key components of the JRS: 1) vehicle, 2) cradle/spit mount, 3) moving roadbed, 4) support
towers, 5) coupled pneumatic roadbed propulsion and roll drive
Page 5
5
The JRS rotates a vehicle attached to a cradle, at a prescribed roll rate while the road bed travels toward
the vehicle. The subject vehicle is then dropped onto its roof at a prescribed roll rate and angle as the bed
travels under the car at a predetermined speed, representing the linear velocity of a rolling vehicle.
University of New South Wales in Australia has a new, gantry based model, the JRS II for use in their
CrashLab as shown in Figure 5.
Figure 5. JRS II at CrashLab in Sydney, Australia
As a test device, the JRS repeatedly executes a protocol which impacts the roof of the vehicle with a
moving road bed. Instrumentation and redundant high-speed video inside the vehicle measures dynamic
structural deformation. Load cells in the roadbed measure the roof to ground forces as the vehicle rolls.
External measuring devices in the towers, real and high speed video cameras document the cg vertical
motion and damage during the event. [23] JRS results have been validated by finite element analysis
(FEA) modeling for constrained and unconstrained rollover configurations. However, until recently the
extensive finite element modeling has focused on rollover parameter sensitivity.
The comparative roof crush data is a valuable source for the effect of parameter variations in the design of
the roof. Using identical protocols or normalizing the roof crush of multiple protocols through
transformation functions to a single protocol can provide a comparative analysis of the extent of roof crush
deformation between vehicles.
BIOMECHANICAL RESEARCH METHODS
The ultimate value of a dynamic test is to assess not only the injury risk but the injury measures as
compared to injury criteria received by a reasonably biofidelic anthropometric device. Compliance and
New Car Assessment Program (NCAP) tests are evaluated by such means in frontal and side impact
experimental crashes. Variations of the frontal test Hybrid III dummy have been used in research for side
impact and rollovers. However there is a fundamental difference in the performance of a Hybrid III
dummy when subjected to high acceleration inertial forces (as in belted frontal crashes) as compared to the
direct impact loading of an intruding structural surface.
Page 6
6
Cervical spine injuries
In 1982, Allen found that approximately 60% of serious neck injuries occurred in flexion, 30% in
extension and 10% in vertical compression [24].
Considering the muscular and positional variability of the human victims and their kinematics relative to
the vehicle dynamics, impacts, and structural distortions there is no typical answer. This led to a major
observation that the severity and pattern of injury is dependent on the variable and unknown musculature
tension and flexibility of the human spinal column during the rollover and the dummy’s ability to replicate
it in dynamic tests. In these tests, the reduction in cervical tension and flexed orientation of the hybrid III
neck had a profound effect on characterizing neck flexion injuries. The lack of flexibility and stiffness of
the thoracic spine of the Hybrid III precluded simulating head injuries and ejection as well as shoulder
loading of the thorax and thoracic spine [25].
The approach taken was to gather all the data and adjust the traditional methodology by choosing first
those most typical parameters. The real world data files suggested that quadriplegia and paraplegia were
lower neck bending injuries (bilateral locked facets), while death was usually attributed to upper neck cord
damage affecting pulmonary and circulatory functions at C1 to C3. Both upper and lower neck six axis
load cells were installed.
The Hybrid III neck is axially aligned while the human neck has lordosis affecting how it is loaded. For
the two to match, it was estimated that removing the lordosis required flexing the neck approximately 30°.
The dummy manufacturer (Denton) made such an adapter, part # 10022-29224C. The difference in
flexion stiffness between the Hybrid III and a human un-tensed neck was studied. It was found that the
Hybrid III stiffness could be traced back to measurement of young volunteer military personnel, not at all
characteristic of the typical vehicle occupants [26].
Again Denton came to the rescue by molding a Hybrid III neck with 30 rather than 60 durometer rubber,
part # 78051-336-special. The stiffness was compared and calibrated statically and dynamically to the
production neck in order to preserve the corridors and determine the applicable peak IARV’s. It turned
out that it was about 30% as stiff as the original in flexion and extension and about 60% as stiff in
compression [27].
Studies of the trajectory of the vehicle preceding the roll indicated that the driver would experience pre-
trip yaw and trip accelerations of 0.7 to 1G towards the near side. Experiments with human occupants and
Madymo modeling (as part of the Far Side Project) indicated that the subject would lean to the near side
seat or center console so far that it would be out of the shoulder belt [28]. It should be noted that the
lumbar joint is also too stiff and the thoracic spine is rigid and both should be much more flexible.
In a rollover the neck is subject to three-dimensional moments which combine to bend the neck in a
momentum exchange. It was found from pendulum tests that peak forces and moments are misleading
indicators of neck bending injury and that a way of characterizing the momentum exchange would be
more accurate and reliable. This was accomplished by developing the Integrated Bending Moment (IBM)
where the time history of the composite bending moments are integrated over the interval of significant
loading [29].
In summary, the Hybrid III dummy has been modified by flexing the neck forward 30°, reducing the
bending stiffness or musculature to 30% of the production version, adding a six axis load cell to the lower
neck and positioning the dummy 30° forward and leaning towards the near side against the console at 1G.
Page 7
7
Biomechanical criteria
Pendulum tests of the production and modified Hybrid III necks dispelled claims that short-duration peak
loads are good predictors of lower neck bending injury [30,31]. Instead, a momentum exchange measure,
the Integrated Bending Moment (IBM), integrated the composite lower neck flexion moment My and the
lateral moment Mx over the time duration above a minimum moment level [32]. Figure 6 illustrates the
IBM as a dummy injury measure that distinguishes between production and reinforced roofs; the area
under the production roof curve (more crush) is greater than the area under the reinforced roof curve (less
crush).
Illustration of IBM Results
7
R oll 1: R es idual C rus h and IB M[F ar A-P illar]
(2007 J eep G ra nd C herokee)
(2007 Honda R idg e line)
(2007 C hevy T a hoe) (2006 C hrysler 300)
(2006 P ontia c G 6)
(2006 Hyunda i S ona ta )
(2007 VW J etta )(2005 Volvo X C 90)
(2010 T oyota P rius)
(2008 S c ion x B )
(2009 Nissa n Versa )
(2009 C hevy Ma libu)
(2007 T oyota C a mry H)
(2007 Honda C R -V)
(2007 T oyota C a mry)
y = 0.2134x + 0.6003
R2 = 0.7928
0
1
2
3
4
5
6
7
8
9
10
0 5 10 15 20 25 30 35
IB M
Re
sid
ua
l Cru
sh
(in
)
Figure 6. Illustration of IBM results Figure 7. Residual crush vs. IBM
Dummy injury measure vs. residual roof crush
Figure 7 is a scatter plot of residual crush and the IBM for a 15 mph, 190°/sec, 5° pitch roll. The plot
shows unacceptable neck injury severity for an IBM of 13.5 or more.
Residual headroom vs. IBM
The scatter plot of Figure 8 shows the effect of post-crash residual headroom and indicates that an IBM of
13.5 corresponds to 2.5 cm (one inch) of post-crash positive headroom. NHTSA has reported that post-
crash negative headroom is 5 times more injurious than no or positive headroom.
R oll 1: R es idual Headroom Vs IB M
(2007 J eep Grand
C herokee)
(2007 Honda R idgeline)
(2006 C hrys ler 300)
(2006 P ontiac G6)
(2007 C hevy Tahoe)
(2005 Volvo XC 90)
(2007 VW J etta)
(2007 Toyota C amry)(2009 Nis s an Vers a)
(2007 Honda C R -V)(2007 Toyota C amry H)
(2010 Toyota P rius )
(2008 S c ion Xb)
(2009 C hevy Malibu)
(2006 Hyundai S onata)
y = -0.2635x + 4.5394
R2 = 0.6599
-4
-3
-2
-1
0
1
2
3
4
5
6
7
0 5 10 15 20 25 30 35
IB M
Res
idua
l Hea
droo
m (i
n.)
Figure 8. Residual headroom vs. IBM
CfIR compared injury risk evaluations using the 2003 Mertz and Prasad IARV [33], the 1998 Pintar
flexion bending moment criteria and the IBM [34]. In more than a dozen JRS tests (see Figure 7), it was
Page 8
8
found that the IBM correlated well with residual crush (and injury) and was more independent of dummy
head-neck position than the IARV [35,36].
IARV and IBM criteria for the low durometer neck are shown in Table I along with the previously
identified production and human criteria.
Table I. Summary Hybrid III developed bending and compression criteria
Neck Type
My
(Nm)
Flexion
My (Nm)
Extension
Mx
(Nm)
Axial
Fz (N) IBM
Intrusion
Speed
(mph)
Production Upper 190 -78 134 10,000 13.5 7
Production Lower 380 -156 268 8,000 13.5 7
Low Durometer
Upper 50* -22* 37* 6,300* 13.5 7
Low Durometer
Lower 126 -52 89 3,300 13.5 7
Human/Cadaver** 58 1,500 13.5 7
*Values estimated by scaling lower neck
**Estimated high probability criteria of a lower neck Major Hyperflexion bending injury from regression curves of experiments in
Reference Figure 3 of “Mechanisms of Hyperflexion Cervical Spine Injury" by Pintar and Yogananda 1998
Injury risk vs. residual roof crush ratings
Figure 9 is a plot of injury risk as a function of residual crush as defined by Dr. Mandell, et al. [37]. It
shows from NASS and CIREN data that the probability of death and serious-to-fatal head, spine and spinal
cord injury increases rapidly with cumulative residual crush over the occupant’s seating position. It also
shows the odds ratio as a function of residual crush.
Figure 9. NASS/CIREN probability and adjusted odds
The Mandell chart forms the basis for an injury risk rating. It identifies the area below the first line at 3.5
inches to represent “GOOD” performance. The area below the second line at 6 inches represents a 60%
increased probability of death and serious injury and would be “ACCEPTABLE”. The area above the 6-
inch line and below 12 inches represents 2.8 times the probability of death and injury and would be rated
“POOR”. Only vehicles of the 1980’s and early 1990’s should rate in the area above 12 inches, where the
probability of death and injury is 5.7 times the nominally good performance.
Page 9
9
TEST PROTOCOLS
There are annually approximately 250,000 rollover crashes with about 400,000 occupants in the U.S.,
causing about 10,000 deaths and at least 16,000 serious to fatal injuries according to NHTSA in 2001 [38].
In 2003 NHTSA identified 10,000 fatalities and 30,000 serious to fatal injuries [39]. About half the
fatalities are ejection related and half the serious injuries are severe to critical. More than 95% of the
rollovers occur in less than 8 quarter turns. About 94% of all occupants are not seriously injured.
In dealing with this problem, the earliest tests on the JRS in 2004 were case related. At the time there was
little credible evidence about the relationship between strength to weight ratio and the amount of rollover
roof crush. As a laboratory device the JRS was configured to test bodies-in-white (vehicle compartments)
by mounting on a special cradle which could be adjusted by weights to replicate the roll moment of inertia
and CG location. In addition weights could be added to replicate the entire vehicle and its original strength
to weight ratio or to simulate the effect of higher strength to weight ratios by reduced mass. For these tests
CfIR adopted a test protocol of 15 miles an hour and a 190° per second roll rate for each roll. Starting with
the original roll moment of inertia and a lightweight compartment we could assess the amount of roof
crush with a high strength to weight ratio and conduct subsequent rolls with the same protocol to gauge
the effect of lower and production (normal) strength weight ratios. Observations from the first six of these
never before available tests were published in the International Journal of Crashworthiness in 2006 [40].
The data collected was submitted in response to NHTSA's request for comment on modifications of
FMVSS 216 and got the attention of their management and advocate organizations such as the Center for
Auto Safety, Public Citizen, Automobile Safety Research Institute and their sponsors in particular the
Santos Family Foundation and State Farm insurance. The support upgraded the machine, procedures,
accuracy and test repeatability to avoid the previous criticisms. In the course of time some 300 rolls were
conducted on more than 50 vehicles using basically three protocols: two rolls at 15 miles an hour and 190°
per second roll rate, the first at 5° of pitch and the second at 10° pitch; a one roll protocol at 18 miles an
hour, 210° per second and 10° pitch; and a one roll event at 20 mile an hour, 280° per second and 10° of
pitch.
Continued interest in dynamic testing and test results at NHTSA and the Insurance Institute for Highway
Safety led to a final rule upgrading FMVSS 216 to require two sided testing and a strength to weight ratio
requirement of 3.0 in 2009 and the initiation of a five-year program to develop a dynamic test procedure
and a JRS patent based laboratory fixture at the Center for Applied Biomechanics at the University of
Virginia in Charlottesville Virginia (UVa).
UVa published four papers regarding their progress on parametric variations of possible protocols,
Madymo simulations of injury potential using a facet dummy with an articulated spine and the fixture's
ability to replicate rollovers with and without constraints [41,42,43,44]. ASRI at GWU has been
producing finite element analysis papers characterizing the effect on intrusion of test protocols and vehicle
characteristics [45].
The stated objective of the UVa 5-year multivariate NHTSA project is to characterize a real-world rollover
(i.e., to define the global issue). CfIR seeks, more specifically, to identify the rollover segment with the
greatest serious injury potential for FMVSS 216 compliant vehicles that would be consistent with a
compliance or NCAP comparative evaluation dynamic rollover test. This process requires evaluating the
injury potential sensitivity of each segment and its influence on the following segment.
Since it has been shown that 95% of single vehicle rollovers and serious-to-fatal injuries occur within 8
quarter turns [46], the Center for Injury Research has taken a pragmatic view of a representative real world
protocol for an NCAP or compliance test, recognizing that the choice of such a protocol should represent
Page 10
10
the injury consequences of vehicles compliant with FMVSS 216 and 226. CfIR defined 10 segments of a
2-roll event and analyzed their consequences in Table II below.
Table II. List of phases and the injury probability
From case investigations, dolly rollover tests, NASS analysis of serious injury rollovers, and JRS
experiments CfIR considered the injury potential of each phase and drew the conclusion that the most
harmful phase of potential injury was the ballistic trajectory of the first roll. Segment 5, where the
“vehicle roof impacts with the road” with the “potential for severe head/neck/ spine injuries,” is the
obvious choice for a test protocol. The first near side roof touchdown of a two roll event would be at
about 32 KPH (20 miles an hour) and a roll rate of about 260° per second with 10° of negative pitch and a
drop height of about 10 to 15 centimeters (See Table III). For JRS tests the dummy is tethered forward and
towards the passenger side. This is accomplished by rotating the vehicle to minus 90° (passenger side
down) exposing the dummy to 1 G and locking the tether from 30° forward of lateral, before resetting the
initial roll angle for the test. The tether is electronically released at 30° of initial roll. The dummy would
have the biomechanical characteristics discussed previously.
Table III. Real-world rollover protocol
The Proposed Real-World Rollover Protocol
Road speed 20 mph ± 5 mph
Roll rate @ near-side impact 270 °/sec ± 20%
Pitch 10° ± 5°
Roll angle at impact 135° ± 10° and/or 185°
Drop height 10 cm to 22 cm (4 to 9 inches )
Yaw angle 15° ± 15°
Dummy initially tethered @ 1 g and 60° toward the near side.
RESULTS
Analysis and interpretation
Page 11
11
Low-severity JRS test protocols included 1- and 2-roll dynamic tests of production and reinforced
vehicles. The vehicles were compared by residual roof crush, injury risk and dummy injury measures.
Disparities relative to SWR were identified and attributed to effects of other parameters that confounded
the rating process. For example, dummy injury measures were also related to dynamic crush, crush speed
and duration, headroom, belt excursion, and motion of the center of gravity (CG) in the ground reference
plane. These studies rely on the generic character of vehicles in the fleet and validating tests that can
identify and factor in generic anomalies. It is not a substitute for full-scale testing, but may provide a
market incentive for manufacturers to improve safety and reduce casualties [47].
Vehicle structural and geometric parameter sensitivity
Residual and cumulative vehicle roof crush has been found to be sensitive to several vehicle and
geometric parameters (e.g., SWR, pitch, major radius, roof elasticity and road speed/roll rate). These
relationships have been used to predict the dynamic injury risk to occupants of as yet untested vehicles and
to identify atypical vehicle performance. The effectiveness of that procedure was demonstrated and
reported in 2011[47].
Strength to weight ratio (SWR)
In 2008, JRS roof crush data plotted as a function of SWR had about the same slope as IIHS’s analysis to
an SWR of 4 and inferred a reduced injury rate to about 5% [48]. That chart incorrectly projected the JRS
data to an SWR of 5. Subsequent tests of vehicles with SWR above 4 show a substantially reduced
effectiveness with increasing SWR. The example in this paper considers the performance of vehicles with
SWRs from 2.1 to 6.0. This wide range is not representative of future vehicles, but results in the revised
SWR versus cumulative residual crush in Figure 10.
R oll 2: C umulative R es idual C rus h and S WR
(2009 V W Tiguan)
(2007 V W J etta)
(2006 Hyundai S onata)
(2007 Toyota C amry)
(2010 Toyota P rius )
(2009 C hevrolet Malibu)
(2005 V olvo XC 90)
(2006 C hrys ler 3000)
(2007 J eep G rand C herokee)
(2007 Honda R idgeline)(2007 C hevy Tahoe)
y = -2.1529x + 13.856
R2 = 0.7558
0
2
4
6
8
10
12
0 1 2 3 4 5 6 7
S treng th to Weig ht R atio (S WR )
Re
sid
ua
l C
rus
h (
in.)
Figure 10. Residual roof crush vs. SWR
Vehicle pitch
A case-by-case study of 273 serious injury rollover crashes contained in NASS shows that more than 80%
of the study vehicles had hood and top of fender damage that could only have occurred as a result of a roll
with more than 10° pitch. The JRS test results in Figure 11 shows the effect of pitch; there was greater
residual crush at 10° of pitch compared to similar tests at 5° of pitch after roll 2 [49].
Page 12
12
Figure 11. Comparison of residual crush vs. SWR after roll 2 at 5° vs. 10° pitch
The diverging correlation lines show that, for vehicles with an SWR less than 3, there is little or no
difference between the cumulative residual crush in second rolls at 5° and at 10° pitch. However, there is
a large difference (60-175%) between the cumulative residual crush at 5° and 10° pitch for vehicles with
SWRs greater than 3. This may be due to the high elasticity of vehicles with high SWR.
Road bed speed and proportional roll rate
The residual crush has been shown to be a function of the roadbed speed and the proportional roll rate of
the CfIR JRS fixture as shown in Figure 12. The transfer of momentum from the linear roadbed motion to
the rotation rate of the vehicle is well documented and seems to suggest that residual crush is mostly a
function of the far side roll rate. The far side roll rate is increased by 50% as a result of frictional contact
with the higher speed roadbed.
Avg. Residual Crush vs. Road Bed Speed at 10°pitch for
23 Production Vehicles
(3 Vehicles)
(13 Vehicles)
(5 Vehicles)(1 Vehicle)
(1 Vehicle)
y = 0.631x - 5.7536
R2 = 0.9517
0
1
2
3
4
5
6
7
8
9
10
11 12 13 14 15 16 17 18 19 20 21 22
Road Bed Speed (mph)
with Proportional Roll Rate
Avg
. Re
sid
ual
Cru
sh
(in
.)
Figure 12. Comparison of residual crush vs. road bed speed
Major radius (MR):
A vehicle’s MR is the distance between the CG longitudinal (roll) axis and the roof rail at the A-pillar.
The scatter plot of Figure 13 identifies the vehicle’s major radius and the cumulative residual crush at the
A-pillar in a 2-roll event. The relationship is particularly striking for the slope, which indicates that each
1.2-inch change in MR affects the cumulative residual crush by 1 inch.
Page 13
13
R oll 2: C umulative R es idual C rus h and Major R adius
(2007 V W J etta)
(2007 Honda C R -V )
(2006 Hyundai S onata)
(2005 V olvo XC 90)
(2010 Toyota P rius )
(2009 Nis s an V ers a)
(2007 Toyata C amry)
(2007 ToyotaC amry Hybrid)
(2008 S c ion xB )
(2007 Honda R idgeline)
(2007 C hevy Tahoe)
y = 1.230x - 48.59R ² = 0.830
0
2
4
6
8
10
12
14
41 42 43 44 45 46 47 48 49 50
Major R adius (in.)
Re
sid
ua
l C
rus
h
(in
.)
R oll 2 R es idual Average = 5.62
Major R adius Average = 44.0
Figure 13. Cumulative residual crush vs. major radius
Geometry
The geometry of the roof has a substantial effect on the roof to ground loading [50] and therefore the roof
crush. Figure 14 characterizes the typical near and far side loading and almost 30 cm deformation of the
roof of a Jeep Grand Cherokee with an SWR = 2.3 for the 1st
roll.
Figure 14. 93’ Jeep Grand Cherokee 1
st roll Figure 15. 93’ Jeep Grand Cherokee with HALO™ 1
st
Figure 15 shows the loading and negligible deformation of the identical vehicle and JRS test with a simple
change in rounding the roof geometry longitudinally. The vehicle was rolled two more times with no
significant additional roof crush. This geometry change was implemented by an innovative aftermarket
device, the HALO™, for the Oil Gas and Mining industry [51] but is yet to be adapted and the roof
configured by a manufacturer for a production vehicle [52].
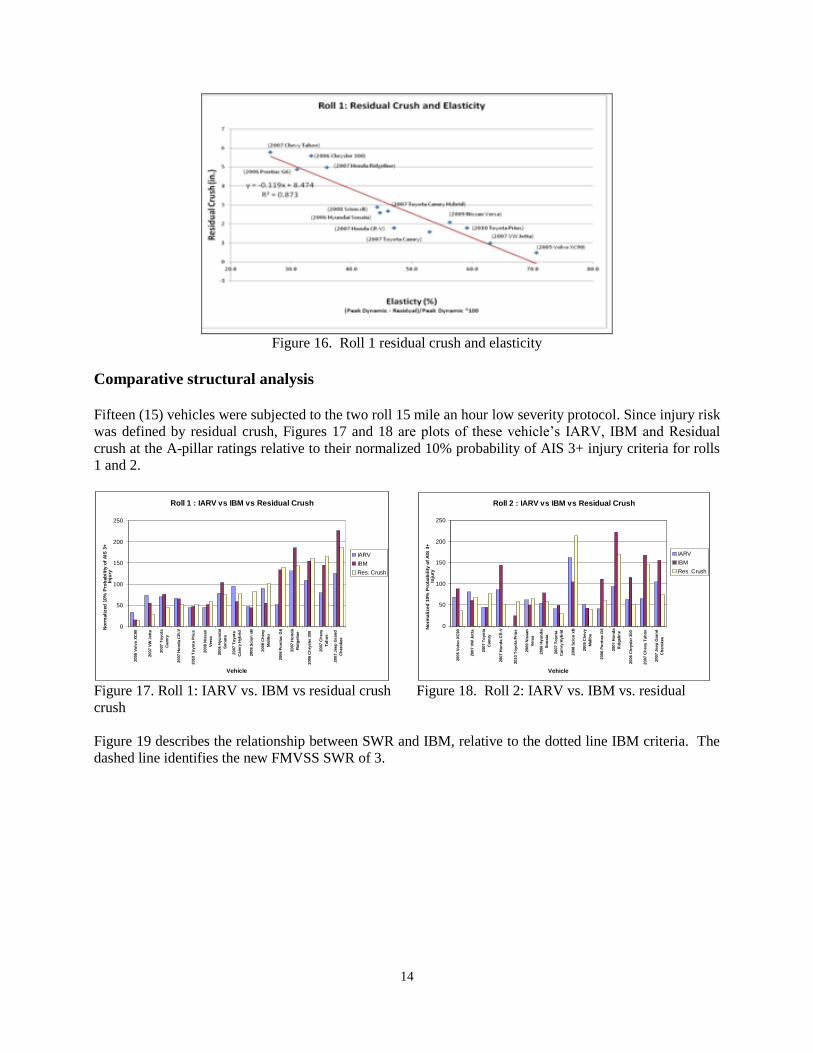
Structural elasticity
The elasticity of a structure is defined in Figure 16 as the ratio of (dynamic – residual crush) / by dynamic
deformation to an impact, that is, the data output of JRS instrumentation. It can also be measured by
considering the maximum deformation of a FMVSS 216 quasi-static test in comparison to the restitution
when the load is released. The point here is that if the criteria for performance is a post rollover
observation of cumulative residual crush, an elastic vehicle structure is advantageous. On the other hand
if the criteria for performance is a dummy injury measure sensitive to a vehicle’s dynamic crush, the
elasticity of its structure may be a misleading indicator of residual crush and impact severity.
Page 14
14
Figure 16. Roll 1 residual crush and elasticity
Comparative structural analysis
Fifteen (15) vehicles were subjected to the two roll 15 mile an hour low severity protocol. Since injury risk
was defined by residual crush, Figures 17 and 18 are plots of these vehicle’s IARV, IBM and Residual
crush at the A-pillar ratings relative to their normalized 10% probability of AIS 3+ injury criteria for rolls
1 and 2.
Roll 1 : IARV vs IBM vs Residual Crush
0
50
100
150
200
250
2005 V
olv
o X
C90
2007 V
W J
ett
a
2007 T
oyo
ta
Cam
ry
2007 H
on
da C
R-V
2010 T
oyo
ta P
riu
s
2009 N
issan
Vers
a
2006 H
yu
nd
ai
So
nata
2007 T
oyo
ta
Cam
ry H
yb
rid
2008 S
cio
n x
B
2009 C
hevy
Malib
u
2006 P
on
tiac G
6
2007 H
on
da
Rid
gelin
e
2006 C
hry
sle
r 300
2007 C
hevy
Tah
oe
2007 J
eep
Gra
nd
Ch
ero
kee
Vehicle
No
rmali
zed
10%
Pro
bab
ilit
y o
f A
IS 3
+
Inju
ry
IARV
IBM
Res. Crush
Roll 2 : IARV vs IBM vs Residual Crush
0
50
100
150
200
250
2005 V
olv
o X
C90
2007 V
W J
ett
a
2007 T
oyo
ta
Cam
ry
2007 H
on
da C
R-V
2010 T
oyo
ta P
riu
s
2009 N
issan
Vers
a
2006 H
yu
nd
ai
So
nata
2007 T
oyo
ta
Cam
ry H
yb
rid
2008 S
cio
n x
B
2009 C
hevy
Malib
u
2006 P
on
tiac G
6
2007 H
on
da
Rid
gelin
e
2006 C
hry
sle
r 300
2007 C
hevy T
ah
oe
2007 J
eep
Gra
nd
Ch
ero
kee
Vehicle
No
rmali
zed
10%
Pro
bab
ilit
y o
f A
IS 3
+
Inju
ry
IARV
IBM
Res. Crush
Figure 17. Roll 1: IARV vs. IBM vs residual crush Figure 18. Roll 2: IARV vs. IBM vs. residual
crush
Figure 19 describes the relationship between SWR and IBM, relative to the dotted line IBM criteria. The
dashed line identifies the new FMVSS SWR of 3.
Page 15
15
0
5
10
15
20
25
30
0
2
4
6
8
IB M
SW
RFMVSS 216 Strength to Weight Ratio (SWR@3--)
and Integrated Bending Moment ([email protected] ..)
FMVSS 216 SWR
Roll 1 IBM
Roll 2 IBM
0
5
10
15
20
25
30
0
2
4
6
8
10
12
IBM
Dy
na
mic
Ro
of
Cru
sh (
in)
Dynamic Roof Crush and Integrated Bending Moment (IBM)
Roll 1 Dyn. Roof Crush
Roll 2 Dyn. Roof Crush
Roll 1 IBM
Roll 2 IBM
Figure 19. The relationship between SWR and Figure 20. Dynamic Roof Crush and Integrated
the Integrated Bending Moment (IBM) Bending Moment ([email protected] )
Figure 20 describes the relationship between Dynamic Roof Crush and IBM for Rolls 1 and 2 where the
dashed line is the 13.5 IBM injury criteria.
OBSERVATIONS
A number of single vehicle experiments were conducted to gain insight into injury potential effects. Many
of these tests were conducted with a little known feature of the JRS in which the rolling vehicle may be
dropped to limiting stops to arrest the vehicle within about 2” and without a roof crushing impact. As
such these observations should be considered for insight only.
1. Cervical Spine Injuries: - In falls of 4” to the stops at 185 degrees of roll no injury measures exceeded
the applicable criteria with 4” and 8” of excess belt slack simulating an unrestrained occupant.
2. Kinematics: - vehicle spit tests with human subjects at 120 degrees per second for 3 rolls indicates
substantial lateral bidirectional torso rotation of 20 to 30 degrees with torso vertical extension of 3” to
5”. In a similar test series with a snug belt over the additional soft tissue, a dummy experienced
injury measures less than 50% of the applicable criteria with increased weight from 175 lbs to 415 lbs.
3. Thorax and Thoracic Spine Injuries: - Tests to characterize thoracic spine and thorax injuries were
limited by the dummy spinal flexibility. Indications are that with cervical and thoracic spine
flexibility, shoulder loading can produce both thoracic spinal fractures and chest sternum and rib
fracture injuries. In a recent experiment with a Hybrid II dummy without the head and neck, the
thorax was loaded to 50 g’s from the shoulders during roof intrusion contact. In view of the rounding
of the human spine observed in a drop test, shoulder to roof contact could occur without head/neck
involvement but the virtually rigid dummy spine precludes that mechanism of injury. An articulated
spine perhaps molded of rubber with the stiffness of the modified neck would better characterize that
injury mechanism.
4. Head Injuries: - In JRS tests with the production and modified 50th percentile Hybrid III dummy, the
head has only rarely experienced a closing velocity between the intruding roof speed and the erecting
radial speed of the dummy head sufficient to characterize a brain injury or skull fracture. Although
higher roll rates produced higher speed dummy contacts with the roof or roof rail, investigations show
that the stiffness of the dummy is the limiting factor in characterizing head injury measures. Such
injuries are likely to be associated with partial ejection, because of roof crush which breaks the
window, creates the portal and belt excursion which characterizes the extent of head to roadbed
contact.
Page 16
16
5. Head Injury and Partial Ejection: - Head injuries have been duplicated by exposure to the peripheral
speed of the rolling vehicles interaction with the ground. The production Hybrid III neck in
interacting with the interior is too stiff to allow it to go under the roof rail, but it is no problem with a
5th percentile occupant. In that test the exposure of the head to the roadbed was minor indicating that
the degree of excursion can result in minor to fatal head injury. In all our real world case
investigations we have not had a head injury in which the side window (or sunroof portal) was not
broken.
6. Ejection Mitigation: - Tempered glass side windows fractured with more than 4” of roof intrusion
creating ejection portals.
7. Upper limb Injuries: - In JRS tests, the hands are coupled because the arms invariable break when
ejected through a broken window. The injury forces to the arms can be easily measured by simply
uncoupling the hands and freeing the joints.
8. Belted Obesity and Cervical spine injury: - Lastly a human and dummy experiment investigated the
effectiveness of belts in limiting neck injury in multiple rolls of a non deforming roof. The tests were
conducted with increasing levels of soft tissue obesity to 415 pounds of a modified 50th percentile
Hybrid III dummy. Observation, discussion with the subject, indications from dummy injury
measures were that neck injury measures were insufficient to produce moderate to serious neck injury
without accompanying roof intrusion. Furthermore if the belt loads were taken up by the head and
neck interaction with the roof there was insufficient additional moment to suggest a serious neck
bending injury. This might help account for the 94% of rollover occupants who are not seriously
injured in rollovers.
CONCLUSIONS
1. The primary difference between these dynamic tests and FMVSS 216 static tests is the ability to
grade vehicle compliance by injury risk and dummy injury measure (IBM) performance and to
identify the effect of occupant protection features, as well as anomalies between the two.
2. The reliability and accuracy of the injury measures were compared to injury risk data. The
structural probability of death and severe injury were correlated to the 10% probability of AIS 3+
injury by IARV bending moments and IBM momentum exchange. In this study, the IBM was
more accurate, less dependent on dummy position and more reliable than peak bending moment
IARV. Dummy injury measures were related to residual roof crush. There was general
correlation of dummy injury measures to one of three levels of injury risk probability [35].
3. Considering the muscular and positional variability of the human victims and their kinematics
relative to the vehicle dynamics, impacts, and structural distortions there is no typical
characterization. The major observation is that the severity and pattern of injury is dependent on
the variable and unknown musculature tension and flexibility of the human spinal column during
the rollover. Since the dummy is only able to replicate one set of conditions in these dynamic
tests, choices must be made. In these tests, the reduction in cervical tension and flexed orientation
of the hybrid III neck had a profound effect on characterizing neck flexion injuries. The lack of
flexibility and stiffness of the thoracic spine of the Hybrid III precluded simulating head injuries
and ejection as well as shoulder loading of the thorax and thoracic spine. Future modification of
the Hybrid III spinal flexibility and musculature may correct this situation.
4. NHTSA's 5-year research plan complements and will eventually validate this cooperative project
to develop a real-world comparative evaluation and NCAP test rating system.
Page 17
17
ACKNOWLEDGEMENT
The author wishes to acknowledge the support of the Center for Injury Research technical staff who
conducted the tests and the administrative staff that assisted in assembling the data to prepare this paper.
We also would like to acknowledge the financial assistance of the Santos Family Foundation and
Automotive Safety Research Institute as well as State Farm Insurance Company for their contribution of
test vehicles.
REFERENCES
[1] Hearings Before the Subcommittee on Executive Reorganization of the Committee on Government Operations United States
Senate 89th Congress, ‘Traffic safety: examination and review of efficiency, economy, and coordination of public and private
agencies’ activities and the role of the federal government’, Washington, D.C., USA 1965.
[2] National Highway Safety Bureau Notice of Proposed Rulemaking, ‘Intrusion – passenger cars, multipurpose passenger
vehicles, trucks and buses, Docket 2-6, 1968
[3] National Highway Safety Bureau Proposed Rule Making, ‘Occupant crash protection; passenger cars, multipurpose passenger
vehicles, trucks and buses’, Federal Register Vol. 35, No. 89, 1970.
[4] National Highway Safety Bureau Proposed Motor Vehicle Safety Standard, ‘Roof intrusion protection for passenger cars –
proposed motor vehicle safety standard 216’, Docket No. 2-6; Notice 4, 1971.
[5] Chrysler Corporation petitioner vs. Department of Transportation et. al., United States Court of Appeals, Sixth Circuit,
December 5, 1972
[6] National Highway Traffic Safety Administration, ‘Advanced notice of proposed standard on rollover resistance’, Federal
Register, Vol. 38, No. 74. 1973.
[7] National Safety Council, NSC Injury Facts 2011 Edition; A complete reference for injury and death statistics, www.nsc.org
[8] D Willke, S Summers, J Wang, J Lee, C Harper and S Partyka, ‘Ejection mitigation using advanced glazing’, Transportation
Research Board, 2001.
[9] National Highway Traffic Safety Administration, ‘Consumer information regulations; federal motor vehicle safety standards;
rollover resistance’, Federal Register Vol. 67, No. 194, 2002.
[10] J Carter, J Habberstad and J Croteau, ‘A comparison of the controlled rollover impact system (CRIS) with the J2114 rollover
dolly’, Society of Automotive Engineers World Congress Conference, 2002.
[11] National Highway Traffic Safety Administration, ‘Federal motor vehicle safety standards; roof crush resistance; phase-in
reporting requirements’, Federal Register Vol. 74, No. 90, 2009.
[12] National Highway Traffic Safety Administration, ‘Electronic stability control systems’, 49cfr571.126, 2006.
[13] National Highway Traffic Safety Administration, ‘Federal motor vehicle safety standards, ejection mitigation; phase-in
reporting requirements; incorporation by reference’, Federal Register Vol. 76, No 12, 2011.
[14] D Friedman, ‘The minicars research safety vehicle’, Proceedings of the 8th International Technical Conference on
Experimental Safety Vehicles’, Wolfburg, West Germany 1980.
[15] K Friedman and D Friedman, ‘Improved vehicle design for the prevention of severe head and neck injuries to restrained
occupants in rollover accidents’, Proceedings of the 15th International Technical Conference on the Enhanced Safety of Vehicles,
Melbourne, Australia, 1996.
[16] K Friedman, F Gaston, J Bish, D Friedman and A Sances, ‘An investigation of hybrid III and living human drop tests’,
Biomedical Engineering, 2000, 28 (1&2) 219-351.
[17] Lambert v. General Motors Corporation, Case # RCV39570, Superior Court of the State of California, County of San
Bernardino.
[18] National Highway Traffic Safety Administration Docket Submissions www. regulations.gov
[19] J G Paver, D Friedman, F Carlin, J Bish, J Caplinger and D Rohde, ‘Rollover crash neck injury replication and injury
potential assessment’, Proceedings of International Research Council on the Biomechanics of Injury Conference’, Bern,
Switzerland, 2008.
[20] D Friedman and C E Nash, ‘Measuring rollover roof strength for occupant protection’, International Crashworthiness
Conference, Melbourne, Australia, 2002.
[21] D Friedman, C E Nash and J Caplinger, ‘Results from two sided quasi-static (M216) and repeatable dynamic rollover tests
(JRS) relative to FMVSS 216 tests’, Proceedings of the 20th International Technical Conference on the Enhanced Safety of
Vehicles, Lyon, France, 2007.
[22] E A Moffatt, E R Cooper, J J Croteau, K R Orlowski, D R Marth and J W Carter, ‘Matched-pair rollover impacts of rollcaged
and production roof cars using the controlled rollover impact system (CRIS),” Society of Automotive Engineers World Congress
Conference, Detroit, Michigan, USA 2003.
[23] K Friedman, ‘Rollover testing methods’, Society of Automotive Engineers World Congress Conference, Detroit, Michigan,
USA 2011.
[24] B Allen, ‘A mechanistic classification of closed, indirect fractures and dislocations of the lower cervical spine’, Spine 1982 7
(1) 1-27.
Page 18
18
[25] D Friedman and K Friedman, ‘Upper interior head face and neck injury experiments’, Proceedings of the 16th International
Technical Conference on the Enhanced Safety of Vehicles, Windsor, Ontario, Canada 1998.
[26] H Mertz, A Irwin and P Prasad, ‘Biomechanical and scaling bases for frontal and side impact injury assessment reference
values’, STAPP Car Crash J 2003 47 155-188.
[27] J G Paver, D Friedman, J Caplinger, ‘Rollover roof crush and speed as measures of injury potential vs. the hybrid III
dummy’, International Crashworthiness Conference, Kyoto, Japan, 2008.
[28] B Fildes and K Digges, ‘Occupant protection in far-side crashes’, National Crash Analysis Center, GWU, Monash University
Accident Research Centre, 2009.
[29] D Friedman, G Mattos and R Grzebieta, ‘A proposed rollover and comprehensive rating system’, Proceedings of the 21st
International Technical Conference on the Enhanced Safety of Vehicles, Stuttgart, Germany,
[30] J G Paver, D Friedman, J Caplinger, ‘Rollover roof crush and speed as measures of injury potential vs. the hybrid III
dummy’, International Crashworthiness Conference, Kyoto, Japan, 2008
[31] J Paver, J Caplinger, D Friedman and G Mattos, ‘Testing of the prototype low-durometer hybrid III neck for improved
biofidelity’, ASME Summer Bioengineering Conference, Naples, Florida, USA 2010.
[32] J G Paver, D Friedman, J Caplinger, ‘Rollover roof crush and speed as measures of injury potential vs. the hybrid III
dummy’, International Crashworthiness Conference, Kyoto, Japan, 2008.
[33] H Mertz, A Irwin and P Prasad, ‘Biomechanical and scaling bases for frontal and side impact injury assessment reference
values’, STAPP Car Crash J 2003 47 155-188
[34] F A Pintar, L M Voo, N Yoganandan, T Hyoung Cho and D J Maiman, ‘Mechanisms of hyperflexion cervical spine injury’,
Proceedings of the 1998 International Research Council on the Biokinetics of Impacts (IRCOBI) Conference on Biomechanics of
Impact, Goeteberg, Sweden, 1998.
[35] D Friedman, J Paver and F Carlin, ‘Hybrid III correlation with human injury potential in rollovers’, ASME Summer
Bioengineering Conference, Lake Tahoe, California, USA 2009.
[36] J Paver, J Caplinger, G Mattos and D Friedman, ‘The development of IARV’s for the hybrid III neck modified for dynamic
rollover crash testing’, International Crashworthiness Conference, Washington, D.C. USA 2010.
[37] S Mandell, R Kaufman, C D Mack and E M Bulger, ‘Mortality and injury patterns associated with roof crush in rollover
crashes’, Accident Analysis and Prevention, 2010 10.1016/j.aap.2010.02.013.
[38] National Highway Traffic Safety Administration, ‘Federal motor vehicle safety standards; roof crush resistance’, Federal
Register Vol 66 No. 204, 2001.
[39] National Highway Traffic Safety Administration, ‘Initiatives to address the mitigation of vehicle rollover’, Washington, D.C.,
USA 2003.
[40] D Friedman, C E Nash and J Bish, ‘Observations from repeatable dynamic rollover tests’, International Crashworthiness
Conference, Athens, Greece 2006.
[41] S A Ridella, J Kerrigan, A M Eigen and J Crandall, ‘An analysis of injury type and distribution of belted, non-ejected
occupants involved in rollover crashes’, Society of Automotive Engineers Government Industry Meeting, Washington, D.C., USA
2010.
[42] D Parent, J Kerrigan and J Crandall, ‘Comprehensive computational rollover sensitivity study part 1’, International
Crashworthiness Conference, Washington, D.C., USA 2010.
[43] D Parent J Kerrigan and J Crandall, ‘Comprehensive computational rollover sensitivity study part 2: influence of vehicle,
crash and occupant parameters on head, neck and thorax response’, Society of Automotive Engineers World Congress
Conference, Detroit, Michigan, USA 2011.
[44] J Kerrigan, A Jordan, D Parent, Q Zhang, J Funk, N J Dennis, B Overby, J Bolton and J Crandall, ’Design of a dynamic
rollover test system’, Society of Automotive Engineers World Congress Conference, Detroit, Michigan, USA 2011
[45] F Tahan, ‘Jordan rollover system sensitivity study for an elastic roof of a Ford Explorer FEA model’, National Crash
Analysis Center, George Washington University 2010.
[46] K Digges and A M Eigen, ‘Crash Attributes that influence the severity of rollover crashes’, Proceedings of the 18th
International Conference on the Enhanced Safety of Vehicles, Nagoya, Japan 2003.
[47] D Friedman, G Mattos and J Paver, ‘The development of a dynamic rollover rating test’, Proceedings of the 22nd
International Conference on the Enhanced Safety of Vehicles, Washington, D.C., USA 2011.
[48] J G Paver, D Friedman, F Carlin, J Bish, J Caplinger and D Rohde, ‘Rollover crash neck injury replication and injury
potential assessment’, Proceedings of International Research Council on the Biomechanics of Injury Conference, Bern,
Switzerland 2008.
[49] C Nash and A Paskin, ‘Rollover cases with roof crush in NASS’, ASME Summer Bioengineering Conference, Vail,
Colorado, USA 2005.
[50] D Friedman and R Grzebieta, ‘Vehicle roof geometry and its effect on rollover roof performance’, Proceedings of the 21st
International Conference on the Enhanced Safety of Vehicles, Stuttgart, Germany, 2009.
[51] R Grzebieta, D Friedman, S Bozzini, C Shipp and H Jama, ‘Retrofitting for rollover crashworthiness occupant protection‘
Australasion Road Safety Research, Policing and Education Conference, Sydney, New South Wales, Australia 2009.
[52] D Friedman and R Grzebieta, Vehicle rollover protection roof geometry and structure, US Patent Office, Pat No 7 717 492
B2, May 2010.