28
Journal Club August 15, 2018 Claire Groskurth, PGY4

Journal ClubAugust 15, 2018Claire Groskurth, PGY4

Labor Induction versus Expectant
Management in Low-Risk
Nulliparous WomenGrobman, et al.
The New England Journal of Medicine
Published August 9, 2018

Objectives
To assess the perinatal and maternal consequences of
induction of labor at 39 weeks gestation versus expectant
management in nulliparous women
Primary Neonatal Outcome: perinatal death, severe
neonatal complications
Maternal Secondary Outcome: Cesarean delivery

Background
Studies have shown increased perinatal morbidity if
induced prior to 39 wga without indication or after 40.6
wga
Observational studies used to avoid induction of
nulliparous women between 39.0 and 40.6 wga
ARRIVE trial

Methods
Multicenter, randomized, controlled, parallel-group
March 2014 – August 2017
Inclusion Criteria:
Low-risk nulliparous women between 34.0- 38.6 wga
Live, singleton, vertex
No contraindications to vaginal delivery
No C-section planned
Reliable dating
Low risk: Did not have an indication for delivery prior to 40.5 wga

Methods
Northwestern
University of Alabama at Birmingham
University of Utah Health Science Center
Stanford
Columbia
Brown
University of Texas, Galveston
UNC
Ohio State University
MetroHealth Medical Center-Case Western
University of Texas Southwestern
University of Colorado
University of Pennsylvania
Duke
University of Pittsburgh
George Washington University
Eunice Kennedy Shriver Institute

Methods
Randomized to two groups:
1. Induction of labor between 39.0 -39.4 wga
2. Expectant management prior to 40.5 wga

Methods
Assessment Tools:
Bishop score
Likert Scale (labor pain)
Labor Agentry Score (personal control in labor)
Perinatal death or severe neonatal complications
Cesarean delivery
Demographics
Specialty of admitting physician

Methods
Secondary neonatal outcomes
Secondary maternal outcomes

Statistical Analysis
Continuous variables: Wilcoxon signed rank test
Categorical variables: Chi-squared, Fisher exact test
Time variables: Cochran-Armitage trend test
Comparison between primary neonatal and maternal outcomes:
Breslow-Day interaction test

Results
Primary perinatal outcomes:
Overall: greater in expectant than induction groups (p = 0.049)
Induction: Shorter time with respiratory support, shorter total hospital stay
Primary maternal outcome:
Induction group: lower C-section rate
Secondary maternal outcomes:
Induction: Lower rate of hypertensive disorders, lower uterine extensions in C-section, more perceived control in labor
Induction: spent more time on LDR, but shorter postpartum hospital stay


Conclusions/Comments
“1 C-section may be avoided for every 28 deliveries among low-risk nulliparous women who plan to undergo elective induction at 39 wga”
Masking not feasible > ascertainment bias
Not powered for rare perinatal outcomes
Generatlizability?
Cost-effectiveness?
Utilization of Resources

References
Grobman, W. A., Rice, M. M., Reddy, U. M., Tita, A. T., Silver, R. M., Mallett, G., . . .
Macones, G. A. (2018). Labor Induction versus Expectant Management in Low-
Risk Nulliparous Women. The New England Journal of Medicine,379(6), 513-523.

Questions/Comments

The new england journal of medicine
n engl j med 379;6 nejm.org August 9, 2018 513
established in 1812 August 9, 2018 vol. 379 no. 6
The authors’ affiliations are listed in the Appendix. Address reprint requests to Dr. Grobman at the Department of Obstetrics and Gynecology, Northwestern Univer-sity, 250 E. Superior St., Suite 05-2175, Chicago, IL 60611, or at w-grobman@ northwestern . edu.
* A list of other members of the Eunice Kennedy Shriver National Institute of Child Health and Human Development Maternal–Fetal Medicine Units Network is provided in the Supplementary Appen-dix, available at NEJM.org.
N Engl J Med 2018;379:513-23.DOI: 10.1056/NEJMoa1800566Copyright © 2018 Massachusetts Medical Society.
BACKGROUNDThe perinatal and maternal consequences of induction of labor at 39 weeks among low-risk nulliparous women are uncertain.
METHODSIn this multicenter trial, we randomly assigned low-risk nulliparous women who were at 38 weeks 0 days to 38 weeks 6 days of gestation to labor induction at 39 weeks 0 days to 39 weeks 4 days or to expectant management. The primary out-come was a composite of perinatal death or severe neonatal complications; the principal secondary outcome was cesarean delivery.
RESULTSA total of 3062 women were assigned to labor induction, and 3044 were assigned to expectant management. The primary outcome occurred in 4.3% of neonates in the induction group and in 5.4% in the expectant-management group (relative risk, 0.80; 95% confidence interval [CI], 0.64 to 1.00). The frequency of cesarean delivery was significantly lower in the induction group than in the expectant-management group (18.6% vs. 22.2%; relative risk, 0.84; 95% CI, 0.76 to 0.93).
CONCLUSIONSInduction of labor at 39 weeks in low-risk nulliparous women did not result in a significantly lower frequency of a composite adverse perinatal outcome, but it did result in a significantly lower frequency of cesarean delivery. (Funded by the Eunice Kennedy Shriver National Institute of Child Health and Human Development; ARRIVE ClinicalTrials.gov number, NCT01990612.)
a bs tr ac t
Labor Induction versus Expectant Management in Low-Risk Nulliparous Women
William A. Grobman, M.D., Madeline M. Rice, Ph.D., Uma M. Reddy, M.D., M.P.H., Alan T.N. Tita, M.D., Ph.D., Robert M. Silver, M.D., Gail Mallett, R.N., M.S., C.C.R.C., Kim Hill, R.N., B.S.N., Elizabeth A. Thom, Ph.D.,
Yasser Y. El-Sayed, M.D., Annette Perez-Delboy, M.D., Dwight J. Rouse, M.D., George R. Saade, M.D., Kim A. Boggess, M.D., Suneet P. Chauhan, M.D., Jay D. Iams, M.D., Edward K. Chien, M.D., Brian M. Casey, M.D.,
Ronald S. Gibbs, M.D., Sindhu K. Srinivas, M.D., M.S.C.E., Geeta K. Swamy, M.D., Hyagriv N. Simhan, M.D., and George A. Macones, M.D., M.S.C.E., for the Eunice Kennedy Shriver National Institute of Child Health
and Human Development Maternal–Fetal Medicine Units Network*
The New England Journal of Medicine Downloaded from nejm.org at A.R. Dykes Library University of Kansas Medical Center on September 12, 2018. For personal use only. No other uses without permission.
Copyright © 2018 Massachusetts Medical Society. All rights reserved.

n engl j med 379;6 nejm.org August 9, 2018514
T h e n e w e ngl a nd j o u r na l o f m e dic i n e
Recommendations regarding the timing of delivery are founded on a bal-ancing of maternal and perinatal risks.
Delivery before 39 weeks 0 days of gestation with-out medical indication is associated with worse perinatal outcomes than delivery at full term.1 For women who are at 41 weeks of gestation or later, delivery has been recommended because of increasing perinatal risks.2 When gestation is between 39 weeks 0 days and 40 weeks 6 days, common practice has been to avoid elective labor induction because of a lack of evidence of peri-natal benefit and concern about a higher fre-quency of cesarean delivery and other possible adverse maternal outcomes, particularly among nulliparous women.3
However, these conclusions were derived large-ly from observational studies in which labor in-duction was compared with spontaneous labor.4-6 Such a comparison provides little insight into clinical management, because spontaneous labor is not a certain alternative to labor induction. Most observational studies that have used the clinically relevant comparator of expectant man-agement have not shown a higher risk of adverse outcomes with labor induction; instead, some of these studies have shown that induction of labor resulted in a lower frequency of cesarean deliv-ery and more favorable perinatal outcomes than expectant management.7-11
A previous randomized trial conducted in the United Kingdom compared labor induction at 39 weeks of gestation with expectant management among 619 women who were 35 years of age or older and who had no other indication for deliv-ery at 39 weeks of gestation.12 The frequency of cesarean delivery was similar in the two groups (relative risk, 0.99; 95% confidence interval [CI], 0.87 to 1.14), although several aspects of the trial, including a rate of operative vaginal deliv-ery (i.e., vaginal delivery with the use of forceps or vacuum) of more than 30%, called into ques-tion the external validity of these results for the United States. The authors of that trial encour-aged replication of their findings in other popu-lations and the performance of a trial with a sample size sufficient “to test the effects of induction on . . . uncommon adverse neonatal outcomes.” The ARRIVE trial (A Randomized Trial of Induction Versus Expectant Management) was designed to test the hypothesis that elective induction of labor at 39 weeks would result in a lower risk of a composite outcome of perinatal
death or severe neonatal complications than ex-pectant management among low-risk nulliparous women.
Me thods
Trial Oversight
We conducted this multicenter, randomized, con-trolled, parallel-group, unmasked trial at 41 hos-pitals participating in the Maternal–Fetal Medi-cine Units Network of the Eunice Kennedy Shriver National Institute of Child Health and Human Development. The protocol (available with the full text of this article at NEJM.org) was approved by the institutional review board at each hospital before participant enrollment. Writ-ten informed consent was obtained from all par-ticipants before randomization. An independent data and safety monitoring committee monitored the trial. The authors vouch for the accuracy and completeness of the data and for the fidelity of the trial to the protocol.
Screening and Recruitment
Low-risk nulliparous women who were at 34 weeks 0 days to 38 weeks 6 days of gestation with a live singleton fetus that was in a vertex presentation, who had no contraindication to vaginal delivery, and who had no cesarean deliv-ery planned were screened for eligibility. Low risk was defined as the absence of any condition considered to be a maternal or fetal indication for delivery before 40 weeks 5 days (e.g., hyperten-sive disorders of pregnancy or suspected fetal-growth restriction). Reliable information on the length of gestation was also a criterion for enroll-ment; information was considered to be reliable if the woman was certain of the date of her last menstrual period and that date was consistent with results of ultrasonography performed be-fore 21 weeks 0 days or if the date of the last menstrual period was uncertain but results were available from ultrasonography performed before 14 weeks 0 days. Full eligibility criteria are pro-vided in the Supplementary Appendix, available at NEJM.org.
Randomization and Management Strategy
Women who consented to participate were as-sessed again between 38 weeks 0 days and 38 weeks 6 days of gestation to ensure that they did not have new indications for delivery that would make them ineligible for the trial. Women who
A Quick Take is available at
NEJM.org
The New England Journal of Medicine Downloaded from nejm.org at A.R. Dykes Library University of Kansas Medical Center on September 12, 2018. For personal use only. No other uses without permission.
Copyright © 2018 Massachusetts Medical Society. All rights reserved.

n engl j med 379;6 nejm.org August 9, 2018 515
Labor Induction vs. Expectant Management
were in labor or had premature rupture of mem-branes or vaginal bleeding at this time were considered to be ineligible. Women who met the inclusion criteria were randomly assigned in a 1:1 ratio to either labor induction or expectant management. The randomization sequence, pre-pared by an independent data coordinating cen-ter, used the simple urn method, with stratifica-tion according to clinical site.13 The cervix was examined before labor, from 72 hours before to 24 hours after randomization, to assess dilation, effacement, and station of the fetus to determine a modified Bishop score (scores range from 0 to 12, with lower scores associated with a higher chance of cesarean delivery) (see the Supplemen-tary Appendix).14
Women in the induction group were assigned to undergo induction of labor at 39 weeks 0 days to 39 weeks 4 days. Women in the expectant-management group were asked to forego elective delivery before 40 weeks 5 days and to have delivery initiated no later than 42 weeks 2 days. A specific induction protocol was not mandated for women who underwent induction in either group. Other protocol guidelines are provided in the Supplementary Appendix.
Trained and certified research staff members abstracted information from medical records, in-cluding demographic information, medical history, and outcome data. Participants were followed up with an interview performed by research person-nel immediately post partum. During this inter-view, women were asked to rate their labor pain on a 10-point Likert scale (with higher scores indicating greater pain)15 and to rate their expe-riences on the Labor Agentry Scale,16 which was designed to assess expectations and experiences of personal control during childbirth (scores range from 29 to 203, with higher scores indicat-ing greater perceived control during childbirth). The score on the Labor Agentry Scale was also assessed in a second interview performed by research personnel 4 to 8 weeks after delivery.
Trial Outcomes
The primary outcome was a composite of peri-natal death or severe neonatal complications and consisted of one or more of the following during the antepartum or intrapartum period or during the delivery hospitalization: perinatal death, the need for respiratory support within 72 hours after birth, Apgar score of 3 or less at 5 minutes, hypoxic–ischemic encephalopathy,17 seizure, infec-
tion (confirmed sepsis or pneumonia), meconium aspiration syndrome, birth trauma (bone frac-ture, neurologic injury, or retinal hemorrhage), intracranial or subgaleal hemorrhage, or hypo-tension requiring vasopressor support. The prin-cipal prespecified maternal outcome (the main secondary outcome) was cesarean delivery.
Prespecified subgroups for the primary perina-tal outcome and for the secondary outcome of ce-sarean delivery were maternal race or ethnic group as reported by the participant (white, black, Asian, Hispanic, other, unknown, or more than one race), age of 35 years or older versus younger than 35 years, body-mass index (the weight in kilograms divided by the square of the height in meters) of 30 or more versus less than 30, and a modified Bishop score at the time of randomization of less than 5 versus 5 or higher. In addition, although it was not a baseline variable, the specialty of the admit-ting provider (obstetrics–gynecology, maternal–fetal medicine, family practice, or midwifery) was prespecified for the subgroup analyses.
Neonatal secondary outcomes included birth weight, duration of respiratory support, cephalo-hematoma, shoulder dystocia, transfusion of blood products, hyperbilirubinemia requiring photo-therapy or exchange transfusion, hypoglycemia requiring intravenous therapy, admission to the neonatal intermediate or intensive care unit, and length of hospitalization. In addition to cesarean delivery, other maternal secondary outcomes included hypertensive disorders of pregnancy (gestational hypertension or preeclampsia), indi-cation for cesarean delivery, operative vaginal delivery, indication for operative vaginal delivery, uterine incisional extensions during cesarean delivery, chorioamnionitis, third-degree or fourth-degree perineal laceration, postpartum hemor-rhage, postpartum infection, venous thrombo-embolism, number of hours in the labor and delivery unit, length of postpartum hospital stay, admission to the intensive care unit, and mater-nal death. Definitions of secondary outcomes are provided in the Supplementary Appendix.
Records of all infants who met the primary perinatal outcome were reviewed centrally to verify that the primary outcome had occurred. Records of infants in whom the primary out-come did not occur but that suggested (on the basis of a delivery hospitalization of 7 or more days or discharge to a long-term care facility) that clinically significant perinatal complications may have occurred were reviewed centrally as
The New England Journal of Medicine Downloaded from nejm.org at A.R. Dykes Library University of Kansas Medical Center on September 12, 2018. For personal use only. No other uses without permission.
Copyright © 2018 Massachusetts Medical Society. All rights reserved.
n engl j med 379;6 nejm.org August 9, 2018516
T h e n e w e ngl a nd j o u r na l o f m e dic i n e
well. Reviewers were unaware of the trial-group assignments.
Statistical Analysis
The expected rate of the primary perinatal out-come in the expectant-management group was estimated to be 3.5%.18 We calculated that en-rollment of 6000 women would provide a power of at least 85% to detect a 40% lower rate of the primary outcome in the induction group than in the expectant-management group, at a two-sided type I error rate of 5%. This power analysis in-corporated the assumption that for 7.5% of the women, management would not be consistent with the protocol of the assigned strategy.
Analyses were performed according to the intention-to-treat principle. We compared con-tinuous variables using the Wilcoxon signed-rank test and categorical variables using the chi-square and Fisher’s exact tests. A multinomial outcome was compared with the use of multi-nomial logistic regression. Time variables mea-sured in days were categorized and compared with the Cochran–Armitage trend test. We used a group sequential method to control the type I error with the Lan–DeMets characterization of the O’Brien–Fleming boundary. One interim analy-sis was performed; in the final analysis of the primary outcome, a two-tailed P value of less than 0.046 was considered to indicate statistical significance. Because the adjustment is minimal, we report the 95% confidence interval for the relative risk. Our statistical analysis plan did not call for adjustment of P values to control for multiple comparisons of the results for the indi-vidual components of the primary outcome; therefore, these are reported as point estimates and 95% confidence intervals. For the secondary outcomes, the level of significance was adjusted post hoc for multiple comparisons with the false discovery rate method.19 No method of imputa-tion of missing data was used, although sensi-tivity analyses were performed in which data from participants who withdrew consent or were lost to follow-up were handled in various ways. To determine whether there was a differential effect of labor induction on the primary perina-tal outcome and on the secondary outcome of cesarean delivery within the prespecified sub-groups, we performed the Breslow–Day interac-tion test in which a P value of less than 0.05 was considered to indicate statistical significance.
The statistical analysis plan is provided in the protocol, available at NEJM.org.
R esult s
Characteristics of the Participants
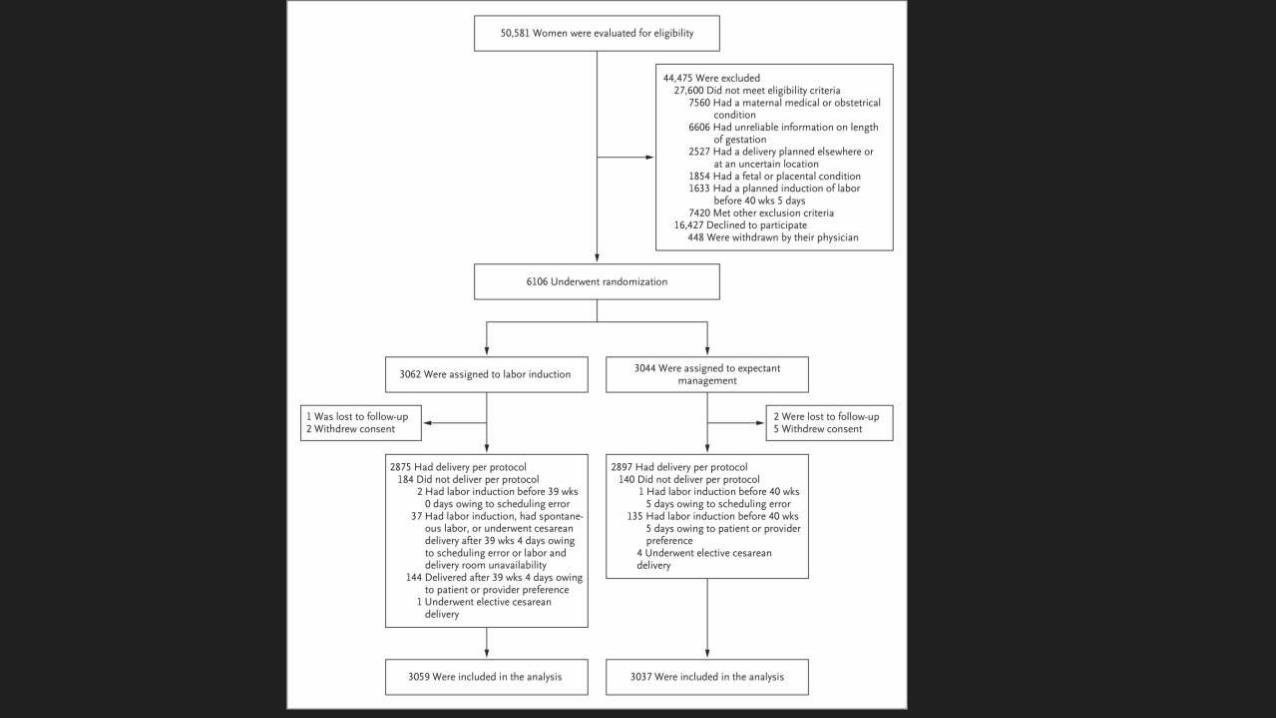
From March 2014 through August 2017, a total of 50,581 women underwent screening for eligi-bility. Of the 22,533 eligible women, 6106 (27%) provided written informed consent and under-went randomization: 3062 were assigned to the induction group, and 3044 to the expectant-management group (Fig. 1). At the time of ran-domization, 63% of the participants had an un-favorable modified Bishop score (i.e., a score <5). The two groups were similar at baseline, except that fewer women in the induction group than in the expectant-management group had had a previous pregnancy loss (22.8% vs. 25.6%, P = 0.01) (Table 1). The obstetrical provider at the time of admission for delivery was a physician for 94% of women and a midwife for 6%.
Adherence
Three women in the induction group and 7 in the expectant-management group were lost to follow-up or withdrew consent. In the case of 184 women (6.0%) in the induction group and 140 (4.6%) in the expectant-management group, the management was not consistent with the proto-col of the assigned strategy (details are provided in the Supplementary Appendix). Women in the induction group had a shorter median time from randomization to delivery than women in the expectant-management group (7 days [interquar-tile range, 5 to 9] vs. 12 days [interquartile range, 7 to 16], P<0.001); in addition, women in the induction group underwent delivery at a signifi-cantly earlier median gestational age (39.3 weeks [interquartile range, 39.1 to 39.6] vs. 40.0 weeks [interquartile range, 39.3 to 40.7], P<0.001) and had neonates with significantly lower median birth weights (3300 g [interquartile range, 3040 to 3565] vs. 3380 g [interquartile range, 3110 to 3650], P<0.001).
Primary Outcome and Other Perinatal Outcomes
The primary perinatal outcome occurred in 4.3% of the neonates in the induction group and in 5.4% in the expectant-management group (rela-tive risk, 0.80; 95% CI, 0.64 to 1.00; P = 0.049
The New England Journal of Medicine Downloaded from nejm.org at A.R. Dykes Library University of Kansas Medical Center on September 12, 2018. For personal use only. No other uses without permission.
Copyright © 2018 Massachusetts Medical Society. All rights reserved.

n engl j med 379;6 nejm.org August 9, 2018 517
Labor Induction vs. Expectant Management
[P<0.046 indicated statistical significance for the primary perinatal outcome]) (Table 2). This finding did not change after adjustment for pre-vious pregnancy loss and was materially un-changed in the sensitivity analyses. Neonates in
the induction group also had a shorter duration of respiratory support and of total hospital stay. Other secondary perinatal outcomes were simi-lar in the two groups (see the Supplementary Appendix).
Figure 1. Eligibility, Randomization, Delivery, and Assessment.
Per-protocol delivery in the induction group was defined as electively induced labor from 39 weeks 0 days to 39 weeks 4 days or spontaneous labor or medically indicated delivery on or before 39 weeks 4 days (this also included delivery delayed past 39 weeks 4 days because of a new medical indication that had developed). Per-protocol delivery in the expectant-management group was defined as induction from 40 weeks 5 days to 42 weeks 2 days or spontaneous or medically indicated delivery on or before 42 weeks 2 days.
6106 Underwent randomization
50,581 Women were evaluated for eligibility
44,475 Were excluded27,600 Did not meet eligibility criteria
7560 Had a maternal medical or obstetricalcondition
6606 Had unreliable information on lengthof gestation
2527 Had a delivery planned elsewhere orat an uncertain location
1854 Had a fetal or placental condition1633 Had a planned induction of labor
before 40 wks 5 days7420 Met other exclusion criteria
16,427 Declined to participate448 Were withdrawn by their physician
3062 Were assigned to labor induction3044 Were assigned to expectant
management
1 Was lost to follow-up2 Withdrew consent
2 Were lost to follow-up5 Withdrew consent
2875 Had delivery per protocol184 Did not deliver per protocol
2 Had labor induction before 39 wks0 days owing to scheduling error
37 Had labor induction, had spontane-ous labor, or underwent cesareandelivery after 39 wks 4 days owingto scheduling error or labor anddelivery room unavailability
144 Delivered after 39 wks 4 days owingto patient or provider preference
1 Underwent elective cesareandelivery
2897 Had delivery per protocol140 Did not deliver per protocol
1 Had labor induction before 40 wks5 days owing to scheduling error
135 Had labor induction before 40 wks5 days owing to patient or providerpreference
4 Underwent elective cesareandelivery
3059 Were included in the analysis 3037 Were included in the analysis
The New England Journal of Medicine Downloaded from nejm.org at A.R. Dykes Library University of Kansas Medical Center on September 12, 2018. For personal use only. No other uses without permission.
Copyright © 2018 Massachusetts Medical Society. All rights reserved.

n engl j med 379;6 nejm.org August 9, 2018518
T h e n e w e ngl a nd j o u r na l o f m e dic i n e
CharacteristicInduction Group
(N = 3062)Expectant-Management Group
(N = 3044)
Age — yr
Median 24 23
Interquartile range 21–28 20–28
Age ≥35 yr — no. (%) 114 (3.7) 136 (4.5)
Race or ethnic group — no. (%)†
White 1329 (43.4) 1359 (44.6)
Black 707 (23.1) 699 (23.0)
Asian 87 (2.8) 106 (3.5)
Hispanic 866 (28.3) 808 (26.5)
Other, unknown, or more than one race 73 (2.4) 72 (2.4)
Married or living with a partner — no. (%) 1814 (59.2) 1798 (59.1)
Employment status — no./total no. (%)‡
Employed full time 1226/3053 (40.2) 1209/3036 (39.8)
Employed part time 341/3053 (11.2) 353/3036 (11.6)
Not employed 1486/3053 (48.7) 1474/3036 (48.6)
Had private insurance for prenatal care — no./total no. (%)§ 1404/3061 (45.9) 1335/3044 (43.9)
History of pregnancy loss — no. (%)
No previous pregnancy loss 2364 (77.2) 2266 (74.4)
Previous pregnancy loss 698 (22.8) 778 (25.6)
Before 13 wk of gestation only 637 (20.8) 698 (22.9)
At 13–19 wk of gestation only 23 (0.8) 40 (1.3)
Both before 13 wk and at 13–19 wk of gestation 14 (0.5) 17 (0.6)
Ectopic or molar pregnancy only 24 (0.8) 21 (0.7)
Uncertain time of pregnancy loss 0 2 (0.1)
Length of gestation at randomization — wk
Median 38.3 38.3
Interquartile range 38.0–38.6 38.0–38.6
Method of conception — no. (%)
In vitro fertilization 56 (1.8) 47 (1.5)
Ovulation induction or artificial insemination 30 (1.0) 24 (0.8)
Spontaneous 2976 (97.2) 2973 (97.7)
Smoked cigarettes — no. (%) 224 (7.3) 242 (8.0)
Drank alcohol — no./total no. (%)¶ 133/3062 (4.3) 107/3043 (3.5)
BMI at randomization‖
Median 30.5 30.3
Interquartile range 27.3–34.6 27.3–35.0
BMI ≥30 — no./total no. (%)‖ 1632/3049 (53.5) 1575/3027 (52.0)
Modified Bishop score at randomization**
Median 4 4
Interquartile range 2–5 2–5
Score <5 — no./total no. (%)** 1919/3062 (62.7) 1954/3042 (64.2)
* There were no significant differences between the groups except for previous pregnancy loss, which was less common in the induction group (P = 0.01). Percentages may not total 100 because of rounding.
† Race or ethnic group was reported by the participant.‡ Data are missing for 17 women (9 in the induction group and 8 in the expectant-management group).§ Data are missing for 1 woman in the induction group.¶ Data are missing for 1 woman in the expectant-management group.‖ The body-mass index (BMI) is the weight in kilograms divided by the square of the height in meters. Data are missing for 30 women (13 in
the induction group and 17 in the expectant-management group).** Modified Bishop scores range from 0 to 12, with lower scores associated with a higher chance of cesarean delivery. Data are missing for
2 women in the expectant-management group.
Table 1. Maternal Characteristics at Baseline.*
The New England Journal of Medicine Downloaded from nejm.org at A.R. Dykes Library University of Kansas Medical Center on September 12, 2018. For personal use only. No other uses without permission.
Copyright © 2018 Massachusetts Medical Society. All rights reserved.

n engl j med 379;6 nejm.org August 9, 2018 519
Labor Induction vs. Expectant Management
Maternal Outcomes
The percentage of women who underwent cesar-ean delivery was significantly lower in the induc-tion group than in the expectant-management group (18.6% vs. 22.2%; relative risk, 0.84; 95% CI, 0.76 to 0.93; P<0.001) (Table 3). This finding did not change materially after adjustment for previous pregnancy loss. Women assigned to induction of labor were also significantly less likely than women assigned to expectant man-agement to have hypertensive disorders of preg-nancy (9.1% vs. 14.1%; relative risk, 0.64; 95% CI, 0.56 to 0.74; P<0.001) and to have extensions of the uterine incision during cesarean delivery; in addition, women in the induction group re-ported less pain (i.e., had lower scores on the 10-point Likert scale) and more perceived control during childbirth (i.e., had higher scores on the Labor Agentry Scale). Although differences in scores were statistically significant, they were relatively small. Women in the induction group spent more time in the labor and delivery unit, but the length of their postpartum hospital stay was shorter (Table 3). Other secondary maternal
health outcomes were similar in the two groups (see the Supplementary Appendix).
Subgroup Analyses
Prespecified baseline subgroup analyses of the primary perinatal outcome and of the secondary outcome of cesarean delivery showed no signifi-cant differences in results according to race or ethnic group, maternal age, body-mass index, or modified Bishop score (all P>0.05 by the Breslow–Day test for homogeneity) (Fig. 2). Subgroup analysis also revealed no significant between-group difference in the two outcomes according to type of admitting provider.
Discussion
In this randomized trial involving low-risk nul-liparous women, we did not find a significant difference in the frequency of the primary out-come (a composite of adverse perinatal outcomes) between women randomly assigned to labor in-duction at 39 weeks of gestation and women assigned to expectant management. Nevertheless,
OutcomeInduction Group
(N = 3059)
Expectant-Management
Group (N = 3037)
Relative Risk (95% CI)† P Value‡
no. (%)
Primary composite outcome 132 (4.3) 164 (5.4) 0.80 (0.64–1.00) 0.049
Perinatal death 2 (0.1) 3 (0.1) 0.66 (0.12–3.33)
Respiratory support 91 (3.0) 127 (4.2) 0.71 (0.55–0.93)
Apgar score ≤3 at 5 min 12 (0.4) 18 (0.6) 0.66 (0.32–1.37)
Hypoxic–ischemic encephalopathy 14 (0.5) 20 (0.7) 0.70 (0.35–1.37)
Seizure 11 (0.4) 4 (0.1) 2.74 (0.91–8.12)
Infection 9 (0.3) 12 (0.4) 0.74 (0.31–1.76)
Meconium aspiration syndrome 17 (0.6) 26 (0.9) 0.65 (0.35–1.19)
Birth trauma 14 (0.5) 18 (0.6) 0.77 (0.38–1.55)
Intracranial or subgaleal hemorrhage 9 (0.3) 7 (0.2) 1.28 (0.48–3.42)
Hypotension requiring vasopressor support
2 (0.1) 5 (0.2) 0.40 (0.06–1.79)
* Details regarding the components of the primary perinatal outcome are provided in the Supplementary Appendix.† Exact confidence intervals are provided for rare outcomes. The widths of the confidence intervals for components of the
primary outcome have not been adjusted for multiplicity, so they should not be used to infer definitive effects of the management strategies.
‡ We used a group sequential method to control the type I error with the Lan–DeMets characterization of the O’Brien–Fleming boundary. One interim analysis was performed; in the final analysis of the primary outcome, a two-tailed P value of less than 0.046 was considered to indicate statistical significance. Since the adjustment is minimal, we report the 95% confidence interval for the relative risk.
Table 2. Primary Perinatal Outcome and Components.*
The New England Journal of Medicine Downloaded from nejm.org at A.R. Dykes Library University of Kansas Medical Center on September 12, 2018. For personal use only. No other uses without permission.
Copyright © 2018 Massachusetts Medical Society. All rights reserved.

n engl j med 379;6 nejm.org August 9, 2018520
T h e n e w e ngl a nd j o u r na l o f m e dic i n e
OutcomeInduction Group
(N = 3059)
Expectant-Management Group
(N = 3037)Relative Risk
(95% CI) P Value
Neonatal
Transfusion of blood products — no. (%) 4 (0.1) 5 (0.2) 0.79 (0.20–2.74) 0.75
Hyperbilirubinemia — no. (%)† 145 (4.7) 142 (4.7) 1.01 (0.81–1.27) 0.91
Hypoglycemia — no. (%) 37 (1.2) 35 (1.2) 1.05 (0.66–1.66) 0.84
Admission to neonatal intermediate or intensive care unit — no. (%)
358 (11.7) 394 (13.0) 0.90 (0.79–1.03) 0.13
Maternal
Cesarean delivery — no. (%) 569 (18.6) 674 (22.2) 0.84 (0.76–0.93) <0.001‡
Operative vaginal delivery — no. (%) 222 (7.3) 258 (8.5) 0.85 (0.72–1.01) 0.07
Hypertensive disorder of pregnancy — no. (%) 277 (9.1) 427 (14.1) 0.64 (0.56–0.74) <0.001‡
Chorioamnionitis — no. (%) 407 (13.3) 429 (14.1) 0.94 (0.83–1.07) 0.35
Third-degree or fourth-degree perineal laceration — no. (%)
103 (3.4) 89 (2.9) 1.15 (0.87–1.52) 0.33
Postpartum hemorrhage — no. (%) 142 (4.6) 137 (4.5) 1.03 (0.82–1.29) 0.81
Postpartum infection — no. (%) 50 (1.6) 65 (2.1) 0.76 (0.53–1.10) 0.15
Admission to ICU — no. (%) 4 (0.1) 8 (0.3) 0.50 (0.13–1.55) 0.26
Death — no. (%) 0 0 NA NA
Median duration of stay in labor and delivery unit (IQR) — hr§
20 (13–28) 14 (9–20) <0.001‡
Postpartum hospital stay — no. (%) 0.01‡¶
<2 days 322 (10.5) 317 (10.4)
2 days 2191 (71.6) 2084 (68.6)
3 days 399 (13.0) 452 (14.9)
4 days 130 (4.2) 166 (5.5)
>4 days 17 (0.6) 18 (0.6)
Median scores on Labor Agentry Scale (IQR)‖
At 6–96 hr after delivery 168 (148–183) 164 (143–181) <0.001‡
At 4–8 wk after delivery 176 (157–189) 174 (154–188) 0.01‡
Median labor pain scores (IQR)**
Worst score 8 (7–10) 9 (8–10) <0.001‡
Overall score 7 (5–8) 7 (5–9) <0.001‡
* Additional secondary outcomes are provided in the Supplementary Appendix. Exact confidence intervals and P values are provided for rare outcomes. The P values and 95% confidence intervals presented have not been adjusted for multiple comparisons of the secondary out-comes. ICU denotes intensive care unit, IQR interquartile range, and NA not applicable.
† Data are missing for 4 women (1 in the induction group and 3 in the expectant-management group).‡ The P value remained significant after controlling for multiple comparisons with the false discovery rate method.§ The totals exclude 7 women who delivered before admission to the labor and delivery unit. Data are missing for 2 women (1 in each group).¶ The variables were compared with the Cochran–Armitage trend test.‖ Scores on the Labor Agentry Scale range from 29 to 203, with higher scores indicating greater perceived control during childbirth; included
are women who had spontaneous labor, labor that started spontaneously but then was augmented, or induced labor. Data for 6 to 96 hours after delivery are missing for 288 women (127 in the induction group and 161 in the expectant-management group); data for 4 to 8 weeks after delivery are missing for 736 women (349 in the induction group and 387 in the expectant-management group).
** Labor pain was scored according to a 10-point Likert scale, with higher scores indicating greater pain; included are women who had spon-taneous labor, labor that started spontaneously but then was augmented, or induced labor. Data on worst score are missing for 274 women (110 in the induction group and 164 in the expectant-management group); data on overall score are missing for 275 women (110 in the induction group and 165 in the expectant-management group).
Table 3. Secondary Outcomes.*
The New England Journal of Medicine Downloaded from nejm.org at A.R. Dykes Library University of Kansas Medical Center on September 12, 2018. For personal use only. No other uses without permission.
Copyright © 2018 Massachusetts Medical Society. All rights reserved.

n engl j med 379;6 nejm.org August 9, 2018 521
Labor Induction vs. Expectant Management
the relative risk was 20% lower in the induction group than in the expectant-management group, and the corresponding 95% confidence interval suggests that labor induction is probably not as-sociated with a higher risk of adverse perinatal
outcomes than expectant management, and it may be associated with as much as a 36% lower risk than expectant management. Labor induc-tion also resulted in a significantly lower fre-quency of cesarean delivery and hypertensive
Figure 2. Prespecified Subgroup Analyses According to Maternal Baseline Variables.
The primary outcome was a composite of perinatal death or severe neonatal complications and consisted of one or more of the following during the antepartum or intrapartum period or during the delivery hospitalization: perinatal death, the need for respiratory support within the first 72 hours after birth, Apgar score of 3 or less at 5 minutes, hypoxic–ischemic encephalopathy, seizure, infection (confirmed sepsis or pneumonia), meconium aspiration syn-drome, birth trauma (bone fracture, neurologic injury, or retinal hemorrhage), intracranial or subgaleal hemorrhage, or hypotension requiring vasopressor support. Race was reported by the participant; “other” race or ethnic group includes other, unknown, or more than one race or ethnic group. Modified Bishop scores range from 0 to 12, with lower scores associated with a higher chance of cesarean delivery. The body-mass index (BMI) is the weight in kilo-grams divided by the square of the height in meters.
B Cesarean Delivery
Overall
Race or ethnic group
White
Black
Asian
Hispanic
Other
Modified Bishop score
<5
≥5
BMI
<30
≥30
Age
<35 yr
≥35 yr
No. ofPatients Relative Risk (95% CI)Subgroup
0.50 0.75 1.00 1.50 2.00 2.75
6096
2685
1404
192
1670
145
3868
2226
2865
3201
5846
250
A Primary Perinatal Outcome
1.0 2.0 3.0 5.0
Overall
Race or ethnic group
White
Black
Asian
Hispanic
Other
Modified Bishop score
<5
≥5
BMI
<30
≥30
Age
<35 yr
≥35 yr
No. withOutcome
Relative Risk (95% CI)No. of
PatientsNo. withOutcome
P Value forInteraction
P Value forInteractionSubgroup
0.79 (0.63–0.99)0.99 (0.31–3.17)
0.82 (0.57–1.17)
0.77 (0.58–1.02)
0.79 (0.53–1.17)
1.23 (0.34–4.41)
0.81 (0.61–1.06)
0.86 (0.56–1.32)
0.69 (0.44–1.09)0.77 (0.54–1.08)
1.54 (0.43–5.56)
0.80 (0.64–1.00)
0.85 (0.76–0.94)0.78 (0.56–1.10)
0.72 (0.60–0.87)
0.89 (0.79–1.00)
0.83 (0.67–1.03)
1.44 (0.77–2.70)
0.85 (0.76–0.95)
0.93 (0.77–1.11)
0.83 (0.68–1.01)0.76 (0.64–0.89)
0.75 (0.46–1.20)
0.84 (0.76–0.93)
6096
2685
1404
192
1670
145
3868
2226
2865
3201
5846
250
1243
472
320
53
366
32
940
302
393
845
1152
91
296
126
73
9
79
9
199
97
117
178
285
11
0.72
0.93
0.77
0.70
0.23
1.00
0.10
0.51
The New England Journal of Medicine Downloaded from nejm.org at A.R. Dykes Library University of Kansas Medical Center on September 12, 2018. For personal use only. No other uses without permission.
Copyright © 2018 Massachusetts Medical Society. All rights reserved.

n engl j med 379;6 nejm.org August 9, 2018522
T h e n e w e ngl a nd j o u r na l o f m e dic i n e
disorders of pregnancy than expectant manage-ment, even after post hoc adjustment for multi-plicity. Our data suggest that 1 cesarean delivery may be avoided for every 28 deliveries among low-risk nulliparous women who plan to under-go elective induction of labor at 39 weeks.
These findings contradict the conclusions of multiple observational studies that have suggest-ed that labor induction is associated with an increased risk of adverse maternal and perinatal outcomes.4-6 These studies, however, compared women who underwent labor induction with those who had spontaneous labor, which is not a comparison that is useful to guide clinical decision making. Conversely, our findings are consistent with observational studies,7-11,20-23 as well as the randomized trial conducted by Walker et al.,12 in which women undergoing labor induc-tion were compared with women undergoing the actual clinical alternative of expectant man-agement.
We found no significant difference in the magnitude of effect with respect to the primary perinatal outcome or cesarean delivery accord-ing to whether a woman had an unfavorable modified Bishop score at randomization. This finding may seem unexpected, given the consis-tent evidence that women with an unfavorable Bishop score have a higher chance of cesarean delivery when labor is induced than women with a favorable score.3 As shown by the frequency of cesarean delivery among women with an unfavor-able as opposed to a favorable baseline modified Bishop score (i.e., a score ≥5), this relationship holds true in our trial. Yet, because women with an unfavorable score at baseline also had a higher chance of cesarean delivery than women with a favorable score when they followed the expectant-management strategy, labor induction in women with an unfavorable score still result-ed in fewer cesarean deliveries than expectant management.
This trial is larger than previous randomized trials that compared labor induction with expect-
ant management in low-risk women, and as such it had the ability to detect differences that pre-vious trials may not have discerned. Eligibility criteria ensured that only women with reliable information on length of gestation were includ-ed, and both women with favorable modified Bishop scores at baseline and those with unfa-vorable scores were enrolled.
Limitations of the trial should be noted. First, because masking was not feasible, ascertainment bias is possible. Second, despite its size, the trial was not powered to detect differences in infre-quent outcomes, and most individual adverse perinatal outcomes were relatively uncommon. Third, it is unclear whether results are broadly generalizable; however, the inclusion of both university and community hospitals throughout the United States and of a variety of types of obstetrical providers, as well as the absence of a single protocol for induction or labor manage-ment, suggests that results are probably general-izable to similar centers. Finally, the cost-effec-tiveness of labor induction in low-risk nulliparous women at 39 weeks will need to be evaluated in further analyses.
In summary, we found that elective labor in-duction at 39 weeks of gestation did not result in a greater frequency of perinatal adverse out-comes than expectant management and resulted in fewer instances of cesarean delivery. These re-sults suggest that policies aimed at the avoidance of elective labor induction among low-risk nulli-parous women at 39 weeks of gestation are un-likely to reduce the rate of cesarean delivery on a population level; the trial provides information that can be incorporated into discussions that rely on principles of shared decision making.24-27
Supported by the Eunice Kennedy Shriver National Institute of Child Health and Human Development.
Dr. Silver reports receiving consulting fees from Gestavision. No other potential conflict of interest relevant to this article was reported.
Disclosure forms provided by the authors are available with the full text of this article at NEJM.org.
We thank Lindsay Doherty, M.S., for managing the data and protocol and for performing statistical analysis.
AppendixThe authors’ affiliations are as follows: the Department of Obstetrics and Gynecology, Northwestern University, Chicago (W.A.G., G.M.); University of Alabama at Birmingham, Birmingham (A.T.N.T.); University of Utah Health Sciences Center, Salt Lake City (R.M.S., K.H.); Stanford University, Stanford, CA (Y.Y.E.-S.); Columbia University, New York (A.P.-D.); Brown University, Providence, RI (D.J.R.); University of Texas Medical Branch, Galveston (G.R.S.), University of Texas Health Science Center at Houston, Children’s Memorial Hermann Hospital, Houston (S.P.C.), and University of Texas Southwestern Medical Center, Dallas (B.M.C.) — all in Texas; University of North Carolina at Chapel Hill, Chapel Hill (K.A.B.), and Duke University, Durham (G.K.S.) — both in North Carolina; Ohio State University, Columbus (J.D.I.), and MetroHealth Medical Center, Case Western Reserve University, Cleveland (E.K.C.) — both
The New England Journal of Medicine Downloaded from nejm.org at A.R. Dykes Library University of Kansas Medical Center on September 12, 2018. For personal use only. No other uses without permission.
Copyright © 2018 Massachusetts Medical Society. All rights reserved.

n engl j med 379;6 nejm.org August 9, 2018 523
Labor Induction vs. Expectant Management
in Ohio; University of Colorado School of Medicine, Anschutz Medical Campus, Aurora (R.S.G.); University of Pennsylvania, Philadel-phia (S.K.S.); University of Pittsburgh, Pittsburgh (H.N.S.) — both in Pennsylvania; Washington University, St. Louis (G.A.M.); the George Washington University Biostatistics Center, Washington, DC (M.M.R., E.A.T.); and the Eunice Kennedy Shriver National Insti-tute of Child Health and Human Development, Bethesda, MD (U.M.R.).
References1. Parikh LI, Reddy UM, Männistö T, et al. Neonatal outcomes in early term birth. Am J Obstet Gynecol 2014; 211(3): 265.e1-265.e11.2. American College of Obstetricians and Gynecologists. Practice bulletin no. 146: management of late-term and postterm pregnancies. Obstet Gynecol 2014; 124: 390-6.3. ACOG Committee on Practice Bulle-tins — Obstetrics. ACOG practice bulletin no. 107: induction of labor. Obstet Gyne-col 2009; 114: 386-97.4. Vardo JH, Thornburg LL, Glantz JC. Maternal and neonatal morbidity among nulliparous women undergoing elective induction of labor. J Reprod Med 2011; 56: 25-30.5. Dunne C, Da Silva O, Schmidt G, Natale R. Outcomes of elective labour induction and elective caesarean section in low-risk pregnancies between 37 and 41 weeks’ gestation. J Obstet Gynaecol Can 2009; 31: 1124-30.6. Guerra GV, Cecatti JG, Souza JP, et al. Elective induction versus spontaneous la-bour in Latin America. Bull World Health Organ 2011; 89: 657-65.7. Osmundson S, Ou-Yang RJ, Grobman WA. Elective induction compared with expectant management in nulliparous women with an unfavorable cervix. Obstet Gynecol 2011; 117: 583-7.8. Gibson KS, Waters TP, Bailit JL. Ma-ternal and neonatal outcomes in elec-tively induced low-risk term pregnancies. Am J Obstet Gynecol 2014; 211(3): 249.e1-249.e16.9. Stock SJ, Ferguson E, Duffy A, Ford I, Chalmers J, Norman JE. Outcomes of elec-tive induction of labour compared with expectant management: population based study. BMJ 2012; 344: e2838.
10. Cheng YW, Kaimal AJ, Snowden JM, Nicholson JM, Caughey AB. Induction of labor compared to expectant management in low-risk women and associated perina-tal outcomes. Am J Obstet Gynecol 2012; 207(6): 502.e1-502.e8.11. Darney BG, Snowden JM, Cheng YW, et al. Elective induction of labor at term compared with expectant management: maternal and neonatal outcomes. Obstet Gynecol 2013; 122: 761-9.12. Walker KF, Bugg GJ, Macpherson M, et al. Randomized trial of labor induction in women 35 years of age or older. N Engl J Med 2016; 374: 813-22.13. Rosenberger W, Lachin JM. Random-ization in clinical trials. New York: Wiley, 2002.14. Lange AP, Secher NJ, Westergaard JG, Skovgård I. Prelabor evaluation of induc-ibility. Obstet Gynecol 1982; 60: 137-47.15. Ludington E, Dexter F. Statistical analysis of total labor pain using the vi-sual analog scale and application to stud-ies of analgesic effectiveness during child-birth. Anesth Analg 1998; 87: 723-7.16. Hodnett ED, Simmons-Tropea DA. The Labour Agentry Scale: psychometric prop-erties of an instrument measuring control during childbirth. Res Nurs Health 1987; 10(5): 301-10.17. Shankaran S, Laptook AR, Ehren-kranz RA, et al. Whole-body hypothermia for neonates with hypoxic-ischemic en-cephalopathy. N Engl J Med 2005; 353: 1574-84.18. Bailit JL, Grobman WA, Rice MM, et al. Risk-adjusted models for adverse obstetric outcomes and variation in risk-adjusted outcomes across hospitals. Am J Obstet Gynecol 2013; 209(5): 446.e1-446.e30.19. Benjamini Y, Hochberg Y. Controlling the false discovery rate: a practical and
powerful approach to multiple testing. J R Stat Soc [B] 1995; 57: 289-300.20. Caughey AB, Sundaram V, Kaimal AJ, et al. Maternal and neonatal outcomes of elective induction of labor. Evid Rep Tech-nol Assess (Full Rep) 2009; 176: 1-257.21. Caughey AB, Sundaram V, Kaimal AJ, et al. Systematic review: elective induction of labor versus expectant management of pregnancy. Ann Intern Med 2009; 151: 252-263, W53-W63.22. Kawakita T, Iqbal SN, Huang CC, Reddy UM. Nonmedically indicated induc-tion in morbidly obese women is not asso-ciated with an increased risk of cesarean delivery. Am J Obstet Gynecol 2017; 217(4): 451.e1-451.e8.23. Gibson KS, Waters TP, Bailit JL. A risk of waiting: the weekly incidence of hyper-tensive disorders and associated maternal and neonatal morbidity in low-risk term pregnancies. Am J Obstet Gynecol 2016; 214(3): 389.e1-389.e12.24. Sparks TN, Yeaton-Massey A, Granados JM, Handler SJ, Meyer M, Caughey AB. How do maternal views of delivery outcomes vary by demographics and preferred mode of delivery? Am J Perinatol 2015; 32: 741-6.25. Schwarz C, Gross MM, Heusser P, Berger B. Women’s perceptions of induc-tion of labour outcomes: results of an online-survey in Germany. Midwifery 2016; 35: 3-10.26. Moore JE, Low LK, Titler MG, Dalton VK, Sampselle CM. Moving toward patient-centered care: women’s decisions, percep-tions, and experiences of the induction of labor process. Birth 2014; 41: 138-46.27. Yee LM, Kaimal AJ, Houston KA, et al. Mode of delivery preferences in a diverse population of pregnant women. Am J Ob-stet Gynecol 2015; 212(3): 377.e1-377.e24.Copyright © 2018 Massachusetts Medical Society.
ARTICLE METRICS NOW AVAILABLE
Visit the article page at NEJM.org and click on Metrics to view comprehensive and cumulative article metrics compiled from multiple sources, including Altmetrics.
www.nejm.org/about-nejm/article-metrics.
The New England Journal of Medicine Downloaded from nejm.org at A.R. Dykes Library University of Kansas Medical Center on September 12, 2018. For personal use only. No other uses without permission.
Copyright © 2018 Massachusetts Medical Society. All rights reserved.


