Page 1
Vinod M Thakare. et al./ Acta Biomedica Scientia. 2014;1(3):105-115.
Research Article
105
e - ISSN - 2348 - 2168
Print ISSN - 2348 - 215X
Print ISSN -
Acta Biomedica Scientia
Journal homepage: www.mcmed.us/journal/abs
ENHANCEMENT OF SOLUBILITY OF NITRENDIPINE BY SOLID
DISPERSION TECHNIQUE
Vinod M Thakare*1, Sonal D Patil
1, Bharat W Tekade
1, Kundan P Chaudhari
1, Umesh T
Jadhao1, Vijay R Patil
1, Rajendra P Zope
2
Department of Pharmaceutics, TVES’s Honorable Loksevak Madhukarrao Chaudhari College of Pharmacy, Faizpur, India.
Department of Physics, TVES’s Dhanaji Nana Mahavidyalaya, Faizpur, India.
Article Info
Received 29/06/2014
Revised 16/07/2014
Accepted 19/07/2014
Keywords:- Nitrendipine, Solid
dispersion, Poly vinyl
Alcohol, Polaxamer,
Solubility.
ABSTRACT
In present study PVA and Poloxamer188 are selected as carrier because of their chemical
and pharmaceutical inertness. Solubility behavior of Active pharmaceutical ingredient is
one of the most challenging aspects in the formulation development. Nitrendipine is a
dehydropyridine calcium antagonist widely used as antihypertensive and antianginal drug
but having very low aqueous solubility.The dissolution rate of nitrendipine by solid
dispersion was enhanced significantly with increasing the amount of dispersing agents.
PVA and Poloxamer188 by virtue of their water solubility may lead to an increase in
degree of solubility of poorly water-soluble drug.
INTRODUCTION
The solubility behavior of a drug is a key
determinant of its oral bioavailability. Insufficient
solubility has presented a challenge to the development of
a suitable formulation for oral administration of many
drugs [1-3].Aqueous solubility of a drug can be used as
first approximation of its dissolution rate. Drugs with low
aqueous solubility have low dissolution rates and hence
suffer oral bioavailability problems [2-3]. So if the
solubility of the drug is less than desirable, steps are to be
taken to improve its solubility [4-5]. There have been
numerous reports of the work done for the improvement of
the solubility and dissolution behavior of drugs [3]. Several
techniques have been developed concerning the
optimization of the dissolution rate of poorly water-soluble
drugs. Such methods include particle size reduction,
solubilization, salt formation etc, but there are several
disadvantages and limitations in use of these techniques
[4]. The solid dispersion technique for water insoluble
Corresponding Author
V. M. Thakare
Email:- [email protected]
drugs developed by Chiou and Reigelman provides an
efficient method to improve the dissolution rate of a drug
[5]. Solid dispersions can be prepared by various methods
depending on the conditions and need like Melting method,
Solvent evaporation method, Melting solvent method,
Supercritical fluid process, Kneading method, Freeze
drying etc [5-9]. Solid dispersion are classified on the basis
of their release mechanism into two major types, ie.
Sustained release type solid dispersion &Fast release type
solid dispersion. Characterization of Solid Dispersion by
Thermal analysis ie. Cooling curve method, Thermo
microscopic method, Differential thermal analysis,
Differential scanning calorimetry; X-ray diffraction
method; Spectroscopic method; Microscopic method. Drug
dissolution is the dynamic process by which solid material
is dissolved in a solvent and solubility describes an
equilibrium state where the maximal amount of drug per
volume unit is dissolved [10]. Solid dispersion of drug in
proper carriers is the most promising approach for
enhancing solubility because of the fact that, drug as a
molecular or near to molecular dispersion thus giving the
both benefits of a local increase in its solubility (within the
solid solution) and offering the maximum surface area of
Page 2
Vinod M Thakare. et al./ Acta Biomedica Scientia. 2014;1(3):105-115.
Research Article
106
compound after the dissolution of carrier in dissolution
media. Nitrendipine is a dehydropyridine calcium
antagonist widely used as antihypertensive and antianginal
drug. The major drawback in the therapeutic application
and efficacy of nitrendipine as oral dosage form is its very
low aqueous solubility (1.9-2.1 μg/ml at 250C) [11].
Hence
improvement of aqueous solubility of nitrendipine by solid
dispersion technique is necessary.
MATERIAL AND METHODS
Nifedipine collected as a gift sample from
Concept Pharmaceuticals, Aurangabad. Poloxamer 188 as
a gift sample from USV.Ltd. Mumbai, Polyvinyl alcohol,
Sodium hydroxide, Potassium dihydrogen phosphate,
Disodium hydrogen phosphate, Hydrochloric acid and
Ethyl acetate from Research Lab Ltd., Poona. Tween 80,
Magnesium sterate, Lactose from Cipla Ltd., Kolhapur,
Talc, Microcrystalline cellulose and all other materials and
solvents used were of analytical grade.
Methods
Selection of Suitable Method for Preparation of Solid
Dispersion
The method for preparing solid dispersion should
be such that there is minimum or no loss of the material
during preparation and almost all material should easily get
recovered with better yield of solid dispersion. The
selection of method is also depending on the characteristics
of the drug, carriers and solvents used. Nitrendipine
decomposes at high temperature, it is freely soluble in
ethyl acetate and the solvent is safe. Hence the solvent
evaporation method was selected for the preparation of
solid dispersions[6].
Preparation of Physical Mixture of Nitrendipine/ PVA
and Nitrendipine/Poloxamer188
The physical mixture of nitrendipine with carriers
was prepared by mixing the required amount of
nitrendipine and carriers for 15 min in a mortar with pestle
until a homogenous mixture was obtained. This resulting
mixture was sieved through an 100 mesh screen. The
powder was stored in a screw cap vial at room temperature
[12]. Table No. 1 showed the Composition of physical
mixtures.
Preparation of Solid Dispersion of Nitrendipine/PVA
and Nitrendipine/Poloxamer188:
Nitrendipine was dissolved in an appropriate
amount of ethyl acetate (2.5 times the total weight of drug
and polymer) after complete dissolution of nitrendipine
solution was dropped onto polymeric carriers PVA and
Poloxamer188 respectively. Solid dispersions of different
ratios were prepared. The solvent was then evaporated at
450C then resulting residue was dried in hot air oven for 1
hour and stored for 24 hours in a desiccators.
Subsequently, the dispersion was ground in a mortar and
passed through sieve no. 100 [13-14]. Table No. 2 showed
the Composition of solid dispersions.
Analysis of Drug Content in Solid Dispersions
The content of nitrendipine in each physical
mixture and solid dispersions of PVA and poloxamer 188
was determined using UV spectroscopy. Accurately
weighed solid dispersion or physical mixture equivalent to
10 mg of nitrendipine was transferred to 100 ml volumetric
flask and diluted to 100 ml with ethyl acetate and sonicated
for 30 min for complete solubilization of drug. Solution
was filtered
1 ml of this solution was taken and it was diluted to 100 ml
with ethyl aceatae and absorbance was taken at 355 nm.
Concentration of nitrendipine was determined using
calibration curve of nitrendipine in ethyl acetate [15-16].
Phase Solubility Studies
The phase solubility studies were carried out
according to the method reported by Higuchi and Connors.
Excess amount of nitrendipine was added to the screw
capped vials containing 20ml of aqueous solutions of
carriers at various concentrations and placed on a water
bath shaker and agitated at 37 + 0.50C for 72 hrs. After
equilibrium, the solutions were carefully filtered through
Whatman No 41 filter paper and the final solutions were
analyzed for the drug content at 355 nm using UV–visible
spectrophotometery [16].
Saturation Solubility Studies The saturation solubility study was carried out to
determine increase in the solubility of pure nitrendipine as
compared with the physical mixture (PM), solid
dispersions (SDs). Weighed amount of solid dispersions
were added to the glass vial containing 20 ml of solution.
The sealed flasks were shaken for 24 hr at room
temperature followed by equilibrium for three days. Then
the aliquots were withdrawn through whatman filter paper.
The concentration of nitrendipine was determined by UV
spectrophotometer at 355 nm [17-18]. The saturation
solubilities of drug, physical mixtures and solid dispersions
were determined in p H 1.2, 6.8, 7.4 buffer solutions.
Dissolution Rate Studies:
Aim of Dissolution Study: these studies was
carried out to check the in-vitro release from the solid
dispersions and to get information about the absorption of
the drug entity into the systemic circulation [19].
Selection of Dissolution Medium:-
Dissolution of solid dispersion should be seen in
pH 1.2, 6.8 and 7.4 buffer solutions [20-21].
Calibration curve in ethyl acetate:
Standard Stock Solution: Nitrendipine, 10 mg was
accurately weighed and transferred to 100 ml volumetric
Page 3
Vinod M Thakare. et al./ Acta Biomedica Scientia. 2014;1(3):105-115.
Research Article
107
flask. It was dissolved in ethanol and volume was made
upto 100 ml.
Working stock solution: A series of nitrendipine solution
ranging from 1 to 10 mcg/ml were prepared from standard
stock solution. The absorbance of all solution was
measured uv-spectrophotometrically at 355 nm[22]. By
using USP dissolution apparatus type 2 (paddle type) with
Speed of the paddle : 75 rpm having temperature : 37°C
+ 0.5°C, dissolution medium : pH 1.2 buffer with 1.5%
tween 80 pH 6.8 buffer with 1.5% tween 80, pH 7.4 buffer
with 1.5% tween 80, total volume of fluid : 900ml. sample
size : equivalent to 10mg of nitrendipine. Samples of 5 ml,
was withdrawn at regular intervals. The volume withdrawn
was replaced by fresh volume of dissolution medium to
maintain constant volume of medium. The filtered samples
were analyzed spectrophotometrically at 355 nm[23].
Characterization of Solid Dispersion
Differential Scanning Calorimetry The DSC measurements were performed on a
Differential Scanning Calorimetry (Seiko Instruments,
Japan) with a thermal analyzer. All accurately weighed
samples (about 5 mg of nitrendipine) were placed in sealed
aluminum pans, before heating under nitrogen flow (20
ml/min) at a scanning rate of 100C/min from 25
0C-250
0C.
An empty aluminum pan was used as reference[24-25].
X-Ray Diffraction
X-ray powder diffraction patterns (XRD) were
taken by Philips diffractometer with PW 1050/25
goniometer and Co (Kα 30-40 kV, 10-20 mA, λ = 1.79021
˚A) radiation, and by Huber Diffractometer with Cu
(Kα130-40 kV, 10-20 mA, λ = 1.54059 ˚A) [26].
Precompression Parameters of Powder Blend The powder blend was evaluated for
following parameters[27-29].The powder material was
evaluated for their texture under microscope
Angle of Repose
The angle of repose of each powder blend was
determined by glass funnel method and angle of repose
was calculated using the following equation,
Tan Ø = h/r
Where h and r are height and radius of the powder cone
respectively.
Bulk Density
Bulk density of solid dispersion granules were
determined by pouring gently 25 gm of sample through a
glass funnel into a 100 ml graduated cylinder. The powder
was carefully leveled without compacting it and the
apparent volume was measured (V0).Bulk density was
calculated.
Weight of sample
Bulk density(g/ml) = -------------------------------
Apparent volume of packing
Tapped density The tapped density was determined by pouring 25
gm sample (solid dispersion granules) through a glass
funnel into a 100 ml graduated cylinder. The cylinder was
tapped from height of 2 inches until a constant volume was
obtained. Volume occupied by the sample after tapping
was recorded and tapped density was calculated.
Weight of sample
Tapped density (g/ml) = ----------------------------------------
Tapped volume of packing
Compressibility It is also one of the sample method to evaluate
flow property of a powder by comparing the bulk density
and tapped density. A useful empirical guide is given by
the Carr’s Index:
Tapped density – Bulk density
Carr’s Index = ------------------------------------------ X 100
Tapped density
Hausner’s ratio It provides an indication of the degree of
densification that could result from vibration of feed
hopper. Lower the Hausner ratio better is the flowability.
Tapped density
Hausner’s ratio = ---------------------------
Bulk density
RESULTS AND DISCUSSION
The solid dispersion was successfully prepared by
using PVA and poloxamer 188 with different concentration
and then it was evaluated. The drug content in solid
dispersion and physical mixture of PVA and PXM188 with
nitrendipine was showed in Fig 1.
PXM188 with Nitrendipine.
PM- Physical mixture PVA- Polyvinyl alcohol SD-
Solid dispersion PXM- Poloxamer188
Phase Solubility Studies
Phase solubility studies were performed to
determine stoichiometric proportion of nitrendipine and
carriers-PVA and PXM188. Phase solubility analysis plot
for nitrendipine with PVA and PXM188 are given in
Figure 2. Phase solubility studies were carried out to
evaluate drug / carrier interaction in liquid state. The Phase
Solubility Analysis diagrams showed increase in drug
solubility with increase in concentration of PVA and PXM
188. A 5.06 fold increase in solubility of nitrendipine was
observed in 18%w/v solution of PVA, also a 6.58 fold
increase in drug solubility was observed in 18%w/v
solution of PXM188. Both the types exhibited AL type of
Page 4
Vinod M Thakare. et al./ Acta Biomedica Scientia. 2014;1(3):105-115.
Research Article
108
plot (Figure 2) indicating 1:1 stoichiometry for dispersion
of drug with carriers.
Saturation Solubility Studies
Improved dissolution behavior of solid
dispersions of drugs can be attributed to increase in
saturation solubility of drug as per Noyes Whitney
equation. Solid dispersion systems lead to reduction in
particle size of drug because of which there is an
enhancement of saturation solubility. This change was
confirmed by conducting similar saturation solubility
studies on untreated drug as control.
Saturation solubility data for all solid dispersions is given
in Figure 3 & Figure 4.
A proportionate increase in the carrier weight
fraction resulted in considerable change in the solubility of
solid dispersion systems. The solid dispersion has shown
increase in solubility by 4.07 to 4.57 folds as compared to
Nitrendipine. Between the two types of solid dispersion
systems, the one with the Poloxamer 188 carrier showed
highest saturation solubility.
Dissolution Studies Nitrendipine solid dispersions presented better
dissolution performance as compared to the pure drug in a
given time course. This may be attributed to improved
wettability of the drug particles, significant reduction in
drug particle size during the formation of the solid
dispersions, and the intrinsically higher rate of dissolution
of the selected soluble carriers, which could pull insoluble
but finely mixed drug particles into the bulk of dissolution
medium. The dissolution profiles of Nitrendipine, physical
mixtures and solid dispersions of Nitrendipine with PVA
and PXM188 are shown in Figure 5 and Figure 6
respectively.
Effect of Concentration of Carrier on Dissolution Rate
of Nitrendipine Three different drug: polymer ratios (1:4, 1:6 &
1:8) were selected to assess the effect of weight fraction of
polymer on drug release profiles of solid dispersions. All
the dispersions exhibited a definite rise in both rate and
extent of drug dissolution with increasing proportions of
carrier used. The possible reasons include facilitation of
Nitrendipine dissolution by higher amount of soluble
carrier and decrease in the particle size of the drug in the
dispersion. Figure 7 and Figure 8 show the effect of weight
fraction of polymer on dissolution rate of Nitrendipine
solid dispersions.
As shown in Figure 9, the solid dispersions with
PXM showed better release profile over corresponding
PVA solid dispersion at drug: carrier weight ratio of 1: 8.
This phenomenon may be due to the inherent differences
between the two polymers in terms of intrinsic rates of
dissolution and hydration, and possible complexation of
the drug with PXM or decrease in crystallinity of the co-
precipitated drug. The initial high drug release was
observed in 90 minutes and gets reduced at subsequent
time points. The equilibrium concentration that can be
achieved with the given formulation in the solution was
less than what was achieved at the first dissolution time
point. Probably the initial rapid release of drug from the
solid dispersion particles to the dissolution medium
resulted in high concentration, which was reduced with
time.
Characterization of Solid Dispersion of Nitrendipine:
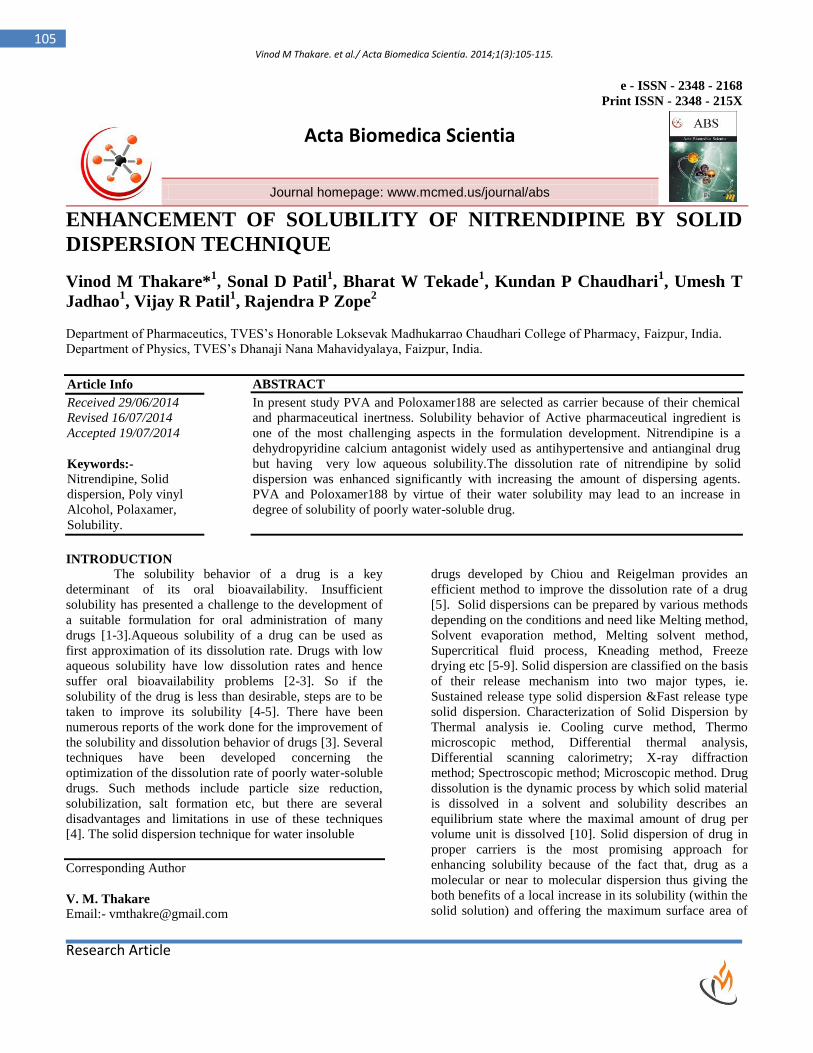
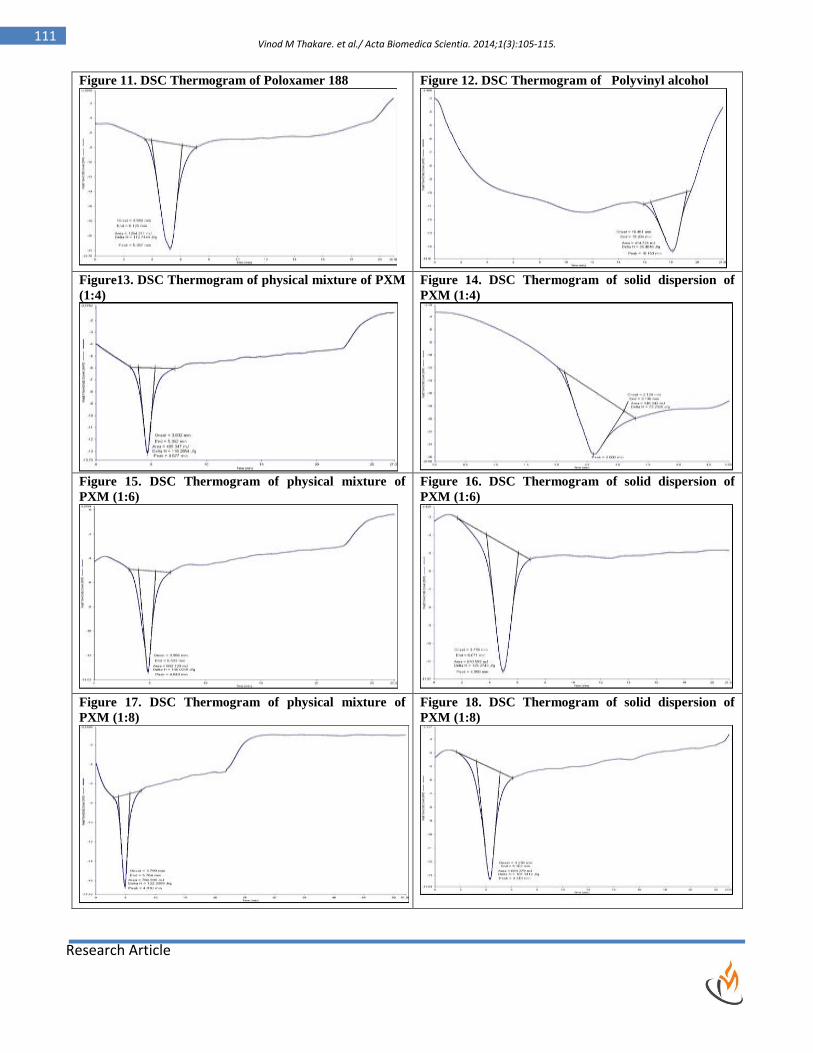
Differential Scanning Calorimetric Analysis
DSC Thermogram of nitrendipine shows
prominent endothermic peak shown in Figure 10. DSC
Thermogram of pure PXM 188 and PVA exhibited single
endothermic response in Figure 11 and Figure 12
respectively.The partly disappearance of the endothermic
peak of nitrendipine from thermogram indicates that
nitrendipine is homogenized with the carrier in an
amorphous state within solid dispersion.
Dissolution properties of drug particles are
affected greatly by nature and extent of crystallinity
present in them. An amorphous or the metastable form
dissolves faster because of the associated higher levels of
internal energy and greater molecular mobility. These
together enhance the thermodynamic properties of these
forms as compared to crystalline state. X – Ray diffraction
studies were performed to reveal the crystallinity of pure
drug, carriers, physical mixtures and solid dispersions.
The presence of numerous distinct peaks in X-
Ray Diffractogram of nitrendipine (Figure: 31) indicate
that nitrendipine as a crystalline material with
characteristic diffraction peaks appearing at a diffraction
angle of 2θ at 8.79, 9.95, 11.46, 13.93, 21.68, 24.36, 25.92
and 27.52.
Poloxamer (Figure: 32) also exhibited a distinct
pattern with diffraction peaks at diffraction angle of 2θ at
19.35, 23.39, 27.27, 28.05 and 26.32. But the spectrum of
PVA (Figure: 33) was characterized by complete absence
of any diffraction peak.
The diffraction pattern of physical mixture and
solid dispersion was found to differ in comparison with
drug. Some peaks were disappeared and some peak heights
were decreased. The comparison of these spectrum indicate
that the molecular state of nitrendipine prepared as drug
carrier solid dispersion was changed from crystalline state
to microcrystalline state and/or amorphous state and
having some peaks retained of drug that might be due to
some amount of drug present out of the solid dispersion. It
was not dispersed monomelecularly so some peaks of
nitrendipine was present on the X-Ray diffractogram in
Figure 38 & Figure 39 respectively.
In vitro Drug Release from the Solid Dispersion
The results have shown that solid dispersion of
nitrendipine with polyvinyl alcohol released the drug about
Page 5
Vinod M Thakare. et al./ Acta Biomedica Scientia. 2014;1(3):105-115.
Research Article
109
79% in 100 min. The solid dispersion of nitrendipine with
poloxamer 188 released the drug about 98% in 100 min.
This shows that poloxamer 188 has better dissolution rate
than polyvinyl alcohol. Thus there is increase in
dissolution rate of poorly water soluble drug by using solid
dispersion technique. The results were plot accordingly in
Figure No. 40-42
Evaluation of Solid Dispersion Tablet Blend The value of angle of repose was found to be
270C which indicate good flow property. Similarly
compressibility value was 18.45%.+ 0.25 The bulk density
of tapped density value was found to be less than one.
Hence have good flow property.
Table 1. Composition of physical mixtures
Sr. No. Physical Mixtures Ratio for Drug: Carrier
1 Nitrendipine: Polyvinyl alcohol 1:4
2 Nitrendipine: Polyvinyl alcohol 1:6
3 Nitrendipine: Polyvinyl alcohol 1:8
4 Nitrendipine: Poloxamer188 1:4
5 Nitrendipine: Poloxamer188 1:6
6 Nitrendipine: Poloxamer188 1:8
Table 2. Composition of Solid Dispersions
Sr. No. Solid Dispersions Ratio for Drug: Carrier
1 Nitrendipine: Polyvinyl alcohol 1:4
2 Nitrendipine: Polyvinyl alcohol 1:6
3 Nitrendipine: Polyvinyl alcohol 1:8
4 Nitrendipine: Poloxamer188 1:4
5 Nitrendipine: Poloxamer188 1:6
6 Nitrendipine: Poloxamer188 1:8
Table 3. Evaluation of Solid Dispersion Tablet Blend (± SD)
Parameters Tablet Blend
1 Shape Circular
1 + SD 270 + 0.5
2 Bulk density (g/ml) mean + SD 0.673+ 0.003
3 Tapped density (g/ml)mean+ SD 0.969 + 0.012
4 Compressibility % 18.45 + 0.25
5 Housner’s ratio 1.25+ 0.021
N=3
Figure 1. % Drug Content in solid Dispersion and
Physical Mixture of PVA and PXM188 with Nitrendipine
Figure 2. Effect of concentrations of carriers on
solubility of Nitrendipine
Page 6
Vinod M Thakare. et al./ Acta Biomedica Scientia. 2014;1(3):105-115.
Research Article
110
Figure 3. Solubility of Nitrendipine in Physical Mixtures
and Solid Dispersions of PVA
Figure 4. Solubility of Nitrendipine in Physical
Mixtures and Solid Dispersions of PXM 188
Figure 5. In vitro dissolution profile of Nitrendipine and
physical mixtures and solid dispersions of Nitrendipine
with PVA
Figure 6. In vitro dissolution profile Nitrendipine,
physical mixtures and solid dispersions of Nitrendipine
with PXM 188
Figure 7. Effect of weight fraction of drug: PVA on
Nitrendipine release
Figure 8. Effect of weight fraction of drug: PXM188 on
Nitrendipine release
Figure 9. Effect of Type of Polymer on Dissolution Rate
of Nitrendipine
Figure 10. DSC Thermogram of Nitrendipine
Page 7
Vinod M Thakare. et al./ Acta Biomedica Scientia. 2014;1(3):105-115.
Research Article
111
Figure 11. DSC Thermogram of Poloxamer 188
Figure 12. DSC Thermogram of Polyvinyl alcohol
Figure13. DSC Thermogram of physical mixture of PXM
(1:4)
Figure 14. DSC Thermogram of solid dispersion of
PXM (1:4)
Figure 15. DSC Thermogram of physical mixture of
PXM (1:6)
Figure 16. DSC Thermogram of solid dispersion of
PXM (1:6)
Figure 17. DSC Thermogram of physical mixture of
PXM (1:8)
Figure 18. DSC Thermogram of solid dispersion of
PXM (1:8)
Page 8
Vinod M Thakare. et al./ Acta Biomedica Scientia. 2014;1(3):105-115.
Research Article
112
Figure 19. DSC Thermogram of physical mixture of PVA
(1:4)
Figure 20. DSC Thermogram of solid dispersion of
PVA (1:4)
Figure 21. DSC Thermogram of physical mixture of PVA
(1:6)
Figure 22. DSC Thermogram of solid dispersion of
PVA (1:6)
Figure 23. DSC Thermogram of physical mixture of PVA
(1:8)
Figure 24. DSC Thermogram of solid dispersion of
PVA (1:8)
X-Ray Diffraction Analysis:
Figure 25. X-ray Diffractogram of Nitrendipine
Figure 26. X-ray Diffractogram of Poloxamer188
Page 9
Vinod M Thakare. et al./ Acta Biomedica Scientia. 2014;1(3):105-115.
Research Article
113
Figure 27. X-ray Diffractogram of Polyvinyl alcohol
Figure 28. X-ray Diffractogram of Physical Mixture of
PXM188(1:4)
Figure 29. X-ray Diffractogram of Solid Dispersion of
PXM (1:4)
Figure 30. X-ray Diffractogram of Physical Mixture of
PXM 188(1:6)
Figure 31. X-ray Diffractogram of Solid Dispersion of
PXM (1:6)
Figure 32. X-ray Diffractogram of Physical Mixture of
PXM 188 (1:8)
Figure 33. X-ray Diffractogram of Solid Dispersion of
PXM (1:8)
Figure 34. X-ray Diffractogram of Physical mixture of
PVA (1:4)
Page 10
Vinod M Thakare. et al./ Acta Biomedica Scientia. 2014;1(3):105-115.
Research Article
114
Figure 35. X-ray Diffractogram of Solid Dispersion of
PVA (1:4)
Figure 36. X-ray Diffractogram of Physical mixture of
PVA (1:6)
Figure 37. X-ray Diffractogram of Solid Dispersion of
PVA (1:6)
Figure 38. X-ray Diffractogram of Physical mixture of
PVA (1:8)
Figure 39. X-ray Diffractogram of Solid Dispersion of
PVA (1:8)
Figure 40. In-vitro Dissolution of Solid Dispersion of
Nitrendipine with Carriers in pH 1.2
Figure 41. In-vitro Dissolution of Solid Dispersion of
Nitrendipine with Carriers in pH 6.8
Figure 42. In-vitro dissolution of solid dispersion of
Nitrendipine with Carriers in pH 7.4
Page 11
Vinod M Thakare. et al./ Acta Biomedica Scientia. 2014;1(3):105-115.
Research Article
115
ACKNOWLEDGEMENT
The authors were taken efforts in the project.
However, it would not have been possible without the kind
support and help of many individuals and organizations.
The authors would like to extend their sincere thanks to
the Principal Dr V. R. Patil for providing facility for this
project.
REFERENCES
1. Leuner C, Dressman J. (2000). Eur J Pharm Biopharmaceutics, 50, 47-60.
2. Six K, Verreck G, and Peeters J. (2004). J Pharm Sci, 93(1), 124-130.
3. Waterbeemd HV, Lennernas H, Artursson P. (2000). Wiley-VCH Publication, Vol 18, 2nd Edn, 501-507.
4. Karavas E, Ktistis G, Xenakis A, Georgarakis E. (2006). Eur J Pharm Biopharm, 63, 103-114.
5. Kim EJ, Chun M K and Jang JS. (2006). Eur J Pharm Biopharm, 64, 200-205.
6. Chiou WL, Rigelman S. (1971). J Pharm Sci, 60(9), 1281-1302.
7. Serajuddin A. (1999). J Pharm Sci, 88(10), 891-900.
8. Udupa N, Tatwawadi SV, Gode KD. (2000). Varanasi BHU, Pharmatimes, 17(10), 13-16.
9. Broman E, Khoo C, Taylor LS. (2001). Int J Pharm, 222, 139-151.
10. Karanth H, Shenoy VS, Murthy RR. (2006). AAPS Pharm Sci Tech, 7(4), E1-8.
11. Shah TJ, Amin AF, Parikh JR, Parikh RH. (2007). AAPS Pharm Sci Tech, 8(2), E1-7.
12. Charumanee S and Okonoki S. (2004). CMU Journal, 3(2), 77-84.
13. Tantishaiyakul V, Kaewnopparat N, Ingkatawornwong S. (1996). Int J Pharm, 143(3), 59-66.
14. Won DH, Kim MS and Lee S. (2005). Int J Pharm, 301, 199-208.
15. Zein HE, Riad L and Bay AA. (1998). Int J Pharm, 168, 209-220.
16. Fernandes CM, Vieira MT and Vieira FJB. (2002). Eur J Pharm Sci, 15, 149-166.
17. Sammor OA, Hammad MA and Megrab NA. (2006). AAPS Pharma Sci Tech, 7(2), 1-9.
18. Nandi I, Bateson M, Bari M, Joshi HN. (2003). AAPS Pharma Sci Tech, 4(1), 1-5.
19. Kim EJ, Chun MK and Jang JS. (2006). Eur J Pharm Biopharm, 64, 200-205.
20. Goldberg AH, Gibaldi and M Kanig JL. (1966). J Pharm Sci. 55(5), 487-492.
21. Chowdary KPR and Shrinivasarao SK. (2001). The Eastern Pharmacist, 212-122.
22. Indian Pharmacopoeia. (1996). Government of India, The Controller of Publication, New Delhi, Vol II, A-144.
23. Li FQ and Hu JH. (2004). Chem Pharm Bull, 52(8), 972-973.
24. Han J and Suryanarayanan R. (1997). Int J Pharm, 157, 209-218.
25. Mooter GVD, Blaton N, Wuyts M, Busson R, Grobet P, Augustijns P, Kinget R. (2001). Eur J Pharm Sci, 12, 261-269.
26. Franco M, Tapani G and Latrofa A. (2001). Int J Pharm, 225, 63-73.
27. Lachman L, Liberman H and Kanig J. (1991). The Theory and Practice of Industrial Pharmacy, Varghese Publication,
Bombay, 4th
Ed, 316-317.
28. Venturella VS and Genarao AR. (2001). Eds In: Remington: The Science and Practice of Pharmacy, Vol I, 19th
Ed, 1605-
1609.
29. John MT.( 2002). Drug Dev Ind Pharm, 28, 809-813.