26 Journal of Agriculture and Food Sciences Volume 13 Number 2, October, 2015 pp. . Journal of the Faculty of Agriculture and Veterinary Medicine, Imo State University Owerri website: www ajol.info NIGERIA IN WORLD GINGER TRADE: AN ANALYSIS OF PERFORMANCE FROM 2008 – 2012 Ewuziem, J.E., Onyenobi, V.O., Ironkwe, A.G. and Tokula, M.H National Root Crops Research Institute Umudike, Nigeria Email: [email protected]Phone: +2348064833657 ABSTRACT This study assessed the performance of Nigeria in the world ginger trade using available secondary data from the United Nations commodity trade statistics. The trade performance of Nigeria was based on world ginger export characteristics, value of trade and quantity traded from 2008 to 2012 assessed on yearly and cumulative bases. The result indicates that during the five year period, Nigeria recorded an annual growth of 39%. But in the year 2011-2012, Nigeria lost in terms of price during this period by 24% despite the fact that the unit price for Nigeria ginger was higher ($2,463/ton) than the world average ($727). In terms of share in world exports, Nigeria contributed only 3.6% and listed on 6th position for ginger export. The world is paying prime price for Germany's ($3,758), UK's ($3,450) and Nigerian ($2,463) Ginger. Nigeria ginger during the period under review contributed a total of $115.564m on the basis of value to the world ginger value of $2401.756m representing a share of 4.81%. Cumulatively, a total of 51,483 tons of ginger was contributed by Nigeria to the world ginger market which is 1.35% of the world total (3,800,098 tons) during the period under review. This study revealed that Nigeria has over the years been an active participant in the world ginger trade and has contributed significantly to its growth. On the overall, the performance of Nigeria in the world ginger trade during the period under review cannot be described as blazing because the country has the largest area under ginger cultivation in the world and her ginger is one of the world’s best and highly valued in terms of unit price. It is therefore recommended that the ginger transformation program be sustained so as to boost local production and activate the ginger value chain for greater production, processing and marketing efficiency. Key words: Ginger, export, trade, value, quantity, period, market. DOI: http://dx.doi.org/10.4314/jafs.v13i2.3 INTRODUCTION Ginger is an herbaceous perennial plant, its flavouring type is classified as zingiber officinale which belongs to the order; scitamineae and the family; zingiberaceae. It is a tropical herb extensively grown for its pungently aromatic underground stem or rhizome which is an important export crop valued for its powder, oil and oleoresin (NEPC 1999). Ginger has been used as spices in most countries of the world. Research has proved that ginger could be used to cure certain ailments. Al-Achi (2007) reported that ginger is contraindicated in people Ewuziem, J.E., Onyenobi, V.O., Ironkwe, A.G. and Tokula, M.H 26- 42
Transcript
26 Journal of Agriculture and Food Sciences Volume 13 Number 2, October, 2015 pp. .
Journal of the Faculty of Agriculture and Veterinary Medicine, Imo State University Owerri website: www ajol.info
NIGERIA IN WORLD GINGER TRADE: AN ANALYSIS OF PERFORMANCE FROM 2008 – 2012
Ewuziem, J.E., Onyenobi, V.O., Ironkwe, A.G. and Tokula, M.H National Root Crops Research Institute Umudike, Nigeria Email: [email protected] Phone: +2348064833657
ABSTRACT
This study assessed the performance of Nigeria in the world ginger trade using available secondary data from the United Nations commodity trade statistics. The trade performance of Nigeria was based on world ginger export characteristics, value of trade and quantity traded from 2008 to 2012 assessed on yearly and cumulative bases. The result indicates that during the five year period, Nigeria recorded an annual growth of 39%. But in the year 2011-2012, Nigeria lost in terms of price during this period by 24% despite the fact that the unit price for Nigeria ginger was higher ($2,463/ton) than the world average ($727). In terms of share in world exports, Nigeria contributed only 3.6% and listed on 6th position for ginger export. The world is paying prime price for Germany's ($3,758), UK's ($3,450) and Nigerian ($2,463) Ginger. Nigeria ginger during the period under review contributed a total of $115.564m on the basis of value to the world ginger value of $2401.756m representing a share of 4.81%. Cumulatively, a total of 51,483 tons of ginger was contributed by Nigeria to the world ginger market which is 1.35% of the world total (3,800,098 tons) during the period under review. This study revealed that Nigeria has over the years been an active participant in the world ginger trade and has contributed significantly to its growth. On the overall, the performance of Nigeria in the world ginger trade during the period under review cannot be described as blazing because the country has the largest area under ginger cultivation in the world and her ginger is one of the world’s best and highly valued in terms of unit price. It is therefore recommended that the ginger transformation program be sustained so as to boost local production and activate the ginger value chain for greater production, processing and marketing efficiency.
Ginger is an herbaceous perennial plant, its flavouring type is classified as zingiber officinale which belongs to the order; scitamineae and the family; zingiberaceae. It is a tropical herb extensively grown for its pungently aromatic underground stem or rhizome which is an important export crop valued for its powder, oil and oleoresin (NEPC 1999). Ginger has been used as spices in most countries of the world. Research has proved that ginger could be used to cure certain ailments. Al-Achi (2007) reported that ginger is contraindicated in people
27 Journal of Agriculture and Food Sciences Volume 13 Number 2, October, 2015 pp. .
Journal of the Faculty of Agriculture and Veterinary Medicine, Imo State University Owerri website: www ajol.info
suffering from gallstones as the herb promotes the release of bile from the gall bladder. Also, Chen et al (2007) noted that ginger compounds are active against a form of diarrhea which is the leading cause of infant death in developing countries. Ginger had been found effective by multiple studies for treating nausea caused by seasickness, morning sickness and chemotherapy (Ernst and Pittler 2000).
Ginger is an important cash crop in Nigeria, which is one of the major world producers and exporters of the crop (Ojiako et al 2007). In the global market, Nigeria’s ginger is highly valued for its aroma, pungency; high oil (and less fibre) contents (Ikwelle et al 2003). Njoku et al (1995) reported that among the spices, (pepper, ginger, onion and chillies) ginger is the only one that is grown on a commercial scale for export. During 1999-2000, Nigeria occupied the fifth position in ginger export, after China, Thailand, Brazil and Taiwan. However, the country’s contribution to the world ginger market was only 1.75% whereas China’s contribution was 61.59%. New world encyclopedia (2008) recorded that in 2005, Nigeria occupied the fourth position in terms of ginger production (with an annual output of 110,000 MT) behind China (275,000 MT), India (230,000MT) and Indonesia (151,000MT). This data clearly indicates the importance of Nigeria in the world ginger export. Madan (2005) had earlier recorded that the world production of ginger stood at approximately 0.75 to 0.8 million tons from an area around 0.3 million hectares. The export was around 20% of total world production valued at 105.73 million (US dollars). During this period, ginger export from Nigeria was low if compared with countries like China and Brazil. This was attributed to the quality of Nigerian ginger as reported by Yiljep et al (2005) that the processing of Nigerian ginger was not standardized with the result that microbiological, organoleptic and chemical properties of the product often fall short of importers’ specifications. This was supported by Okwuowulu (2005) who reiterated that Nigerian ginger was valued as mere raw material for distillation and extraction, hence attracts drastically low price. Ebewelle and Jimoh (1981) traced the low quality of Nigerian ginger at that time to the traditional drying methods used by farmers to dry ginger, which according to them are varied, haphazard and risky, resulting to mould growth, loss of some volatile oil by evaporation and destruction of some heat sensitive pungent properties.
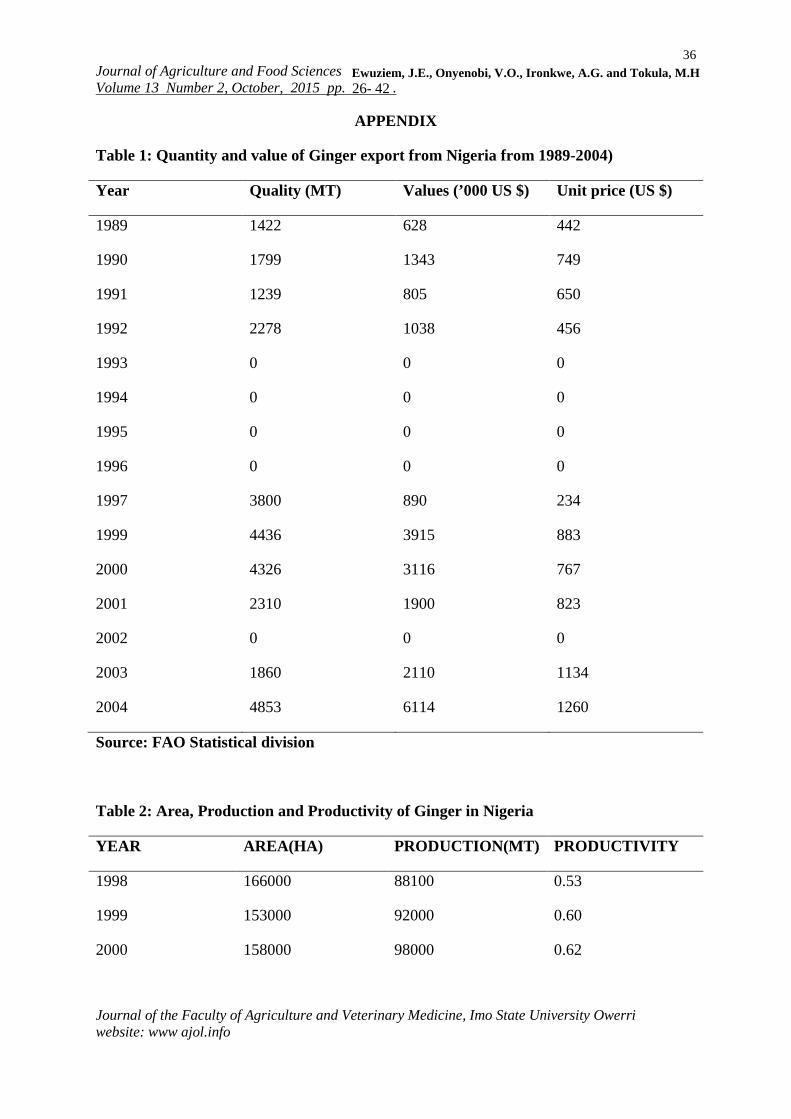
Nigeria currently has the world’s largest area under ginger cultivation and is one of the largest producers and exporters of the crop; especially the split-dried form. Large scale production of ginger started in 1927 (Anonymous 1970; Arene et al 1986) in Southern Kaduna. Between 1927 and 1982, the production for export fluctuated and ultimately declined due to poor prices in the export markets and because of the economic boom of mineral oil during the 1970’s. This situation, led to the neglect of crops that have great potentials to attract foreign currency to Nigeria. One of such neglected crops is ginger. The effect of this is that the area under ginger cultivation declined between 1999 and 2003, after which it recorded a steady increase, though marginally. However the production of ginger has been on the increase except in 1999 when there was a drop from 1998 figures.
28 Journal of Agriculture and Food Sciences Volume 13 Number 2, October, 2015 pp. .
Journal of the Faculty of Agriculture and Veterinary Medicine, Imo State University Owerri website: www ajol.info
Furthermore, in 2007, the land area under ginger cultivation was estimated to be 195000ha with a production of 138000mt of ginger. This shows a productivity of 0.71 implying that 1ha of land area cultivated, produced less than 1mt of ginger in Nigeria. On the average, a productivity value of 0.65 was estimated for Nigeria during that period.
The world scenario is shown in Table 3. The table shows that the land area under ginger cultivation followed the same trend as that of Nigeria.
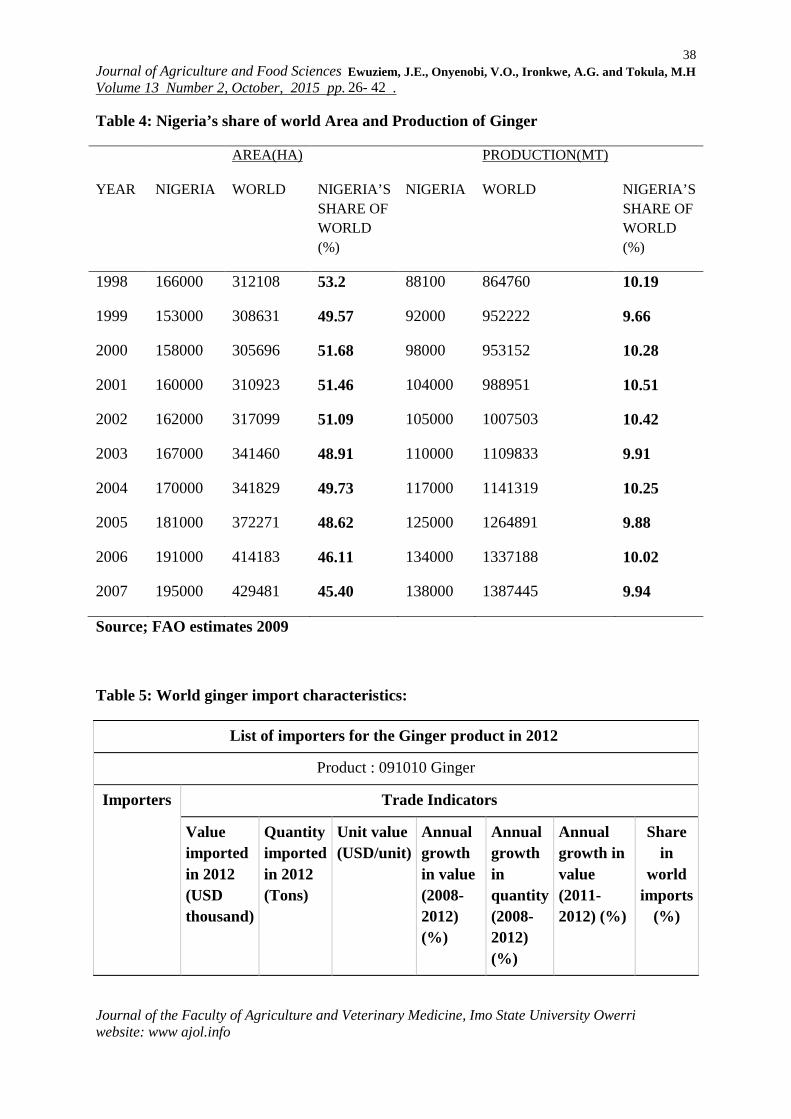
As shown in Table 3, a reduction in the area under ginger cultivation was recorded between 1999 and 2001, after which there was a steady increase. The world in 2007 recorded a cultivated land area of 429,481ha of ginger, with a production of 1,387,445mt. On the average, a productivity of 3.18mt/ha of ginger was recorded during the period under review. To contrast both world and Nigeria scenario during the period under review, a critical analysis was carried out and presented in Table 4.
Estimates in Table 4 indicate that Nigeria, over the years had contributed between 45.40 percent and 53.2 percent to the total land area under ginger cultivation in the world. On the production side, Nigeria had contributed 9.66 percent to 10.51 percent of world ginger production. The implication of this result is that Nigeria requires a production increase of between 450-500 percent to proportionately account for its large land area under ginger production.
The world trade in ginger is estimated at $190m per year. The main competitors in ginger export are China, Nigeria and Thailand. In 2004, Nigeria’s ginger export stood at 28,323mt valued at over $21.8m (Ewuziem et al 2009). This indicates that Nigeria occupies a very important position in world ginger cultivation and export. However, since available records show that Nigeria has the world’s largest area under ginger cultivation, it has become necessary to relate this to the world’s total area under ginger cultivation and productivity in order to assess Nigeria’s performance in ginger production. The information above shows that Nigeria is a very active participant in the world ginger trade. However it is necessary to assess the performance of Nigeria in the world ginger trade using available data. This paper therefore seeks to analyze the performance of Nigeria in the world ginger trade.
Methodology
Secondary data collected from international trade commodities (ITC) calculations based on United Nations Commodity trade (UN COMTRADE) statistics at www.gointernational.org.np (2015) were used for the study. The data series covered a period of five years (2008 to 2012). The national time series data, like those from central bank of Nigeria (CBN) or any relevant agency such as FAO could alternatively have been used, but it is a common fact to find differences in such data series from different sources (Manyoung and Nokoe 2003; Ojiako et al 2007; Ewuziem et al 2009). This explains the reliance on UN COMTRADE data. The analysis considered export characteristics of Nigeria ginger based on quantity and value of export, unit value of export, annual growths in quantity and value and
29 Journal of Agriculture and Food Sciences Volume 13 Number 2, October, 2015 pp. .
Journal of the Faculty of Agriculture and Veterinary Medicine, Imo State University Owerri website: www ajol.info
percentage share in world export to assess the performance of Nigeria in the world ginger trade.
Results and discussion
Global Trade Overview:
World ginger import characteristics:
It has been reported that in 2012, the world ginger trade stood at 609,137ton worth $516,745 showing that there is a growth of 11% on the value of ginger and 8% growth in the quantity during the five-year trade, though there was a decline in the value by 24% in 2011-2012 year trade (www.gointernational.org.np 2015).
Data derived from ITC calculations based on UN COMTRADE statistics shows that Japan was the largest importer in 2012 with 19.9% import share. USA, Netherlands, Germany, Bangladesh, Pakistan were other major importer of Ginger. India was listed on 12th position with 2.8% import share. Most of the major importers of ginger recorded a decline in ginger value with Pakistan having the highest decline of 57%.
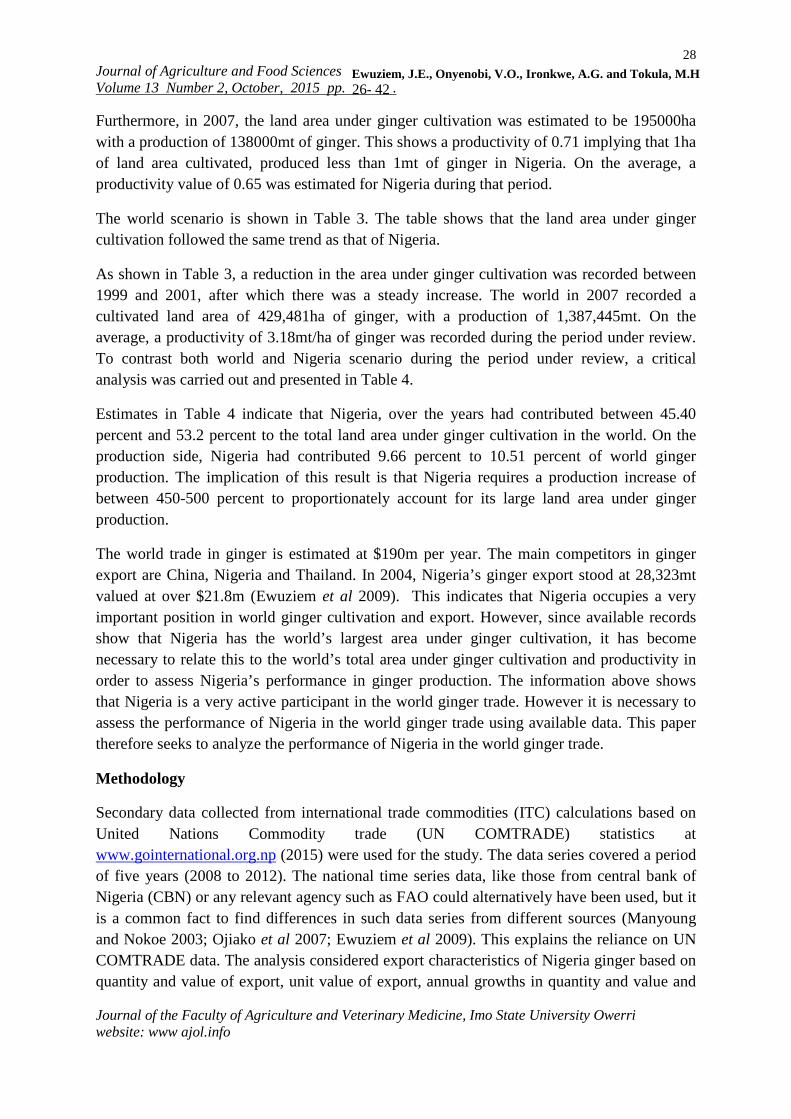
Meanwhile, Russian Federation, Germany, Sudan, Japan, Netherlands, UK and USA are the countries who are paying prime price for Ginger, offering prices above the world average price for ginger as shown in Figure 1. This implies that major exporters like Nigeria, should target these countries if they want to earn more money for their produce.
Figure 1: Countries that offer prices above the world average.
Indonesia is the most growing market for Ginger in terms of price and quantity. India paid ($302) much than that of world ($848) and its market was reduced by 4% during 2008-2012 and the price did not changed; in 2011-2012 the price appreciated by 3%.
30 Journal of Agriculture and Food Sciences Volume 13 Number 2, October, 2015 pp. .
Journal of the Faculty of Agriculture and Veterinary Medicine, Imo State University Owerri website: www ajol.info
World ginger export Characteristics
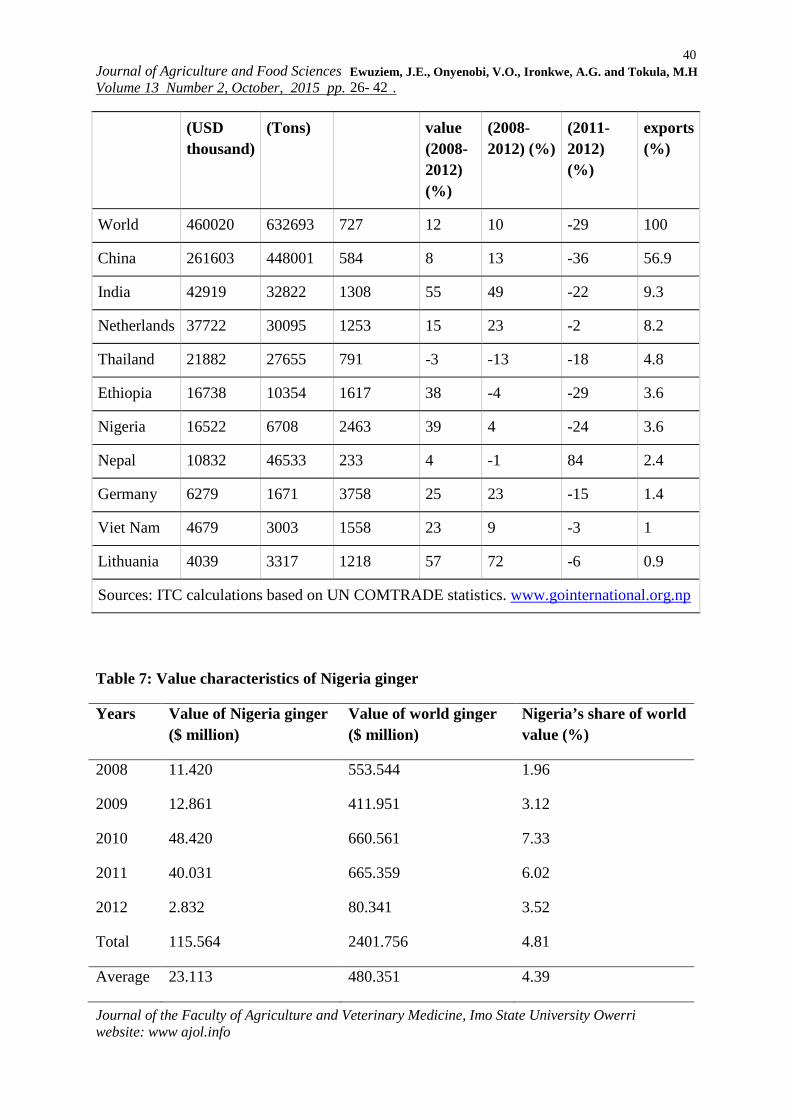
There are altogether 131ginger exporting countries in the world with Nigeria ranking among the top ten. The world Ginger market grew at a speed of 10% annually during 2008-2012 in terms of quantity. The price of Ginger also grew at 12% per annum. Nigeria recorded an annual growth of 39%, but in the period 2011-2012 the world price fell by 29%. Price of ginger in this period decreased. Nigeria lost in terms of price during this period by 24% despite the fact that the unit price for Nigeria ginger was higher ($2,463/ton) than the world average ($727). In terms of share in world exports, Nigeria contributed only 3.6%. India contributed the largest share of 56.9% to the world ginger exports. Lithuania, India, Nigeria, Ethiopia and Peru are some countries that gained the market in terms of quantity; however, they all lost in terms of price. In the trade Indicator of ITC (2013), Nigeria was listed in the 6th position for ginger export. The world is paying prime price for Germany's ($3,758), UK's ($3,450) and Nigerian Ginger ($2,463).
Performance of Nigeria ginger in terms of value
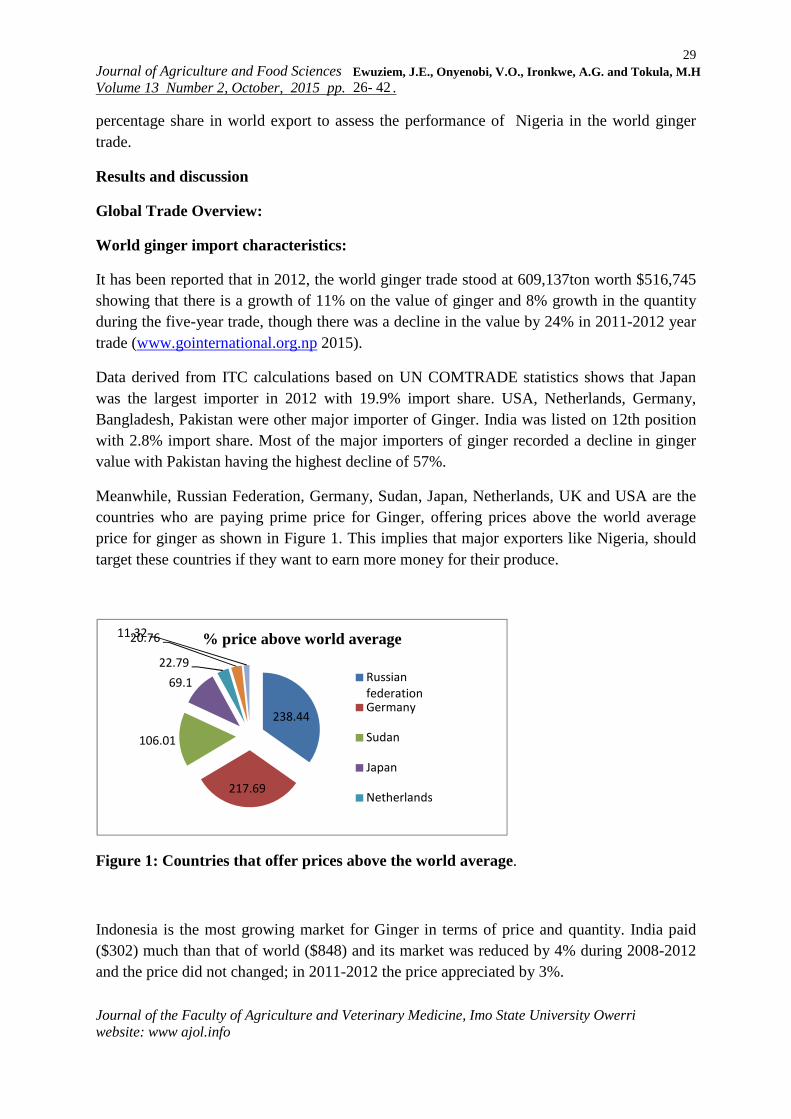
Nigeria ginger during the period under review contributed a total of $115.564m on the basis of value to the world ginger value of $2401.756m representing a share of 4.81% of the value of trade on ginger during the five-year period. The highest value recorded for Nigeria ginger was in 2010 with a value of $48.420m and a world share of 7.33%. On the average, the value of the world traded ginger during the five year period was $480.351m whereas the Nigeria average for the same period stood at $23.113m with an average share of 4.39%. This implies that Nigeria, despite having the largest area under ginger cultivation, coupled with having one of the best priced gingers, is contributing less than 5% to the value of traded ginger in the world. Actually, not much of the ginger from Nigeria is seen in the world ginger trade, establishing a supply gap which ginger farmers are expected to exploit.
Figure 2: distribution of Nigeria ginger export values ($m)
Journal of Agriculture and Food SciencesVolume 13 Number 2, October,
Journal of the Faculty of Agriculture and Veterinary Medicine, Imo State University Owerriwebsite: www ajol.info
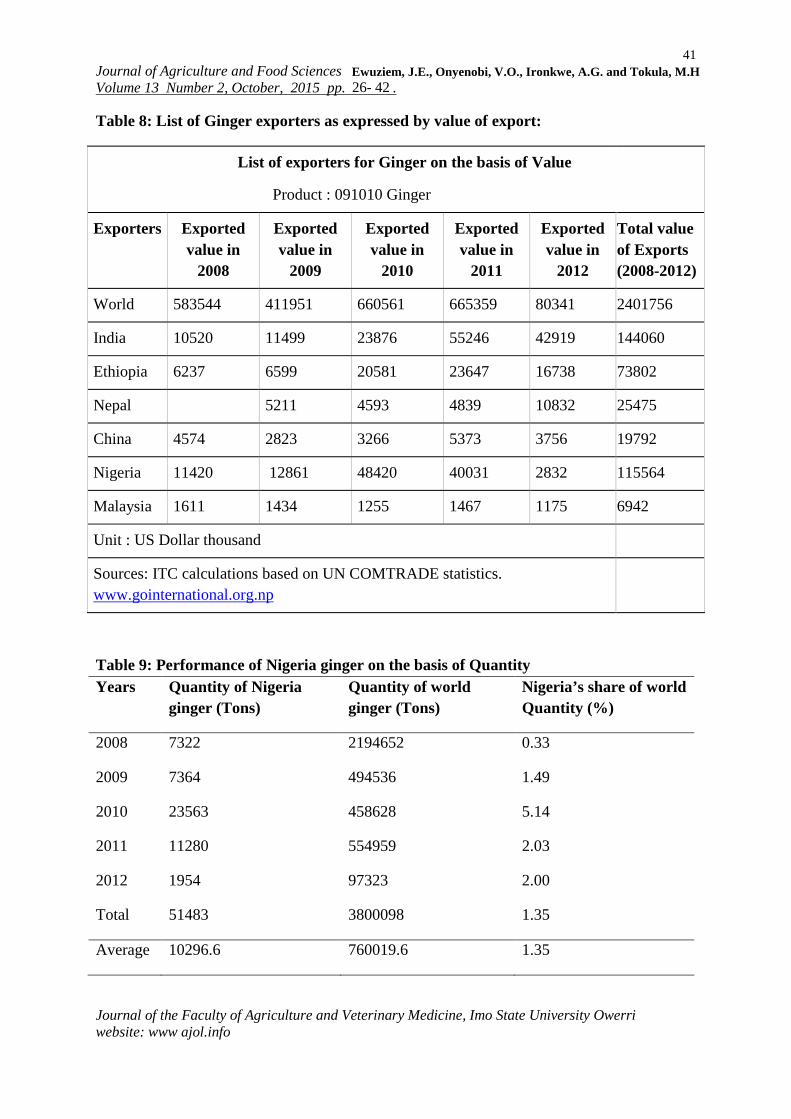
As shown in Table 8, in terms of the value received by the exporting country, India is the largest exporter in the world. In year 2012, India exported ginger worthEthiopia and Nepal are listed thereafter. Nigeria exported ginger worth only $2.83 Million in 2012 as against $48.42 Million in 2010 and $40.03 Million in 2011. A closer look at the Table 8 indicates that in 2009 and 2010, Nigeria ginger However, the export value in 2010 doubled the export value of ginger from any other country in that year. There was a remarkable reduction in 2011 which suddenly nosedived in 2012 to the least export value recorded in the fi
If we consider the total values of ginger exports among the top six exporting countries for the five year period under review, Nigeria is placed second with ginger valued at $115,564 behind India with ginger worth $144,060 (Figure 3)$73,804 worth of ginger. This implies that the competition is between Nigeria and India in terms of value of the cumulative values of ginger during this period.
Figure 3: cumulative values of ginger among the to
Performance of Nigeria ginger on the basis of Quantity
Nigeria ginger export on the basis of quantity shows a marginal increase in 2009 from that of 2008. However, in 2010 the country traded 23563 tons of ginger which was the highest for that year, but in terms of the percentage contribution to the world totalonly 5.14%. Cumulatively, a total of 51,483 tons of ginger was contributed by Nigeria to the world ginger market which is 1.35% of the world total (3,800,098 tons) during the period under review.
Furthermore; Nigeria ginger expoyear 2012. This is lower than the country’s previous performances. Nigeria’s best performance was recorded in 2010 when it was placed in the first position with 23.56
0
50,000
100,000
150,000 144,060
73,804
25,475
Journal of Agriculture and Food Sciences October, 2015 pp. .
Journal of the Faculty of Agriculture and Veterinary Medicine, Imo State University Owerri
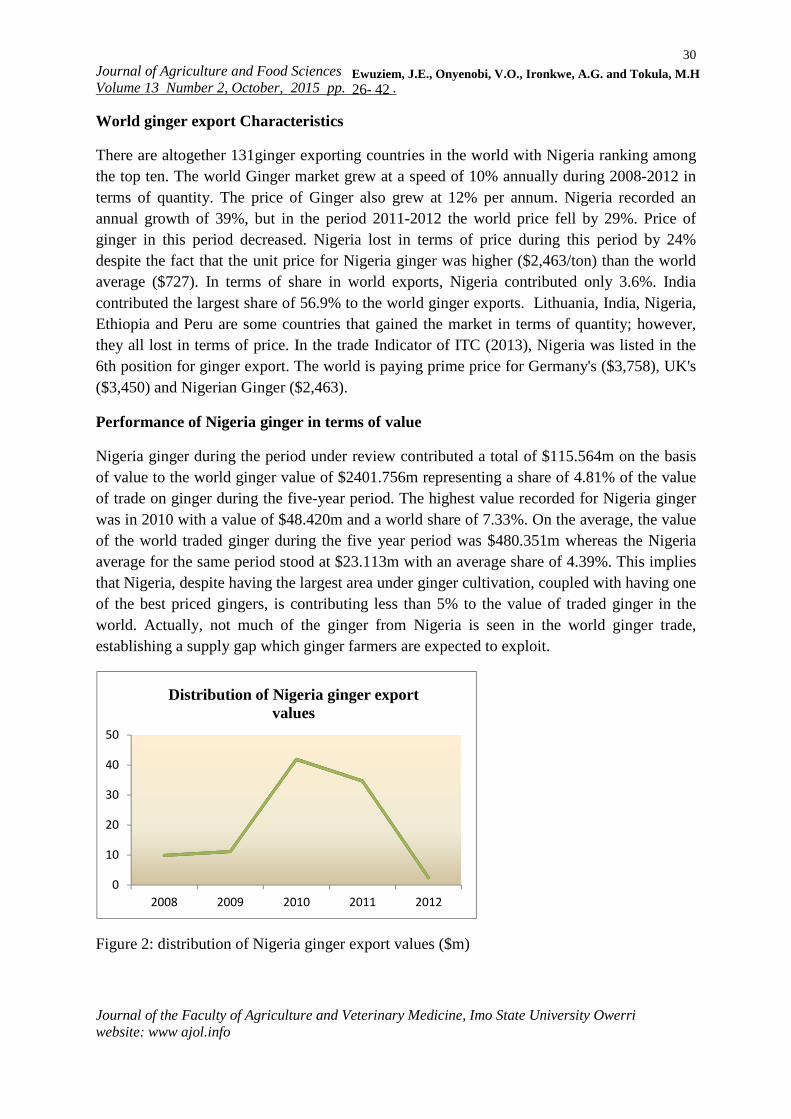
As shown in Table 8, in terms of the value received by the exporting country, India is the largest exporter in the world. In year 2012, India exported ginger worth $ 42.91 Million. Ethiopia and Nepal are listed thereafter. Nigeria exported ginger worth only $2.83 Million in 2012 as against $48.42 Million in 2010 and $40.03 Million in 2011. A closer look at the Table 8 indicates that in 2009 and 2010, Nigeria ginger export attracted higher values. However, the export value in 2010 doubled the export value of ginger from any other country in that year. There was a remarkable reduction in 2011 which suddenly nosedived in 2012 to the least export value recorded in the five years of analysis.
If we consider the total values of ginger exports among the top six exporting countries for the five year period under review, Nigeria is placed second with ginger valued at $115,564 behind India with ginger worth $144,060 (Figure 3). Ethiopia was placed a distant third with $73,804 worth of ginger. This implies that the competition is between Nigeria and India in terms of value of the cumulative values of ginger during this period.
Figure 3: cumulative values of ginger among the top six exporting countries (2008
Performance of Nigeria ginger on the basis of Quantity
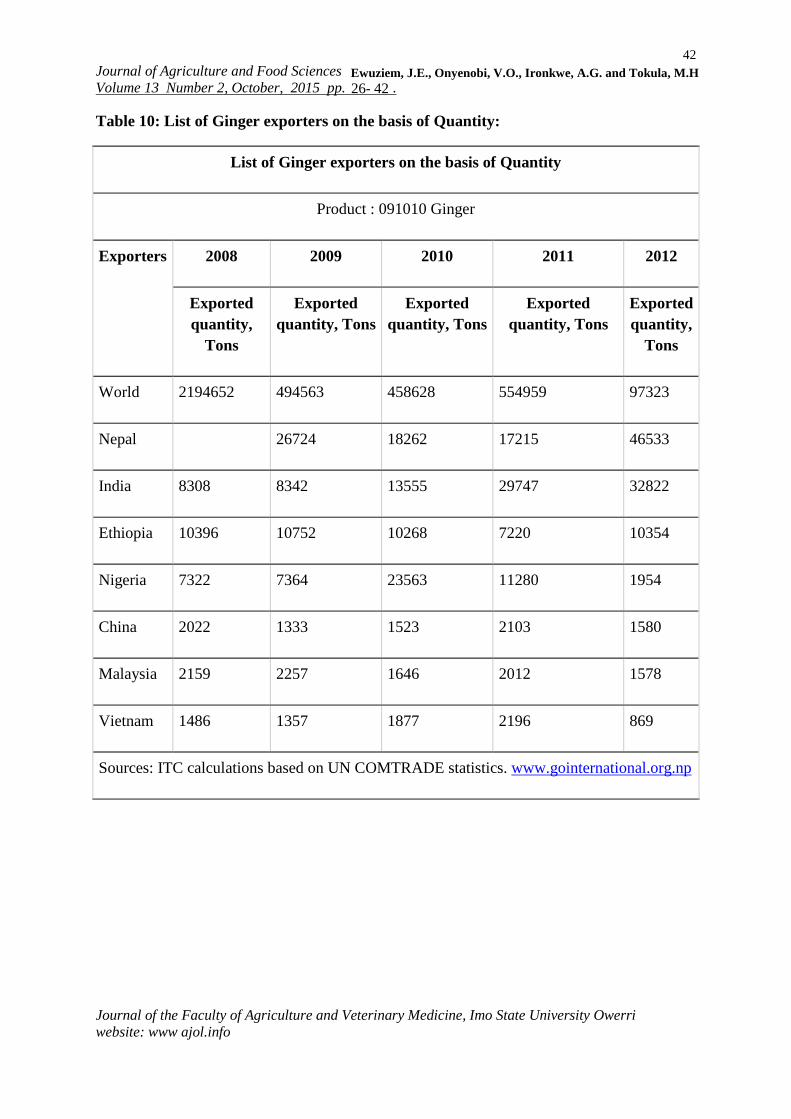
Nigeria ginger export on the basis of quantity shows a marginal increase in 2009 from that of 2008. However, in 2010 the country traded 23563 tons of ginger which was the highest for that year, but in terms of the percentage contribution to the world total, this figure represented only 5.14%. Cumulatively, a total of 51,483 tons of ginger was contributed by Nigeria to the world ginger market which is 1.35% of the world total (3,800,098 tons) during the period
Furthermore; Nigeria ginger export is placed in fourth position with 1.95 thousand tons in the year 2012. This is lower than the country’s previous performances. Nigeria’s best performance was recorded in 2010 when it was placed in the first position with 23.56
Journal of the Faculty of Agriculture and Veterinary Medicine, Imo State University Owerri
As shown in Table 8, in terms of the value received by the exporting country, India is the $ 42.91 Million.
Ethiopia and Nepal are listed thereafter. Nigeria exported ginger worth only $2.83 Million in 2012 as against $48.42 Million in 2010 and $40.03 Million in 2011. A closer look at the
export attracted higher values. However, the export value in 2010 doubled the export value of ginger from any other country in that year. There was a remarkable reduction in 2011 which suddenly nosedived in 2012 to
If we consider the total values of ginger exports among the top six exporting countries for the five year period under review, Nigeria is placed second with ginger valued at $115,564
. Ethiopia was placed a distant third with $73,804 worth of ginger. This implies that the competition is between Nigeria and India in
p six exporting countries (2008-2012)
Nigeria ginger export on the basis of quantity shows a marginal increase in 2009 from that of 2008. However, in 2010 the country traded 23563 tons of ginger which was the highest for
, this figure represented only 5.14%. Cumulatively, a total of 51,483 tons of ginger was contributed by Nigeria to the world ginger market which is 1.35% of the world total (3,800,098 tons) during the period
rt is placed in fourth position with 1.95 thousand tons in the year 2012. This is lower than the country’s previous performances. Nigeria’s best performance was recorded in 2010 when it was placed in the first position with 23.56
Ewuziem, J.E., Onyenobi, V.O., Ironkwe, A.G. and Tokula, M.H
Journal of Agriculture and Food SciencesVolume 13 Number 2, October,
Journal of the Faculty of Agriculture and Veterinary Medicine, Imo State University Owerriwebsite: www ajol.info
thousand tons, followed by contenders in terms quantity were; Nepal, India and Ethiopia.
If we consider the total quantities of ginger exported by countries in the world during the Five year period, Nigeria is placed in third position with 15.57%, supplying 51,483 tons of ginger; this is shown in the figure below.
Figure 4: Quantities of ginger contributed by seven maj2012)
Although Nepal had the highest contribution of 32.88% (108,734 tons), followed by India with 28.06% (92,774 tons), Nigeria ginger was better valued than those of these countries. Nigeria recorded a sharp drop in qu2012. The record of 2012 was worse due to a drop of over 91% of her contribution in 2010. This contributed greatly to the dwindling performance of Nigeria during this period.
Conclusion
This study revealed that Nigeria has over the years been an active participant in the world ginger trade and has contributed significantly to its growth. In both value of trade and quantity contributed to the ginger trade, Nigeria has been placed among the top five gexporting countries in the world. The competition is between India, Nigeria, Nepal and Ethiopia. However, Nigeria’s performance was best in both value of trade and quantity contributed in 2010.The overall performance of Nigeria in the world ginger trperiod under review cannot be described as satisfactory. It is expected that Nigeria will top the list of ginger producing and exporting countries, having the largest area under ginger cultivation in the world and her ginger being one of theterms of unit price. Nigeria is among countries that receive prime prices for their ginger.
28.06
14.81
15.57
2.592.92
2.35% contribution
Journal of Agriculture and Food Sciences October, 2015 pp. .
Journal of the Faculty of Agriculture and Veterinary Medicine, Imo State University Owerri
third position in 2011 with 11.28 thousand tons. Other top contenders in terms quantity were; Nepal, India and Ethiopia.
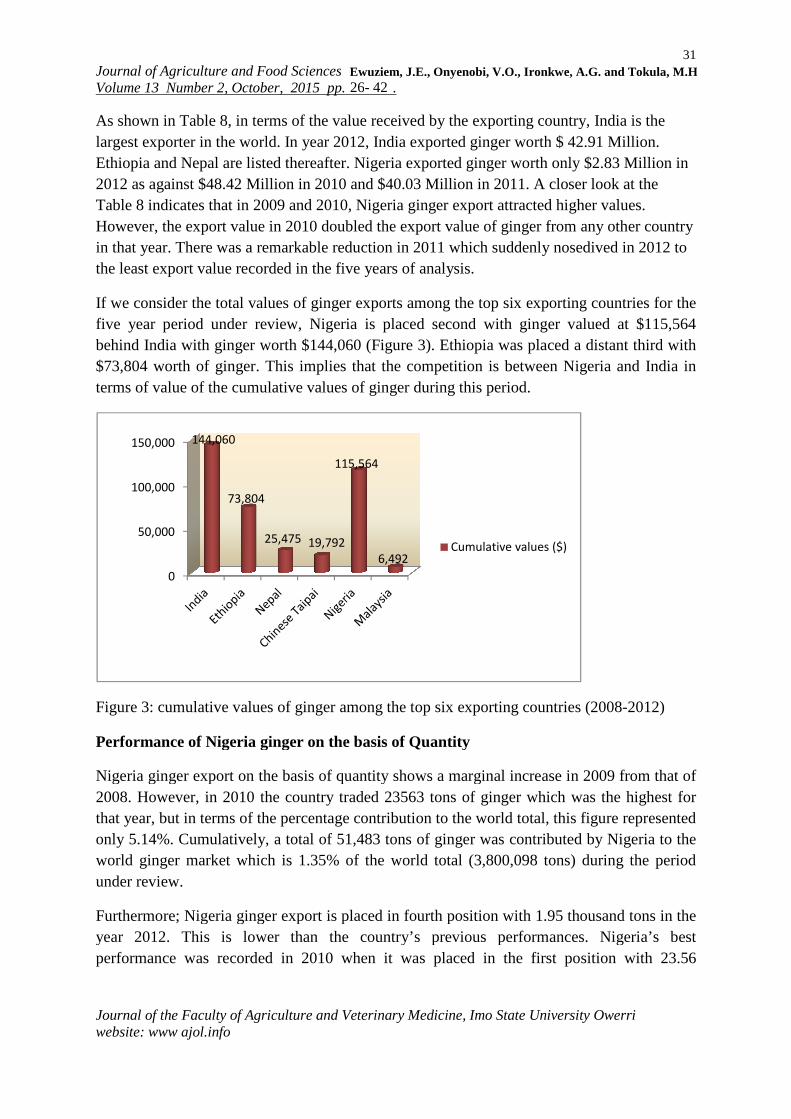
If we consider the total quantities of ginger exported by seven major ginger exporting countries in the world during the Five year period, Nigeria is placed in third position with 15.57%, supplying 51,483 tons of ginger; this is shown in the figure below.
Figure 4: Quantities of ginger contributed by seven major ginger exporting countries (2008
Although Nepal had the highest contribution of 32.88% (108,734 tons), followed by India with 28.06% (92,774 tons), Nigeria ginger was better valued than those of these countries. Nigeria recorded a sharp drop in quantity contributed to the world ginger market in 2011 and 2012. The record of 2012 was worse due to a drop of over 91% of her contribution in 2010. This contributed greatly to the dwindling performance of Nigeria during this period.
revealed that Nigeria has over the years been an active participant in the world ginger trade and has contributed significantly to its growth. In both value of trade and quantity contributed to the ginger trade, Nigeria has been placed among the top five gexporting countries in the world. The competition is between India, Nigeria, Nepal and Ethiopia. However, Nigeria’s performance was best in both value of trade and quantity contributed in 2010.The overall performance of Nigeria in the world ginger trperiod under review cannot be described as satisfactory. It is expected that Nigeria will top the list of ginger producing and exporting countries, having the largest area under ginger cultivation in the world and her ginger being one of the world’s best and highly valued in terms of unit price. Nigeria is among countries that receive prime prices for their ginger.
Journal of the Faculty of Agriculture and Veterinary Medicine, Imo State University Owerri
third position in 2011 with 11.28 thousand tons. Other top
seven major ginger exporting countries in the world during the Five year period, Nigeria is placed in third position with 15.57%, supplying 51,483 tons of ginger; this is shown in the figure below.
or ginger exporting countries (2008-
Although Nepal had the highest contribution of 32.88% (108,734 tons), followed by India with 28.06% (92,774 tons), Nigeria ginger was better valued than those of these countries.
antity contributed to the world ginger market in 2011 and 2012. The record of 2012 was worse due to a drop of over 91% of her contribution in 2010. This contributed greatly to the dwindling performance of Nigeria during this period.
revealed that Nigeria has over the years been an active participant in the world ginger trade and has contributed significantly to its growth. In both value of trade and quantity contributed to the ginger trade, Nigeria has been placed among the top five ginger exporting countries in the world. The competition is between India, Nigeria, Nepal and Ethiopia. However, Nigeria’s performance was best in both value of trade and quantity contributed in 2010.The overall performance of Nigeria in the world ginger trade during the period under review cannot be described as satisfactory. It is expected that Nigeria will top the list of ginger producing and exporting countries, having the largest area under ginger
world’s best and highly valued in terms of unit price. Nigeria is among countries that receive prime prices for their ginger.
Ewuziem, J.E., Onyenobi, V.O., Ironkwe, A.G. and Tokula, M.H
33 Journal of Agriculture and Food Sciences Volume 13 Number 2, October, 2015 pp. .
Journal of the Faculty of Agriculture and Veterinary Medicine, Imo State University Owerri website: www ajol.info
In order to sustain the excellent performance of Nigeria in the ginger trade of 2010, it is recommended that the ginger transformation program in Nigeria be sustained so as to boost local production of ginger and activate the ginger value chain for greater efficiency.
34 Journal of Agriculture and Food Sciences Volume 13 Number 2, October, 2015 pp. .
Journal of the Faculty of Agriculture and Veterinary Medicine, Imo State University Owerri website: www ajol.info
REFERENCES
Al-Achi, A (2007). ‘A current look at Ginger uses http://www.uspharmeist.com/oldformat.asp?) Retrieved on 02/08/2007
Chen, J. Li-jiau (2007). ‘Ginger and its bioactive component inhibit enterotoxigenic Eschemichia coli Heat liable enterotoxic-induced Diarrhea in Mice’ Journal of agriculture and food chemistry 55(21); 8390-8397. Doc. 10.1021/jfo71460f
Ebewelle, R.O and A.A. Jimoh (1981) ‘Feasibility studies of Kaduna state ginger processing industry’. Ahmadu Bello University Chemical engineering consultant 1-45, 50-56, 63-80
Ernest, E and M.H. Pittler (2000) “Efficiency of ginger for nausea and vomiting; a systematic review of randomized chemical trials British journal of anaesthesia 84 (3):367-371. AMID 10793599
Ewuziem, J. E., E.C.C. Amaechi and V.O. Onyenobi (2009) ‘Trend Analysis of Ginger export from Nigeria (1989-2004)’ proceedings of the 43rd Annual Conference of Agricultural Society of Nigeria, Abuja pp 367-370.
Food and Agricultural Organization (2009) “Country wise key statistics ( www.fao.org/es/ess/toptrade /trade.asp? Lang =EN& dir=exp &country=159 ) retrieved on 26/6/2009.
Ikwelle, M.C., T.O. Ezulike and O.N. Eke Okoro (2003). “Contribution of Root and Tuber crops to Nigerian economy’’ Proc. eight triennial symposium of the international society for Tropical Root Crops, Africa Branch (ISTRC-AB) held at the international institute of tropical Agriculture, Ibadan. November 12 -16, 2001 pp. 13-18.
Madan, M. S. (2005) “Production Marketing and Economics of ginger” CRC press ltd. London
Manyoung, V. M. and S.K. Nokoe (2003) “Modeling of yam production for effective policy formulation” Proc. Eighth Triennial Symposium of the international Society for Tropical Root Crops-Africa Branch (ISTRC-AB) held at the international institute of the Tropical Agriculture, Ibadan, November, 12-16. 2001. Pp 28-51.
New world encyclopedia (2008) “Ginger’’ (www.newworldencyclopadea.org/entry/ginger) . Retrieved on 16/9/08
Nigeria Export Promotion Council (1999) “Product profile of ginger’’ Nigerian export promotion council B/K 312, Kumba street, Wuse, zone 11, Abuja,1-6.
Njoku, B. O., E. N. A. Mbanasor and G. N. Asumugha (1995) “Ginger production by conventional and tissue culture techniques” Doff madi publishers, Owerri, 13-14
35 Journal of Agriculture and Food Sciences Volume 13 Number 2, October, 2015 pp. .
Journal of the Faculty of Agriculture and Veterinary Medicine, Imo State University Owerri website: www ajol.info
Ojiako, I. A., G.N. Asumugha, C. Ezedinma and N. E. Uzokwe (2007) ‘Analysis of production trends in the major root and tuber crops in Nigeria 1961-2005. Res. On crops 8 (2); 371-380
Okwuowilu, P.A. (2005) “Ginger in Africa and the Pacific Ocean Islands, CRC press Ltd. London
United Nations Commodity trade statistics (2015) www.gointernational.org.np Retrieved on 10/9/2015
Yiljep, Y.D., G.A. Fumen and E.S.A. Ajisegiri (2005) ‘The effects of peeling, splitting and Drying on Ginger quality and oil oleoresin content’ Agricultural Engineering international, The CIGR Journal vol. Vii. December, 2005.