Journal of Air Pollution and Health (Autumn 2019); 4(4): 241-252 Original Article CORRESPONDING AUTHOR: [email protected]Tel: (+98 21) 88988157 Fax: (+98 21) 88988157 ABSTRACT: Introduction: Exposure to benzene has been associated with a range of acute and long-term adverse health effects. We aimed to estimate national and provincial level of benzene emissions from 1990 to 2013 in Iran. Materials and methods: Benzene emission was estimated through two main sources: unburned benzene content of fuel and evaporated benzene. Unburned benzene content of fuel estimated by gasoline consumption rate, kilometers traveled by non-diesel-based cars, and benzene emission factor. Evaporated benzene estimated by evaporated gasoline and volumetric percentile of benzene. Results: The estimated provincial annual mean benzene estimation range was between 5.9 (ton) and 1590 (ton) from 1990 to 2013. Our results showed that maximum benzene emission over the past 24 years occurred in Tehran, (Mean± SD) (1147.2±308.5) (ton)), Isfahan (423.4±132) (ton)), Khorasan Razavi (410.4±122.2) (ton)) provinces, respectively. There was an upward trend in the benzene emission into atmosphere at national and subnational level from 1990 to 2007. Also a significant decrease trend is observed from 2008 to 2013. Conclusion: The findings of this study will provide an insight into the extent of emitted benzene in the atmosphere at different regions of Iran for policy makers and scientists and may be a groundwork for field studies on benzene concentration estimation. ARTICLE INFORMATION Article Chronology: Received 29 September 2019 Revised 24 November 2019 Accepted 01 December 2019 Published 30 December 2019 Keywords: Benzene emission; Iran; Gasoline; Benzene, Toluene, Ethylbenzene and Xylene (BTEX) Available online at http://japh.tums.ac.ir National and sub-national estimation of benzene emission trend into atmosphere in Iran from 1990 to 2013 Mansour Shamsipour 1,* , Mina Aghaei 2 , Safa Kalteh 2 , Mohammad Sadegh Hassanvand 3 , Kimiya Gohari 4 , Farzad Yunesian 5 , Heresh Amini 6, 7 1 Department of Research Methodology and Data Analysis, Institute for Environmental Research (IER), Tehran University of Medical Sciences, Tehran, Iran 2 Department of Environmental Health Engineering, School of Public Health, Tehran University of Medical Sciences, Tehran, Iran 3 Center for Air Pollution Research (CAPR), Institute for Environmental Research (IER), Tehran University of Medical Sciences, Tehran, Iran 4 Department of Biostatistics, Faculty of Medical Sciences, Tarbiat Modares University, Tehran, Iran 5 Environmental Engineer, Data Management Unit in Trial Contract Research Organization, Tehran, Iran 6 Swiss Tropical and Public Health Institute, Basel, Switzerland 7 University of Basel, Basel, Switzerland Introduction Nowadays hundreds to millions tons of air pollutants are annually emitted into the air which mainly originates from both anthropogenic and natural sources. Because of their adverse effects, air pollution poses a serious environmental challenges and is a significant threat to health worldwide. A large body of scientific evidence demonstrated that exposure to outdoor air pollution can affect human health in a variety of ways, ranging from subtle biochemical and physiological changes (subclinical and Please cite this article as: Shamsipour M, Aghaei M, Kalteh S, Hassanvand MS, Gohari K, Yunesian F, Amini H. National and sub- national estimation of benzene emission trend into atmosphere in Iran from 1990 to 2013. Journal of Air Pollution and Health. 2019; 4(4): 241-252.
Transcript
Journal of Air Pollution and Health (Autumn 2019); 4(4): 241-252
Original Article
C O R R E S P O N D I N G A U T H O R :[email protected] Tel: (+98 21) 88988157Fax: (+98 21) 88988157
A B S T R A C T:
Introduction: Exposure to benzene has been associated with a range of acute and long-term adverse health effects. We aimed to estimate national and provincial level of benzene emissions from 1990 to 2013 in Iran. Materials and methods: Benzene emission was estimated through two main sources: unburned benzene content of fuel and evaporated benzene. Unburned benzene content of fuel estimated by gasoline consumption rate, kilometers traveled by non-diesel-based cars, and benzene emission factor. Evaporated benzene estimated by evaporated gasoline and volumetric percentile of benzene. Results: The estimated provincial annual mean benzene estimation range was between 5.9 (ton) and 1590 (ton) from 1990 to 2013. Our results showed that maximum benzene emission over the past 24 years occurred in Tehran, (Mean± SD) (1147.2±308.5) (ton)), Isfahan (423.4±132) (ton)), Khorasan Razavi (410.4±122.2) (ton)) provinces, respectively. There was an upward trend in the benzene emission into atmosphere at national and subnational level from 1990 to 2007. Also a significant decrease trend is observed from 2008 to 2013. Conclusion: The findings of this study will provide an insight into the extent of emitted benzene in the atmosphere at different regions of Iran for policy makers and scientists and may be a groundwork for field studies on benzene concentration estimation.
A R T I C L E I N F O R M A T I O N
Article Chronology:Received 29 September 2019Revised 24 November 2019Accepted 01 December 2019Published 30 December 2019
National and sub-national estimation of benzene emission trend into atmosphere in Iran from 1990 to 2013
Mansour Shamsipour1,* , Mina Aghaei2, Safa Kalteh2, Mohammad Sadegh Hassanvand3 , Kimiya Gohari4 , Farzad Yunesian5, Heresh Amini6, 7
1 Department of Research Methodology and Data Analysis, Institute for Environmental Research (IER), Tehran University of Medical Sciences, Tehran, Iran2 Department of Environmental Health Engineering, School of Public Health, Tehran University of Medical Sciences, Tehran, Iran 3 Center for Air Pollution Research (CAPR), Institute for Environmental Research (IER), Tehran University of Medical Sciences, Tehran, Iran 4 Department of Biostatistics, Faculty of Medical Sciences, Tarbiat Modares University, Tehran, Iran5 Environmental Engineer, Data Management Unit in Trial Contract Research Organization, Tehran, Iran6 Swiss Tropical and Public Health Institute, Basel, Switzerland7 University of Basel, Basel, Switzerland
IntroductionNowadays hundreds to millions tons of air pollutants are annually emitted into the air which mainly originates from both anthropogenic and natural sources. Because of their adverse effects, air pollution poses a serious environmental
challenges and is a significant threat to health worldwide. A large body of scientific evidence demonstrated that exposure to outdoor air pollution can affect human health in a variety of ways, ranging from subtle biochemical and physiological changes (subclinical and
Please cite this article as: Shamsipour M, Aghaei M, Kalteh S, Hassanvand MS, Gohari K, Yunesian F, Amini H. National and sub-national estimation of benzene emission trend into atmosphere in Iran from 1990 to 2013. Journal of Air Pollution and Health. 2019; 4(4): 241-252.
M. Shamsipour, et al. National and sub-national estimation of... 242
http://japh.tums.ac.ir
symptomatic events) to severe illnesses such as asthma, cardiovascular disease, cancers and death [1, 2]. Developing countries, in which levels of air pollution exceed standards and fails to meet WHO guidelines for safe levels, will suffer the most [3]. In 2013, outdoor air pollution has been classified as a cancer-causing agent (carcinogen; Group 1) according to the International Agency for Research on Cancer (IARC) as a specialized cancer agency of the World Health Organization [4]. Volatile organic compounds (VOCs) are a most important class of pollutants that contain carbon and usually evaporate quickly into the air under normal atmospheric conditions [5]. Some of VOCs cause harm to human health or environment and, after particulate matters, have greatest diversity of emission sources [6, 7]. There has been an increasing interest in research on VOCs in the recent years because of their roles in photochemical reactions in the troposphere as well as their adverse health effects (e.g. eye and nose irritation, allergy, liver and kidney dysfunction, neurological impairment, carcinogenic and non-carcinogenic effects) [8].Among these compounds (VOCs), special attention is given to benzene, toluene, ethyl- benzene and o-, p- and m-xylenes (BTEX), due to (in terms of their) their toxicity and carcinogenicity at the levels found in urban areas [9]. Also BTEX compounds are reported as hazardous air pollutants according to US Clean Air Act [10]. One of the hazardous compounds is benzene, which has been considered as a carcinogenic to humans (Group 1) [11] .Concentrations of Benzene for ambient air should not exceed 5 μg/m3 based on EU air quality legislation and WHO guidelines, while the average of benzene and toluene found at levels exceeding the recommended limits in Traffic-Congested Cities [12]. Studies suggest exhaust and evaporative emissions from motor vehicles are among the most significant anthropogenic
sources of Benzene exposure in the general public [7]. The most common population exposure route to benzene and the other volatile organic pollutants is inhalation [7]. The most non-occupational exposures in indoor environment occur as a result of cigarette smoke [13]. According to some literatures, due to its carcinogenic potential, benzene, at low exposure levels, may lead to increased cancer risk of leukemia. Results of recent studies indicate that exposure to 3.19 mg/m3 benzene in the air may cause hematologic effects in humans [14, 15]. Other health effects of benzene including effects on central nervous system, cardiovascular and respiratory systems and immunological changes in humans and animals have been shown in epidemiological and experimental studies [14]. Hence, this compound, as a major public health concern, requires special attention, to do so, monitoring and management of ambient benzene concentration is necessary to reduce the content of benzene in the air and subsequently decrease its negative health effects. Onto date, no sufficient data on national levels of benzene emission in Iran were available and existing ones has only been focused on some megacities such as Tehran. This study is among the first studies investigating the emission trend of benzene in a more-than-two-decade period throughout the country and estimate it at the national and sub-national (provincial) level. It’s worth mentioning that the present study was carried out as a part of the National and Sub-national Burden of Disease (NASBOD) study in Iran and it is a subset of the environmental burden of diseases section study [16]. The main objective of the present study is to investigate the trend of benzene emission levels at the national and sub national level in Iran from 1990 to 2013. Knowing the emission trend of this risk factor over time is necessary to contribute in determination of interventional priorities and evaluation of national plans.
243
http://japh.tums.ac.ir
Journal of Air Pollution and Health (Autumn 2019); 4(4): 241-252
Materials and methods
Benzene emission estimations in different provinces of IranGiven that the main emission source of atmospheric benzene originates from vehicular benzene consumption, benzene emission was estimated through two main sources: unburned benzene content of fuel and evaporated benzene. Estimation of emitted benzene from unburned fuelIn summary, we used kilometers traveled by non-diesel-based cars in Iran and benzene emission factor. At first, all data on the amount of gasoline consumed during 1990-2013 for each province of Iran (31 provinces) was
obtained from the National Iranian Oil Products Distribution Company (NIOPDC). Then based on manufacturer’s ratings, the average gasoline consumption rate per 100 Km driving for Iranian cars was estimated [17]:we assumed that the cars were manufactured by Iran Khodro, Peugeot, Saipa and Renault companies between 1990 and 2013 (category 1) and the products of other new car-manufacturing companies were widely introduced to Iranian market from 2003 onwards (category 2). Therefore, fuel consumption rates of all cars were obtained and the average fuel consumption was calculated (Tables 1 and 2).
Table 1. Average fuel consumption for cars available at Iranian market from 1990 to 2002
Manufacturer Company Car model Fuel consumption (L/100 Km Driving)
Iran Khodro Company (IKCO) Samand LX Sal 8.00 Iran Khodro Company (IKCO) Samand LX-EF7 Gasoline 7.80 Iran Khodro Company (IKCO) Samand LX Automatic 7.60 Iran Khodro Company (IKCO) Samand SE 8.50 Iran Khodro Company (IKCO) Samand Soren ELX 7.80
Peugeot Peugeot 206 SD V9 7.30 Peugeot 207i Automatic 7.10 Peugeot Pars Automatic 8.20Peugeot Pars ELX 8.10 Peugeot 206 version 6 automatic 7.30 Peugeot 207i 6.40Peugeot Pars Dual fuel 9.10 Peugeot Pas LX 7.50 Peugeot 206 SD V8 6.60Peugeot 206 ver. 5 6.40 Peugeot 206 SD V2 6.60 Peugeot 206 ver. 2 6.30 Peugeot GLX Dual Fuel 9.10 Renault Mégane II (Sedan 2000 cc) 7.50 Renault Tondar 90 Automatic 8.30 Renault Mégane II (1600 cc) 6.70 Renault Tondar 90 E2 6.90 SAIPA Pride Tiba 7.10 SAIPA Pride Saba 7.00 SAIPA Pride 132 6.80 SAIPA Pride 141 7.00 SAIPA SAIPA S300 6.70
Average fuel consumption 7.40
The average fuel consumption of Iranian automobiles from 1990 to 2002 was obtained 7.4 L/100 km (Table 1).
Table 1. Average fuel consumption for cars available at Iranian market from 1990 to 2002
The average fuel consumption of Iranian automobiles from 1990 to 2002 was obtained 7.4 L/100 km (Table 1).
M. Shamsipour, et al. National and sub-national estimation of... 244
http://japh.tums.ac.ir
Table 2. Average fuel consumption for cars available at Iranian market from 2003 to 2013Table 2. Average fuel consumption for cars available at Iranian market from 2003 to 2013
Manufacturer company Car model Combined fuel consumption (L/100 Km Driving)
Citroën Xantia SX2000 9.10 Citroën New C5 8.40 Suzuki Grand Vitara Automatic 9.70 Suzuki Grand Vitara Manual 8.90 Suzuki Grand Vitara Automatic 9.40Suzuki Grand Vitara Manual 9.10
Kia Motors Cadenza 9.40 Kia Motors Mohave V8 13.40 Kia Motors Sorento 8.20 Kia Motors Optima 7.90 Kia Motors Sportage SL 9.20 Kia Motors Cerato (SAIPA Group Assembly) 7.70 Kia Motors Opirus 10.90
Avg. fuel Consumption 9.14
In addition, for the years between 2003 and 2013, the average gasoline consumption rate for Iranian cars, considering 80% of cars were classified as category 1 (Table 1) and 20% as category 2 (Table 2) per 100 km driving were determined as follows:
Average gasoline consumption per 100 km driving 2003 -2013: [7.4 × 80%] + [9.14 × 20%] = 7.74 L
Then using estimated average gasoline consumption rate per 100 km driving (7.74 L) and the amount of gasoline consumed during 1990-2013 for each province of Iran, we estimated how many kilometers are driven by Iranian cars. Next, we estimated the amount of emitted
245
http://japh.tums.ac.ir
Journal of Air Pollution and Health (Autumn 2019); 4(4): 241-252
In addition, for the years between 2003 and 2013, the average gasoline consumption rate for Iranian cars, considering 80% of cars were classified as category 1 (Table 1) and 20% as category 2 (Table 2) per 100 km driving were determined as follows: Average gasoline consumption per 100 km driving 2003 -2013: [7.4 × 80%] + [9.14 × 20%] = 7.74 LThen using estimated average gasoline consumption rate per 100 km driving (7.74 L) and the amount of gasoline consumed during 1990-2013 for each province of Iran, we estimated how many kilometers are driven by Iranian cars. Next, we estimated the amount of emitted benzene from unburned fuel by multiplying the kilometers driven by cars in the benzene emission factor per 100 km. Given that no study conducted in Iran about benzene emission factor, we used emission factor per 100 km from study published in 2014 (19 mg/km) which its volume of benzene in gasoline was similar to the volume percent of benzene in our country [18] .
Evaporated benzene estimation Evidence shows that approximately 45 L gasoline evaporates per 10000 L of consumed gasoline [19] Therefore, the evaporated gasoline was estimated according to the following equation:
By multiplying the evaporated gasoline and volumetric percentile of benzene (0.017), the evaporated benzene was calculated [20]. Finally, the amount of benzene emission was obtained by sum of emitted benzene from unburned and evaporated benzene (we assumed 1 kg equal to 1 L).
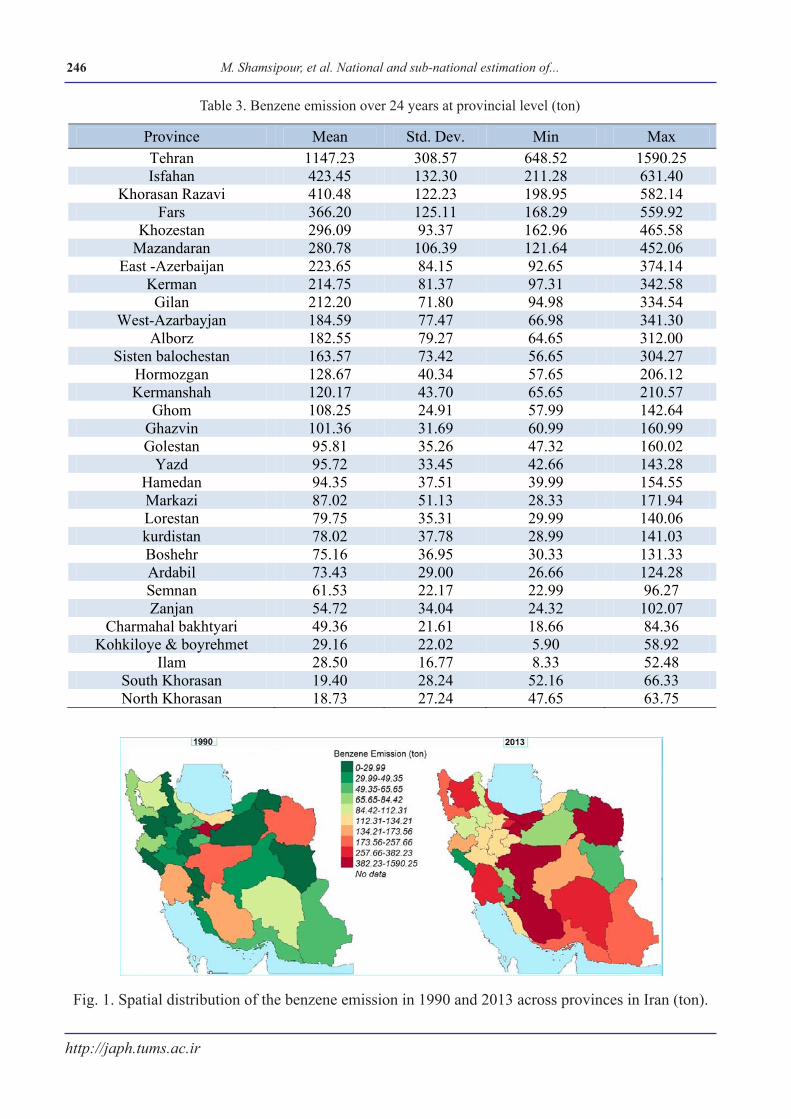
Results and discussion We used 744 province-year gasoline rate consumption for the period of 1990 to 2013 period to estimate benzene emission. Benzene emission descriptive measures over 24 years for each province are presented in Table 3. As shown in the Table 3, the maximum benzene emission over the past 24 years occurred in Tehran, Isfahan, Khorasan Razavi, Fars and Khuzestan provinces, respectively, and Ilam, Kohkiluye & Buyer Ahmad and Chahar Mahal Bakhtiary provinces had minimum benzene emission caused by gasoline consumption over the past two decades. As presented in Table 3, the emission rate for Tehran, Isfahan and Khorasan provinces are tens of times higher than of Ilam and Chahar Mahal Bakhtiary provinces.Fig. 1 depicts the spatial distribution of benzene emission in 1990 and 2013 across Iran. As demonstrated in Fig. 1, the levels of benzene emission were higher in Tehran, Isfahan, Khorasan Razavi provinces in 1990. Furthermore, the benzene emission were higher in Tehran, Isfahan, Khorasan Razavi and Fars provinces in 2013.
Benzene emission trendsFig. 2 illustrates the trends of provincial benzene emission in 31 provinces throughout the country over a 24-year period from 1990 to 2013. Results of the Mann–Kendall trend test are tabulated in Table 4. These results highlight an upward trend in the benzene emission into atmosphere in national and subnational level from 1990 -2007. (Significant level α = 0.05). Specifically, all provinces and national level had positive significant Kendall’s Tau values, consistent with an upward trend in benzene emission into atmosphere from 1990 to 2008. After 2007, a significant decrease in the trend is observed.
Ilam 28.50 16.77 8.33 52.48 South Khorasan 19.40 28.24 52.16 66.33 North Khorasan 18.73 27.24 47.65 63.75
Fig. 1 depicts the spatial distribution of benzene emission in 1990 and 2013 across Iran. As demonstrated in Fig. 1, the levels of benzene emission were higher in Tehran, Isfahan, Khorasan Razavi provinces in 1990. Furthermore, the benzene emission were higher in Tehran, Isfahan, Khorasan Razavi and Fars provinces in 2013.
Table 3. Benzene emission over 24 years at provincial level (ton)
Fig. 1. Spatial distribution of the benzene emission in 1990 and 2013 across provinces in Iran (ton).
Benzene emission trends
Fig. 2 illustrates the trends of provincial benzene emission in 31 provinces throughout the country over a 24-year period from 1990 to 2013. Results of the Mann–Kendall trend test are tabulated in Table 4. These results highlight an upward trend in the benzene emission into atmosphere in national and subnational level from 1990 -2007. (Significant level α = 0.05). Specifically, all provinces and national level had positive significant Kendall’s Tau values, consistent with an upward trend in benzene emission into atmosphere from 1990 to 2008. After 2007, a significant decrease in the trend is observed.
247
http://japh.tums.ac.ir
Journal of Air Pollution and Health (Autumn 2019); 4(4): 241-252
Fig. 2. Temporal distribution of benzene emission (ton) from 1990 to 2013 across provinces in Iran
M. Shamsipour, et al. National and sub-national estimation of... 248
http://japh.tums.ac.ir
b
Fig. 2. Temporal distribution of benzene emission (ton) from 1990 to 2013 across provinces in Iran
a
249
http://japh.tums.ac.ir
Journal of Air Pollution and Health (Autumn 2019); 4(4): 241-252
Table 4. Benzene emission trend test by provincesTable 4. Benzene emission trend test by provinces
Kendall’s Tau (2008 -2013) Kendall’s Tau (1990 -2007) Province -0.1429 1 Tehran -0.6831 1 Isfahan
-0.520.95khorasan Razavi -0.6190 0.98 Fars -0.9048 0.97 Khozestan -0.61901Mazandaran
-0.71 1 East -Azerbaijan -0.3333 0.98 Kerman -0.52381Gilan
-0.33 - South khorasan -0.3333-North Khorasan -0.4667 1 National trend
The present study so far is the first comprehensive national study in estimation of benzene emission to atmosphere in Iran. Given the importance of benzene emission source and concentration in the atmosphere, numerous studies were carried out to determine ambient benzene concentrations in some parts of Iran. Study results made clear that vehicular emission is the primary source for benzene [21-24].
A recent study reported that benzene concentrations exceeded the national and European 5 μg/m³ standard level for benzene at ninety percent of sampling sites in Tehran megacity. Moreover, their results showed that major source of volatile organic compound (VOC) is emissions from mobile vehicles [21]. According to a study, the source of BTEX compounds in Tabriz city was fuel combustion [24].
Regarding that dispersion and emission models require a large amount of inputs including traffic counts, fuel properties, vehicle type, age composition, and meteorological parameters, it is time consuming to process the data for these models. Also the cost of direct benzene measurement in different parts of the country is high, in present study we used gasoline consumption as a major sources for benzene emission in country. Results of our study
The present study so far is the first comprehensive national study in estimation of benzene emission to atmosphere in Iran. Given the importance of benzene emission source and concentration in the atmosphere, numerous studies were carried out to determine ambient benzene concentrations in some parts of Iran. Study results made clear that vehicular emission is the primary source for benzene [21-24].
A recent study reported that benzene con centra-tions exceeded the national and European 5 μg/m³ standard level for benzene at ninety percent of sampling sites in Tehran megacity. Moreover, their results showed that major source of vola-tile organic compound (VOC) is em issions from mobile vehicles [21]. According to a study, the source of BTEX compounds in Tabriz city was fuel combustion [24].
M. Shamsipour, et al. National and sub-national estimation of... 250
http://japh.tums.ac.ir
Regarding that dispersion and emission models require a large amount of inputs including traffic counts, fuel properties, vehicle type, age composition, and meteorological parameters, it is time consuming to process the data for these models. Also the cost of direct benzene measurement in different parts of the country is high, in present study we used gasoline consumption as a major sources for benzene emission in country. Results of our study indicated an upward trend in the gasoline consumption and benzene emission into atmosphere from 1990 -2007. Several explanations could be mentioned for these high emissions of benzene in Iran. The main causes may include increase in the number of vehicles, outdated manufacturing technology, and high average lifetime of operating vehicles, inefficient public transportation system, urban population growth and lack of proper regulations preventing single passenger commute during the study period [25]. According to 2010 “Information on national transportation and energy” report, as of 2000 the total number of automobiles worldwide increased from 547 million to more than 707 million cars in 2010 indicating a 2.61% annual average increase whereas in Iran 284,969 and 1,346,786 vehicles were plate registered in 2000 and 2010 respectively showing 18.14% annual rise. It should be noted that over 80% of Iranian plate registered vehicles were of passenger cars. Therefore, by considering the estimations, the subsequent rise of total cars from 4,084,267 to 12,573,197 in Iran reveals a 11.93% annual growth for the period of 2000 -2010.[26]. As it can be seen in Fig. 2, prior to 2007, there was a significant rising trend for national and subnational benzene emission levels. In the following years, from 2008 to 2013, there is a decline, which is not significant. The declining trend from 2007 onwards might be attributed to
factors such as implementation of fuel rationing smart cards and incremental Compressed Natural Gas (CNG) consumption across the country [27, 28]. The amount of evaporated benzene necessitates counter measures. Hence, in a study, researchers put forward suggestions such as gasoline vapor recycling and reducing working hours in gas pumps [24]. Also, in another study, it was proposed strategies (e.g. using alternatives such as LPG or CNG fuels, public transport and bicycle) to control VOC [29]. The present study was not able to determine ambient benzene concentration. However, this shortfall can be explained by expensive costs of measuring benzene concentrations and lack of the applicability of measuring in cities and provinces across the country.
Conclusion The findings of this study will provide an insight into the extent of emitted benzene in the atmosphere at different regions of Iran for policy makers and scientists and may be a groundwork for field studies on benzene concentration estimation.
Financial supportsThis study was funded by the Institute for Environmental Research (IER), Tehran University of Medical Sciences (grant number: 92-01-46-21339).
Competing interests The authors declare they have no actual or potential competing interests.
AcknowledgementsThe authors acknowledge National Iranian Oil Products Distribution Company (NIOPDC) for their cooperation and providing data.
251
http://japh.tums.ac.ir
Journal of Air Pollution and Health (Autumn 2019); 4(4): 241-252
Ethical considerations Ethical issues (Including plagiarism, misconduct, data fabrication and/or fal sification, double publication and/or submission, redundancy, etc.) have been completely observed by the authors.
References:1. Anderson HR, Favarato G, Atkinson R.W. Long-term ex-
posure to air pollution and the incidence of asthma: me-ta-analysis of cohort studies. Air Quality, Atmosphere & Health, 2013. 6(1): p. 47-56.
2. Shah AS, Langrish JP, Nair H, McAllister DA, Hunter AL, Donaldson K, et al. Global association of air pol-lution and heart failure: a systematic review and meta-analysis. The Lancet. 2013;382(9897):1039-48.
3. Organization, W.H., WHO global urban ambient air pol-lution database (update 2016). Geneva. Diunduh, 2016.
4. Cancer, I.A.f.R.o., IARC: Outdoor air pollution a lead-ing environmental cause of cancer deaths. International Agency for Research on Cancer. 2013.
5. Sarkhosh M, Mahvi A, Zare M, Alavi J, Mohseni M. As-sessment of volatile organic compound (voc) in Tehran air pollution in 2010-2011. Journal of Rafsanjan Uni-versity of Medical Sciences. 2013;12(4):271-8.
6. Millet DB, Donahue NM, Pandis SN, Polidori A, Stanier CO, Turpin BJ, et al. Atmospheric volatile organic com-pound measurements during the Pittsburgh Air Quality Study: Results, interpretation, and quantification of pri-mary and secondary contributions. Journal of Geophys-ical Research: Atmospheres. 2005;110(D7).
7. Miri M, Shendi MRA, Ghaffari HR, Aval HE, Ahmadi E, Taban E, et al. Investigation of outdoor BTEX: concen-tration, variations, sources, spatial distribution, and risk assessment. Chemosphere. 2016;163:601-9.
8. Ismail OMS, Hameed RSA. Environmental effects of volatile organic compounds on ozone layer. Adv Appl Sci Res. 2013;4(1):264-8.
9. Faraji A, Nabibidhendi G, Pardakhti A. Risk assessment of exposure to released BTEX in district 12 of Tehran municipality for employees or shopkeepers and gas sta-tion customers. Pollution. 2017;3(3):407-15.
10. United States Environmental Protection Agency, Initial List of Hazardous Air Pollutants with Modifications. EPA, https://www.epa.gov/haps/initial-list-hazardous-air-pollutants-modifications.
11. Karakitsios SP, Delis VK, Kassomenos PA, Pili-dis GA. Contribution to ambient benzene concentra-tions in the vicinity of petrol stations: Estimation of the associated health risk. Atmospheric Environment. 2007;41(9):1889-902.
12. Tang J, Chan C, Wang X, Chan L, Sheng G, Fu J. Vola-tile organic compounds in a multi-storey shopping mall in Guangzhou, South China. Atmospheric Environ-
ment. 2005;39(38):7374-83.13. https://www.who.int/ipcs/features/benzene.pdf.14. Bahadar H, Mostafalou S, Abdollahi M. Current under-
standings and perspectives on non-cancer health effects of benzene: a global concern. Toxicology and applied pharmacology. 2014;276(2):83-94.
15. Lan Q, Zhang L, Li G, Vermeulen R, Weinberg RS, Dosemeci M, et al. Hematotoxicity in workers exposed to low levels of benzene. Science. 2004;306(5702):1774-6.
16. Amini H, Shamsipour M, Sowlat MH, Parsaeian M, Kasaeian A, Hassanvand MS, et al. National and sub-national environmental burden of disease in Iran from 1990 to 2013-study profile. Archives of Iranian medi-cine. 2014;17(1):62-70.
17. Khodrobank. http://khodrobank.ir/Cars. 2016 March 12, 2016].
18. Mohseni Nameghi H. A case study of integrated mod-elling of traffic, vehicular emissions, and air pollutant concentrations for Huron Church Road, Windsor. 2014.
1 9 . h t t p s : / / w w w. n i o p d c . i r / C o n t e n t / m e d i a / i m -age/2018/04/82688_orig.pdf.
20. http://air.tehran.ir/. Gasoline and diesel qual-ity impact on light and heavy duty vehicles pollutant emission,Report.
21. Amini H, Hosseini V, Schindler C, Hassankhany H, Yunesian M, Henderson SB, et al. Spatiotemporal de-scription of BTEX volatile organic compounds in a Middle Eastern megacity: Tehran study of exposure prediction for environmental health research (Tehran SEPEHR). Environmental pollution. 2017;226:219-29.
22. Atabi F, Moattar F, Mansouri N, Alesheikh A, Mirza-hosseini S. Assessment of variations in benzene con-centration produced from vehicles and gas stations in Tehran using GIS. International Journal of Environ-mental Science and Technology. 2013;10(2):283-94.
23. Shahbazi H, Reyhanian M, Hosseini V, Afshin H. The relative contributions of mobile sources to air pollut-ant emissions in Tehran, Iran: an emission inventory approach. Emission control science and technology. 2016;2(1):44-56.
24. Tohid L, Sabeti Z, Sarbakhsh P, Benis KZ, Shakerkhat-ibi M, Rasoulzadeh Y, et al. Spatiotemporal variation, ozone formation potential and health risk assessment of ambient air VOCs in an industrialized city in Iran. At-mospheric Pollution Research. 2019;10(2):556-63.
25. Jafari HH, Baratimalayeri A. The crisis of gasoline consumption in the Iran's transportation sector. Energy Policy. 2008;36(7):2536-43.
27. Consumption of petroleum products statistics. Ira-nian oil of products distribution company (NIOPDC). National Iranian Oil Products Distribution Company. 2014.
M. Shamsipour, et al. National and sub-national estimation of... 252
http://japh.tums.ac.ir
28. Hosseini V, Shahbazi H. Urban air pollution in Iran. Iranian Studies, 2016. 49(6): 1029-1046.
29. Nasri A, Jebelli B, Nasrabadi T, Hadizadeh H, Gha-zanchaei E. Determining the risk of occupational ex-posure to benzene and toluene among gasoline station workers, a case study in Kerman. 2015.