Page 1
Congenital muscle dystrophy and diet consistencyaffect mouse skull shape differentlyAlexander Spassov,1,4,* Viviana Toro-Ibacache,2,3,* Mirjam Krautwald,4 Heinrich Brinkmeier4 andKornelius Kupczik5
1Department of Orthodontics, University Medicine Greifswald, Greifswald, Germany2Facultad de Odontolog�ıa, Universidad de Chile, Santiago de Chile, Chile3Department of Human Evolution, Max Planck Institute for Evolutionary Anthropology, Leipzig, Germany4Institute of Pathophysiology, University Medicine Greifswald, Karlsburg, Germany5Max Planck Weizmann Center for Integrative Archaeology and Anthropology, Max Planck Institute for Evolutionary
Anthropology, Leipzig, Germany
Abstract
The bones of the mammalian skull respond plastically to changes in masticatory function. However, the extent
to which muscle function affects the growth and development of the skull, whose regions have different
maturity patterns, remains unclear. Using muscle dissection and 3D landmark-based geometric morphometrics
we investigated the effect of changes in muscle function established either before or after weaning, on skull
shape and muscle mass in adult mice. We compared temporalis and masseter mass and skull shape in mice with
a congenital muscle dystrophy (mdx) and wild type (wt) mice fed on either a hard or a soft diet. We found that
dystrophy and diet have distinct effects on the morphology of the skull and the masticatory muscles. Mdx mice
show a flattened neurocranium with a more dorsally displaced foramen magnum and an anteriorly placed
mandibular condyle compared with wt mice. Compared with hard diet mice, soft diet mice had lower masseter
mass and a face with more gracile features as well as labially inclined incisors, suggesting reduced bite
strength. Thus, while the early-maturing neurocranium and the posterior portion of the mandible are affected
by the congenital dystrophy, the late-maturing face including the anterior part of the mandible responds to
dietary differences irrespective of the mdx mutation. Our study confirms a hierarchical, tripartite organisation
of the skull (comprising neurocranium, face and mandible) with a modular division based on development and
function. Moreover, we provide further experimental evidence that masticatory loading is one of the main
environmental stimuli that generate craniofacial variation.
Key words: diet consistency; geometric morphometrics; mdx dystrophy; muscle mass; skull shape.
Introduction
The form–function relationship of the mammalian skull has
been a long-lasting topic of biological research (Smith,
1993; Schwenk, 2000; De Meyer et al. 2016). The mam-
malian skull is formed by units or modules; i.e. traits of
relative degrees of integration or shape covariation based
on their developmental origin or function (Cheverud, 1982;
Goswami, 2007). The skull has been largely divided into two
functional regions: the structures that enclose the brain and
sensory organs (cranial vault and base; referred to as the
neurocranium here to match related literature), and those
related to breathing and feeding, i.e. the rostrum consisting
of the face and the mandible (Cheverud, 1982; Boughner
et al. 2008; Drake & Klingenberg, 2010). The effect of varia-
tions in muscle loads on skull shape has been shown in ani-
mals with genetic alterations of muscle function (muscular
dystrophies) or by altering diet consistency (soft vs. normal,
or ‘hard’ food) (Kiliaridis et al. 1985; Lightfoot & German,
1998; Renaud et al. 2010; Anderson et al. 2014). Hereditary
muscle dystrophies, such as congenital muscular dystrophy
and x-linked dystrophies, are evident already before birth
(Emery, 2002). Thus they have the potential to affect bone
development from early stages of fetal development (de La
Correspondence
Alexander Spassov, Institute of Pathophysiology, University Medicine
Greifswald, Greifswalder Str. 11c, 17495 Karlsburg, Germany.
T: + 49 3834 8619100; E: [email protected]
and
Viviana Toro-Ibacache, Facultad de Odontolog�ıa, Universidad de
Chile, Sergio Livingstone Pohlhammer 943, Independencia, Regi�on
Metropolitana, Santiago de Chile, Chile. T: + 56 2 29781702;
E: [email protected]
*Equal contribution.
Accepted for publication 31 May 2017
© 2017 Anatomical Society
J. Anat. (2017) doi: 10.1111/joa.12664
Journal of Anatomy
Page 2
Porte et al. 1999; Rot-Nikcevic et al. 2006). Shifts from hard
to soft food regimens alter masticatory muscle activity and
can affect skull morphology during later stages (i.e. post-
weaning) stages of ontogeny (see discussion in Mart�ınez-
Abad�ıas et al. 2012). For example, it has been shown in rats
and mice that a soft food diet results in a shorter and nar-
rower face, and a shorter mandible with less pronounced
bony processes as compared with their conspecifics fed on a
hard diet (Kiliaridis et al. 1985; Anderson et al. 2014). These
differences can be considered the result of induced postna-
tal changes in masticatory function. In contrast, alterations
in muscle structure and function caused by genetic abnor-
malities, such as laminin a2-deficient dystrophies, have been
associated with shorter, flattened and caudally broader
skulls and shorter mandibles in mice (Lightfoot & German,
1998). Moreover, hyper-muscular mice as the result of myo-
statin-deficiency are brachycephalic with an anteroposteri-
orly elongated mandible (Vecchione et al. 2007).
The commonly used model for studying the human Duch-
enne muscle dystrophy is the mdx mouse (e.g. Spassov et al.
2010; McGreevy et al. 2015). Mdx mice are affected by a
point mutation in the gene encoding for the cytoskeletal
protein dystrophin, leading to loss of functional dystrophin
in skeletal muscles (McGreevy et al. 2015). The muscles of
mdxmice undergo fibre degeneration followed by regener-
ation (Turk et al. 2005), yet they are capable of reaching
normal strength values during the first months of life dur-
ing normal physical activity such as running (Wineinger
et al. 1998) and biting (Byron et al. 2006). Histologically,
mdx muscles are characterized by a considerable variation
in fibre diameter (Spassov et al. 2010). Although most of
these anomalies in mdx mice have been observed postna-
tally, muscle alterations already occur earlier in develop-
ment, i.e. prenatally (de La Porte et al. 1999) and
immediately after birth (Torres & Duchen, 1987). Under nor-
mal developing conditions, the effect of masticatory func-
tion has been observed acting on mouse skull shape before
35 days postnatally (shortly after weaning; Willmore et al.
2006).
The reduction of muscle function from a developmentally
early stage, together with the capacity to overcome the
functional deficiency under physiological demands makes
mdx an excellent model to study skull shape changes associ-
ated with both congenital (i.e. due to a mutation) and
induced (i.e. due to changes in dietary consistency) dimin-
ished muscle function. To date, only one study has looked
at the effect of both factors in mdx mice but the analysis
was limited to the mandible, using two-dimensional outline
geometric morphometrics (Renaud et al. 2010). An assess-
ment of the global effects of muscle function on muscle
and skull morphology offers the possibility to better under-
stand the functional constraints driving the development of
skull shape.
Using muscle dissection, computed tomography imaging
and 3D morphometrics, we assess the effect of altered
muscle function on muscle mass (temporalis and masseter)
and skull shape. We use a murine model of congenitally
altered muscle function (mdx muscle dystrophy) and
reduced muscle function through induced changes in diet-
ary consistency (hard vs. soft food). Both types of altered
muscle function imply reduced chewing muscle strength
and lower occlusal forces, and thus less bone growth due to
a low-strain environment. We predicted that an altered
muscle function produced by either the muscle dystrophy
and/or a soft food consistency would result in shape
changes of both the cranium (i.e. neurocranium and face)
and the mandible, as well as in a reduced masticatory mus-
cle mass. In particular, we expected that the neurocranium,
face and mandible were differently affected by the changes
in muscle function: a soft diet would primarily affect the
face and the mandible rather than the neurocranium,
because the former mice reach adult form later in life and
are under a higher masticatory demand (Diewert, 1985;
Willmore et al. 2006).
Materials and methods
Animals and feeding regimens
Male mice of the wild type strain C57B1/10ScSn (wt, n = 24) and the
inbred strain C57B1/10ScSn-Dmdmdx/J (mdx, n = 24) were bred at
the Central Animal Facility of the University Medicine of Greifswald
(Germany) and held in cages without elements for exercise. As
Duchenne’s syndrome is an X-linked recessive disorder, it mostly
affects men and we therefore choose male mice for our study.
Immediately after weaning (21–24 days of age) the wt and mdx
groups were randomly allocated to receive either hard (normal) or
soft food, resulting in four groups (n = 12 each) for analyses: wt
hard food, wt soft food, mdx hard food and mdx soft food. The
hard food consisted of common pellets and the soft food of the
same pellets homogenized with water in a proportion of 1 : 2.5.
Food and drinking water were provided ad libitum during the com-
plete period of the experiment. All experiments were performed in
accordance with the directive 2010/63/EU of the European Parlia-
ment for the protection of animals used for scientific purposes and
the German animal protection act.
The death of the animals was induced at 100 � 2 days (mean
age = 100.04 days, SD = 1.03) using ether inhalation and rapid cer-
vical dislocation. The temporalis and masseter (superficial and deep)
as well as the soleus muscles were dissected and (wet) weighed. The
soleus muscle was used as a control for non-masticatory-related
effects, as it is typically affected and hypertrophic in mdx mice at
this age (Pastoret & Sebille, 1995). Dissected skulls were fixed in
4.5% formalin solution and stored at 4 °C.
Computed tomography (CT) imaging
The skulls were CT scanned at the Zoological Institute and Museum
of the University of Greifswald on an Xradia MicroXCT-200 system
(Xradia Inc., Pleasanton, CA, USA) at 40 kV and 200 mA, with an
isometric voxel size of 0.025 mm. Data reconstruction was done
using specialist software (XM CONTROLLER and XM RECONSTRUCTOR,
v.8.1.7546, XRadia Inc.) and the resulting images were exported as
TIFF files.
© 2017 Anatomical Society
Muscle function and skull shape, A. Spassov et al.2
Page 3
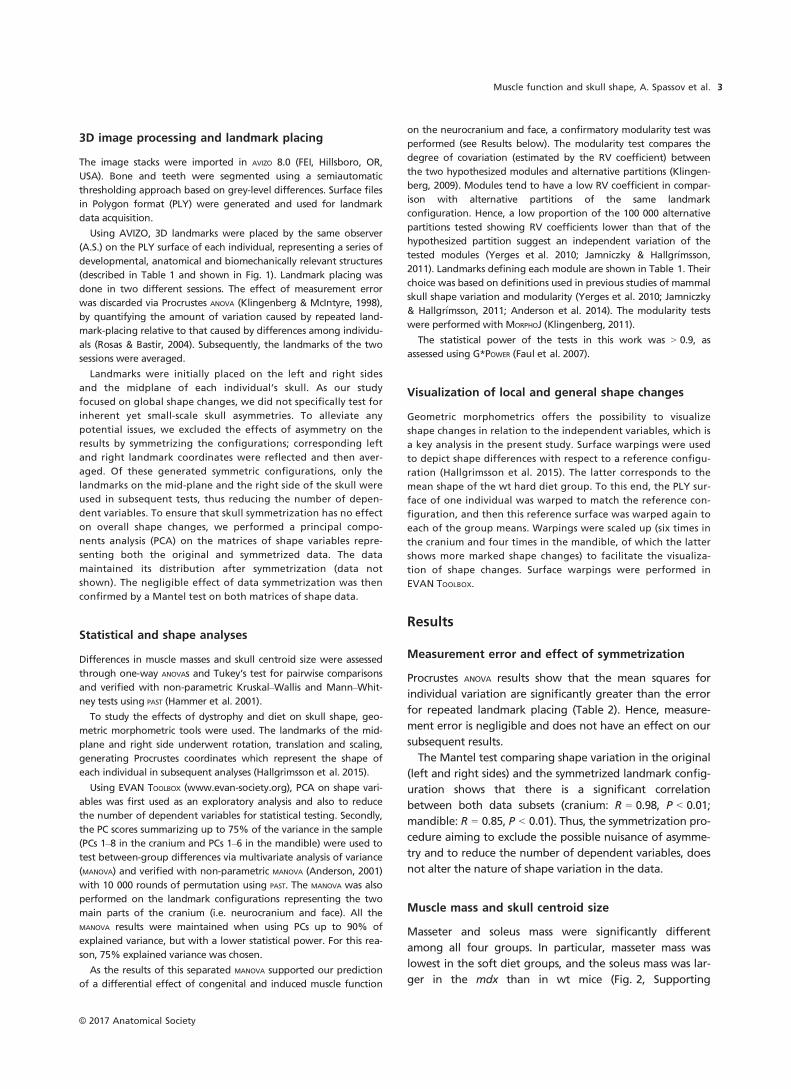
3D image processing and landmark placing
The image stacks were imported in AVIZO 8.0 (FEI, Hillsboro, OR,
USA). Bone and teeth were segmented using a semiautomatic
thresholding approach based on grey-level differences. Surface files
in Polygon format (PLY) were generated and used for landmark
data acquisition.
Using AVIZO, 3D landmarks were placed by the same observer
(A.S.) on the PLY surface of each individual, representing a series of
developmental, anatomical and biomechanically relevant structures
(described in Table 1 and shown in Fig. 1). Landmark placing was
done in two different sessions. The effect of measurement error
was discarded via Procrustes ANOVA (Klingenberg & McIntyre, 1998),
by quantifying the amount of variation caused by repeated land-
mark-placing relative to that caused by differences among individu-
als (Rosas & Bastir, 2004). Subsequently, the landmarks of the two
sessions were averaged.
Landmarks were initially placed on the left and right sides
and the midplane of each individual’s skull. As our study
focused on global shape changes, we did not specifically test for
inherent yet small-scale skull asymmetries. To alleviate any
potential issues, we excluded the effects of asymmetry on the
results by symmetrizing the configurations; corresponding left
and right landmark coordinates were reflected and then aver-
aged. Of these generated symmetric configurations, only the
landmarks on the mid-plane and the right side of the skull were
used in subsequent tests, thus reducing the number of depen-
dent variables. To ensure that skull symmetrization has no effect
on overall shape changes, we performed a principal compo-
nents analysis (PCA) on the matrices of shape variables repre-
senting both the original and symmetrized data. The data
maintained its distribution after symmetrization (data not
shown). The negligible effect of data symmetrization was then
confirmed by a Mantel test on both matrices of shape data.
Statistical and shape analyses
Differences in muscle masses and skull centroid size were assessed
through one-way ANOVAs and Tukey’s test for pairwise comparisons
and verified with non-parametric Kruskal–Wallis and Mann–Whit-
ney tests using PAST (Hammer et al. 2001).
To study the effects of dystrophy and diet on skull shape, geo-
metric morphometric tools were used. The landmarks of the mid-
plane and right side underwent rotation, translation and scaling,
generating Procrustes coordinates which represent the shape of
each individual in subsequent analyses (Hallgrimsson et al. 2015).
Using EVAN TOOLBOX (www.evan-society.org), PCA on shape vari-
ables was first used as an exploratory analysis and also to reduce
the number of dependent variables for statistical testing. Secondly,
the PC scores summarizing up to 75% of the variance in the sample
(PCs 1–8 in the cranium and PCs 1–6 in the mandible) were used to
test between-group differences via multivariate analysis of variance
(MANOVA) and verified with non-parametric MANOVA (Anderson, 2001)
with 10 000 rounds of permutation using PAST. The MANOVA was also
performed on the landmark configurations representing the two
main parts of the cranium (i.e. neurocranium and face). All the
MANOVA results were maintained when using PCs up to 90% of
explained variance, but with a lower statistical power. For this rea-
son, 75% explained variance was chosen.
As the results of this separated MANOVA supported our prediction
of a differential effect of congenital and induced muscle function
on the neurocranium and face, a confirmatory modularity test was
performed (see Results below). The modularity test compares the
degree of covariation (estimated by the RV coefficient) between
the two hypothesized modules and alternative partitions (Klingen-
berg, 2009). Modules tend to have a low RV coefficient in compar-
ison with alternative partitions of the same landmark
configuration. Hence, a low proportion of the 100 000 alternative
partitions tested showing RV coefficients lower than that of the
hypothesized partition suggest an independent variation of the
tested modules (Yerges et al. 2010; Jamniczky & Hallgr�ımsson,
2011). Landmarks defining each module are shown in Table 1. Their
choice was based on definitions used in previous studies of mammal
skull shape variation and modularity (Yerges et al. 2010; Jamniczky
& Hallgr�ımsson, 2011; Anderson et al. 2014). The modularity tests
were performed with MORPHOJ (Klingenberg, 2011).
The statistical power of the tests in this work was > 0.9, as
assessed using G*POWER (Faul et al. 2007).
Visualization of local and general shape changes
Geometric morphometrics offers the possibility to visualize
shape changes in relation to the independent variables, which is
a key analysis in the present study. Surface warpings were used
to depict shape differences with respect to a reference configu-
ration (Hallgrimsson et al. 2015). The latter corresponds to the
mean shape of the wt hard diet group. To this end, the PLY sur-
face of one individual was warped to match the reference con-
figuration, and then this reference surface was warped again to
each of the group means. Warpings were scaled up (six times in
the cranium and four times in the mandible, of which the latter
shows more marked shape changes) to facilitate the visualiza-
tion of shape changes. Surface warpings were performed in
EVAN TOOLBOX.
Results
Measurement error and effect of symmetrization
Procrustes ANOVA results show that the mean squares for
individual variation are significantly greater than the error
for repeated landmark placing (Table 2). Hence, measure-
ment error is negligible and does not have an effect on our
subsequent results.
The Mantel test comparing shape variation in the original
(left and right sides) and the symmetrized landmark config-
uration shows that there is a significant correlation
between both data subsets (cranium: R = 0.98, P < 0.01;
mandible: R = 0.85, P < 0.01). Thus, the symmetrization pro-
cedure aiming to exclude the possible nuisance of asymme-
try and to reduce the number of dependent variables, does
not alter the nature of shape variation in the data.
Muscle mass and skull centroid size
Masseter and soleus mass were significantly different
among all four groups. In particular, masseter mass was
lowest in the soft diet groups, and the soleus mass was lar-
ger in the mdx than in wt mice (Fig. 2, Supporting
© 2017 Anatomical Society
Muscle function and skull shape, A. Spassov et al. 3
Page 4
Table 1 Landmarks used for shape analysis and centroid size calculation.
No. Description
Cranium
1 Most rostral end of the internasal suture (F)
2 Intersection between the nasofrontal and internasal sutures (F)
3 Intersection between the coronal and sagittal sutures (N)
4 Most caudal end of the sagittal suture (N)
5 Most caudal point of the foramen magnum and the cranium (N)
6 Point on the occipito-interparietal suture at the intersection with the straight line (from superior) connecting points 4 and 5 (N)
7 Basion (most rostral point of the foramen magnum) (N)
8 Most caudal end of the median palatine suture (F)
9 Most rostral point of the interincisive foramen (F)
10 Most vestibular and low point of the interradicular septum between incisors) (F)
11 Incisor, mesial angle (F)
12 Incisor, distal angle (F)
13 Incisor, most palatal point of the occlusal surface (F)
14 Highest point of the alveolar ridge of the incisor (F)
15 Most rostral point of the premaxilla at the opening of the nasal cavity (F)
16 Intersection between the maxilla, frontal and lacrimal bones (F)
17 Most dorsal and rostral point of the zygomatic process of the maxilla, where the lateral border of the zygomatic arch meets the
infraorbital foramen (F)
18 Lateral end of the coronal suture at the temporal line (N)
19 Intersection between the squamosal, frontal and alisphenoid bones (N)
20 Dorsal end of the suture between the zygomatic process of the maxilla and the zygomatic (jugal) bone (F)
21 Ventral end of the suture between the zygomatic process of the maxilla and the zygomatic (jugal) bone (F)
22 Dorsal end of the suture between the squamosal and zygomatic (jugal) bones (F)
23 Ventral end of the suture between the squamosal and zygomatic (jugal) bones (F)
24 Most caudal point of the insertion of the deep masseter muscle. It appears as a small tubercle in the zygomatic process of the
temporal (squamosal) bone (F)
25 Most caudal and ventral point at the anterior crus of the tympanic bone (N)
26 Dorsal end of the occipito-squamosal suture at the temporal line (N)
27 Most lateral point of the foramen magnum, at the caudal end of the occipital condyle (N)
28 Most lateral end of the union between the basisphenoid and occipital bones, at its ventral face (N)
29 Most lateral end of the maxillo-palatine suture (F)
30 Most distal point on the alveolar ridge of M3 (F)
31 Most caudal point of the palatine fissure (F)
32 Most mesial point on the alveolar ridge of M1 (F)
33 Most ventral point of the suture between the premaxilla and the maxilla (F)
34 Most rostral point of the palatine fissure (F)
35 Most palatal and high point on the alveolar ridge of the incisor (F)
Mandible
1 Tip of the lower incisor
2 Lowest point on the alveolar ridge of the incisor
3 Most ventral and rostral point of the insertion area of the digastric muscle
4 Rostral end of the masseteric ridge
5 Tip of the angular process of the mandible
6 Point on the masseteric ridge perpendicularly projected from half the linear distance between points 4 and 5
7 Most caudal point of the condylar process
8 Point of the concave posterior border of the mandibular ramus, projected perpendicularly from half the linear distance between
points 5 and 7
9 Most caudal point of the articular surface of the condylar process
10 Most rostral point of the articular surface of the condylar process
11 Lowest point of the mandibular notch
12 Tip of the coronoid process
13 Point at the anterior border of the coronoid process, projected perpendicularly to the rostro-caudal axis from the
vestibular sulcus of M2
14 Most mesial point on the alveolar ridge of M1
(continued)
© 2017 Anatomical Society
Muscle function and skull shape, A. Spassov et al.4
Page 5
Information Table S1). After Bonferroni correction, how-
ever, the masseter mass of the wt soft diet group did not
differ from that of the two hard diet groups or from the
mdx soft diet group (Table 3). The centroid size of the cra-
nium was significantly different among all four groups
(Fig. 2, Table S1), but after Bonferroni correction, only the
difference between the two extreme wt hard diet and mdx
soft diet groups was significant (Table 3). Yet, when the
neurocranium and face were analyzed separately, the cen-
troid size of the former differed between wt and mdx irre-
spective of diet (although after Bonferroni correction, the
difference between both hard diet groups and themdx soft
diet group was no longer statistically significant) (Fig. 2,
Tables S1 and 3).
Table 1. (continued)
No. Description
15 Most distal point on the alveolar ridge of M3
16 Most ventral point of the mental foramen
17 Most ventral point of the foramen in the pterygoid fossa
18 Most rostral and ventral point of the mandibular foramen
19 Most caudal and ventral point of the mandibular symphysis
20 Highest point of the alveolar ridge of the incisor
21 Most rostral and dorsal point of the mandibular symphysis
Hypothetical modules: N, neurocranium; F, face.
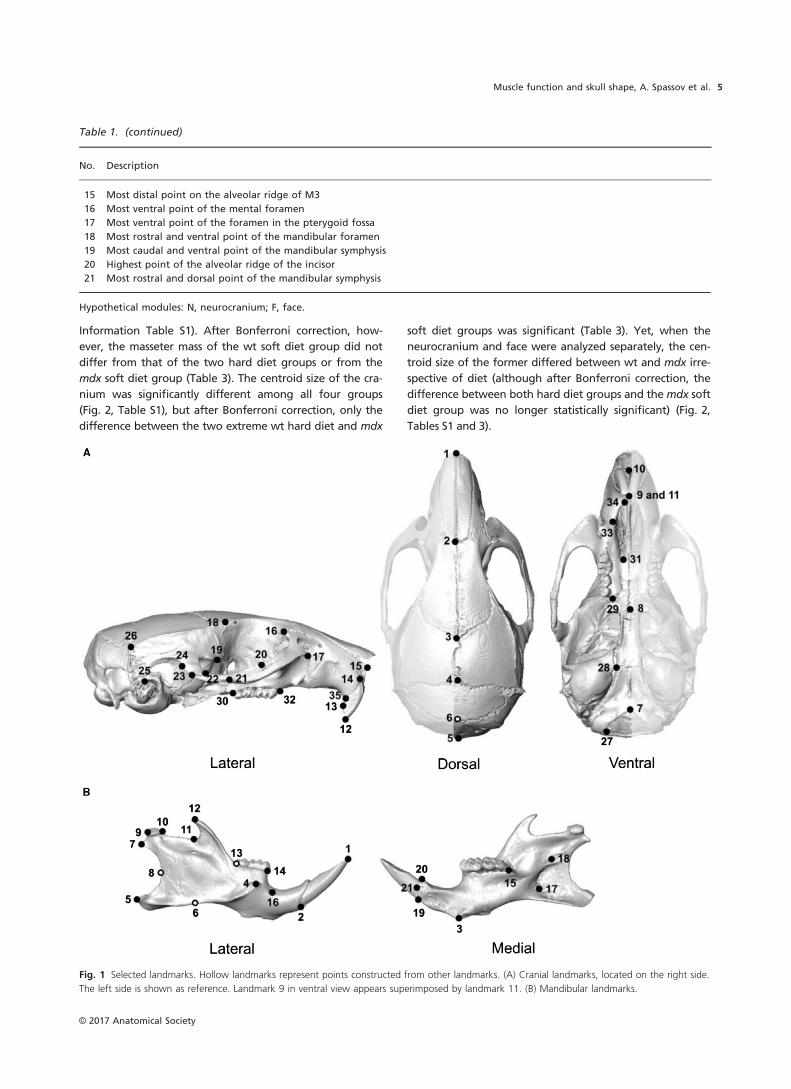
Fig. 1 Selected landmarks. Hollow landmarks represent points constructed from other landmarks. (A) Cranial landmarks, located on the right side.
The left side is shown as reference. Landmark 9 in ventral view appears superimposed by landmark 11. (B) Mandibular landmarks.
© 2017 Anatomical Society
Muscle function and skull shape, A. Spassov et al. 5
Page 6
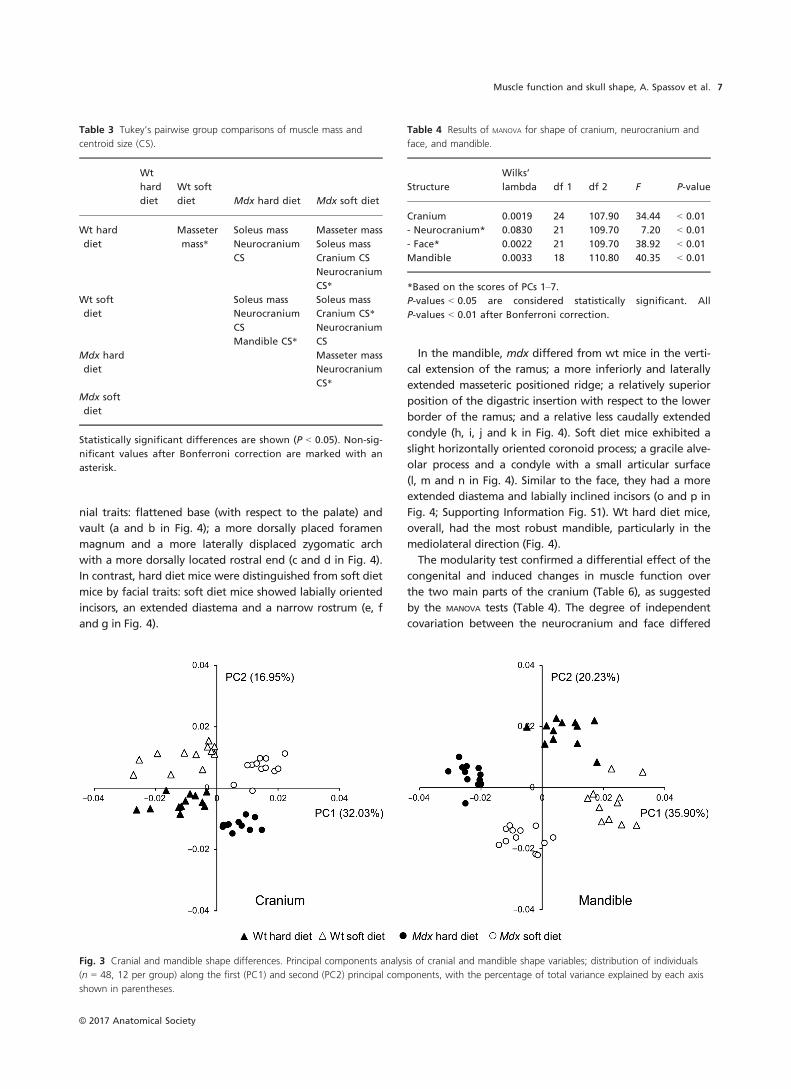
Cranial and mandibular shape
Principal components analysis and MANOVA revealed that
each of the four groups displayed different shapes of both
the cranium and mandible (Fig. 3, Tables 4 and 5). Within
the cranium, the shape of the neurocranium was signifi-
cantly different between mdx and wt mice, without distinc-
tion between dietary groups (Tables 4 and 5). In contrast,
the shape of the face and the mandible distinguished all
groups from each other (Tables 4 and 5).
Shape differences among groups were found to be
related to dystrophy, and those related to changes in diet
consistency (red and blue arrows respectively in Fig. 4). The
cranium of mdx mice differed from wt mainly in neurocra-
Fig. 2 Boxplot comparison of muscle mass (upper row) and centroid size (lower row) between groups. HD, hard diet, SD, soft diet. The ranges in
the vertical axes have been independently adjusted to improve the visualization of data variation. The P-values from ANOVA are shown (statistical sig-
nificance P < 0.05) at each plot. Values non-significant after Bonferroni correction are marked with an asterisk. The detailed results of the ANOVA
are shown in Table S1.
Table 2 Procrustes ANOVA for the effect of measurement error on cranial and mandibular shape.
Structure Effect Sum of squares Mean squares 9 107 df F P-value
Cranium Individual 0.0595 73.21 8131 8.59 < 0.01
Repeated landmarking 0.0071 8.52 8304
Mandible Individual 0.0967 172.96 5593 9.18 < 0.01
Repeated landmarking 0.0108 18.85 5712
Ntotal = 48.
© 2017 Anatomical Society
Muscle function and skull shape, A. Spassov et al.6
Page 7
nial traits: flattened base (with respect to the palate) and
vault (a and b in Fig. 4); a more dorsally placed foramen
magnum and a more laterally displaced zygomatic arch
with a more dorsally located rostral end (c and d in Fig. 4).
In contrast, hard diet mice were distinguished from soft diet
mice by facial traits: soft diet mice showed labially oriented
incisors, an extended diastema and a narrow rostrum (e, f
and g in Fig. 4).
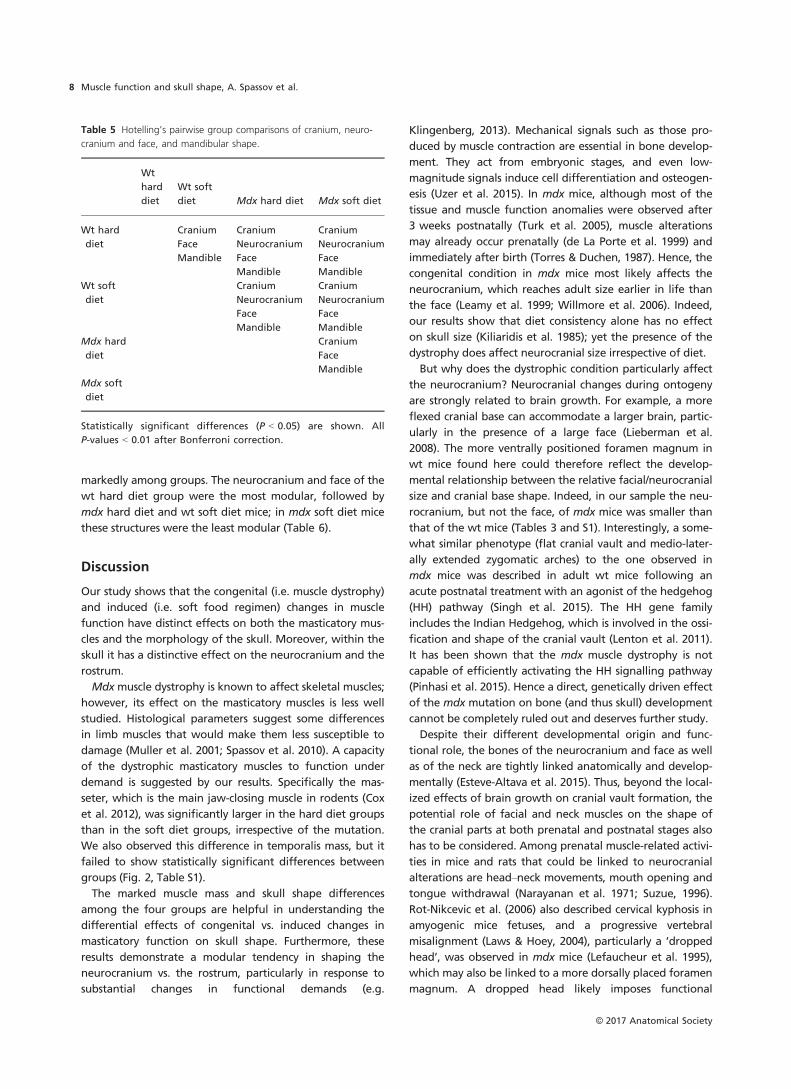
In the mandible, mdx differed from wt mice in the verti-
cal extension of the ramus; a more inferiorly and laterally
extended masseteric positioned ridge; a relatively superior
position of the digastric insertion with respect to the lower
border of the ramus; and a relative less caudally extended
condyle (h, i, j and k in Fig. 4). Soft diet mice exhibited a
slight horizontally oriented coronoid process; a gracile alve-
olar process and a condyle with a small articular surface
(l, m and n in Fig. 4). Similar to the face, they had a more
extended diastema and labially inclined incisors (o and p in
Fig. 4; Supporting Information Fig. S1). Wt hard diet mice,
overall, had the most robust mandible, particularly in the
mediolateral direction (Fig. 4).
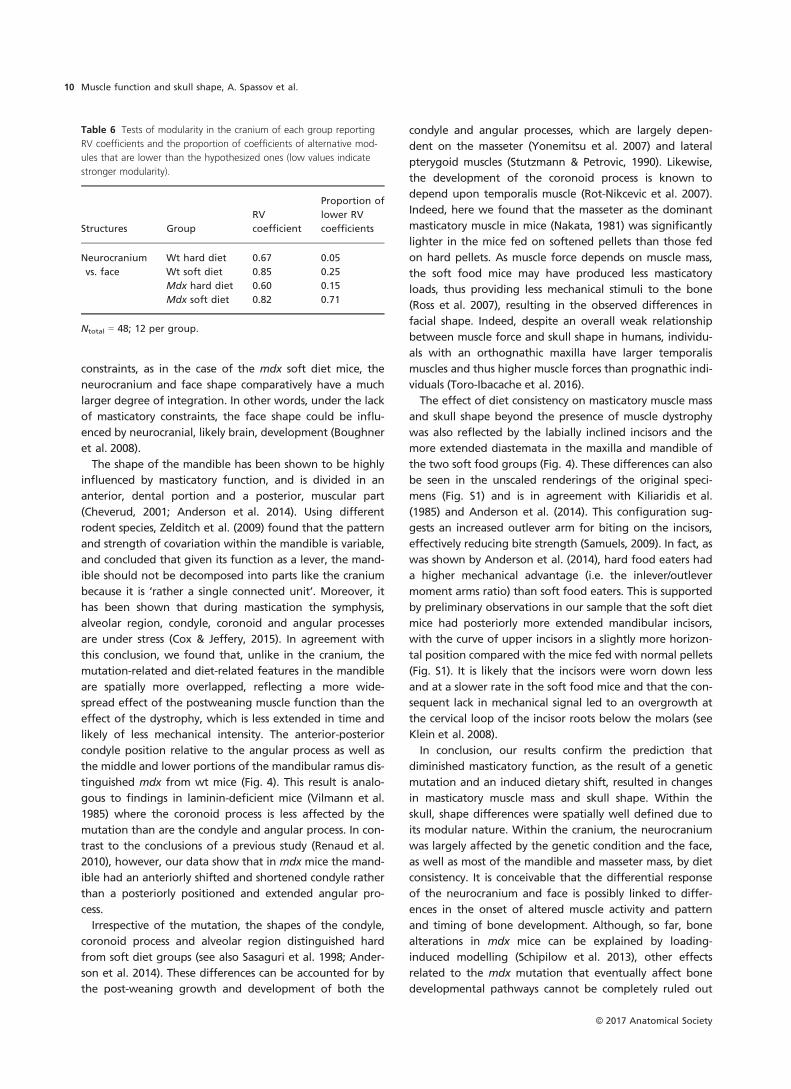
The modularity test confirmed a differential effect of the
congenital and induced changes in muscle function over
the two main parts of the cranium (Table 6), as suggested
by the MANOVA tests (Table 4). The degree of independent
covariation between the neurocranium and face differed
Table 3 Tukey’s pairwise group comparisons of muscle mass and
centroid size (CS).
Wt
hard
diet
Wt soft
diet Mdx hard diet Mdx soft diet
Wt hard
diet
Masseter
mass*
Soleus mass
Neurocranium
CS
Masseter mass
Soleus mass
Cranium CS
Neurocranium
CS*
Wt soft
diet
Soleus mass
Neurocranium
CS
Mandible CS*
Soleus mass
Cranium CS*
Neurocranium
CS
Mdx hard
diet
Masseter mass
Neurocranium
CS*
Mdx soft
diet
Statistically significant differences are shown (P < 0.05). Non-sig-
nificant values after Bonferroni correction are marked with an
asterisk.
Fig. 3 Cranial and mandible shape differences. Principal components analysis of cranial and mandible shape variables; distribution of individuals
(n = 48, 12 per group) along the first (PC1) and second (PC2) principal components, with the percentage of total variance explained by each axis
shown in parentheses.
Table 4 Results of MANOVA for shape of cranium, neurocranium and
face, and mandible.
Structure
Wilks’
lambda df 1 df 2 F P-value
Cranium 0.0019 24 107.90 34.44 < 0.01
- Neurocranium* 0.0830 21 109.70 7.20 < 0.01
- Face* 0.0022 21 109.70 38.92 < 0.01
Mandible 0.0033 18 110.80 40.35 < 0.01
*Based on the scores of PCs 1–7.
P-values < 0.05 are considered statistically significant. All
P-values < 0.01 after Bonferroni correction.
© 2017 Anatomical Society
Muscle function and skull shape, A. Spassov et al. 7
Page 8
markedly among groups. The neurocranium and face of the
wt hard diet group were the most modular, followed by
mdx hard diet and wt soft diet mice; in mdx soft diet mice
these structures were the least modular (Table 6).
Discussion
Our study shows that the congenital (i.e. muscle dystrophy)
and induced (i.e. soft food regimen) changes in muscle
function have distinct effects on both the masticatory mus-
cles and the morphology of the skull. Moreover, within the
skull it has a distinctive effect on the neurocranium and the
rostrum.
Mdxmuscle dystrophy is known to affect skeletal muscles;
however, its effect on the masticatory muscles is less well
studied. Histological parameters suggest some differences
in limb muscles that would make them less susceptible to
damage (Muller et al. 2001; Spassov et al. 2010). A capacity
of the dystrophic masticatory muscles to function under
demand is suggested by our results. Specifically the mas-
seter, which is the main jaw-closing muscle in rodents (Cox
et al. 2012), was significantly larger in the hard diet groups
than in the soft diet groups, irrespective of the mutation.
We also observed this difference in temporalis mass, but it
failed to show statistically significant differences between
groups (Fig. 2, Table S1).
The marked muscle mass and skull shape differences
among the four groups are helpful in understanding the
differential effects of congenital vs. induced changes in
masticatory function on skull shape. Furthermore, these
results demonstrate a modular tendency in shaping the
neurocranium vs. the rostrum, particularly in response to
substantial changes in functional demands (e.g.
Klingenberg, 2013). Mechanical signals such as those pro-
duced by muscle contraction are essential in bone develop-
ment. They act from embryonic stages, and even low-
magnitude signals induce cell differentiation and osteogen-
esis (Uzer et al. 2015). In mdx mice, although most of the
tissue and muscle function anomalies were observed after
3 weeks postnatally (Turk et al. 2005), muscle alterations
may already occur prenatally (de La Porte et al. 1999) and
immediately after birth (Torres & Duchen, 1987). Hence, the
congenital condition in mdx mice most likely affects the
neurocranium, which reaches adult size earlier in life than
the face (Leamy et al. 1999; Willmore et al. 2006). Indeed,
our results show that diet consistency alone has no effect
on skull size (Kiliaridis et al. 1985); yet the presence of the
dystrophy does affect neurocranial size irrespective of diet.
But why does the dystrophic condition particularly affect
the neurocranium? Neurocranial changes during ontogeny
are strongly related to brain growth. For example, a more
flexed cranial base can accommodate a larger brain, partic-
ularly in the presence of a large face (Lieberman et al.
2008). The more ventrally positioned foramen magnum in
wt mice found here could therefore reflect the develop-
mental relationship between the relative facial/neurocranial
size and cranial base shape. Indeed, in our sample the neu-
rocranium, but not the face, of mdx mice was smaller than
that of the wt mice (Tables 3 and S1). Interestingly, a some-
what similar phenotype (flat cranial vault and medio-later-
ally extended zygomatic arches) to the one observed in
mdx mice was described in adult wt mice following an
acute postnatal treatment with an agonist of the hedgehog
(HH) pathway (Singh et al. 2015). The HH gene family
includes the Indian Hedgehog, which is involved in the ossi-
fication and shape of the cranial vault (Lenton et al. 2011).
It has been shown that the mdx muscle dystrophy is not
capable of efficiently activating the HH signalling pathway
(Pinhasi et al. 2015). Hence a direct, genetically driven effect
of the mdx mutation on bone (and thus skull) development
cannot be completely ruled out and deserves further study.
Despite their different developmental origin and func-
tional role, the bones of the neurocranium and face as well
as of the neck are tightly linked anatomically and develop-
mentally (Esteve-Altava et al. 2015). Thus, beyond the local-
ized effects of brain growth on cranial vault formation, the
potential role of facial and neck muscles on the shape of
the cranial parts at both prenatal and postnatal stages also
has to be considered. Among prenatal muscle-related activi-
ties in mice and rats that could be linked to neurocranial
alterations are head–neck movements, mouth opening and
tongue withdrawal (Narayanan et al. 1971; Suzue, 1996).
Rot-Nikcevic et al. (2006) also described cervical kyphosis in
amyogenic mice fetuses, and a progressive vertebral
misalignment (Laws & Hoey, 2004), particularly a ‘dropped
head’, was observed in mdx mice (Lefaucheur et al. 1995),
which may also be linked to a more dorsally placed foramen
magnum. A dropped head likely imposes functional
Table 5 Hotelling’s pairwise group comparisons of cranium, neuro-
cranium and face, and mandibular shape.
Wt
hard
diet
Wt soft
diet Mdx hard diet Mdx soft diet
Wt hard
diet
Cranium
Face
Mandible
Cranium
Neurocranium
Face
Mandible
Cranium
Neurocranium
Face
Mandible
Wt soft
diet
Cranium
Neurocranium
Face
Mandible
Cranium
Neurocranium
Face
Mandible
Mdx hard
diet
Cranium
Face
Mandible
Mdx soft
diet
Statistically significant differences (P < 0.05) are shown. All
P-values < 0.01 after Bonferroni correction.
© 2017 Anatomical Society
Muscle function and skull shape, A. Spassov et al.8
Page 9
limitations. As mdx mice have the potential to produce
muscle contraction and regenerate damaged fibres before
adulthood (Turk et al. 2005), it is possible that they exert
large forces with the neck–extensor muscles only to main-
tain a ‘normal’ head–neck relationship that allows for unim-
peded feeding and viewing. The effect of increased dorsal
neck activity on the quadrupedal mammal skull shape has
not yet been dealt with in depth. However, in humans the
skull–neck position has been suggested as a predictor of
craniofacial development, with ‘neck-extenders’ showing a
more vertically developed face and an increased cranial
base angle (Solow & Kreiborg, 1977; Solow & Siersb, 1992;
Leitao & Nanda, 2000).
The neurocranium and face are linked anatomically and
functionally, yet they behave as relatively independent
regions of the cranium in their development (Cheverud,
1982; Boughner et al. 2008; Drake & Klingenberg, 2010).
The modularity test showed that the wt hard diet group,
which can be considered the reference individuals, presents
the most independent variation of both cranial parts; fol-
lowed by the mdx hard diet and wt soft diet groups. In con-
trast, the mdx soft diet cranium is strongly integrated
(Table 6). This result suggests that when there is normal
muscle functioning, the independence between the neuro-
cranium and face is maintained. It is therefore not surpris-
ing that with the loss of muscle-based functional
Fig. 4 Cranial and mandibular shape changes of wt soft diet, and mdx hard/soft diet group means with respect to the wt hard diet group mean
(undeformed). Red arrows indicate changes related to muscle dystrophy, blue arrows indicate differences related to diet consistency. Specific traits
are marked with lowercase letters and their detailed description is found in the main text. Warpings are magnified six times in the cranium and
four times in the mandible to facilitate visualisation.
© 2017 Anatomical Society
Muscle function and skull shape, A. Spassov et al. 9
Page 10
constraints, as in the case of the mdx soft diet mice, the
neurocranium and face shape comparatively have a much
larger degree of integration. In other words, under the lack
of masticatory constraints, the face shape could be influ-
enced by neurocranial, likely brain, development (Boughner
et al. 2008).
The shape of the mandible has been shown to be highly
influenced by masticatory function, and is divided in an
anterior, dental portion and a posterior, muscular part
(Cheverud, 2001; Anderson et al. 2014). Using different
rodent species, Zelditch et al. (2009) found that the pattern
and strength of covariation within the mandible is variable,
and concluded that given its function as a lever, the mand-
ible should not be decomposed into parts like the cranium
because it is ‘rather a single connected unit’. Moreover, it
has been shown that during mastication the symphysis,
alveolar region, condyle, coronoid and angular processes
are under stress (Cox & Jeffery, 2015). In agreement with
this conclusion, we found that, unlike in the cranium, the
mutation-related and diet-related features in the mandible
are spatially more overlapped, reflecting a more wide-
spread effect of the postweaning muscle function than the
effect of the dystrophy, which is less extended in time and
likely of less mechanical intensity. The anterior-posterior
condyle position relative to the angular process as well as
the middle and lower portions of the mandibular ramus dis-
tinguished mdx from wt mice (Fig. 4). This result is analo-
gous to findings in laminin-deficient mice (Vilmann et al.
1985) where the coronoid process is less affected by the
mutation than are the condyle and angular process. In con-
trast to the conclusions of a previous study (Renaud et al.
2010), however, our data show that in mdx mice the mand-
ible had an anteriorly shifted and shortened condyle rather
than a posteriorly positioned and extended angular pro-
cess.
Irrespective of the mutation, the shapes of the condyle,
coronoid process and alveolar region distinguished hard
from soft diet groups (see also Sasaguri et al. 1998; Ander-
son et al. 2014). These differences can be accounted for by
the post-weaning growth and development of both the
condyle and angular processes, which are largely depen-
dent on the masseter (Yonemitsu et al. 2007) and lateral
pterygoid muscles (Stutzmann & Petrovic, 1990). Likewise,
the development of the coronoid process is known to
depend upon temporalis muscle (Rot-Nikcevic et al. 2007).
Indeed, here we found that the masseter as the dominant
masticatory muscle in mice (Nakata, 1981) was significantly
lighter in the mice fed on softened pellets than those fed
on hard pellets. As muscle force depends on muscle mass,
the soft food mice may have produced less masticatory
loads, thus providing less mechanical stimuli to the bone
(Ross et al. 2007), resulting in the observed differences in
facial shape. Indeed, despite an overall weak relationship
between muscle force and skull shape in humans, individu-
als with an orthognathic maxilla have larger temporalis
muscles and thus higher muscle forces than prognathic indi-
viduals (Toro-Ibacache et al. 2016).
The effect of diet consistency on masticatory muscle mass
and skull shape beyond the presence of muscle dystrophy
was also reflected by the labially inclined incisors and the
more extended diastemata in the maxilla and mandible of
the two soft food groups (Fig. 4). These differences can also
be seen in the unscaled renderings of the original speci-
mens (Fig. S1) and is in agreement with Kiliaridis et al.
(1985) and Anderson et al. (2014). This configuration sug-
gests an increased outlever arm for biting on the incisors,
effectively reducing bite strength (Samuels, 2009). In fact, as
was shown by Anderson et al. (2014), hard food eaters had
a higher mechanical advantage (i.e. the inlever/outlever
moment arms ratio) than soft food eaters. This is supported
by preliminary observations in our sample that the soft diet
mice had posteriorly more extended mandibular incisors,
with the curve of upper incisors in a slightly more horizon-
tal position compared with the mice fed with normal pellets
(Fig. S1). It is likely that the incisors were worn down less
and at a slower rate in the soft food mice and that the con-
sequent lack in mechanical signal led to an overgrowth at
the cervical loop of the incisor roots below the molars (see
Klein et al. 2008).
In conclusion, our results confirm the prediction that
diminished masticatory function, as the result of a genetic
mutation and an induced dietary shift, resulted in changes
in masticatory muscle mass and skull shape. Within the
skull, shape differences were spatially well defined due to
its modular nature. Within the cranium, the neurocranium
was largely affected by the genetic condition and the face,
as well as most of the mandible and masseter mass, by diet
consistency. It is conceivable that the differential response
of the neurocranium and face is possibly linked to differ-
ences in the onset of altered muscle activity and pattern
and timing of bone development. Although, so far, bone
alterations in mdx mice can be explained by loading-
induced modelling (Schipilow et al. 2013), other effects
related to the mdx mutation that eventually affect bone
developmental pathways cannot be completely ruled out
Table 6 Tests of modularity in the cranium of each group reporting
RV coefficients and the proportion of coefficients of alternative mod-
ules that are lower than the hypothesized ones (low values indicate
stronger modularity).
Structures Group
RV
coefficient
Proportion of
lower RV
coefficients
Neurocranium
vs. face
Wt hard diet 0.67 0.05
Wt soft diet 0.85 0.25
Mdx hard diet 0.60 0.15
Mdx soft diet 0.82 0.71
Ntotal = 48; 12 per group.
© 2017 Anatomical Society
Muscle function and skull shape, A. Spassov et al.10
Page 11
and require further study. The functional plasticity of the
masticatory muscles and the skull, particularly of the face
and mandible, may facilitate dystrophic mice in adopting a
normal facial morphology under a hard diet regimen. Our
study confirms a hierarchical, tripartite organization of the
skull with a modular division of the skull (into neurocra-
nium, face and mandible) based on developmental and
functional constraints, as has been suggested by several
studies dealing with craniofacial integration in mammals in
general and specifically in humans. In particular, one of the
main environmental drivers of human facial variation is said
to be masticatory loading in response to variations in food
consistency. Our study clearly supports this notion.
Acknowledgements
We are very grateful to Ingrid Pieper for technical assistance in
the mouse feeding experiments. We would also like to thank
Gabriele Uhl for use of the microCT scanner in her care and
Jakob Kr€uger for CT scanning the skulls. We are also grateful to
Stefan Schlager, Germ�an Manr�ıquez Soto and Jens van den
Brandt as well as the Editor and two reviewers whose comments
helped to improve this manuscript. Parts of this study are based
on ideas originally conceived by Dragan Pavlovic, to whom we
are grateful.
Author contributions
A.S., H.B., V.T.I. and K.K. designed the study. M.K. collected
muscle data. A.S. collected the landmark data; A.S. and
V.T.I. analyzed the muscle and landmark data. All authors
wrote the article.
Funding
This research was in part supported by the Max Planck Soci-
ety (Germany) and Comisi�on Nacional de Investigaci�on
Cient�ıfica y Tecnol�ogica (FONDECYT Grant 11150175, Chile).
References
Anderson MJ (2001) A new method for non-parametric multi-
variate analysis of variance. Austral Ecol 26, 32–46.
Anderson P, Renaud S, Rayfield E (2014) Adaptive plasticity in
the mouse mandible. BMC Evol Biol 14, 85.
Boughner JC, Wat S, Diewert VM, et al. (2008) Short-faced mice
and developmental interactions between the brain and the
face. J Anat 213, 646–662.
Byron CD, Hamrick MW, Wingard CJ (2006) Alterations of tem-
poralis muscle contractile force and histological content from
the myostatin and Mdx deficient mouse. Arch Oral Biol 51,
396–405.
Cheverud JM (1982) Phenotypic, genetic, and environmental mor-
phological integration in the cranium. Evolution 36, 499–516.
Cheverud JM (2001) The genetic architecture of pleiotropic rela-
tions and differential epistasis. In: The Character Concept in
Evolutionary Biology (ed. Wagner GP), pp. 411. San Diego:
Academic Press.
Cox PG, Jeffery N (2015) The muscles of mastication in rodents
and the function of the medial pterygoid. In: Evolution of the
Rodents: Advances in Phylogeny, Functional Morphology and
Development (eds Cox PG, Hautier L). Cambridge: Cambridge
University Press.
Cox PG, Rayfield EJ, Fagan MJ, et al. (2012) Functional evolution
of the feeding system in rodents. PLoS One 7, e36299.
De Meyer J, Christiaens J, Adriaens D (2016) Diet-induced phe-
notypic plasticity in European eel (Anguilla anguilla). J Exp
Biol 219, 354–363.
Diewert VM (1985) Development of human craniofacial mor-
phology during the late embryonic and early fetal periods.
Am J Orthod 88, 64–76.
Drake AG, Klingenberg CP (2010) Large scale diversification of
skull shape in domestic dogs: disparity and modularity. Am
Nat 175, 289–301.
Emery AEH (2002) The muscular dystrophies. Lancet 359, 687–
695.
Esteve-Altava B, Diogo R, Smith C, et al. (2015) Anatomical net-
works reveal the musculoskeletal modularity of the human
head. Sci Rep 5, 8298.
Faul F, Erdfelder E, Lang A-G, et al. (2007) G*Power 3: a flexible
statistical power analysis program for the social, behavioral,
and biomedical sciences. Behav Res Methods 39, 175–191.
Goswami A (2007) Cranial modularity and sequence hete-
rochrony in mammals. Evol Dev 9, 290–298.
Hallgrimsson B, Percival CJ, Green R, et al. (2015) Morphomet-
rics, 3D imaging, and craniofacial development. In: Current
Topics in Developmental Biology (ed. Yang C), pp. 561–597,
Waltham, Massachussetts: Academic Press.
Hammer Ø, Harper D, Ryan P (2001) PAST: paleontological
statistics software package for education and data analysis.
Paleontol Electron 4, 9.
Jamniczky HA, Hallgr�ımsson B (2011) Modularity in the skull
and cranial vasculature of laboratory mice: implications for
the evolution of complex phenotypes. Evol Dev 13, 28–37.
Kiliaridis S, Engstr€om C, Thilander B (1985) The relationship
between masticatory function and craniofacial morphology. I.
A cephalometric longitudinal analysis in the growing rat fed a
soft diet. Eur J Orthod 7, 273–283.
Klein OD, Lyons DB, Balooch G, et al. (2008) An FGF signaling
loop sustains the generation of differentiated progeny from
stem cells in mouse incisors. Development 135, 377–385.
Klingenberg CP (2009) Morphometric integration and modular-
ity in configurations of landmarks: tools for evaluating a pri-
ori hypotheses. Evol Dev 11, 405–421.
Klingenberg CP (2011) MorphoJ: an integrated software pack-
age for geometric morphometrics. Mol Ecol Resour 11, 353–
357.
Klingenberg CP (2013) Cranial integration and modularity:
insights into evolution and development from morphometric
data. Hystrix 24, 16.
Klingenberg CP, McIntyre GS (1998) Geometric morphomet-
rics of developmental instability: analyzing patterns of fluc-
tuating asymmetry with Procrustes methods. Evolution 52,
1363–1375.
de La Porte S, Morin S, Koenig J (1999) Characteristics of skele-
tal muscle in mdx mutant mice. Int Rev Cytol 191, 99–148.
Laws N, Hoey A (2004) Progression of kyphosis in mdx mice. J
Appl Physiol 97, 1970–1977.
Leamy LJ, Routman EJ, Cheverud JM (1999) Quantitative trait
loci for early- and late-developing skull characters in mice: a
© 2017 Anatomical Society
Muscle function and skull shape, A. Spassov et al. 11
Page 12
test of the genetic independence model of morphological
integration. Am Nat 153, 201–214.
Lefaucheur JP, Pastoret C, Sebille A (1995) Phenotype of dys-
trophinopathy in old mdx mice. Anat Rec 242, 70–76.
Leitao P, Nanda RS (2000) Relationship of natural head position
to craniofacial morphology. Am J Orthod Dentofac Orthop
117, 406–417.
Lenton K, James AW, Manu A, et al. (2011) Indian hedgehog
positively regulates calvarial ossification and modulates bone
morphogenetic protein signaling. Genesis 49, 784–796.
Lieberman DE, Hallgr�ımsson B, Liu W, et al. (2008) Spatial pack-
ing, cranial base angulation, and craniofacial shape variation
in the mammalian skull: testing a new model using mice. J
Anat 212, 720–735.
Lightfoot PS, German RZ (1998) The effects of muscular dystro-
phy on craniofacial growth in mice: a study of heterochrony
and ontogenetic allometry. J Morphol 235, 1–16.
Mart�ınez-Abad�ıas N, Esparza M, Sjøvold T, et al. (2012) Perva-
sive genetic integration directs the evolution of human skull
shape. Evolution 66, 1010–1023.
McGreevy JW, Hakim CH, McIntosh MA, et al. (2015) Animal
models of Duchenne muscular dystrophy: from basic mecha-
nisms to gene therapy. Dis Models Mech 8, 195–213.
Muller J, Vayssiere N, Royuela M, et al. (2001) Comparative evo-
lution of muscular dystrophy in diaphragm, gastrocnemius
and masseter muscles from old male mdx mice. J Muscle Res
Cell Motil 22, 133–139.
Nakata S (1981) Relationship between the development and
growth of cranial bones and masticatory muscles in postnatal
mice. J Dent Res 60, 1440–1450.
Narayanan CH, Fox MW, Hamburger V (1971) Prenatal develop-
ment of spontaneous and evoked activity in the rat (Rattus
norvegicus albinus). Behaviour 40, 100–133.
Pastoret C, Sebille A (1995) Mdx mice show progressive weakness
and muscle deterioration with age. J Neurol Sci 129, 97–105.
Pinhasi R, Eshed V, von Cramon-Taubadel N (2015) Incon-
gruity between affinity patterns based on mandibular and
lower dental dimensions following the transition to agri-
culture in the near east, Anatolia and Europe. PLoS One
10, e0117301.
Renaud S, Auffray J-C, de la Porte S (2010) Epigenetic effects on
the mouse mandible: common features and discrepancies in
remodeling due to muscular dystrophy and response to food
consistency. BMC Evol Biol 10, 28.
Rosas A, Bastir M (2004) Geometric morphometric analysis of
allometric variation in the mandibular morphology of the
hominids of Atapuerca, Sima de los Huesos site. Anat Rec A
Discov Mol Cell Evol Biol 278A, 551–560.
Ross CF, Dharia R, Herring SW, et al. (2007) Modulation of
mandibular loading and bite force in mammals during masti-
cation. J Exp Biol 210, 1046–1063.
Rot-Nikcevic I, Reddy T, Downing K, et al. (2006) Myf5�/�:MyoD�/� amyogenic fetuses reveal the importance of early
contraction and static loading by striated muscle in mouse
skeletogenesis. Dev Genes Evol 216, 1–9.
Rot-Nikcevic I, Downing K, Hall B, et al. (2007) Development of
the mouse mandibles and clavicles in the absence of skeletal
myogenesis. Histol Histopathol 22, 51–60.
Samuels JX (2009) Cranial morphology and dietary habits of
rodents. Zool J Linn Soc 156, 864–888.
Sasaguri K, Jiang H, Chen J (1998) The effect of altered func-
tional forces on the expression of bone-matrix proteins in
developing mouse mandibular condyle. Arch Oral Biol 43, 83–
92.
Schipilow JD, Macdonald HM, Liphardt AM, et al. (2013) Bone
micro-architecture, estimated bone strength, and the muscle-
bone interaction in elite athletes: an HR-pQCT study. Bone 56,
281–289.
Schwenk K (2000) Feeding: Form, Function And Evolution in
Tetrapod Vertebrates. San Diego: Academic Press.
Singh N, Dutka T, Devenney BM, et al. (2015) Acute upregula-
tion of hedgehog signaling in mice causes differential effects
on cranial morphology. Dis Models Mech 8, 271–279.
Smith KK (1993) The form of the feeding apparatus in terrestrial
vertebrates: studies of adaptation and constraint. In: The Skull
(eds Hanken J, Hall BK), pp. 150–196. Chicago: The University
of Chicago Press.
Solow B, Kreiborg S (1977) Soft-tissue stretching: a possible con-
trol factor in craniofacial morphogenesis. Eur J Oral Sci 85,
505–507.
Solow B, Siersb S (1992) Cervical and craniocervical posture as
predictors of craniofacial growth. Am J Orthod Dentofac
Orthop 101, 449–458.
Spassov A, Gredes T, Gedrange T, et al. (2010) Histological
changes in masticatory muscles of mdx mice. Arch Oral Biol
55, 318–324.
Stutzmann JJ, Petrovic AG (1990) Role of the lateral pterygoid
muscle and meniscotemporomandibular frenum in sponta-
neous growth of the mandible and in growth stimulated by
the postural hyperpropulsor. Am J Orthod Dentofac Orthop
97, 381–392.
Suzue T (1996) Movements of mouse fetuses in early stages of
neural development studied in vitro. Neurosci Lett 218, 131–134.
Toro-Ibacache V, Zapata Mu~noz V, O’Higgins P (2016) The rela-
tionship between skull morphology, masticatory muscle force
and cranial skeletal deformation during biting. Ann Anat 203,
59–68.
Torres LFB, Duchen LW (1987) The mutant mdx: inherited
myopathy in the mouse. Morphological studies of nerves,
muscles and end-plates. Brain 110, 269–299.
Turk R, Sterrenburg E, de Meijer E, et al. (2005) Muscle regener-
ation in dystrophin-deficient mdx mice studied by gene
expression profiling. BMC Genom 6, 98.
Uzer G, Thompson WR, Sen B, et al. (2015) Cell mechanosensi-
tivity to extremely low magnitude signals is enabled by a
LINCed nucleus. Stem Cells 33, 2063–2076.
Vecchione L, Byron C, Cooper GM, et al. (2007) Craniofacial
morphology in myostatin-deficient mice. J Dent Res 86, 1068–
1072.
Vilmann H, Juhl M, Kirkeby S (1985) Bone-muscle interactions in
the muscular dystrophic mouse. Eur J Orthod 7, 185–192.
Willmore KE, Leamy L, Hallgr�ımsson B (2006) Effects of develop-
mental and functional interactions on mouse cranial variabil-
ity through late ontogeny. Evol Dev 8, 550–567.
Wineinger MA, Abresch RT, Walsh SA, et al. (1998) Effects of
ageing and voluntary exercise on the function of dystrophic
muscle form from mdx mice. Am J Phys Med Rehabil 77, 20–
27.
Yerges LM, Klei L, Cauley JA, et al. (2010) Candidate gene anal-
ysis of femoral neck trabecular and cortical volumetric bone
mineral density in older men. J Bone Miner Res 25, 330–338.
Yonemitsu I, Muramoto T, Soma K (2007) The influence of mas-
seter activity on rat mandibular growth. Arch Oral Biol 52,
487–493.
© 2017 Anatomical Society
Muscle function and skull shape, A. Spassov et al.12
Page 13
Zelditch M, Wood A, Swiderski D (2009) Building developmental
integration into functional systems: function-induced integra-
tion of mandibular shape. Evol Biol 36, 71–87.
Supporting Information
Additional Supporting Information may be found in the online
version of this article:
Table S1. Muscle mass and centroid size (CS) comparisons
between groups.
Fig. S1. 3D renderings of mouse skulls showing the enamel lin-
ing of the incisors and the enamel caps of the molars in four
representative wt/mdx and hard/soft food animals, respec-
tively. The red lines indicate the course of the upper (solid)
and lower incisors (dotted) in the wt soft, mdx hard and mdx
soft diet mice relative to the incisor morphology in the wt
hard diet mouse. Note the differences in inclination in the
maxillary incisors and the length of the mandibular incisors
relative to the molars between the hard food and soft food
mice.
© 2017 Anatomical Society
Muscle function and skull shape, A. Spassov et al. 13