Oldowan behavior and raw material transport: perspectives from the Kanjera Formation David R. Braun a, * , Thomas Plummer b, c , Peter Ditchfield d , Joseph V. Ferraro e , David Maina f , Laura C. Bishop g , Richard Potts h, i a Department of Archaeology, University of Cape Town, Rondebsoch 7701, South Africa b Department of Anthropology, Queens College, CUNY, New York, USA c New York Consortium in Evolutionary Anthropology, Flushing, New York 11367, USA d Research Laboratory for Archaeology and the History of Art, University of Oxford, Oxford, OX13QY, UK e Department of Anthropology, Baylor University, One Bear Place #97173, Waco, TX 76798-7173, USA f Institute of Nuclear Science, College of Architecture and Engineering, University of Nairobi, PO Box 30197, Nairobi, Kenya g Research Centre in Evolutionary Anthropology and Paleoecology, School of Biological and Earth Sciences, Liverpool John Moores University, Liverpool, L3 3AF, UK h Human Origins Program, National Museum of Natural History, Smithsonian Institution, Washington, DC 20013-7012, USA i Division of Paleontology, National Museums of Kenya, PO Box 40658, Nairobi 00100, Kenya article info Article history: Received 25 October 2007 Received in revised form 16 February 2008 Accepted 3 March 2008 Keywords: Oldowan Stone tools Transport Raw materials Sourcing ED-XRF Lithic technology abstract The archaeological record of Oldowan hominins represents a diverse behavioral system. It has been suggested that exploitation of lithic resources by Oldowan hominins was simplistic and represented mostly use of local sources of stone. Here we investigate the raw material selection and transport be- haviors of Oldowan hominins reflected in the stone artifact assemblages from the Kanjera South For- mation, South Rachuonyo District, Kenya. Using geochemical methods (ED-XRF) artifacts are linked to primary and secondary source outcrops throughout southwestern Kenya. These data show that hominins selected raw materials for transport at frequencies that are significantly different from their availability on ancient landscapes. Furthermore, a substantial proportion of the assemblage represents transport over relatively long distances (>10 km). Our study further suggests that in the early stages of stone tool use hominins used a wide variety of raw materials and selected these materials at some distance from their eventual discard locations. Early hominin behavior may have incorporated an understanding of raw material source distributions across a more extensive landscape than has been previously documented. This supports the growing perspective that Oldowan technology represents a more complex behavioral pattern than is usually associated with the beginnings of hominin tool use. Ó 2008 Elsevier Ltd. All rights reserved. 1. Introduction Studies of Oldowan hominin behavior have suggested that transport of resources was a major component of early stone tool use (de Heinzelin et al., 1999; Negash et al., 2005; Potts, 1984, 1991, 1994; Potts et al., 1999; Schick, 1987). The distribution of resources has been shown to affect material culture in modern hunter- gatherers (Binford, 1973; Binford, 1977, 1979; Shott, 1986) and in non-human primates (Boesch and Boesch, 1984; Sugiyama, 1993). Archaeologically, the distribution of raw materials impacts artifact composition and form (Bamforth, 1986, 1990; Dibble, 1995a,b; Kimura, 1999, 2002; Marks et al., 1991; Marks, 1988; Noll, 2000; Potts, 1994; Rogers et al., 1994; Roth and Dibble, 1998; Stiles, 1979, 1991, 1998). There is a continuous relationship between the level of raw material availability and assemblage composition even when technological attributes remain constant (Marks, 1988). The dy- namics behind transfer of stone from source to site (Isaac, 1984) seems to be effected over relatively short distances (i.e. 1–5 km) in the Early Stone Age (Potts, 1994; Potts et al., 1999; Toth, 1982) and later technologies (Marks et al., 1991; Marks, 1988). Even within the same toolkit variation in technological behavior may appear to be represented by different raw materials based on their proximity and overall availability (Freeman, 1994; Geneste, 1988; Kuhn, 1991; Meignen, 1988; Tavoso, 1984). Here we investigate the effect of raw material availability on Oldowan artifact assemblages from the Kanjera South Formation. The Kanjera South Formation is located in South Rachuonyo District, Kenya, and has been investigated since 1995 under the auspices of the Homa Peninsula Paleoanthropology Project (Behrensmeyer et al., 1995; Plummer et al., 1999; Plummer, 2004). Magnetostratigraphy and biostratigraphy have securely dated the site between 1.95 and 2.3 (Plummer, 2004). * Corresponding author. Tel.: þ27 21 6502350; fax: þ27 21 6502352. E-mail address: [email protected](D.R. Braun). Journal of Archaeological Science 35 (2008) 2329–2345 Contents lists available at ScienceDirect Journal of Archaeological Science journal homepage: http://www.elsevier.com/locate/jas 0305-4403/$ – see front matter Ó 2008 Elsevier Ltd. All rights reserved. doi:10.1016/j.jas.2008.03.004
Transcript
lable at ScienceDirect
Journal of Archaeological Science 35 (2008) 2329–2345
lable at ScienceDirect
Contents lists avaiContents lists avai
Journal of Archaeological Science
journal homepage: ht tp: / /www.elsevier .com/locate/ jas
Journal of Archaeological Science
journal homepage: ht tp: / /www.elsevier .com/locate/ jas
Oldowan behavior and raw material transport: perspectivesfrom the Kanjera Formation
David R. Braun a,*, Thomas Plummer b,c, Peter Ditchfield d, Joseph V. Ferraro e, David Maina f,Laura C. Bishop g, Richard Potts h,i
a Department of Archaeology, University of Cape Town, Rondebsoch 7701, South Africab Department of Anthropology, Queens College, CUNY, New York, USAc New York Consortium in Evolutionary Anthropology, Flushing, New York 11367, USAd Research Laboratory for Archaeology and the History of Art, University of Oxford, Oxford, OX1 3QY, UKe Department of Anthropology, Baylor University, One Bear Place #97173, Waco, TX 76798-7173, USAf Institute of Nuclear Science, College of Architecture and Engineering, University of Nairobi, PO Box 30197, Nairobi, Kenyag Research Centre in Evolutionary Anthropology and Paleoecology, School of Biological and Earth Sciences, Liverpool John Moores University, Liverpool, L3 3AF, UKh Human Origins Program, National Museum of Natural History, Smithsonian Institution, Washington, DC 20013-7012, USAi Division of Paleontology, National Museums of Kenya, PO Box 40658, Nairobi 00100, Kenya
a r t i c l e i n f o
Article history:Received 25 October 2007Received in revised form 16 February 2008Accepted 3 March 2008
0305-4403/$ – see front matter � 2008 Elsevier Ltd.doi:10.1016/j.jas.2008.03.004
a b s t r a c t
The archaeological record of Oldowan hominins represents a diverse behavioral system. It has beensuggested that exploitation of lithic resources by Oldowan hominins was simplistic and representedmostly use of local sources of stone. Here we investigate the raw material selection and transport be-haviors of Oldowan hominins reflected in the stone artifact assemblages from the Kanjera South For-mation, South Rachuonyo District, Kenya. Using geochemical methods (ED-XRF) artifacts are linked toprimary and secondary source outcrops throughout southwestern Kenya. These data show that homininsselected raw materials for transport at frequencies that are significantly different from their availabilityon ancient landscapes. Furthermore, a substantial proportion of the assemblage represents transportover relatively long distances (>10 km). Our study further suggests that in the early stages of stone tooluse hominins used a wide variety of raw materials and selected these materials at some distance fromtheir eventual discard locations. Early hominin behavior may have incorporated an understanding of rawmaterial source distributions across a more extensive landscape than has been previously documented.This supports the growing perspective that Oldowan technology represents a more complex behavioralpattern than is usually associated with the beginnings of hominin tool use.
� 2008 Elsevier Ltd. All rights reserved.
1. Introduction
Studies of Oldowan hominin behavior have suggested thattransport of resources was a major component of early stone tooluse (de Heinzelin et al., 1999; Negash et al., 2005; Potts, 1984, 1991,1994; Potts et al., 1999; Schick, 1987). The distribution of resourceshas been shown to affect material culture in modern hunter-gatherers (Binford, 1973; Binford, 1977, 1979; Shott, 1986) and innon-human primates (Boesch and Boesch, 1984; Sugiyama, 1993).Archaeologically, the distribution of raw materials impacts artifactcomposition and form (Bamforth, 1986, 1990; Dibble, 1995a,b;Kimura, 1999, 2002; Marks et al., 1991; Marks, 1988; Noll, 2000;Potts, 1994; Rogers et al., 1994; Roth and Dibble, 1998; Stiles, 1979,1991, 1998). There is a continuous relationship between the level of
þ27 21 6502352.).
All rights reserved.
raw material availability and assemblage composition even whentechnological attributes remain constant (Marks, 1988). The dy-namics behind transfer of stone from source to site (Isaac, 1984)seems to be effected over relatively short distances (i.e. 1–5 km) inthe Early Stone Age (Potts, 1994; Potts et al., 1999; Toth, 1982) andlater technologies (Marks et al., 1991; Marks, 1988). Even within thesame toolkit variation in technological behavior may appear to berepresented by different raw materials based on their proximityand overall availability (Freeman, 1994; Geneste, 1988; Kuhn, 1991;Meignen, 1988; Tavoso, 1984).
Here we investigate the effect of raw material availability onOldowan artifact assemblages from the Kanjera South Formation.The Kanjera South Formation is located in South RachuonyoDistrict, Kenya, and has been investigated since 1995 under theauspices of the Homa Peninsula Paleoanthropology Project(Behrensmeyer et al., 1995; Plummer et al., 1999; Plummer, 2004).Magnetostratigraphy and biostratigraphy have securely dated thesite between 1.95 and 2.3 (Plummer, 2004).
D.R. Braun et al. / Journal of Archaeological Science 35 (2008) 2329–23452330
Artifacts and fossils were recovered in three beds, from oldest toyoungest KS-1 to KS-3 (Behrensmeyer et al., 1995; Ditchfield et al.,1999). KS-1 has a lower part consisting of coarse grained agglom-erate and upper layers consisting of interbedded sandy silts andfine sands with occasional pebbles and granule lenses. KS-2 hastwo components, a fine pebbly clay rich sand (KS-2 PS) and a thin,patchy conglomerate (KS-2 CP). KS-3 is a sandy silt that also haspatchy conglomerate components (KS-3 CP). KS-1 depositionseems to have occurred under mudflat or floodplain conditions,while KS-2 and KS-3 represent fluvial deposits from intermittentlyflowing, braided streams at the edge of a lake. Stable land surfaces(as evidenced by weak to moderate paleosol formation) werepresent during depositional hiatuses and the predominant habitattype during deposition of the sequence appears to have beena wooded grassland (Plummer et al., 1999). Recurrent visitation ofthe site locales combined with relatively rapid sedimentation led toa thick (w1.5 m) sequence with archeological material. Assessmentof site formation processes indicates that hominins accumulatedartifact and faunal remains in the non-conglomerate levels(Plummer et al., 1999; Plummer, 2004). Excavations so far haverecovered 4474 artifacts, making it one of the largest Oldowanassemblages known.
The high integrity of the site and the associated faunal re-mains make inferences derived from analyses of the archaeologyof the Kanjera South Formation an important part of our un-derstanding of early hominin behavior. This study focuses on theprovenience of artifacts to investigate stone transport and rawmaterial selectivity among early hominins. We investigate possi-ble raw material selectivity by testing the difference between thefrequencies of raw materials in the artifact collection with thoseraw materials available as conglomerates in various parts of theWinam Gulf. If Pliocene hominins only selected materials basedon their local availability in the ancient landscape there should bea strong relationship between the frequency lithologies in localconglomerates and the archaeological collection. First, usinggeochemical methods we provide a link between artifacts andprobable primary and secondary sources. These links suggest thatnearly one third of the artifact collection at Kanjera South rep-resents transport of raw materials over relatively long distancesfor this time period. Second, we suggest that transport selectivityreflected a more complex behavioral pattern of raw material usethan previously documented for Oldowan hominins. Certain rocktypes appear at higher frequencies in the Kanjera South archae-ological assemblage than would be expected based on their fre-quency in conglomerates that are separated by greater than10 km from the site. Furthermore transport of certain raw ma-terials to Kanjera South is limited to select lithologies. Oldowanhominin behavior at Kanjera South depended on stone artifacts tosome degree as evidenced by the use of distant sources and theextensive energy thus probably invested in the transport of cer-tain lithic materials to the Kanjera South locality. The relation-ships between transport decisions, raw material quality, andartifact manufacture techniques are described elsewhere (Braun,2006).
2. Raw material sourcing
A concise understanding of the geospatial distribution of rawmaterial availability is clearly necessary for a comprehensive arti-fact provenance study. Identification of raw material sources isa complex process that involves the integration of geochemical,geomorphological, sedimentological, and archaeological data(Church, 1996; Negash et al., 2005; Noll, 2000; Shackley, 1998).Shackley (1998) emphasizes the need to analytically separateprimary and secondary sources of raw material. Visual inspectionsof raw material lithology can be very useful for determining
archaeologically relevant lithological categories (Stout et al., 2005).However, several studies have suggested that hand sample identi-fications can misclassify sources within major raw material groups(Calogero, 1992; Lanier and Dodd, 1985; Moholy-Nagy and Nelson,1990; Perry, 1992). Even across major raw material groups mis-identifications are common in assemblages of fine grained rocks(Hermes et al., 2001). Hence, this study uses the combination ofgeochemical characterization with macroscopic identification aspart of a large secondary and primary source sampling study toproduce a model of toolstone availability on the southern side ofthe Winam Basin in western Kenya.
Although extensive sampling was conducted to determine thelocations of primary and secondary sources of rock this study, likemany raw material provenance projects, is largely probabilistic(Eerkens and Rosenthal, 2004; Shackley, 1998). Therefore, we cannever say with absolute certainty the exact locations of raw ma-terial sources because of the multitude of problems associated withassigning an artifact to a specific primary source (i.e. intra-sourcevariability (Shackley, 1998); secondary source transport (Church,2000; Reid, 1997)). Furthermore identification to an exact primarysource location is not a useful behavioral variable at Kanjera Southbecause most artifacts are produced on river cobbles (Braun et al.,in press). Documenting transport over a limited geographic scale toa particular primary source is therefore not pertinent for theKanjera South Oldowan assemblage. Rather we intend to developecological models of hominin behavior that suggest general trendsof artifact transport through space and time over larger areas of theancient landscape.
Therefore, this study aims to create broad trends in the geo-graphic distribution of certain raw materials. Inferences of thepaleogeography of southwestern Kenya (Kent, 1942; Le Bas, 1977;Saggerson, 1952) allow the determination of broad landscape scaleavailability of certain raw material types, usually associated withthe bed load of particular river systems that can be distinguishedtemporally and geographically.
3. Methodology
The great variety of raw materials incorporated into the tech-nological repertoire of hominins at Kanjera South is affected by theextremely heterogeneous geology of southwestern Kenya. Rawmaterial sourcing studies must incorporate a comprehensive un-derstanding of the primary source geology so that variation withinsource can be understood. Furthermore, paleogeographical in-ferences are necessary in order predict the location of secondarysources in antiquity. This framework must accommodate variationspecific to the archaeological sample, such as diagenetic modifi-cation (e.g. phenocrysts weathering, secondary mineral re-placement) and behavioral selection (e.g. the fracture mechanics offine grained stone is more predictable so hominins are more likelyto select the finest grained variety of a rock source despite the di-versity of grain sizes within a primary source). The archaeologicaland modern data sets, moreover, need to be integrated to allowbehavioral interpretations of the influence of raw material variationon technological behavior.
Using this framework a study of raw material sources on theHoma Peninsula was conducted over five years in four phases,which are summarized in the next four sections.
3.1. Artifact hand sample identification
Major rock types used by early hominins were identifiedthrough visual inspection of artifacts under low magnification. Thisfirst phase of work provided a baseline framework for raw materialvariation in the artifact collection.
D.R. Braun et al. / Journal of Archaeological Science 35 (2008) 2329–2345 2331
3.2. Primary source identification
The variation in artifact lithology was used to inform initial in-vestigations of primary source rock outcrops on and around theHoma Peninsula. Sample collections of rock types were collectedduring surveys from almost every primary source that had beenpreviously mapped (Le Bas, 1977; Saggerson, 1952). A database of232 separate rock outcrops and 513 separate primary source sam-ples was developed. Outcrops were sampled multiple times todetermine the geochemical variation in specific rock types. Thisextensive coverage allowed us to isolate outcrops that were used tomake artifacts as well as those rock types that were not utilized byearly hominins. Variation in major rock types was documentedusing destructive and non-destructive X-ray fluorescence (XRF)techniques.
3.3. Artifact geochemistry
Variation within the artifact sample was investigated usingdestructive and non-destructive techniques. Non-destructivetechniques can accurately provide only semi-quantitative in-formation about the trace element chemistry of artifacts. How-ever, ratios of trace elements have proved very useful foraccurately characterizing specific groups of raw materials (Lathamet al., 1992). Previous analyses suggests that this technique isaccurate for assessing provenance within a single data set(Plummer et al., 1994). Non-destructive data cannot be comparedto elemental concentrations gathered from other studies. Yeta comparison of the relative concentrations of trace elementswithin the data set (i.e., from one sample to another) is possible.In this study the non-destructive technique was applied to 4346artifacts. A small sub-sample of artifacts (1 artifact per major rawmaterial group) was analyzed destructively to determine if themajor element characterizations could be linked with a traceelement signature in a way that represents meaningful lithologicalgroups. Trace element signatures were used to link artifacts andprimary sources.
3.4. Secondary source identification
The next phase of the study was to understand the relationshipbetween primary (outcrop) source of stone and secondary sources(conglomerates). Several conglomerates were identified along thegully systems that intersect the southern shores of the Winam Gulf.These conglomerates were sampled and destructive XRF analyseswere conducted to match these samples to primary source rockoutcrops. This procedure provided a generalized picture of whererock types were available on past landscapes. Geological de-scriptions of the sedimentary context of deposits on the southernshores of the Winam basin suggest that the river systems are re-stricted by major structural aspects of the Winam Basin. Major riversystems (such as the Awach River) appear to be controlled by majorfaults in the region (Kent, 1942; McCall, 1958; Saggerson, 1952).
4. Geochemical techniques
This study employed non-destructive and destructive forms ofenergy dispersive X-ray fluorescence (ED-XRF).
4.1. Non-destructive trace element analyses
Non-destructive ED-XRF analyses can accurately determinetrace element composition in a wide array of sample types (e.g.silicate rocks, fossils) (Borkhodoev, 2002; D’Angelo et al., 2002;Hermes and Ritchie, 1997; Hermes et al., 2001; Latham et al.,1992; Plummer et al., 1994). Non-destructive ED-XRF analysis of
fine grained rocks has been proven especially effective for thesemi-quantitative assessment of artifact geochemistry (Hermesand Ritchie, 1997; Hermes et al., 2001). The non-destructive semi-quantitative dataset was applied to whole rock samples (artifacts,primary source blocks and secondary source cobbles). Semi-quantitative analyses provide data that is useful for comparisonswithin the dataset but are unlikely to provide enough accuracy forcomparison across different instruments. In other words semi-quantitative data may lack some accuracy while precision ofelemental values remains high. Weathering processes havea substantial affect on intra-source variation and was consideredwhen analyzing elements with concentrations near detectionlimits, however these affects are ameliorated by the penetrationof primary X-rays beyond the surface of whole rock samples(Davis et al., 1998). The non-destructive technique followed pro-tocols outlined by Hermes and Ritchie (1997) to increase precisionand accuracy. Whole rock samples were cleaned in an ultrasonicbath for 3 min to remove adhering matrix. Samples from ar-chaeological assemblages were selected based on the absence ofadhering sedimentary matrix under 10� hand lens inspection.Whole rock samples were exposed directly to the primary X-raybeam. Analyzed surfaces were selected so that only those surfaceswith minimum relief were exposed to the primary X-ray beam(Hermes and Ritchie, 1997). For each sample three separate sur-faces of each artifact were analyzed. This reduced the possibilityof data being influenced by uneven concentrations of trace ele-ments in phenocrysts or the matrix of the rocks (i.e. the ‘‘nugget’’effect’’; Dello-Russo, 2004).For whole rock samples spectra wereacquired for 500 live count seconds. Analysis from these methodsis limited to trace elements Rb, Zr, Sr, Y.
4.2. Destructive analyses
Samples for destructive ED-XRF analysis were pulverized to lessthan 50 mm, homogenized, and pressed into a pellet. This type ofsample preparation allowed for rapid and precise determination ofmajor, minor, a trace elemental composition (Saini et al., 2000).Prepared samples were analyzed for 500 lives seconds. Bothdestructive and non-destructive trace element analyses wereconducted at the University of Nairobi, Institute of Nuclear ScienceED-XRF facility. This facility uses a Cd-109 radioisotope source witha Si(Li) detector across a beryllium window. Spectra were collectedusing a Canberra multi-channel analyzer through a Canberra 2020signal amplifier. Problems of overprint from overlapping Ka and Kb
peaks were resolved using Axil-QXAS software developed by theInternational Atomic Energy Association (IAEA). Major elementchemistry was conducted on a Phillips MiniPal with an Rh X-Raytube and a Si(Li) detector. Secondary filters of the primary X-rayswere used to provide optimum sensitivity for particular elements. AKapton filter was used for Si. An Al filter was used for K and Mn. AMo filter was used for Fe. No filter was used for the analysis of Caand Na. All spectra were captured for 500 live seconds and wererepeated at least twice to ensure the precision of the results.Elemental concentrations were calculated using 12 USGS standards(W-2; BHVO-1; SCO-1; QLO-1; BIR-1; RGM-1; GSP-2; AGV-2;(Lemberge et al., 2000; Potts, 1987)). Known standard sampleswere run throughout all analyses to maintain the accuracy of theresults.
4.3. Methodological results: comparison of destructive and non-destructive trace element analysis
Since we apply this technique to a variety of igneous andmetamorphic rock types, it was necessary to determine if thistype of analysis could produce consistent trace element signaturesfor a variety of rock types. Thirty-three samples of various rock
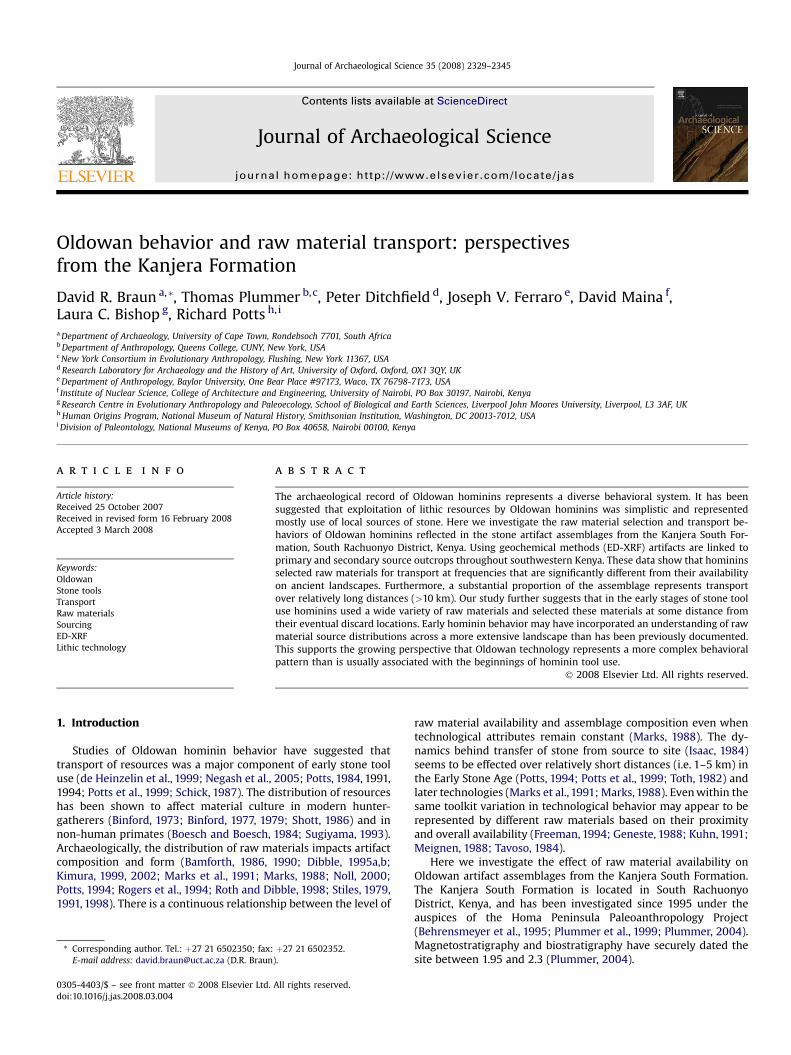
Fig. 1. Comparison of trace element analysis from non-destructive and destructive techniques on various rock types. Four trace elements are investigated: (a) rubidium; (b)strontium; (c) zirconium; (d) yttrium. Five different rock types are used in this analysis. Closed rectangles, basalt; closed diamonds, granite; open squares, quartzite; crosses,rhyolite.
D.R. Braun et al. / Journal of Archaeological Science 35 (2008) 2329–23452332
types (basalt, granite, quartzite, rhyolite) from this study wereanalyzed using both the destructive and non-destructive tech-niques. Five trace elements were selected to determine the abilityof the non-destructive technique (semi-quantitative) to producesimilar data as the destructive technique (quantitative). The traceelements selected in this study (Rb, Sr, Zr, Y) are sometimes re-ferred to as ‘‘incompatible’’ elements and are particularly usefulfor geochemical characterization (Potts, 1987). These elements are
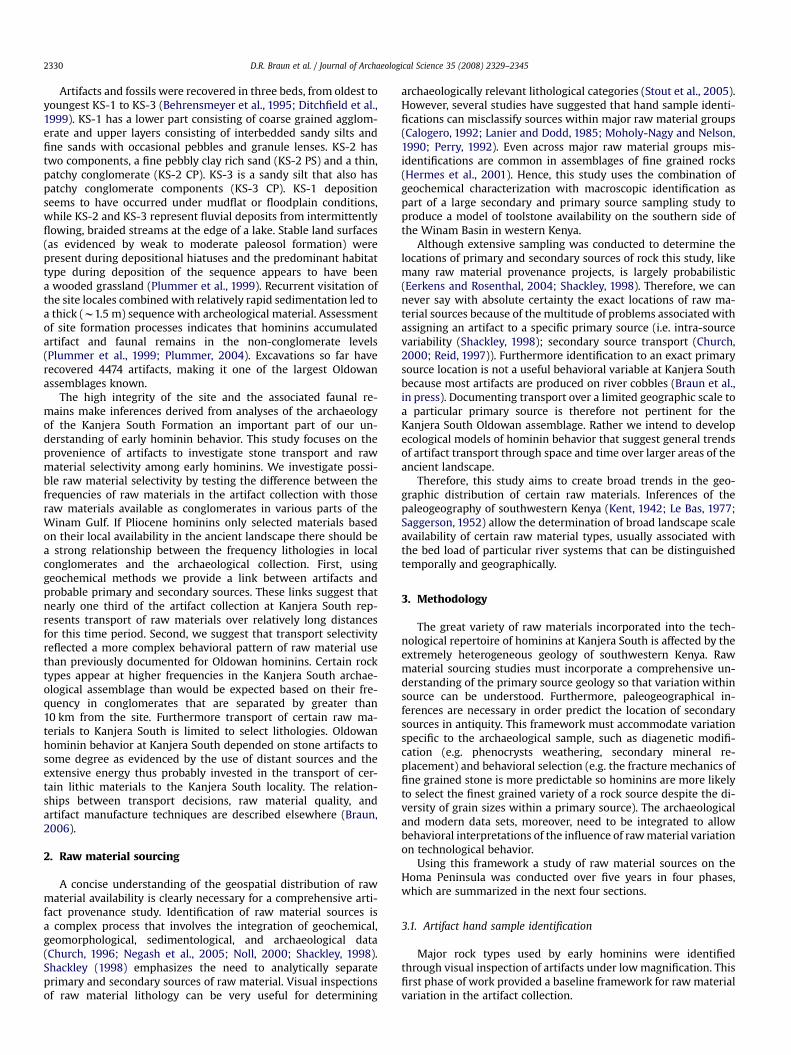
Fig. 2. Map of major features of the Winam
often good for the characterization of rock types because they willenter only into certain crystalline phases (Hall and Kimura, 2002,p. 260). Comparison of destructive and non-destructive tech-niques shows good correlation between these two techniques(Fig. 1). All correlations between destructive and non-destructivedata sets are significant to the p < 0.001 level and thereforesupport the use of the non-destructive data set for the analysis oftrace element concentration.
Basin that are mentioned in the text.
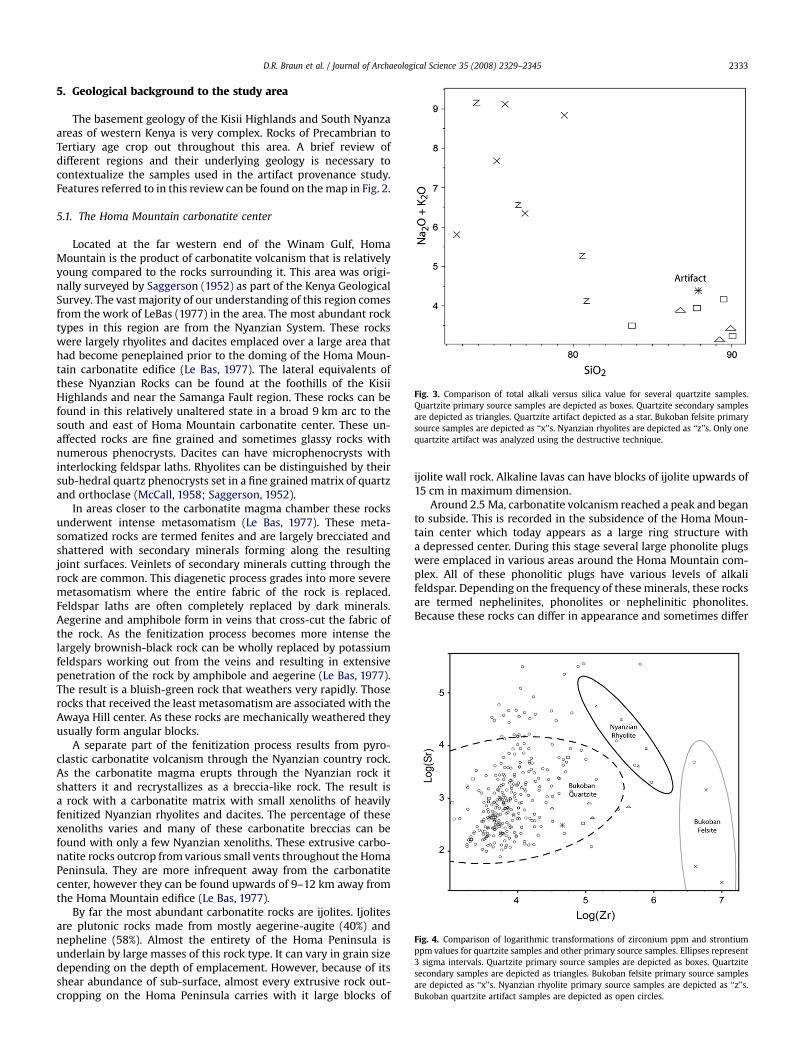
Fig. 3. Comparison of total alkali versus silica value for several quartzite samples.Quartzite primary source samples are depicted as boxes. Quartzite secondary samplesare depicted as triangles. Quartzite artifact depicted as a star. Bukoban felsite primarysource samples are depicted as ‘‘x’’s. Nyanzian rhyolites are depicted as ‘‘z’’s. Only onequartzite artifact was analyzed using the destructive technique.
Fig. 4. Comparison of logarithmic transformations of zirconium ppm and strontiumppm values for quartzite samples and other primary source samples. Ellipses represent3 sigma intervals. Quartzite primary source samples are depicted as boxes. Quartzitesecondary samples are depicted as triangles. Bukoban felsite primary source samplesare depicted as ‘‘x’’s. Nyanzian rhyolite primary source samples are depicted as ‘‘z’’s.Bukoban quartzite artifact samples are depicted as open circles.
D.R. Braun et al. / Journal of Archaeological Science 35 (2008) 2329–2345 2333
5. Geological background to the study area
The basement geology of the Kisii Highlands and South Nyanzaareas of western Kenya is very complex. Rocks of Precambrian toTertiary age crop out throughout this area. A brief review ofdifferent regions and their underlying geology is necessary tocontextualize the samples used in the artifact provenance study.Features referred to in this review can be found on the map in Fig. 2.
5.1. The Homa Mountain carbonatite center
Located at the far western end of the Winam Gulf, HomaMountain is the product of carbonatite volcanism that is relativelyyoung compared to the rocks surrounding it. This area was origi-nally surveyed by Saggerson (1952) as part of the Kenya GeologicalSurvey. The vast majority of our understanding of this region comesfrom the work of LeBas (1977) in the area. The most abundant rocktypes in this region are from the Nyanzian System. These rockswere largely rhyolites and dacites emplaced over a large area thathad become peneplained prior to the doming of the Homa Moun-tain carbonatite edifice (Le Bas, 1977). The lateral equivalents ofthese Nyanzian Rocks can be found at the foothills of the KisiiHighlands and near the Samanga Fault region. These rocks can befound in this relatively unaltered state in a broad 9 km arc to thesouth and east of Homa Mountain carbonatite center. These un-affected rocks are fine grained and sometimes glassy rocks withnumerous phenocrysts. Dacites can have microphenocrysts withinterlocking feldspar laths. Rhyolites can be distinguished by theirsub-hedral quartz phenocrysts set in a fine grained matrix of quartzand orthoclase (McCall, 1958; Saggerson, 1952).
In areas closer to the carbonatite magma chamber these rocksunderwent intense metasomatism (Le Bas, 1977). These meta-somatized rocks are termed fenites and are largely brecciated andshattered with secondary minerals forming along the resultingjoint surfaces. Veinlets of secondary minerals cutting through therock are common. This diagenetic process grades into more severemetasomatism where the entire fabric of the rock is replaced.Feldspar laths are often completely replaced by dark minerals.Aegerine and amphibole form in veins that cross-cut the fabric ofthe rock. As the fenitization process becomes more intense thelargely brownish-black rock can be wholly replaced by potassiumfeldspars working out from the veins and resulting in extensivepenetration of the rock by amphibole and aegerine (Le Bas, 1977).The result is a bluish-green rock that weathers very rapidly. Thoserocks that received the least metasomatism are associated with theAwaya Hill center. As these rocks are mechanically weathered theyusually form angular blocks.
A separate part of the fenitization process results from pyro-clastic carbonatite volcanism through the Nyanzian country rock.As the carbonatite magma erupts through the Nyanzian rock itshatters it and recrystallizes as a breccia-like rock. The result isa rock with a carbonatite matrix with small xenoliths of heavilyfenitized Nyanzian rhyolites and dacites. The percentage of thesexenoliths varies and many of these carbonatite breccias can befound with only a few Nyanzian xenoliths. These extrusive carbo-natite rocks outcrop from various small vents throughout the HomaPeninsula. They are more infrequent away from the carbonatitecenter, however they can be found upwards of 9–12 km away fromthe Homa Mountain edifice (Le Bas, 1977).
By far the most abundant carbonatite rocks are ijolites. Ijolitesare plutonic rocks made from mostly aegerine-augite (40%) andnepheline (58%). Almost the entirety of the Homa Peninsula isunderlain by large masses of this rock type. It can vary in grain sizedepending on the depth of emplacement. However, because of itsshear abundance of sub-surface, almost every extrusive rock out-cropping on the Homa Peninsula carries with it large blocks of
ijolite wall rock. Alkaline lavas can have blocks of ijolite upwards of15 cm in maximum dimension.
Around 2.5 Ma, carbonatite volcanism reached a peak and beganto subside. This is recorded in the subsidence of the Homa Moun-tain center which today appears as a large ring structure witha depressed center. During this stage several large phonolite plugswere emplaced in various areas around the Homa Mountain com-plex. All of these phonolitic plugs have various levels of alkalifeldspar. Depending on the frequency of these minerals, these rocksare termed nephelinites, phonolites or nephelinitic phonolites.Because these rocks can differ in appearance and sometimes differ
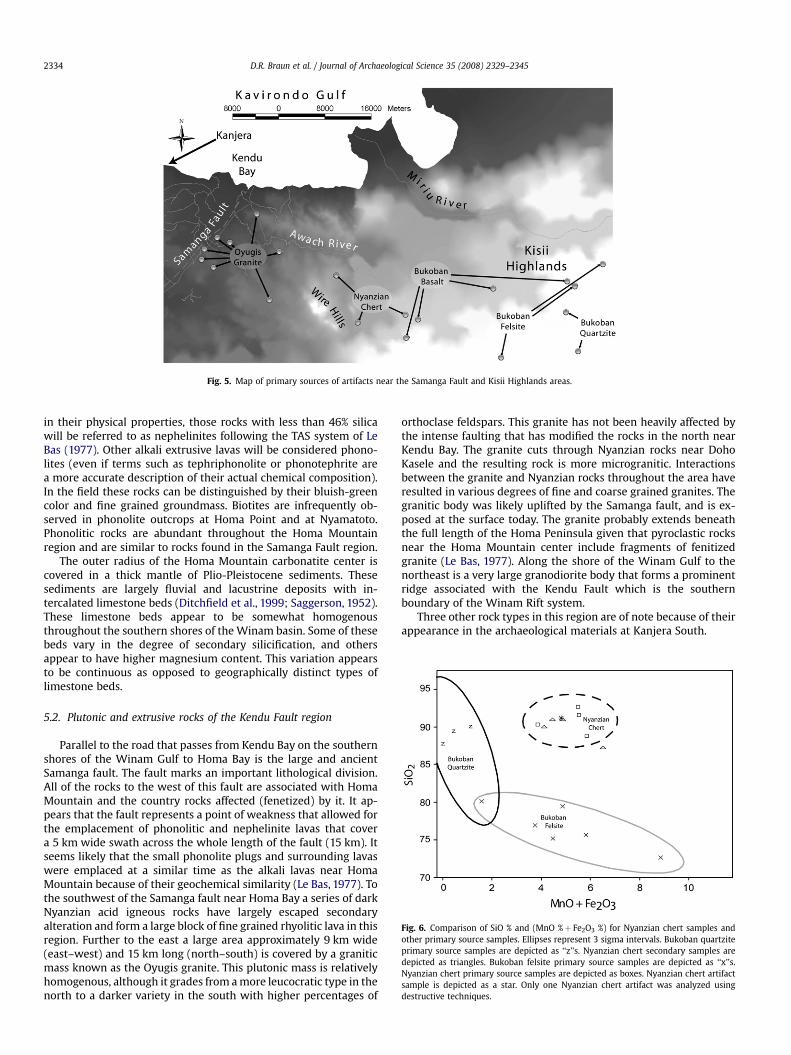
Fig. 5. Map of primary sources of artifacts near the Samanga Fault and Kisii Highlands areas.
Fig. 6. Comparison of SiO % and (MnO %þ Fe2O3 %) for Nyanzian chert samples andother primary source samples. Ellipses represent 3 sigma intervals. Bukoban quartziteprimary source samples are depicted as ‘‘z’’s. Nyanzian chert secondary samples aredepicted as triangles. Bukoban felsite primary source samples are depicted as ‘‘x’’s.Nyanzian chert primary source samples are depicted as boxes. Nyanzian chert artifactsample is depicted as a star. Only one Nyanzian chert artifact was analyzed usingdestructive techniques.
D.R. Braun et al. / Journal of Archaeological Science 35 (2008) 2329–23452334
in their physical properties, those rocks with less than 46% silicawill be referred to as nephelinites following the TAS system of LeBas (1977). Other alkali extrusive lavas will be considered phono-lites (even if terms such as tephriphonolite or phonotephrite area more accurate description of their actual chemical composition).In the field these rocks can be distinguished by their bluish-greencolor and fine grained groundmass. Biotites are infrequently ob-served in phonolite outcrops at Homa Point and at Nyamatoto.Phonolitic rocks are abundant throughout the Homa Mountainregion and are similar to rocks found in the Samanga Fault region.
The outer radius of the Homa Mountain carbonatite center iscovered in a thick mantle of Plio-Pleistocene sediments. Thesesediments are largely fluvial and lacustrine deposits with in-tercalated limestone beds (Ditchfield et al., 1999; Saggerson, 1952).These limestone beds appear to be somewhat homogenousthroughout the southern shores of the Winam basin. Some of thesebeds vary in the degree of secondary silicification, and othersappear to have higher magnesium content. This variation appearsto be continuous as opposed to geographically distinct types oflimestone beds.
5.2. Plutonic and extrusive rocks of the Kendu Fault region
Parallel to the road that passes from Kendu Bay on the southernshores of the Winam Gulf to Homa Bay is the large and ancientSamanga fault. The fault marks an important lithological division.All of the rocks to the west of this fault are associated with HomaMountain and the country rocks affected (fenetized) by it. It ap-pears that the fault represents a point of weakness that allowed forthe emplacement of phonolitic and nephelinite lavas that covera 5 km wide swath across the whole length of the fault (15 km). Itseems likely that the small phonolite plugs and surrounding lavaswere emplaced at a similar time as the alkali lavas near HomaMountain because of their geochemical similarity (Le Bas, 1977). Tothe southwest of the Samanga fault near Homa Bay a series of darkNyanzian acid igneous rocks have largely escaped secondaryalteration and form a large block of fine grained rhyolitic lava in thisregion. Further to the east a large area approximately 9 km wide(east–west) and 15 km long (north–south) is covered by a graniticmass known as the Oyugis granite. This plutonic mass is relativelyhomogenous, although it grades from a more leucocratic type in thenorth to a darker variety in the south with higher percentages of
orthoclase feldspars. This granite has not been heavily affected bythe intense faulting that has modified the rocks in the north nearKendu Bay. The granite cuts through Nyanzian rocks near DohoKasele and the resulting rock is more microgranitic. Interactionsbetween the granite and Nyanzian rocks throughout the area haveresulted in various degrees of fine and coarse grained granites. Thegranitic body was likely uplifted by the Samanga fault, and is ex-posed at the surface today. The granite probably extends beneaththe full length of the Homa Peninsula given that pyroclastic rocksnear the Homa Mountain center include fragments of fenitizedgranite (Le Bas, 1977). Along the shore of the Winam Gulf to thenortheast is a very large granodiorite body that forms a prominentridge associated with the Kendu Fault which is the southernboundary of the Winam Rift system.
Three other rock types in this region are of note because of theirappearance in the archaeological materials at Kanjera South.
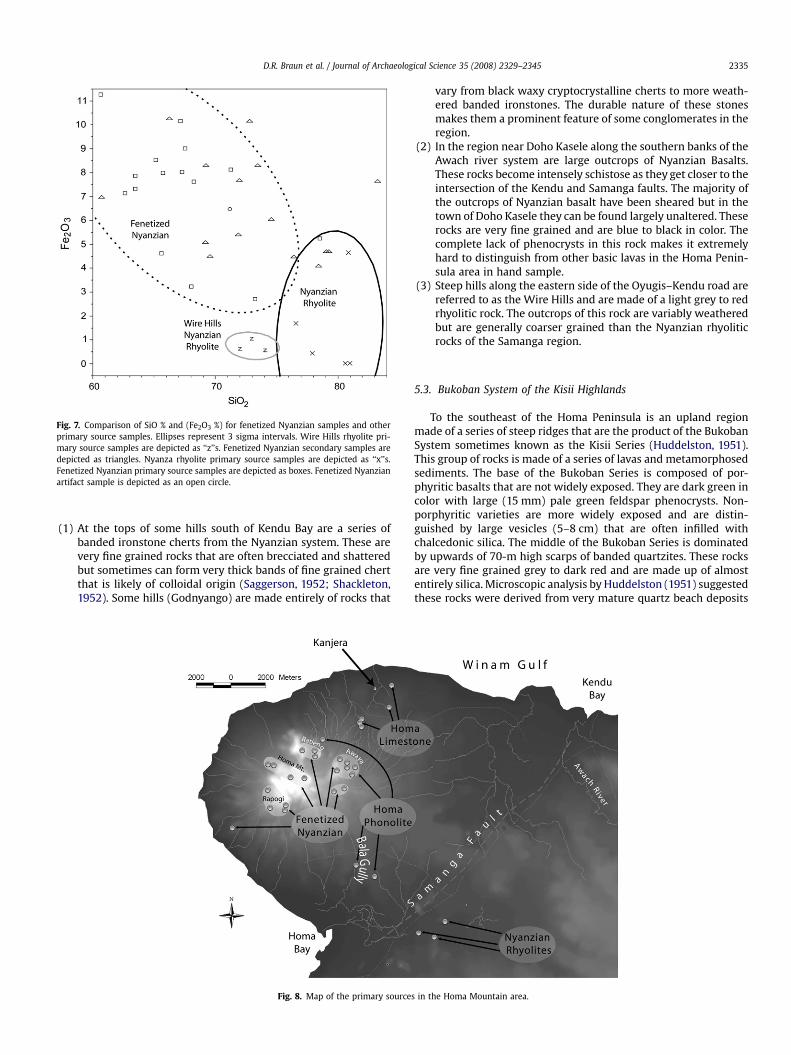
Fig. 7. Comparison of SiO % and (Fe2O3 %) for fenetized Nyanzian samples and otherprimary source samples. Ellipses represent 3 sigma intervals. Wire Hills rhyolite pri-mary source samples are depicted as ‘‘z’’s. Fenetized Nyanzian secondary samples aredepicted as triangles. Nyanza rhyolite primary source samples are depicted as ‘‘x’’s.Fenetized Nyanzian primary source samples are depicted as boxes. Fenetized Nyanzianartifact sample is depicted as an open circle.
D.R. Braun et al. / Journal of Archaeological Science 35 (2008) 2329–2345 2335
(1) At the tops of some hills south of Kendu Bay are a series ofbanded ironstone cherts from the Nyanzian system. These arevery fine grained rocks that are often brecciated and shatteredbut sometimes can form very thick bands of fine grained chertthat is likely of colloidal origin (Saggerson, 1952; Shackleton,1952). Some hills (Godnyango) are made entirely of rocks that
Fig. 8. Map of the primary source
vary from black waxy cryptocrystalline cherts to more weath-ered banded ironstones. The durable nature of these stonesmakes them a prominent feature of some conglomerates in theregion.
(2) In the region near Doho Kasele along the southern banks of theAwach river system are large outcrops of Nyanzian Basalts.These rocks become intensely schistose as they get closer to theintersection of the Kendu and Samanga faults. The majority ofthe outcrops of Nyanzian basalt have been sheared but in thetown of Doho Kasele they can be found largely unaltered. Theserocks are very fine grained and are blue to black in color. Thecomplete lack of phenocrysts in this rock makes it extremelyhard to distinguish from other basic lavas in the Homa Penin-sula area in hand sample.
(3) Steep hills along the eastern side of the Oyugis–Kendu road arereferred to as the Wire Hills and are made of a light grey to redrhyolitic rock. The outcrops of this rock are variably weatheredbut are generally coarser grained than the Nyanzian rhyoliticrocks of the Samanga region.
5.3. Bukoban System of the Kisii Highlands
To the southeast of the Homa Peninsula is an upland regionmade of a series of steep ridges that are the product of the BukobanSystem sometimes known as the Kisii Series (Huddelston, 1951).This group of rocks is made of a series of lavas and metamorphosedsediments. The base of the Bukoban Series is composed of por-phyritic basalts that are not widely exposed. They are dark green incolor with large (15 mm) pale green feldspar phenocrysts. Non-porphyritic varieties are more widely exposed and are distin-guished by large vesicles (5–8 cm) that are often infilled withchalcedonic silica. The middle of the Bukoban Series is dominatedby upwards of 70-m high scarps of banded quartzites. These rocksare very fine grained grey to dark red and are made up of almostentirely silica. Microscopic analysis by Huddelston (1951) suggestedthese rocks were derived from very mature quartz beach deposits
s in the Homa Mountain area.
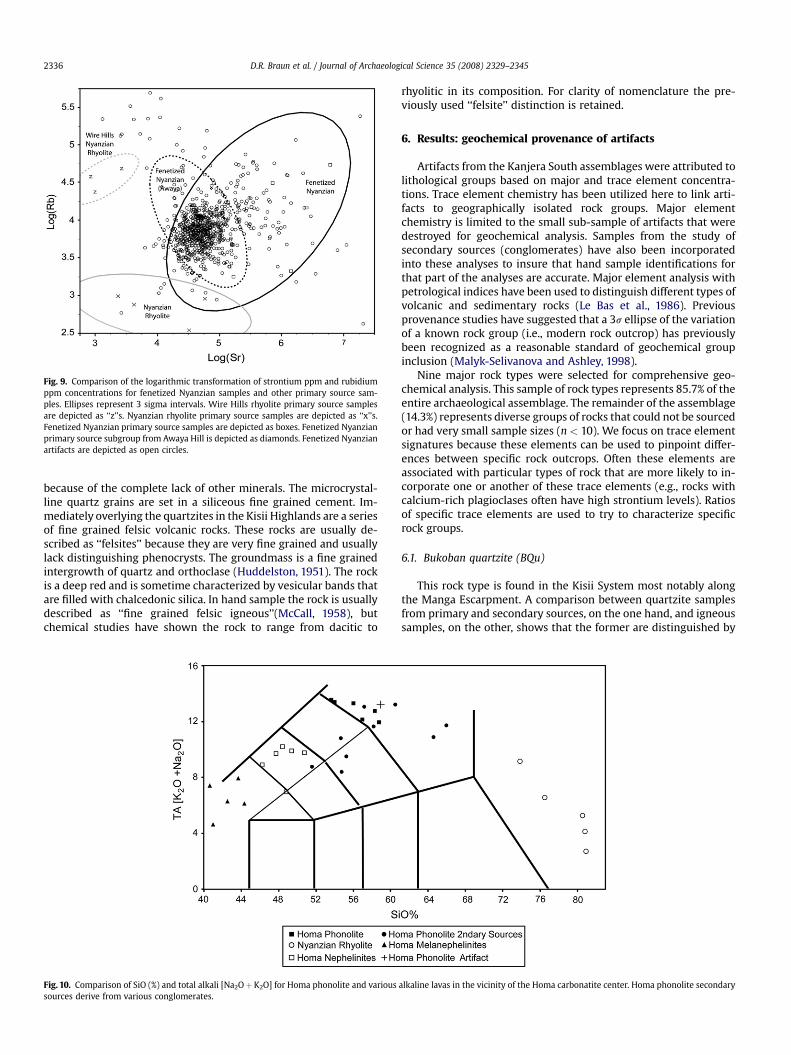
Fig. 9. Comparison of the logarithmic transformation of strontium ppm and rubidiumppm concentrations for fenetized Nyanzian samples and other primary source sam-ples. Ellipses represent 3 sigma intervals. Wire Hills rhyolite primary source samplesare depicted as ‘‘z’’s. Nyanzian rhyolite primary source samples are depicted as ‘‘x’’s.Fenetized Nyanzian primary source samples are depicted as boxes. Fenetized Nyanzianprimary source subgroup from Awaya Hill is depicted as diamonds. Fenetized Nyanzianartifacts are depicted as open circles.
D.R. Braun et al. / Journal of Archaeological Science 35 (2008) 2329–23452336
because of the complete lack of other minerals. The microcrystal-line quartz grains are set in a siliceous fine grained cement. Im-mediately overlying the quartzites in the Kisii Highlands are a seriesof fine grained felsic volcanic rocks. These rocks are usually de-scribed as ‘‘felsites’’ because they are very fine grained and usuallylack distinguishing phenocrysts. The groundmass is a fine grainedintergrowth of quartz and orthoclase (Huddelston, 1951). The rockis a deep red and is sometime characterized by vesicular bands thatare filled with chalcedonic silica. In hand sample the rock is usuallydescribed as ‘‘fine grained felsic igneous’’(McCall, 1958), butchemical studies have shown the rock to range from dacitic to
Fig. 10. Comparison of SiO (%) and total alkali [Na2Oþ K2O] for Homa phonolite and varioussources derive from various conglomerates.
rhyolitic in its composition. For clarity of nomenclature the pre-viously used ‘‘felsite’’ distinction is retained.
6. Results: geochemical provenance of artifacts
Artifacts from the Kanjera South assemblages were attributed tolithological groups based on major and trace element concentra-tions. Trace element chemistry has been utilized here to link arti-facts to geographically isolated rock groups. Major elementchemistry is limited to the small sub-sample of artifacts that weredestroyed for geochemical analysis. Samples from the study ofsecondary sources (conglomerates) have also been incorporatedinto these analyses to insure that hand sample identifications forthat part of the analyses are accurate. Major element analysis withpetrological indices have been used to distinguish different types ofvolcanic and sedimentary rocks (Le Bas et al., 1986). Previousprovenance studies have suggested that a 3s ellipse of the variationof a known rock group (i.e., modern rock outcrop) has previouslybeen recognized as a reasonable standard of geochemical groupinclusion (Malyk-Selivanova and Ashley, 1998).
Nine major rock types were selected for comprehensive geo-chemical analysis. This sample of rock types represents 85.7% of theentire archaeological assemblage. The remainder of the assemblage(14.3%) represents diverse groups of rocks that could not be sourcedor had very small sample sizes (n < 10). We focus on trace elementsignatures because these elements can be used to pinpoint differ-ences between specific rock outcrops. Often these elements areassociated with particular types of rock that are more likely to in-corporate one or another of these trace elements (e.g., rocks withcalcium-rich plagioclases often have high strontium levels). Ratiosof specific trace elements are used to try to characterize specificrock groups.
6.1. Bukoban quartzite (BQu)
This rock type is found in the Kisii System most notably alongthe Manga Escarpment. A comparison between quartzite samplesfrom primary and secondary sources, on the one hand, and igneoussamples, on the other, shows that the former are distinguished by
alkaline lavas in the vicinity of the Homa carbonatite center. Homa phonolite secondary
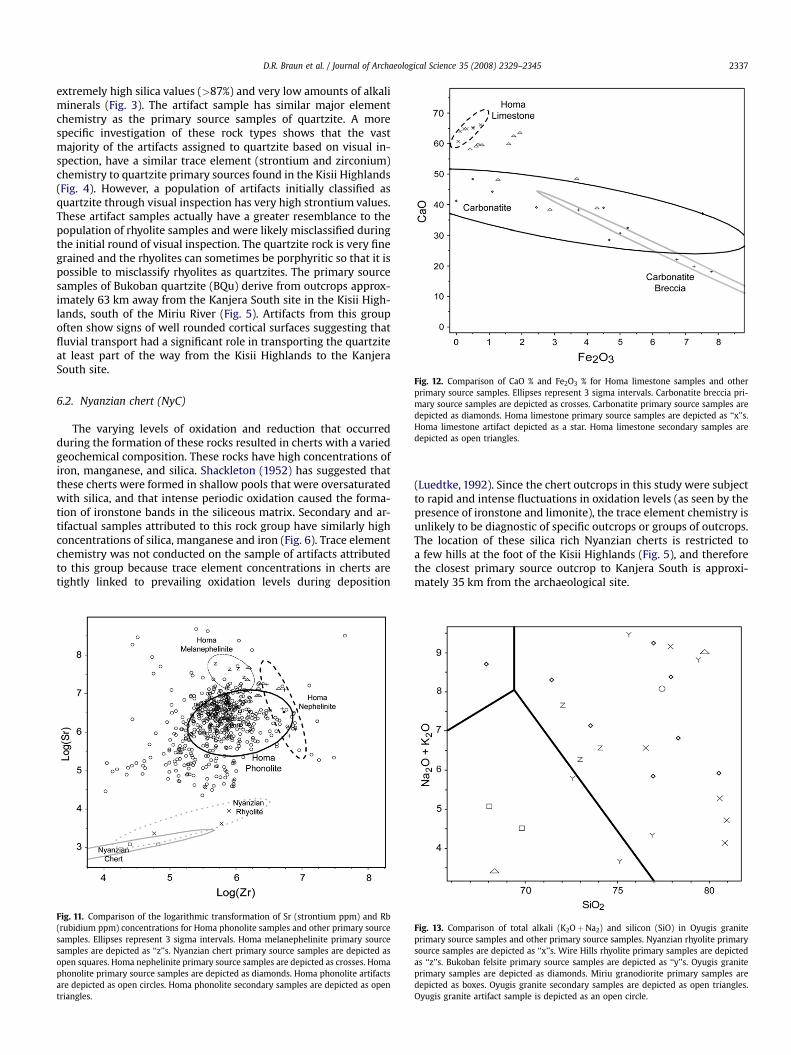
Fig. 12. Comparison of CaO % and Fe2O3 % for Homa limestone samples and otherprimary source samples. Ellipses represent 3 sigma intervals. Carbonatite breccia pri-mary source samples are depicted as crosses. Carbonatite primary source samples aredepicted as diamonds. Homa limestone primary source samples are depicted as ‘‘x’’s.Homa limestone artifact depicted as a star. Homa limestone secondary samples aredepicted as open triangles.
D.R. Braun et al. / Journal of Archaeological Science 35 (2008) 2329–2345 2337
extremely high silica values (>87%) and very low amounts of alkaliminerals (Fig. 3). The artifact sample has similar major elementchemistry as the primary source samples of quartzite. A morespecific investigation of these rock types shows that the vastmajority of the artifacts assigned to quartzite based on visual in-spection, have a similar trace element (strontium and zirconium)chemistry to quartzite primary sources found in the Kisii Highlands(Fig. 4). However, a population of artifacts initially classified asquartzite through visual inspection has very high strontium values.These artifact samples actually have a greater resemblance to thepopulation of rhyolite samples and were likely misclassified duringthe initial round of visual inspection. The quartzite rock is very finegrained and the rhyolites can sometimes be porphyritic so that it ispossible to misclassify rhyolites as quartzites. The primary sourcesamples of Bukoban quartzite (BQu) derive from outcrops approx-imately 63 km away from the Kanjera South site in the Kisii High-lands, south of the Miriu River (Fig. 5). Artifacts from this groupoften show signs of well rounded cortical surfaces suggesting thatfluvial transport had a significant role in transporting the quartziteat least part of the way from the Kisii Highlands to the KanjeraSouth site.
6.2. Nyanzian chert (NyC)
The varying levels of oxidation and reduction that occurredduring the formation of these rocks resulted in cherts with a variedgeochemical composition. These rocks have high concentrations ofiron, manganese, and silica. Shackleton (1952) has suggested thatthese cherts were formed in shallow pools that were oversaturatedwith silica, and that intense periodic oxidation caused the forma-tion of ironstone bands in the siliceous matrix. Secondary and ar-tifactual samples attributed to this rock group have similarly highconcentrations of silica, manganese and iron (Fig. 6). Trace elementchemistry was not conducted on the sample of artifacts attributedto this group because trace element concentrations in cherts aretightly linked to prevailing oxidation levels during deposition
Fig. 11. Comparison of the logarithmic transformation of Sr (strontium ppm) and Rb(rubidium ppm) concentrations for Homa phonolite samples and other primary sourcesamples. Ellipses represent 3 sigma intervals. Homa melanephelinite primary sourcesamples are depicted as ‘‘z’’s. Nyanzian chert primary source samples are depicted asopen squares. Homa nephelinite primary source samples are depicted as crosses. Homaphonolite primary source samples are depicted as diamonds. Homa phonolite artifactsare depicted as open circles. Homa phonolite secondary samples are depicted as opentriangles.
(Luedtke, 1992). Since the chert outcrops in this study were subjectto rapid and intense fluctuations in oxidation levels (as seen by thepresence of ironstone and limonite), the trace element chemistry isunlikely to be diagnostic of specific outcrops or groups of outcrops.The location of these silica rich Nyanzian cherts is restricted toa few hills at the foot of the Kisii Highlands (Fig. 5), and thereforethe closest primary source outcrop to Kanjera South is approxi-mately 35 km from the archaeological site.
Fig. 13. Comparison of total alkali (K2OþNa2) and silicon (SiO) in Oyugis graniteprimary source samples and other primary source samples. Nyanzian rhyolite primarysource samples are depicted as ‘‘x’’s. Wire Hills rhyolite primary samples are depictedas ‘‘z’’s. Bukoban felsite primary source samples are depicted as ‘‘y’’s. Oyugis graniteprimary samples are depicted as diamonds. Miriu granodiorite primary samples aredepicted as boxes. Oyugis granite secondary samples are depicted as open triangles.Oyugis granite artifact sample is depicted as an open circle.
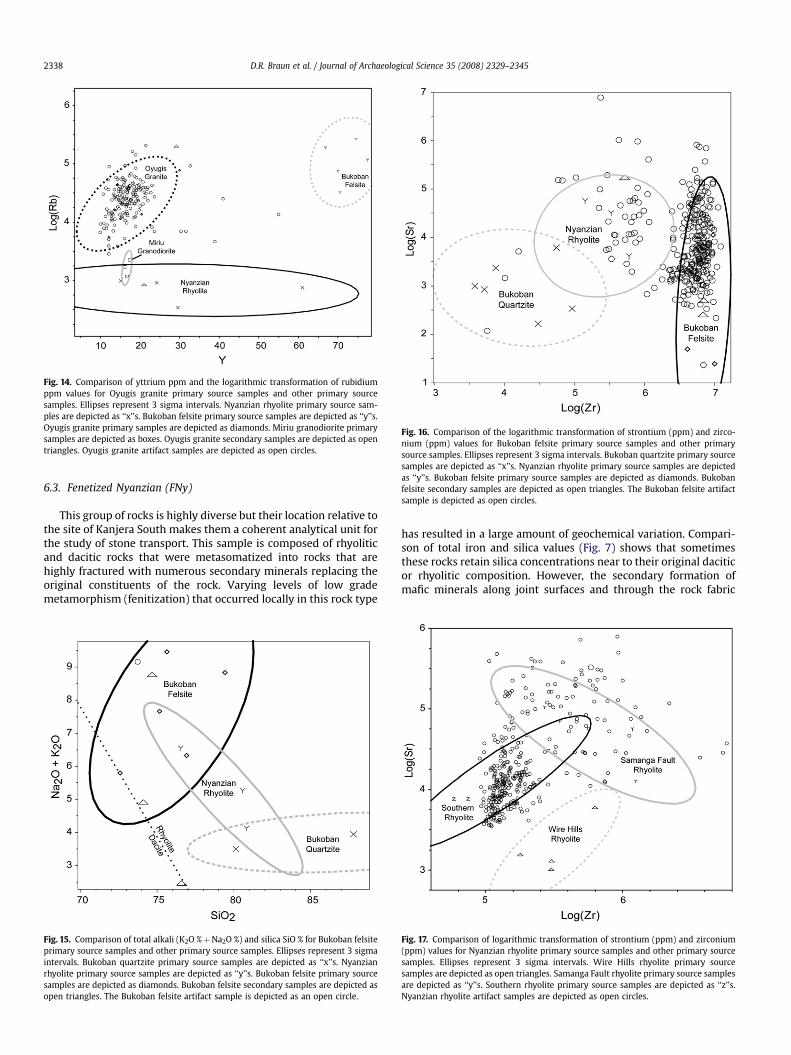
Fig. 16. Comparison of the logarithmic transformation of strontium (ppm) and zirco-nium (ppm) values for Bukoban felsite primary source samples and other primarysource samples. Ellipses represent 3 sigma intervals. Bukoban quartzite primary sourcesamples are depicted as ‘‘x’’s. Nyanzian rhyolite primary source samples are depictedas ‘‘y’’s. Bukoban felsite primary source samples are depicted as diamonds. Bukobanfelsite secondary samples are depicted as open triangles. The Bukoban felsite artifactsample is depicted as open circles.
Fig. 14. Comparison of yttrium ppm and the logarithmic transformation of rubidiumppm values for Oyugis granite primary source samples and other primary sourcesamples. Ellipses represent 3 sigma intervals. Nyanzian rhyolite primary source sam-ples are depicted as ‘‘x’’s. Bukoban felsite primary source samples are depicted as ‘‘y’’s.Oyugis granite primary samples are depicted as diamonds. Miriu granodiorite primarysamples are depicted as boxes. Oyugis granite secondary samples are depicted as opentriangles. Oyugis granite artifact samples are depicted as open circles.
D.R. Braun et al. / Journal of Archaeological Science 35 (2008) 2329–23452338
6.3. Fenetized Nyanzian (FNy)
This group of rocks is highly diverse but their location relative tothe site of Kanjera South makes them a coherent analytical unit forthe study of stone transport. This sample is composed of rhyoliticand dacitic rocks that were metasomatized into rocks that arehighly fractured with numerous secondary minerals replacing theoriginal constituents of the rock. Varying levels of low grademetamorphism (fenitization) that occurred locally in this rock type
Fig. 15. Comparison of total alkali (K2O %þNa2O %) and silica SiO % for Bukoban felsiteprimary source samples and other primary source samples. Ellipses represent 3 sigmaintervals. Bukoban quartzite primary source samples are depicted as ‘‘x’’s. Nyanzianrhyolite primary source samples are depicted as ‘‘y’’s. Bukoban felsite primary sourcesamples are depicted as diamonds. Bukoban felsite secondary samples are depicted asopen triangles. The Bukoban felsite artifact sample is depicted as an open circle.
has resulted in a large amount of geochemical variation. Compari-son of total iron and silica values (Fig. 7) shows that sometimesthese rocks retain silica concentrations near to their original daciticor rhyolitic composition. However, the secondary formation ofmafic minerals along joint surfaces and through the rock fabric
Fig. 17. Comparison of logarithmic transformation of strontium (ppm) and zirconium(ppm) values for Nyanzian rhyolite primary source samples and other primary sourcesamples. Ellipses represent 3 sigma intervals. Wire Hills rhyolite primary sourcesamples are depicted as open triangles. Samanga Fault rhyolite primary source samplesare depicted as ‘‘y’’s. Southern rhyolite primary source samples are depicted as ‘‘z’’s.Nyanzian rhyolite artifact samples are depicted as open circles.
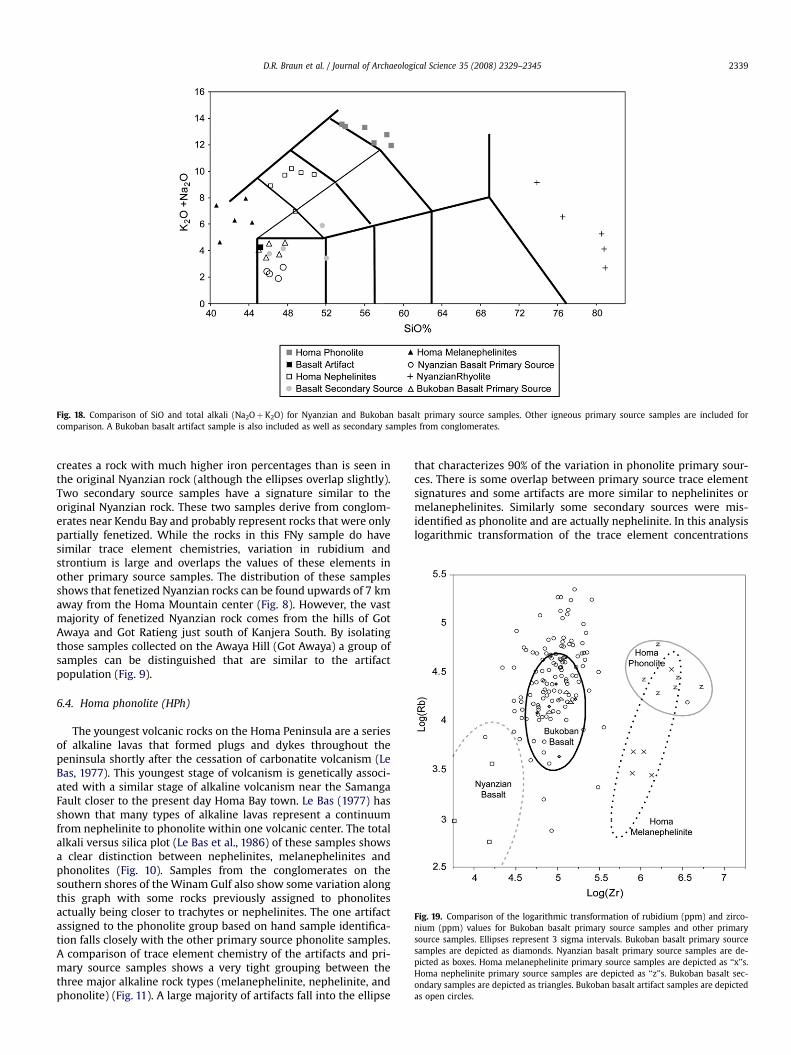
Fig. 18. Comparison of SiO and total alkali (Na2Oþ K2O) for Nyanzian and Bukoban basalt primary source samples. Other igneous primary source samples are included forcomparison. A Bukoban basalt artifact sample is also included as well as secondary samples from conglomerates.
Fig. 19. Comparison of the logarithmic transformation of rubidium (ppm) and zirco-nium (ppm) values for Bukoban basalt primary source samples and other primarysource samples. Ellipses represent 3 sigma intervals. Bukoban basalt primary sourcesamples are depicted as diamonds. Nyanzian basalt primary source samples are de-picted as boxes. Homa melanephelinite primary source samples are depicted as ‘‘x’’s.Homa nephelinite primary source samples are depicted as ‘‘z’’s. Bukoban basalt sec-ondary samples are depicted as triangles. Bukoban basalt artifact samples are depictedas open circles.
D.R. Braun et al. / Journal of Archaeological Science 35 (2008) 2329–2345 2339
creates a rock with much higher iron percentages than is seen inthe original Nyanzian rock (although the ellipses overlap slightly).Two secondary source samples have a signature similar to theoriginal Nyanzian rock. These two samples derive from conglom-erates near Kendu Bay and probably represent rocks that were onlypartially fenetized. While the rocks in this FNy sample do havesimilar trace element chemistries, variation in rubidium andstrontium is large and overlaps the values of these elements inother primary source samples. The distribution of these samplesshows that fenetized Nyanzian rocks can be found upwards of 7 kmaway from the Homa Mountain center (Fig. 8). However, the vastmajority of fenetized Nyanzian rock comes from the hills of GotAwaya and Got Ratieng just south of Kanjera South. By isolatingthose samples collected on the Awaya Hill (Got Awaya) a group ofsamples can be distinguished that are similar to the artifactpopulation (Fig. 9).
6.4. Homa phonolite (HPh)
The youngest volcanic rocks on the Homa Peninsula are a seriesof alkaline lavas that formed plugs and dykes throughout thepeninsula shortly after the cessation of carbonatite volcanism (LeBas, 1977). This youngest stage of volcanism is genetically associ-ated with a similar stage of alkaline volcanism near the SamangaFault closer to the present day Homa Bay town. Le Bas (1977) hasshown that many types of alkaline lavas represent a continuumfrom nephelinite to phonolite within one volcanic center. The totalalkali versus silica plot (Le Bas et al., 1986) of these samples showsa clear distinction between nephelinites, melanephelinites andphonolites (Fig. 10). Samples from the conglomerates on thesouthern shores of the Winam Gulf also show some variation alongthis graph with some rocks previously assigned to phonolitesactually being closer to trachytes or nephelinites. The one artifactassigned to the phonolite group based on hand sample identifica-tion falls closely with the other primary source phonolite samples.A comparison of trace element chemistry of the artifacts and pri-mary source samples shows a very tight grouping between thethree major alkaline rock types (melanephelinite, nephelinite, andphonolite) (Fig. 11). A large majority of artifacts fall into the ellipse
that characterizes 90% of the variation in phonolite primary sour-ces. There is some overlap between primary source trace elementsignatures and some artifacts are more similar to nephelinites ormelanephelinites. Similarly some secondary sources were mis-identified as phonolite and are actually nephelinite. In this analysislogarithmic transformation of the trace element concentrations
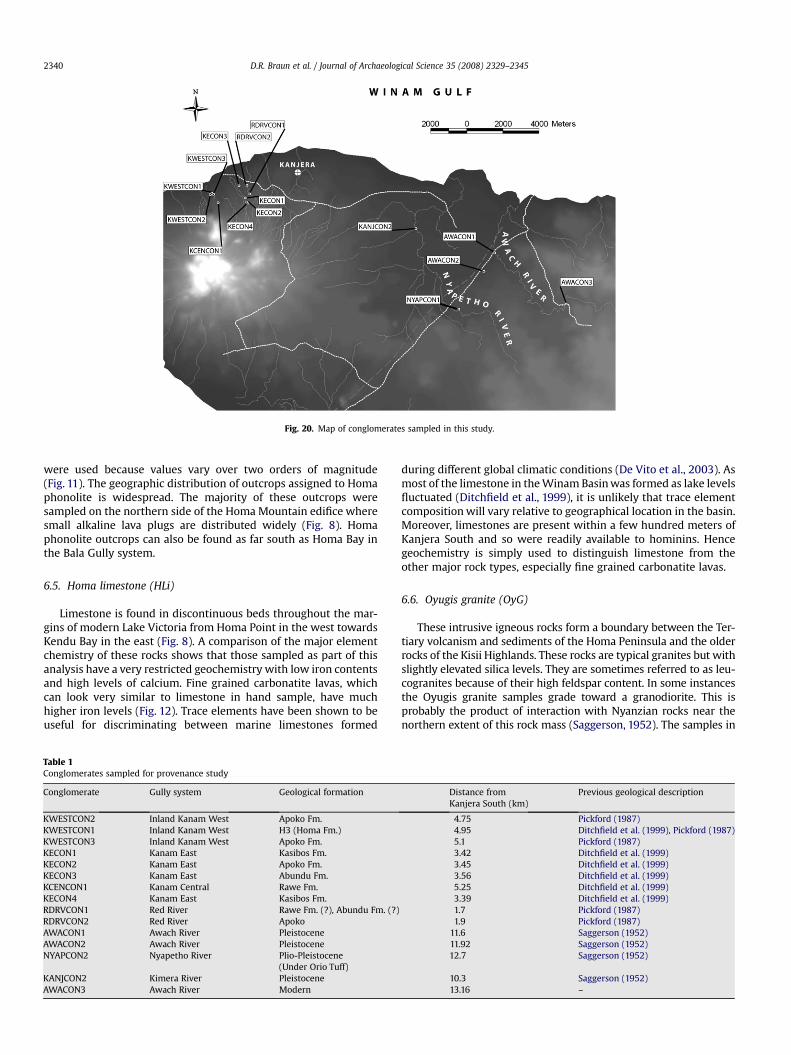
Fig. 20. Map of conglomerates sampled in this study.
D.R. Braun et al. / Journal of Archaeological Science 35 (2008) 2329–23452340
were used because values vary over two orders of magnitude(Fig. 11). The geographic distribution of outcrops assigned to Homaphonolite is widespread. The majority of these outcrops weresampled on the northern side of the Homa Mountain edifice wheresmall alkaline lava plugs are distributed widely (Fig. 8). Homaphonolite outcrops can also be found as far south as Homa Bay inthe Bala Gully system.
6.5. Homa limestone (HLi)
Limestone is found in discontinuous beds throughout the mar-gins of modern Lake Victoria from Homa Point in the west towardsKendu Bay in the east (Fig. 8). A comparison of the major elementchemistry of these rocks shows that those sampled as part of thisanalysis have a very restricted geochemistry with low iron contentsand high levels of calcium. Fine grained carbonatite lavas, whichcan look very similar to limestone in hand sample, have muchhigher iron levels (Fig. 12). Trace elements have been shown to beuseful for discriminating between marine limestones formed
Table 1Conglomerates sampled for provenance study
Conglomerate Gully system Geological formation
KWESTCON2 Inland Kanam West Apoko Fm.KWESTCON1 Inland Kanam West H3 (Homa Fm.)KWESTCON3 Inland Kanam West Apoko Fm.KECON1 Kanam East Kasibos Fm.KECON2 Kanam East Apoko Fm.KECON3 Kanam East Abundu Fm.KCENCON1 Kanam Central Rawe Fm.KECON4 Kanam East Kasibos Fm.RDRVCON1 Red River Rawe Fm. (?), Abundu Fm. (?)RDRVCON2 Red River ApokoAWACON1 Awach River PleistoceneAWACON2 Awach River PleistoceneNYAPCON2 Nyapetho River Plio-Pleistocene
(Under Orio Tuff)KANJCON2 Kimera River PleistoceneAWACON3 Awach River Modern
during different global climatic conditions (De Vito et al., 2003). Asmost of the limestone in the Winam Basin was formed as lake levelsfluctuated (Ditchfield et al., 1999), it is unlikely that trace elementcomposition will vary relative to geographical location in the basin.Moreover, limestones are present within a few hundred meters ofKanjera South and so were readily available to hominins. Hencegeochemistry is simply used to distinguish limestone from theother major rock types, especially fine grained carbonatite lavas.
6.6. Oyugis granite (OyG)
These intrusive igneous rocks form a boundary between the Ter-tiary volcanism and sediments of the Homa Peninsula and the olderrocks of the Kisii Highlands. These rocks are typical granites but withslightly elevated silica levels. They are sometimes referred to as leu-cogranites because of their high feldspar content. In some instancesthe Oyugis granite samples grade toward a granodiorite. This isprobably the product of interaction with Nyanzian rocks near thenorthern extent of this rock mass (Saggerson, 1952). The samples in
Distance fromKanjera South (km)
Previous geological description
4.75 Pickford (1987)4.95 Ditchfield et al. (1999), Pickford (1987)5.1 Pickford (1987)3.42 Ditchfield et al. (1999)3.45 Ditchfield et al. (1999)3.56 Ditchfield et al. (1999)5.25 Ditchfield et al. (1999)3.39 Ditchfield et al. (1999)1.7 Pickford (1987)1.9 Pickford (1987)
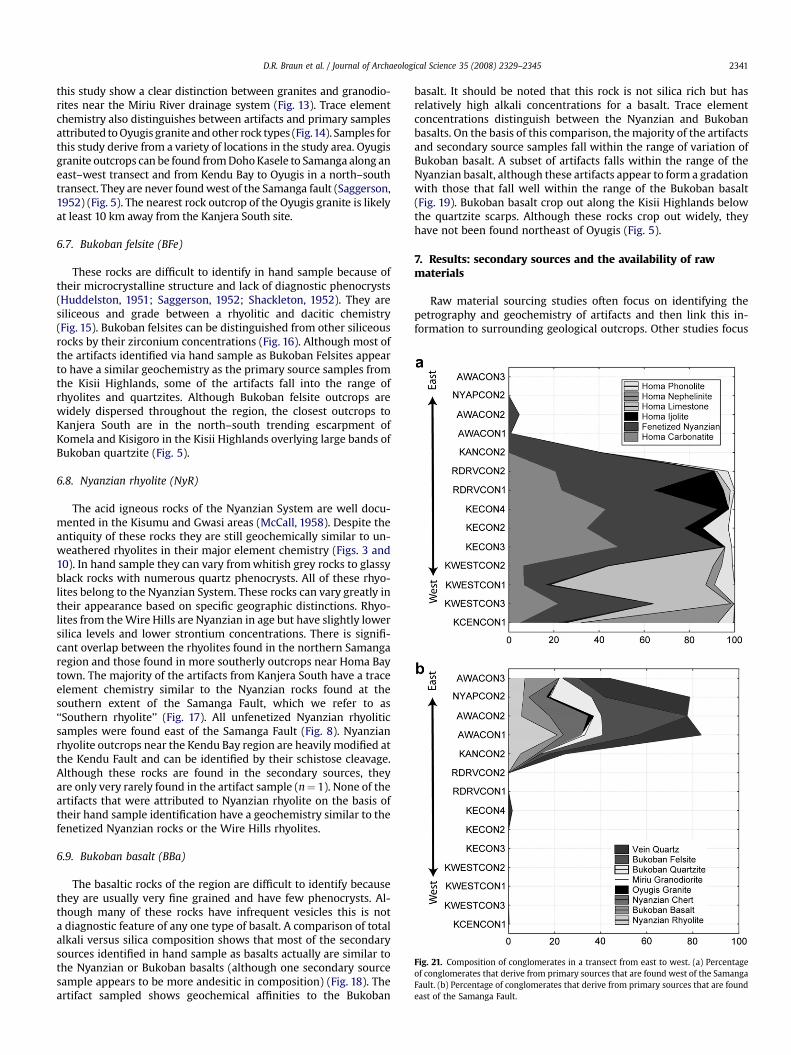
Fig. 21. Composition of conglomerates in a transect from east to west. (a) Percentageof conglomerates that derive from primary sources that are found west of the SamangaFault. (b) Percentage of conglomerates that derive from primary sources that are foundeast of the Samanga Fault.
D.R. Braun et al. / Journal of Archaeological Science 35 (2008) 2329–2345 2341
this study show a clear distinction between granites and granodio-rites near the Miriu River drainage system (Fig. 13). Trace elementchemistry also distinguishes between artifacts and primary samplesattributed to Oyugis granite and other rock types (Fig.14). Samples forthis study derive from a variety of locations in the study area. Oyugisgranite outcrops can be found from Doho Kasele to Samanga along aneast–west transect and from Kendu Bay to Oyugis in a north–southtransect. They are never found west of the Samanga fault (Saggerson,1952) (Fig. 5). The nearest rock outcrop of the Oyugis granite is likelyat least 10 km away from the Kanjera South site.
6.7. Bukoban felsite (BFe)
These rocks are difficult to identify in hand sample because oftheir microcrystalline structure and lack of diagnostic phenocrysts(Huddelston, 1951; Saggerson, 1952; Shackleton, 1952). They aresiliceous and grade between a rhyolitic and dacitic chemistry(Fig. 15). Bukoban felsites can be distinguished from other siliceousrocks by their zirconium concentrations (Fig. 16). Although most ofthe artifacts identified via hand sample as Bukoban Felsites appearto have a similar geochemistry as the primary source samples fromthe Kisii Highlands, some of the artifacts fall into the range ofrhyolites and quartzites. Although Bukoban felsite outcrops arewidely dispersed throughout the region, the closest outcrops toKanjera South are in the north–south trending escarpment ofKomela and Kisigoro in the Kisii Highlands overlying large bands ofBukoban quartzite (Fig. 5).
6.8. Nyanzian rhyolite (NyR)
The acid igneous rocks of the Nyanzian System are well docu-mented in the Kisumu and Gwasi areas (McCall, 1958). Despite theantiquity of these rocks they are still geochemically similar to un-weathered rhyolites in their major element chemistry (Figs. 3 and10). In hand sample they can vary from whitish grey rocks to glassyblack rocks with numerous quartz phenocrysts. All of these rhyo-lites belong to the Nyanzian System. These rocks can vary greatly intheir appearance based on specific geographic distinctions. Rhyo-lites from the Wire Hills are Nyanzian in age but have slightly lowersilica levels and lower strontium concentrations. There is signifi-cant overlap between the rhyolites found in the northern Samangaregion and those found in more southerly outcrops near Homa Baytown. The majority of the artifacts from Kanjera South have a traceelement chemistry similar to the Nyanzian rocks found at thesouthern extent of the Samanga Fault, which we refer to as‘‘Southern rhyolite’’ (Fig. 17). All unfenetized Nyanzian rhyoliticsamples were found east of the Samanga Fault (Fig. 8). Nyanzianrhyolite outcrops near the Kendu Bay region are heavily modified atthe Kendu Fault and can be identified by their schistose cleavage.Although these rocks are found in the secondary sources, theyare only very rarely found in the artifact sample (n¼ 1). None of theartifacts that were attributed to Nyanzian rhyolite on the basis oftheir hand sample identification have a geochemistry similar to thefenetized Nyanzian rocks or the Wire Hills rhyolites.
6.9. Bukoban basalt (BBa)
The basaltic rocks of the region are difficult to identify becausethey are usually very fine grained and have few phenocrysts. Al-though many of these rocks have infrequent vesicles this is nota diagnostic feature of any one type of basalt. A comparison of totalalkali versus silica composition shows that most of the secondarysources identified in hand sample as basalts actually are similar tothe Nyanzian or Bukoban basalts (although one secondary sourcesample appears to be more andesitic in composition) (Fig. 18). Theartifact sampled shows geochemical affinities to the Bukoban
basalt. It should be noted that this rock is not silica rich but hasrelatively high alkali concentrations for a basalt. Trace elementconcentrations distinguish between the Nyanzian and Bukobanbasalts. On the basis of this comparison, the majority of the artifactsand secondary source samples fall within the range of variation ofBukoban basalt. A subset of artifacts falls within the range of theNyanzian basalt, although these artifacts appear to form a gradationwith those that fall well within the range of the Bukoban basalt(Fig. 19). Bukoban basalt crop out along the Kisii Highlands belowthe quartzite scarps. Although these rocks crop out widely, theyhave not been found northeast of Oyugis (Fig. 5).
7. Results: secondary sources and the availability of rawmaterials
Raw material sourcing studies often focus on identifying thepetrography and geochemistry of artifacts and then link this in-formation to surrounding geological outcrops. Other studies focus
D.R. Braun et al. / Journal of Archaeological Science 35 (2008) 2329–23452342
on one source area and determine the movement of that one rocktype to various regions (Bamforth, 1992; Church, 1994). To un-derstand aspects of raw material variation and availability in a waythat allows the testing of hypotheses about artifact manufactureand transport requires the attribution of artifacts to rock outcropsand the documentation of raw material availability across thelandscape utilized by the tool makers.
This study investigated ancient conglomerates to developa model of cobble transport by major river systems along thesouthern part of the Winam Basin with the goal of understandingraw material selection and transport patterns by hominins atKanjera South. A large number of artifacts are derived from primarysources that crop out up to 60 km away from the Kanjera Southlocality. Hence, the conglomerate sampling strategy focused ondetermining the presence of rock types derived from these distantprimary sources. To carry out this strategy, 500 stones were col-lected from each of 15 conglomerates along the southern shores ofthe Winam Gulf. All 500 of these stones were identified to rawmaterial category based on visual inspection. A subset of each ofthese rock groups was subsequently analyzed using XRF methodsto determine the accuracy of visual inspection characterizations.The 15 conglomerates were sampled from Neogene sediments ex-posed in erosional gully systems along the southern shores of theWinam Gulf (Fig. 20). These conglomerates were selected based ontheir distance from the Kanjera South locality and/or becauseprevious studies had documented a stratigraphic correlation be-tween these sediments and the Kanjera Formation (Ditchfield et al.,1999; Ditchfield et al., in press). The sample names of conglomer-ates and their geological affiliation can be found in Table 1. Theseconglomerates range in age from Late Miocene through LatePleistocene (Ditchfield et al., 1999; Pickford,1987; Saggerson, 1952).The long time span they sample and their lithologic compositionindicates the availability of the different major rock types across theregion and through the evolution of the drainage systems. Fig. 21displays the percentages of rock types found in conglomeratesalong an east–west transect. It is clear that rock types that haveprimary sources west of the Samanga Fault are completely absent inconglomerates that are found near the Kanjera South locality. Onlyconglomerates found east of the Samanga Fault have any clasts
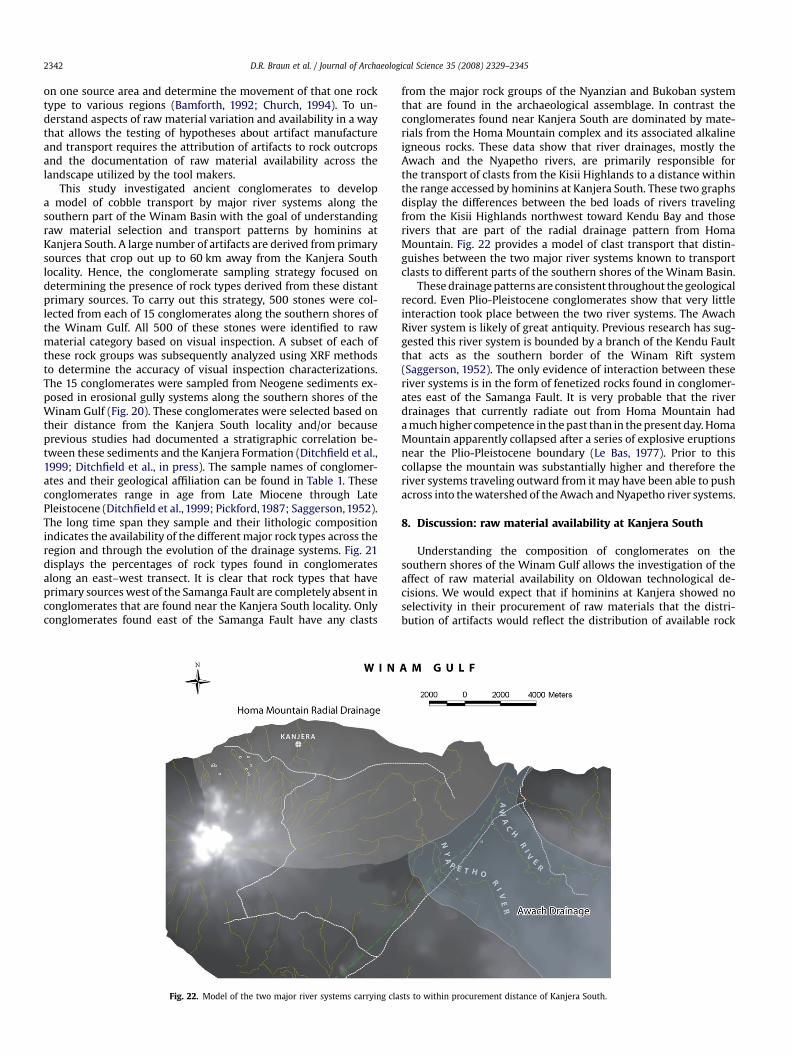
Fig. 22. Model of the two major river systems carrying cla
from the major rock groups of the Nyanzian and Bukoban systemthat are found in the archaeological assemblage. In contrast theconglomerates found near Kanjera South are dominated by mate-rials from the Homa Mountain complex and its associated alkalineigneous rocks. These data show that river drainages, mostly theAwach and the Nyapetho rivers, are primarily responsible forthe transport of clasts from the Kisii Highlands to a distance withinthe range accessed by hominins at Kanjera South. These two graphsdisplay the differences between the bed loads of rivers travelingfrom the Kisii Highlands northwest toward Kendu Bay and thoserivers that are part of the radial drainage pattern from HomaMountain. Fig. 22 provides a model of clast transport that distin-guishes between the two major river systems known to transportclasts to different parts of the southern shores of the Winam Basin.
These drainage patterns are consistent throughout the geologicalrecord. Even Plio-Pleistocene conglomerates show that very littleinteraction took place between the two river systems. The AwachRiver system is likely of great antiquity. Previous research has sug-gested this river system is bounded by a branch of the Kendu Faultthat acts as the southern border of the Winam Rift system(Saggerson, 1952). The only evidence of interaction between theseriver systems is in the form of fenetized rocks found in conglomer-ates east of the Samanga Fault. It is very probable that the riverdrainages that currently radiate out from Homa Mountain hada much higher competence in the past than in the present day. HomaMountain apparently collapsed after a series of explosive eruptionsnear the Plio-Pleistocene boundary (Le Bas, 1977). Prior to thiscollapse the mountain was substantially higher and therefore theriver systems traveling outward from it may have been able to pushacross into the watershed of the Awach and Nyapetho river systems.
8. Discussion: raw material availability at Kanjera South
Understanding the composition of conglomerates on thesouthern shores of the Winam Gulf allows the investigation of theaffect of raw material availability on Oldowan technological de-cisions. We would expect that if hominins at Kanjera showed noselectivity in their procurement of raw materials that the distri-bution of artifacts would reflect the distribution of available rock
sts to within procurement distance of Kanjera South.
D.R. Braun et al. / Journal of Archaeological Science 35 (2008) 2329–2345 2343
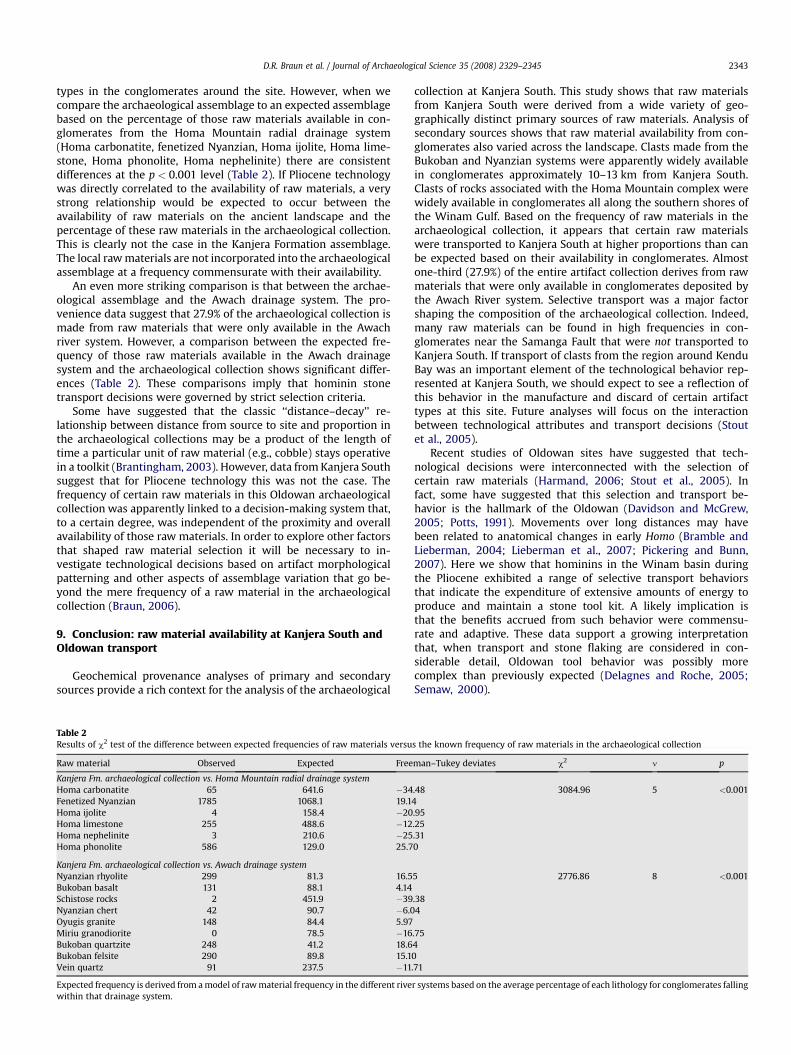
types in the conglomerates around the site. However, when wecompare the archaeological assemblage to an expected assemblagebased on the percentage of those raw materials available in con-glomerates from the Homa Mountain radial drainage system(Homa carbonatite, fenetized Nyanzian, Homa ijolite, Homa lime-stone, Homa phonolite, Homa nephelinite) there are consistentdifferences at the p < 0.001 level (Table 2). If Pliocene technologywas directly correlated to the availability of raw materials, a verystrong relationship would be expected to occur between theavailability of raw materials on the ancient landscape and thepercentage of these raw materials in the archaeological collection.This is clearly not the case in the Kanjera Formation assemblage.The local raw materials are not incorporated into the archaeologicalassemblage at a frequency commensurate with their availability.
An even more striking comparison is that between the archae-ological assemblage and the Awach drainage system. The pro-venience data suggest that 27.9% of the archaeological collection ismade from raw materials that were only available in the Awachriver system. However, a comparison between the expected fre-quency of those raw materials available in the Awach drainagesystem and the archaeological collection shows significant differ-ences (Table 2). These comparisons imply that hominin stonetransport decisions were governed by strict selection criteria.
Some have suggested that the classic ‘‘distance–decay’’ re-lationship between distance from source to site and proportion inthe archaeological collections may be a product of the length oftime a particular unit of raw material (e.g., cobble) stays operativein a toolkit (Brantingham, 2003). However, data from Kanjera Southsuggest that for Pliocene technology this was not the case. Thefrequency of certain raw materials in this Oldowan archaeologicalcollection was apparently linked to a decision-making system that,to a certain degree, was independent of the proximity and overallavailability of those raw materials. In order to explore other factorsthat shaped raw material selection it will be necessary to in-vestigate technological decisions based on artifact morphologicalpatterning and other aspects of assemblage variation that go be-yond the mere frequency of a raw material in the archaeologicalcollection (Braun, 2006).
9. Conclusion: raw material availability at Kanjera South andOldowan transport
Geochemical provenance analyses of primary and secondarysources provide a rich context for the analysis of the archaeological
Table 2Results of c2 test of the difference between expected frequencies of raw materials versu
Expected frequency is derived from a model of raw material frequency in the different rivewithin that drainage system.
collection at Kanjera South. This study shows that raw materialsfrom Kanjera South were derived from a wide variety of geo-graphically distinct primary sources of raw materials. Analysis ofsecondary sources shows that raw material availability from con-glomerates also varied across the landscape. Clasts made from theBukoban and Nyanzian systems were apparently widely availablein conglomerates approximately 10–13 km from Kanjera South.Clasts of rocks associated with the Homa Mountain complex werewidely available in conglomerates all along the southern shores ofthe Winam Gulf. Based on the frequency of raw materials in thearchaeological collection, it appears that certain raw materialswere transported to Kanjera South at higher proportions than canbe expected based on their availability in conglomerates. Almostone-third (27.9%) of the entire artifact collection derives from rawmaterials that were only available in conglomerates deposited bythe Awach River system. Selective transport was a major factorshaping the composition of the archaeological collection. Indeed,many raw materials can be found in high frequencies in con-glomerates near the Samanga Fault that were not transported toKanjera South. If transport of clasts from the region around KenduBay was an important element of the technological behavior rep-resented at Kanjera South, we should expect to see a reflection ofthis behavior in the manufacture and discard of certain artifacttypes at this site. Future analyses will focus on the interactionbetween technological attributes and transport decisions (Stoutet al., 2005).
Recent studies of Oldowan sites have suggested that tech-nological decisions were interconnected with the selection ofcertain raw materials (Harmand, 2006; Stout et al., 2005). Infact, some have suggested that this selection and transport be-havior is the hallmark of the Oldowan (Davidson and McGrew,2005; Potts, 1991). Movements over long distances may havebeen related to anatomical changes in early Homo (Bramble andLieberman, 2004; Lieberman et al., 2007; Pickering and Bunn,2007). Here we show that hominins in the Winam basin duringthe Pliocene exhibited a range of selective transport behaviorsthat indicate the expenditure of extensive amounts of energy toproduce and maintain a stone tool kit. A likely implication isthat the benefits accrued from such behavior were commensu-rate and adaptive. These data support a growing interpretationthat, when transport and stone flaking are considered in con-siderable detail, Oldowan tool behavior was possibly morecomplex than previously expected (Delagnes and Roche, 2005;Semaw, 2000).
s the known frequency of raw materials in the archaeological collection
man–Tukey deviates c2 n p
.48 3084.96 5 <0.0014.95.25.310
5 2776.86 8 <0.001
.384
.7540.71
r systems based on the average percentage of each lithology for conglomerates falling
D.R. Braun et al. / Journal of Archaeological Science 35 (2008) 2329–23452344
Acknowledgements
This research on the Homa Peninsula and excavations atKanjera South are part of a collaborative project of the NationalMuseums of Kenya, Smithsonian Institution, and CUNY QueensCollege. We thank the NMK for research clearance; the support ofthe NMK Division of Paleontology, especially Drs. Emma Mbua andKyalo Manthi; and Dr. I.O. Farah, Director General of the NMK, forhis support and encouragement. We also acknowledge thecontinued support of the NMK Division of Archaeology, especiallyDr. Purity Kiura who facilitated the transport and preparation ofsamples between the NMK and the Institute for Nuclear Science.Support for the analytical parts of this project was provided byNSF HOMINID Program (BCS-0218511 to RP) and the Smithsonian’sHuman Origins Program, as well as NSF (BCS-0355563 to TP). Thefieldwork component of this study was supported by grants fromthe L.S. B. Leakey Foundation and the Wenner-Gren Foundation forAnthropological Research (DRB). ED-XRF analysis was greatlysupported by the dedication of the Institute of Nuclear Sciencestaff especially Simon Bartilol and Geoffrey Korir. DRB wouldparticularly like to thank Peter Onyango whose perpetual enthu-siasm and diligence made the fieldwork component of this projectpossible.
References
Bamforth, D.B., 1986. Technological efficiency and tool curation. American Antiquity51, 38–50.
Bamforth, D.B., 1990. Settlement, raw material, and lithic procurement in theCentral Mojave Desert. Journal of Anthropological Archaeology 9, 70–104.
Bamforth, D., Arnold, J.E., 1992. Quarries in context: a regional perspective on lithicprocurement. In: Tool Procurement, Production and Distribution in CaliforniaPrehistory. Institute of Archaeology, Los Angeles, CA.
Behrensmeyer, A.K., Potts, R., Plummer, T., Tauxe, L., Opdyke, N., Jorstad, T., 1995. Thepleistocene locality of Kanjera, Western Kenya – stratigraphy, chronology andpaleoenvironments. Journal of Human Evolution 29, 247–274.
Binford, L.R., 1973. Interassemblage variability – the mousterian and the ‘functional’argument. In: Renfrew, A.C. (Ed.), Explanation of Culture Change: Models inPrehistory. Duckworth Press, London, pp. 227–254.
Binford, L.R., 1977. Forty-seven trips: a case study in the character of archaeologicalformation processes. In: Wright, R.V. (Ed.), Stone Tools as Cultural Markers.Australian Institute of Aboriginal Studies, Canberra, pp. 24–36.
Binford, L.R., 1979. Organization and formation processes: looking at curatedtechnologies. Journal of Anthropological Research 35, 255–273.
Boesch, C., Boesch, H., 1984. Mental map in wild chimpanzees: an analysis ofhammer transports for nut cracking. Primates 25, 160–170.
Borkhodoev, V.Y., 2002. Accuracy of the fundamental parameter method for x-rayfluorescence analysis of rocks. X-Ray Spectrometry 31, 209–218.
Bramble, D.M., Lieberman, D., 2004. Endurance running and the evolution of Homo.Nature 432, 345–352.
Brantingham, J.P., 2003. A neutral model of stone material procurement. AmericanAntiquity 68, 487–509.
Braun, D.R., 2006. Ecology of Oldowan Technology: Koobi Fora and Kanjera South.Anthropology. Rutgers University, New Brunswick.
Braun, D.R., Plummer, T., Ditchfield, P., Bishop, L., Ferraro, J., in press. Oldowantechnology and raw material variability, In: Hovers, E., Braun, D.R. (Eds.),Interdisciplinary Approaches to the Olowan. Springer (in press).
Calogero, B.L.A., 1992. Lithic misidentification. Man in the Northeast 43, 87–90.Church, T., 1994. Lithic Resource Studies: A Sourcebook for Archaeologists.
University of Tulsa, Tulsa, OK.Church, T., 1996. Lithic resources of the Bearlodge Mountains, Wyoming:
description, distribution, and implications. Plains Anthropologist 41, 135–164.Church, T., 2000. Distribution and sources of obsidian in the Rio Grande gravels of
New Mexico. Geoarchaeology 15, 649–678.D’Angelo, J., Perino, E., Marchevsky, E., Riveros, J.A., 2002. Standardless analysis of
small amounts of mineral samples by Sr-Xrf and conventional Xrf Analyses. X-Ray Spectrometry 31, 419–423.
Davidson, I., McGrew, W.C., 2005. Stone tools and the uniqueness of human culture.Journal of the Royal Anthropological Institute 11, 793–817.
Davis, M.K., Jackson, T.L., Shackley, M.S., Teague, T., Hampel, J.H., 1998. Factors af-fecting the energy-dispersive X-ray fluorescence (Edxrf) analysis of archaeo-logical obsidian. In: Shackley, M.S. (Ed.), Archaeological Obsidian Studies:Method and Theory. Plenum Press, New York, pp. 159–180.
de Heinzelin, J., Clark, J.D., White, T.D., Hart, W.S., Renne, P.R., Woldegabriel, G.,Beyene, Y., Vrba, E.S., 1999. Environment and behavior of 2.5-million-year-oldBouri hominids. Science 284, 625–629.
De Vito, C., Ferrini, V., Mignardi, S., Piccardi, L., Tuteri, R., 2003. Mineralogical pet-rographic and geochemical study to identify the provenance of limestone from
two archaeological sites in the Sulmona area (L’aquila, Italy). Journal ofArchaeological Science 31, 1383–1394.
Delagnes, A., Roche, H., 2005. Late Pliocene hominid knapping skills: the case ofLokalalei 2c, West Turkana, Kenya. Journal of Human Evolution 48, 435–472.
Dello-Russo, R.D., 2004. Geochemical comparisons of silicified rhyolites from twoprehistoric quarries and 11 prehistoric projectile points, Socorro County, NewMexico, USA. Geoarchaeology 19, 237–264.
Dibble, H.L., 1995a. Raw material availability, intensity of utilization, and middlepaleolithic assemblage variability. In: Dibble, H.L., Lenoir, M. (Eds.), The MiddlePaleolithic Site of Combe-Capelle Bas (France). The University Museum, Uni-versity of Pennsylvania, Philadelphia, pp. 289–315.
Dibble, H.L., 1995b. Middle paleolithic scraper reduction: background, clarification,and review of the evidence to date. Journal of Archaeological Method andTheory 2, 299–368.
Ditchfield, P., Hicks, J., Plummer, T., Bishop, L.C., Potts, R., 1999. Current research onthe Late Pliocene and Pleistocene deposits North of Homa Mountain, South-western Kenya. Journal of Human Evolution 36, 123–150.
Ditchfield, P., Plummer, T., Bishop, L., Ferraro, J., Braun, D.R., Hicks, J., Potts, R., inpress. Revised stratigraphy and chronology for Homa peninsula paleoanthro-pological localities (in press).
Eerkens, J.W., Rosenthal, J.S., 2004. Are obsidian subsources meaningful units ofanalysis? Temporal and spatial patterning of subsources in the Coso VolcanicField, Southeastern California. Journal of Archaeological Science 31, 21–29.
Freeman, L.G.J., 1994. Torralba and Ambrona: a review of discoveries. In: Corruc-cini, R.S., Ciochon, R.L. (Eds.), Integrative Paths to the Past: PaleoanthropologicalAdvances in Honor of F. Clark Howell. Prentice Hall, Englewood Cliffs, NJ, pp.597–637.
Geneste, J.-M., 1988. Systemes d’approvisionnement en matieres premieres aupaleolithique Moyen et superieur en Aquitaine. In: Otte, M. (Ed.). L’Homme DeNeandertal. ERAUL, Liege, pp. 61–70.
Hall, M., Kimura, H., 2002. Quantitative Edxrf studies of obsidian sources inNorthern Hokkaido. Journal of Archaeological Science 29, 259–266.
Harmand, S., 2006. Oldowan intersite diversity in the Nachukui Formation, WestTurkana, Kenya. 71st Annual Meeting of the Society for American Archaeology.San Juan, Puerto Rico.
Hermes, O.D., Ritchie, D., 1997. Nondestructive trace element analysis of archaeo-logical felsite by energy-dispersive X-ray fluorescence spectroscopy. Geo-archaeology 12, 31–40.
Hermes, O.D., Luedtke, B.E., Ritchie, D., 2001. Melrose green rhyolite: its geologicsetting and petrographic and geochemical characteristics. Journal of Archaeo-logical Science 28, 913–928.
Huddelston, A., 1951. Geology of Kisii of Kenya. Mines and Geological Department,Kenya.
Isaac, G.L., 1984. Archaeology of human origins: studies of the Lower Pleistocene inEast Africa 1971–1981. Advances in World Archaeology 3, 1–87.
Kent, P.E., 1942. The pleistocene beds of Kanam and Kanjera, Kavirondo, Kenya.Geological Magazine 79, 117–132.
Kimura, Y., 1999. Tool-using strategies by early hominids at Bed Ii, Olduvai Gorge,Tanzania. Journal of Human Evolution 37, 807–831.
Kimura, Y., 2002. Examining time trends in the Oldowan technology at Beds I and Ii,Olduvai Gorge. Journal of Human Evolution 43, 291–321.
Kuhn, S.L., 1991. ‘‘Unpacking’’ reduction: lithic raw material economy in theMousterian of West-Central Italy. Journal of Anthropological Archaeology 10,76–106.
Lanier, G., Dodd, W.R., 1985. The systematic identification of stone from archaeo-logical sites. In: 50th Meeting of the Society of American Archaeology Denver,CO.
Le Bas, M.J., 1977. Carbonatite-Nephelinite Volcanism: An African Case History.Cambridge University Press, Cambridge.
Le Bas, M.J., Le Maitre, R.W., Streckeisen, A., Zanettin, B., 1986. A chemical classifi-cation of volcanic rocks based on the total alkali-silica diagram. Journal ofPetrology 27, 745–750.
Lemberge, P., Van Espen, P.J., Vrebos, B.A.R., 2000. Analysis of cement using low-resolution energy-dispersive X-ray fluorescence and partial least-squaresregression. X-Ray Spectrometry 29, 297–304.
Lieberman, D., Bramble, D.M., Raichlen, D.A., Shea, J.J., 2007. The evolution ofendurance running and the tyranny of ethnography: a reply to Pickering andBunn. Journal of Human Evolution 53 (2007), 439–442.
Luedtke, B.E., 1992. An Archaeologist’s Guide to Chert and Flint. Institute ofArchaeology, Los Angeles, CA.
Marks, A., Shokler, J., Zilhao, J., 1991. Raw material usage in the paleolithic: theeffects of local availability on selection and economy. In: Montet-White, A.,Holen, S. (Eds.), Raw Material Economies among Prehistoric Hunter-Gatherers. University of Kansas Publications in Anthropology, Lawrence, KS,pp. 127–140.
Marks, A.E., 1988. The curation of stone tools during the upper pleistocene: a viewfrom the Central Negev. In: Dibble, H.L., Monet-White, A. (Eds.), Upper Pleis-tocene Prehistory of Western Eurasia. The University Museum, University ofPennsylvania, Philadelphia, PA, pp. 275–286.
McCall, G.J.H., 1958. Geology of the Gwasi Area. Ministry of Commerce and IndustryGeological Survey of Kenya, Nairobi.
D.R. Braun et al. / Journal of Archaeological Science 35 (2008) 2329–2345 2345
Meignen, L., 1988. Un example de comportement technologique differential selonles matieres premieres: Marillac, Couches 9 et 10. In: Binford, L., Rigaud, J.P.(Eds.), L’Homme de Neandertal: La Technique. Universite de Liege, Liege.
Moholy-Nagy, H., Nelson, F.W., 1990. New data on sources of obsidian artifacts fromTikal, Guatemala. In: Ancient Mesoamerica, 1, 71–80.
Negash, A., Shackley, M.S., Alene, M., 2005. Source provenance of obsidian artifactsfrom the Early Stone Age (ESA) site of Melka Konture, Ethiopia. Journal ofArchaeological Science 33, 1647–1650.
Noll, M., 2000. Components of Acheulian Lithic Assemblage Variability at Olorge-saille, Kenya, Anthropology. University of Illinois, Urbana, IL.
Perry, M., 1992. What is that black stuff? Identification of black argillite in theNorthern Columbia Plateau. Northwest Anthropological Research Notes 26,203–208.
Pickering, T., Bunn, H., 2007. The endurance running hypothesis and hunting andscavenging in savanna-woodlands. Journal of Human Evolution 53, 434–438.
Pickford, M., 1987. The geology and palaeontology of the Kanam erosion gullies(Kenya). Mainzer Geowissenschaftliche Mitteilungen 6, 209–226.
Plummer, T., Bishop, L.C., Ditchfield, P., Hicks, J., 1999. Research on late plioceneOldowan Sites at Kanjera South, Kenya. Journal of Human Evolution 36, 151–170.
Plummer, T., 2004. Flaked stones and old bones: biological and cultural evolution atthe dawn of technology. American Journal of Physical Anthropology, 118–164.
Plummer, T.W., Kinyua, A.M., Potts, R., 1994. Provenancing of hominid and mam-malian fossils from Kanjera, Kenya, using Edxrf. Journal of Archaeological Sci-ence 21, 553–563.
Potts, P.J., 1987. A Handbook of Silicate Rock Analysis. Chapman and Hall, New York.Potts, R., 1984. Home bases and early hominids. American Scientist 72, 338–347.Potts, R., 1991. Why the Oldowan? Plio-Pleistocene toolmaking and the transport of
resources. Journal of Anthropological Research 47, 153–176.Potts, R., 1994. Variables versus models of early pleistocene hominid land-use.
Journal of Human Evolution 27, 7–24.Potts, R., Behrensmeyer, A.K., Ditchfield, P., 1999. Paleolandscape variation and early
pleistocene hominid activities: members 1 and 7, Olorgesailie Formation,Kenya. Journal of Human Evolution 37, 747–788.
Reid, K.C., 1997. Gravels and travels: a comment on Andrefsky’s ’’Cascade PhaseLithic Technology’’. North American Archaeologist 18, 67–81.
Rogers, M.J., Harris, J.W.K., Feibel, C.S., 1994. Changing patterns of land-use bypliopleistocene hominids in the Lake Turkana Basin. Journal of Human Evolu-tion 27, 139–158.
Roth, B.J., Dibble, H.L., 1998. Production and transport of blanks and tools at theFrench Middle Paleolithic Site of Combe-Capelle Bas. American Antiquity 63,47–62.
Saggerson, E.P., 1952. Geology of the Kisumu District, Geological Survey of Kenya,Republic of Kenya. Mines and Geological Department, Kenya. 86.
Saini, N.K., Mukherjee, P.K., Rathi, M.S., Khanna, P.P., 2000. Evaluation of energy-dispersive X-ray fluorescence spectrometry in the rapid analysis of silicate rocksusing pressed powder pellets. X-Ray Spectrometry 29, 166–172.
Schick, K.D., 1987. Modeling the formation of early stone age artifact concentrations.Journal of Human Evolution 16, 789–807.
Semaw, S., 2000. The world’s oldest stone artefacts from Gona, Ethiopia: theirimplications for understanding stone technology and patterns of human evo-lution between 2.6–1.5 million years ago. Journal of Archaeological Science 27,1197–1214.
Shackleton, R.M., 1952. A contribution to the geology of the Kavirondo Rift Valley.Quarterly Journal of the Geological Society of London 107, 336–337.
Shackley, M.S., 1998. Gamma rays, x-rays and stone tools: some recent advances inarchaeological geochemistry. Journal of Archaeological Science 25, 259–270.
Shott, M.J., 1986. Technological organization and settlement mobility: an ethno-graphic examination. Journal of Anthropological Research 42, 15–51.
Stiles, D., 1979. Early Acheulian and developed Oldowan. Current Anthropology 20,126–129.
Stiles, D., 1991. Early hominid behaviour and culture tradition: raw material studiesin Bed Ii, Olduvai Gorge. African Archaeological Review 9, 1–19.
Stiles, D., 1998. Raw material as evidence for human behaviour in the lowerpleistocene: the Olduvai Case. In: Paddaya, K., Petraglia, M. (Eds.), Early HumanBehaviour in Global Context: The Rise and Diversity of the Lower PalaeolithicRecord. Routledge, London, pp. 133–150.
Stout, D., Quade, J., Semaw, S., Rogers, M.J., Levin, N.E., 2005. Raw material selec-tivity of the earliest stone toolmakers at Gona, Afar, Ethiopia. Journal of HumanEvolution 48, 365–380.
Sugiyama, Y., 1993. Local variation of tools and tool-use among wild chimpanzeepopulations. In: Berthelet, A., Chavaillon, J. (Eds.), Use of Tools by Human andNon-Human Primates. Clarendon Press, Oxford, pp. 175–187.
Tavoso, A., 1984. Reflexion sur l’economie des matieres premieres au Mousterien.Bulletin Societe prehistorique Française 81, 79–82.
Toth, N., 1982. The Stone Age Technology of Early Hominids at Koobi Fora, Kenya: anExperimental Approach, Anthropology. University of California, Berkeley, CA.