Visual aggregate analysis of eligibility features of clinical trials Zhe He a , Simona Carini b , Ida Sim b , Chunhua Weng a,⇑ a Department of Biomedical Informatics, Columbia University, New York, NY 10032, USA b Division of General Internal Medicine, University of California, San Francisco, San Francisco, CA 94143, USA article info Article history: Received 29 August 2014 Accepted 12 January 2015 Available online 20 January 2015 Keywords: Clinical trial Patient selection Selection bias Knowledge management abstract Objective: To develop a method for profiling the collective populations targeted for recruitment by multi- ple clinical studies addressing the same medical condition using one eligibility feature each time. Methods: Using a previously published database COMPACT as the backend, we designed a scalable method for visual aggregate analysis of clinical trial eligibility features. This method consists of four mod- ules for eligibility feature frequency analysis, query builder, distribution analysis, and visualization, respectively. This method is capable of analyzing (1) frequently used qualitative and quantitative features for recruiting subjects for a selected medical condition, (2) distribution of study enrollment on consecu- tive value points or value intervals of each quantitative feature, and (3) distribution of studies on the boundary values, permissible value ranges, and value range widths of each feature. All analysis results were visualized using Google Charts API. Five recruited potential users assessed the usefulness of this method for identifying common patterns in any selected eligibility feature for clinical trial participant selection. Results: We implemented this method as a Web-based analytical system called VITTA (Visual Analysis Tool of Clinical Study Target Populations). We illustrated the functionality of VITTA using two sample queries involving quantitative features BMI and HbA1c for conditions ‘‘hypertension’’ and ‘‘Type 2 diabe- tes’’, respectively. The recruited potential users rated the user-perceived usefulness of VITTA with an average score of 86.4/100. Conclusions: We contributed a novel aggregate analysis method to enable the interrogation of common patterns in quantitative eligibility criteria and the collective target populations of multiple related clinical studies. A larger-scale study is warranted to formally assess the usefulness of VITTA among clinical inves- tigators and sponsors in various therapeutic areas. Ó 2015 Elsevier Inc. All rights reserved. 1. Introduction Well-designed clinical study protocols are essential for generat- ing high-quality medical evidence [1]. However, studies are often criticized for lacking generalizability, or external validity [2–16]. Because population representativeness is an important aspect of clinical research generalizability, study designers should justify the tradeoffs between internal validity and external validity that arise from their choices of eligibility criteria. Biased or overly restrictive eligibility criteria may (1) exclude patients who may need or benefit from the research [4,5], and (2) lead to an overes- timate of the efficacy of an intervention [10]. For example, accord- ing to Schmidt et al. [12], almost none of their analyzed studies on secondary prevention of cardiovascular events justified the applied exclusion criteria, which excluded 21–97% of the female target population. Similarly, Zimmerman et al. [15] reported that approx- imately 32–47% of patients with major depressive disorder would have been excluded by two most commonly used cutoff values of the Hamilton Rating Scale for Depression in antidepressant efficacy trials, i.e., 18 and 20. When designing clinical studies, investigators often reuse eligi- bility criteria from previous protocols of related studies. One of our previously published papers also discovered that many clinical studies, especially those on the same medical condition, use simi- lar or identical eligibility criteria [17]. Therefore, we hypothesize that the generalizability issue might be not only at the level of indi- vidual studies, but also at the community level in the entire clinical trial enterprise. Unlike prior work that looks at the generalizability of one study at a time, we are motivated to assess the collective generalizability by uncovering collective design patterns for partic- ipant selection among multiple related clinical trials. Unfortu- nately, at present there is no method or tool for making such http://dx.doi.org/10.1016/j.jbi.2015.01.005 1532-0464/Ó 2015 Elsevier Inc. All rights reserved. ⇑ Corresponding author at: Department of Biomedical Informatics, Columbia University, 622 W 168th Street, VC-5, New York, NY 10032, USA. E-mail address: [email protected](C. Weng). Journal of Biomedical Informatics 54 (2015) 241–255 Contents lists available at ScienceDirect Journal of Biomedical Informatics journal homepage: www.elsevier.com/locate/yjbin
Transcript
Journal of Biomedical Informatics 54 (2015) 241–255
Contents lists available at ScienceDirect
Journal of Biomedical Informatics
journal homepage: www.elsevier .com/locate /y jb in
Visual aggregate analysis of eligibility features of clinical trials
http://dx.doi.org/10.1016/j.jbi.2015.01.0051532-0464/� 2015 Elsevier Inc. All rights reserved.
⇑ Corresponding author at: Department of Biomedical Informatics, ColumbiaUniversity, 622 W 168th Street, VC-5, New York, NY 10032, USA.
Zhe He a, Simona Carini b, Ida Sim b, Chunhua Weng a,⇑a Department of Biomedical Informatics, Columbia University, New York, NY 10032, USAb Division of General Internal Medicine, University of California, San Francisco, San Francisco, CA 94143, USA
a r t i c l e i n f o
Article history:Received 29 August 2014Accepted 12 January 2015Available online 20 January 2015
Objective: To develop a method for profiling the collective populations targeted for recruitment by multi-ple clinical studies addressing the same medical condition using one eligibility feature each time.Methods: Using a previously published database COMPACT as the backend, we designed a scalablemethod for visual aggregate analysis of clinical trial eligibility features. This method consists of four mod-ules for eligibility feature frequency analysis, query builder, distribution analysis, and visualization,respectively. This method is capable of analyzing (1) frequently used qualitative and quantitative featuresfor recruiting subjects for a selected medical condition, (2) distribution of study enrollment on consecu-tive value points or value intervals of each quantitative feature, and (3) distribution of studies on theboundary values, permissible value ranges, and value range widths of each feature. All analysis resultswere visualized using Google Charts API. Five recruited potential users assessed the usefulness of thismethod for identifying common patterns in any selected eligibility feature for clinical trial participantselection.Results: We implemented this method as a Web-based analytical system called VITTA (Visual AnalysisTool of Clinical Study Target Populations). We illustrated the functionality of VITTA using two samplequeries involving quantitative features BMI and HbA1c for conditions ‘‘hypertension’’ and ‘‘Type 2 diabe-tes’’, respectively. The recruited potential users rated the user-perceived usefulness of VITTA with anaverage score of 86.4/100.Conclusions: We contributed a novel aggregate analysis method to enable the interrogation of commonpatterns in quantitative eligibility criteria and the collective target populations of multiple related clinicalstudies. A larger-scale study is warranted to formally assess the usefulness of VITTA among clinical inves-tigators and sponsors in various therapeutic areas.
� 2015 Elsevier Inc. All rights reserved.
1. Introduction
Well-designed clinical study protocols are essential for generat-ing high-quality medical evidence [1]. However, studies are oftencriticized for lacking generalizability, or external validity [2–16].Because population representativeness is an important aspect ofclinical research generalizability, study designers should justifythe tradeoffs between internal validity and external validity thatarise from their choices of eligibility criteria. Biased or overlyrestrictive eligibility criteria may (1) exclude patients who mayneed or benefit from the research [4,5], and (2) lead to an overes-timate of the efficacy of an intervention [10]. For example, accord-ing to Schmidt et al. [12], almost none of their analyzed studies onsecondary prevention of cardiovascular events justified the applied
exclusion criteria, which excluded 21–97% of the female targetpopulation. Similarly, Zimmerman et al. [15] reported that approx-imately 32–47% of patients with major depressive disorder wouldhave been excluded by two most commonly used cutoff values ofthe Hamilton Rating Scale for Depression in antidepressant efficacytrials, i.e., 18 and 20.
When designing clinical studies, investigators often reuse eligi-bility criteria from previous protocols of related studies. One of ourpreviously published papers also discovered that many clinicalstudies, especially those on the same medical condition, use simi-lar or identical eligibility criteria [17]. Therefore, we hypothesizethat the generalizability issue might be not only at the level of indi-vidual studies, but also at the community level in the entire clinicaltrial enterprise. Unlike prior work that looks at the generalizabilityof one study at a time, we are motivated to assess the collectivegeneralizability by uncovering collective design patterns for partic-ipant selection among multiple related clinical trials. Unfortu-nately, at present there is no method or tool for making such
242 Z. He et al. / Journal of Biomedical Informatics 54 (2015) 241–255
design biases transparent or help investigate such biases. Echoingthis need, recently the National Center for Advancing TranslationalSciences (NCATS) responded to the Institute of Medicine’s reviewof the Clinical and Translational Science Awards (CTSA) Programin the United States and identified ‘‘lack of a knowledge base forall types of interventions at the extremes of age as well as withinspecial populations’’ as one of the weaknesses of the current trans-lational science enterprise [18]. To help bridge this gap, a comput-able repository of eligibility features of clinical trials is needed toanalyze the characteristics of the target populations on a largescale [19].
The study and result registry ClinicalTrials.gov [20] created bythe National Library of Medicine is a valuable public data source.Since September 27, 2007, all United States-based clinical trialsof FDA-regulated drugs, biological products, or devices have beenmandated to be registered in ClinicalTrials.gov [21]. As of March18, 2014, 163,285 clinical studies conducted in more than 180countries were registered in ClinialTrials.gov. Study summariesare stored in a semi-structured format in the registry, i.e., studydescriptors such as title, phase, and location are organized in struc-tured fields. The eligibility criteria are usually organized as para-graphs of free-text or as bullet lists.
The ClinicalTrials.gov is a preferred resource to be transformedinto a computable repository of reusable knowledge of clinical trialdesigns. However, there is little published work on building a com-putable repository from study summaries on ClinicalTrials.gov.Tasneem et al. developed the Aggregate Analysis of ClinicalTri-als.gov (AACT) database as a publicly accessible analysis datasetderived from ClinicalTrials.gov [22]. Using AACT data, clinical trialsin various domains have been systematically analyzed, e.g., infec-tious diseases [23], oncology [24], and diabetes [25], to name afew. AACT allows selection and aggregation of trials by studydescriptors, such as study status, phase, and intervention type,but not by fine-grained clinical characteristics of the target popu-lation. As studies often limit eligibility to permissible ranges ofquantitative features as age, BMI, HbA1c, and blood glucose level[26], investigators or policy makers may be interested in analyzingsuch quantitative features across studies addressing the samemedical condition, with questions like ‘‘what is the range of BMI val-ues that are permitted across interventional studies on Type 2 diabe-tes?’’ However, as most of the eligibility criteria are inunstructured text, it remains difficult to support these analysesin a programmatic, accurate and scalable way. Hence, to date, thereis a paucity of analyses on the quantitative eligibility features oftarget populations of existing studies, and consequently a lack ofcapacity to optimize the eligibility criteria definition for futureclinical studies based on past studies.
We have developed methods for parsing eligibility featuresfrom free-text eligibility criteria [17,27–41] and the derived fre-quent eligibility features across ClinicalTrials.gov study summarieshave produced promising results for searching and indexing stud-ies [29], probing disease relatedness [30], and clustering studieswith similar eligibility criteria [17]. Enabled by these techniques,we have created a database of discrete clinical trial eligibility fea-tures extracted from ClinicalTrials.gov called COMPACT (Common-alities in Target Populations of Clinical Trials) [42], which allowsusers to flexibly query sets of clinical studies (e.g., Type 2 diabetesstudies) on their shared eligibility features (e.g., HbA1c or BMI) andattributes (e.g., allowed value range for HbA1c or BMI). In addition,we have developed a distribution-based method for profiling clin-ical trial target populations across sets of studies [43]. Meanwhile,as one of the state-of-the-art methods for discovering knowledgefrom Big Data [44,45], interactive visual query interfaces can beemployed to further support flexible profiling of target populationsof sets of clinical studies and to investigate the generalizability ofthese studies. It has been used for tasks similar to profiling target
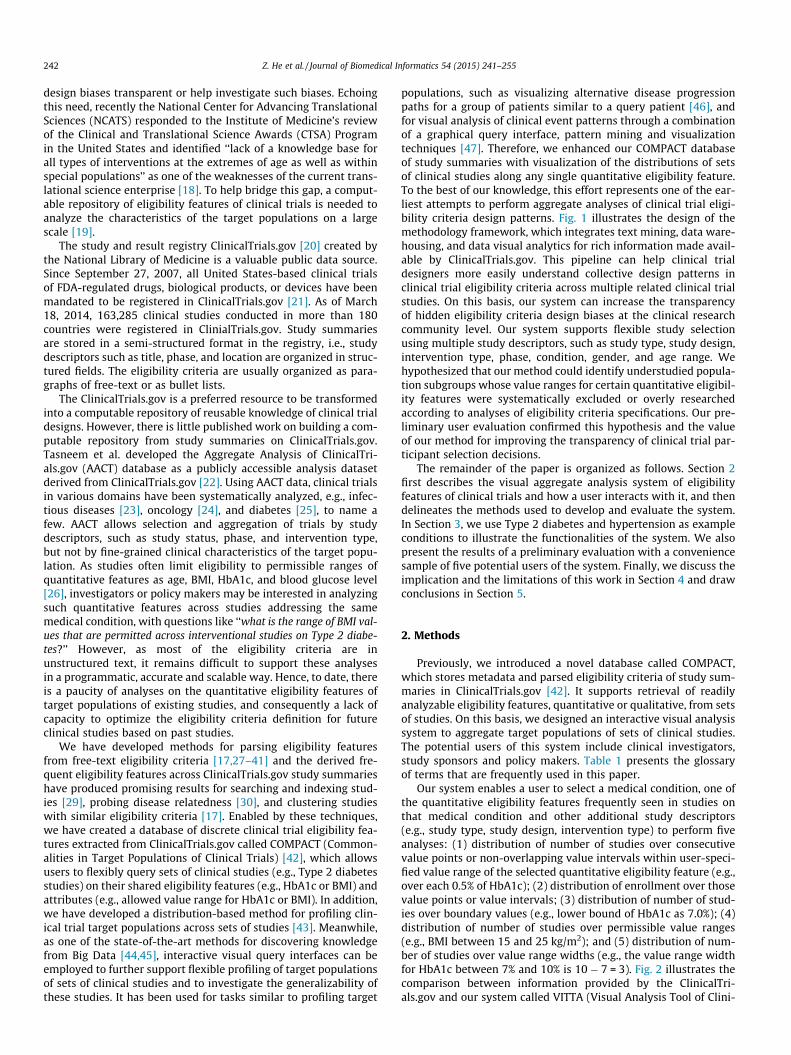
populations, such as visualizing alternative disease progressionpaths for a group of patients similar to a query patient [46], andfor visual analysis of clinical event patterns through a combinationof a graphical query interface, pattern mining and visualizationtechniques [47]. Therefore, we enhanced our COMPACT databaseof study summaries with visualization of the distributions of setsof clinical studies along any single quantitative eligibility feature.To the best of our knowledge, this effort represents one of the ear-liest attempts to perform aggregate analyses of clinical trial eligi-bility criteria design patterns. Fig. 1 illustrates the design of themethodology framework, which integrates text mining, data ware-housing, and data visual analytics for rich information made avail-able by ClinicalTrials.gov. This pipeline can help clinical trialdesigners more easily understand collective design patterns inclinical trial eligibility criteria across multiple related clinical trialstudies. On this basis, our system can increase the transparencyof hidden eligibility criteria design biases at the clinical researchcommunity level. Our system supports flexible study selectionusing multiple study descriptors, such as study type, study design,intervention type, phase, condition, gender, and age range. Wehypothesized that our method could identify understudied popula-tion subgroups whose value ranges for certain quantitative eligibil-ity features were systematically excluded or overly researchedaccording to analyses of eligibility criteria specifications. Our pre-liminary user evaluation confirmed this hypothesis and the valueof our method for improving the transparency of clinical trial par-ticipant selection decisions.
The remainder of the paper is organized as follows. Section 2first describes the visual aggregate analysis system of eligibilityfeatures of clinical trials and how a user interacts with it, and thendelineates the methods used to develop and evaluate the system.In Section 3, we use Type 2 diabetes and hypertension as exampleconditions to illustrate the functionalities of the system. We alsopresent the results of a preliminary evaluation with a conveniencesample of five potential users of the system. Finally, we discuss theimplication and the limitations of this work in Section 4 and drawconclusions in Section 5.
2. Methods
Previously, we introduced a novel database called COMPACT,which stores metadata and parsed eligibility criteria of study sum-maries in ClinicalTrials.gov [42]. It supports retrieval of readilyanalyzable eligibility features, quantitative or qualitative, from setsof studies. On this basis, we designed an interactive visual analysissystem to aggregate target populations of sets of clinical studies.The potential users of this system include clinical investigators,study sponsors and policy makers. Table 1 presents the glossaryof terms that are frequently used in this paper.
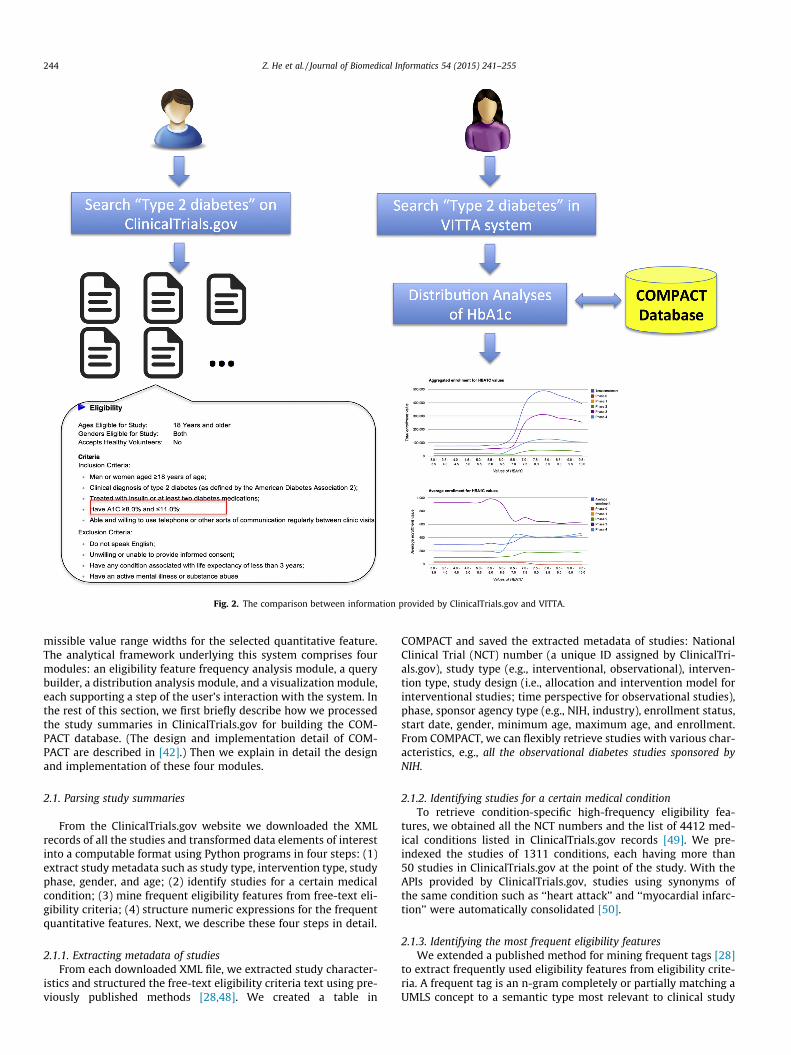
Our system enables a user to select a medical condition, one ofthe quantitative eligibility features frequently seen in studies onthat medical condition and other additional study descriptors(e.g., study type, study design, intervention type) to perform fiveanalyses: (1) distribution of number of studies over consecutivevalue points or non-overlapping value intervals within user-speci-fied value range of the selected quantitative eligibility feature (e.g.,over each 0.5% of HbA1c); (2) distribution of enrollment over thosevalue points or value intervals; (3) distribution of number of stud-ies over boundary values (e.g., lower bound of HbA1c as 7.0%); (4)distribution of number of studies over permissible value ranges(e.g., BMI between 15 and 25 kg/m2); and (5) distribution of num-ber of studies over value range widths (e.g., the value range widthfor HbA1c between 7% and 10% is 10 � 7 = 3). Fig. 2 illustrates thecomparison between information provided by the ClinicalTri-als.gov and our system called VITTA (Visual Analysis Tool of Clini-
Fig. 1. The methodology framework.
Table 1The glossary.
Term Description
Quantitative features Eligibility criteria with a permissible numeric (continuous) value range requirement for participants, e.g., ‘‘BMI < 30 kg/m2’’Qualitative features Eligibility criteria that accept one of a set of value options, e.g., ‘‘with acute ischemic stroke’’ (yes or no)Value spectrum The collective value range of a quantitative feature in selected studies that use the feature for eligibility determinationUser-specified value
rangeThe value range of a quantitative feature specified by the user for analyzing the distribution of studies and enrollment. For example, a valuerange of HbA1c can be ‘‘4–12%’’
Value intervals Evenly (based on the user-specified width) or unevenly (based on the actual boundary values) divided smaller bins in the user-specified valuerange
Permissible valuerange
The value range specified by an eligibility criterion. For example, the permissible value range for criterion ‘‘age between 15 and 40’’ is [15,40],where ‘‘[ ]’’ means inclusive
Value range width The difference between the upper bound and lower bound of a permissible value range. For example, the value range width for the criterion‘‘age between 15 and 40’’ is 25 (=40 � 15)
Boundary value The threshold value(s) of a quantitative feature in an eligibility criterion, e.g., the boundary values for the criterion ‘‘age between 15 and 40’’ are15 and 40
Z. He et al. / Journal of Biomedical Informatics 54 (2015) 241–255 243
cal Study Target Populations). Conventionally users who want toanalyze the aggregate target populations of Type 2 diabetes studiesin ClinicalTrials.gov may search for studies whose condition is‘‘Type 2 diabetes.’’ They would then review the summary of eachof the studies returned, look for ‘‘HbA1c’’ in the eligibility criteriasection, note the permissible value range and finally manuallyaggregate all the values retrieved. In contrast, our system can auto-matically group sets of studies and summarize such informationfrom the pre-processed study summaries in the COMPACTdatabase.
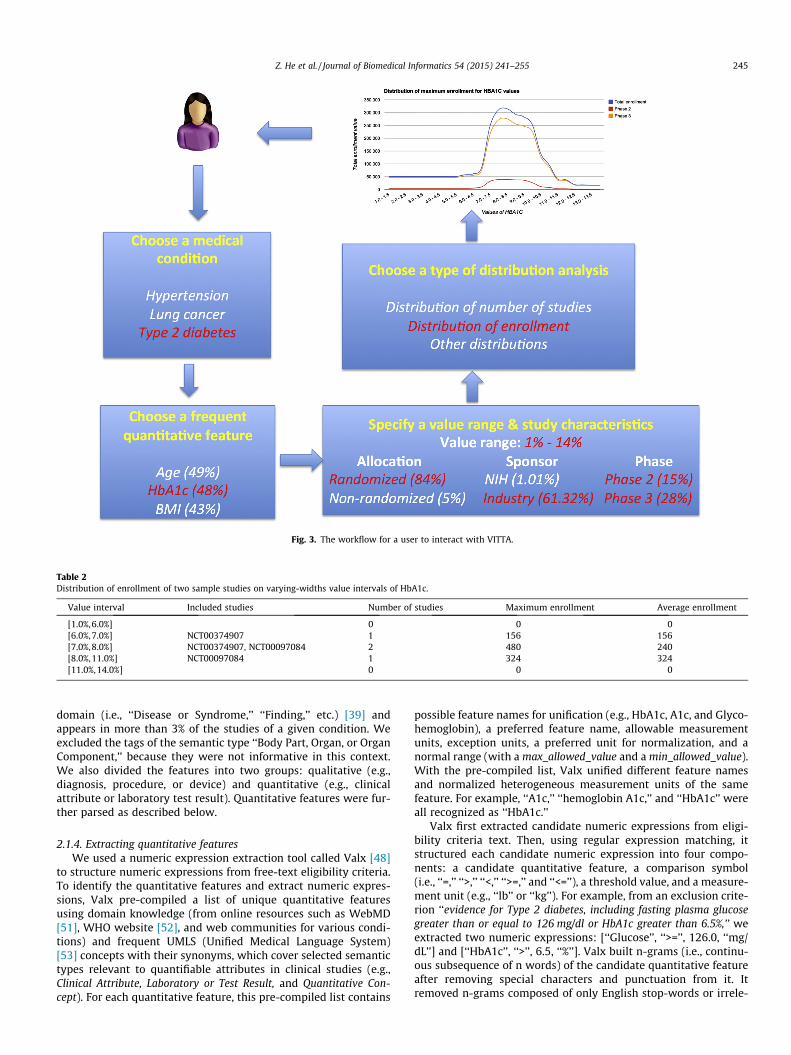
The workflow (Fig. 3) for a user is as follows: (1) select a med-ical condition and specify the number of frequent features toretrieve; (2) select a quantitative eligibility feature among themost frequent quantitative features of the studies on the conditionselected in step (1); (3) specify a value range of the selected quan-titative feature and optionally one or more study descriptors to fur-ther restrict the set of studies; (4) choose a type of analysis on thequantitative feature; and (5) receive the visual query results.
For example, if a user chooses ‘‘Type 2 diabetes’’ as the condi-tion and sets the number of frequent features to retrieve as ‘‘10’’,the system returns a list of 10 most frequent quantitative eligibilityfeatures extracted from Type 2 diabetes studies. From this list, theuser may choose ‘‘HbA1c.’’ The user is then asked to specify thevalue range of interest for HbA1c and additional characteristicsfor the studies to be included in the analysis, such as study type,
study design, intervention type, or patient age range. The usermay formulate a query as ‘‘distribution of enrollment in randomizedstudies in Phase 2/3 on Type 2 diabetes sponsored by industry overvalue intervals of HbA1c between 1% and 14%.’’ The width of valueintervals can be fixed or varying. If the user specifies a width(e.g., ‘‘0.5’’), the range 1–14% is evenly divided into value intervalsof the same width (e.g., [1%,1.5%], [1.5%,2%], . . . , [13.5%,14%]). Alter-natively, the user may perform this analysis on varying-widthvalue intervals, which are generated based on the actual boundaryvalues of HbA1c in the selected studies. Hypothetically, this searchwould include studies NCT00374907 (enrollment: 156) andNCT00097084 (enrollment: 324). The range of HbA1c inNCT00374907 is 6–8% and in NCT00097084 it is 7–11%. These fourboundary values (6%, 7%, 8%, 11%) would be used to divide therange 1–14% into five value intervals of varying widths: [1%,6%],[6%,7%], [7%,8%], [8%,11%], and [11%,14%]. The system would thenanalyze the enrollment of the studies that recruit subjects withHbA1c in each value interval and visualize the result. Table 2shows the distribution of enrollment (anticipated or actual) for thisexample. Column 4 (maximum enrollment) shows the aggregateenrollment of all the studies in each interval, whereas column 5(average enrollment) shows the average of study enrollment forall the studies in each interval.
The system also allows the user to visually identify frequentlyor rarely used boundary values, permissible value ranges, and per-
Fig. 2. The comparison between information provided by ClinicalTrials.gov and VITTA.
244 Z. He et al. / Journal of Biomedical Informatics 54 (2015) 241–255
missible value range widths for the selected quantitative feature.The analytical framework underlying this system comprises fourmodules: an eligibility feature frequency analysis module, a querybuilder, a distribution analysis module, and a visualization module,each supporting a step of the user’s interaction with the system. Inthe rest of this section, we first briefly describe how we processedthe study summaries in ClinicalTrials.gov for building the COM-PACT database. (The design and implementation detail of COM-PACT are described in [42].) Then we explain in detail the designand implementation of these four modules.
2.1. Parsing study summaries
From the ClinicalTrials.gov website we downloaded the XMLrecords of all the studies and transformed data elements of interestinto a computable format using Python programs in four steps: (1)extract study metadata such as study type, intervention type, studyphase, gender, and age; (2) identify studies for a certain medicalcondition; (3) mine frequent eligibility features from free-text eli-gibility criteria; (4) structure numeric expressions for the frequentquantitative features. Next, we describe these four steps in detail.
2.1.1. Extracting metadata of studiesFrom each downloaded XML file, we extracted study character-
istics and structured the free-text eligibility criteria text using pre-viously published methods [28,48]. We created a table in
COMPACT and saved the extracted metadata of studies: NationalClinical Trial (NCT) number (a unique ID assigned by ClinicalTri-als.gov), study type (e.g., interventional, observational), interven-tion type, study design (i.e., allocation and intervention model forinterventional studies; time perspective for observational studies),phase, sponsor agency type (e.g., NIH, industry), enrollment status,start date, gender, minimum age, maximum age, and enrollment.From COMPACT, we can flexibly retrieve studies with various char-acteristics, e.g., all the observational diabetes studies sponsored byNIH.
2.1.2. Identifying studies for a certain medical conditionTo retrieve condition-specific high-frequency eligibility fea-
tures, we obtained all the NCT numbers and the list of 4412 med-ical conditions listed in ClinicalTrials.gov records [49]. We pre-indexed the studies of 1311 conditions, each having more than50 studies in ClinicalTrials.gov at the point of the study. With theAPIs provided by ClinicalTrials.gov, studies using synonyms ofthe same condition such as ‘‘heart attack’’ and ‘‘myocardial infarc-tion’’ were automatically consolidated [50].
2.1.3. Identifying the most frequent eligibility featuresWe extended a published method for mining frequent tags [28]
to extract frequently used eligibility features from eligibility crite-ria. A frequent tag is an n-gram completely or partially matching aUMLS concept to a semantic type most relevant to clinical study
Fig. 3. The workflow for a user to interact with VITTA.
Table 2Distribution of enrollment of two sample studies on varying-widths value intervals of HbA1c.
Value interval Included studies Number of studies Maximum enrollment Average enrollment
Z. He et al. / Journal of Biomedical Informatics 54 (2015) 241–255 245
domain (i.e., ‘‘Disease or Syndrome,’’ ‘‘Finding,’’ etc.) [39] andappears in more than 3% of the studies of a given condition. Weexcluded the tags of the semantic type ‘‘Body Part, Organ, or OrganComponent,’’ because they were not informative in this context.We also divided the features into two groups: qualitative (e.g.,diagnosis, procedure, or device) and quantitative (e.g., clinicalattribute or laboratory test result). Quantitative features were fur-ther parsed as described below.
2.1.4. Extracting quantitative featuresWe used a numeric expression extraction tool called Valx [48]
to structure numeric expressions from free-text eligibility criteria.To identify the quantitative features and extract numeric expres-sions, Valx pre-compiled a list of unique quantitative featuresusing domain knowledge (from online resources such as WebMD[51], WHO website [52], and web communities for various condi-tions) and frequent UMLS (Unified Medical Language System)[53] concepts with their synonyms, which cover selected semantictypes relevant to quantifiable attributes in clinical studies (e.g.,Clinical Attribute, Laboratory or Test Result, and Quantitative Con-cept). For each quantitative feature, this pre-compiled list contains
possible feature names for unification (e.g., HbA1c, A1c, and Glyco-hemoglobin), a preferred feature name, allowable measurementunits, exception units, a preferred unit for normalization, and anormal range (with a max_allowed_value and a min_allowed_value).With the pre-compiled list, Valx unified different feature namesand normalized heterogeneous measurement units of the samefeature. For example, ‘‘A1c,’’ ‘‘hemoglobin A1c,’’ and ‘‘HbA1c’’ wereall recognized as ‘‘HbA1c.’’
Valx first extracted candidate numeric expressions from eligi-bility criteria text. Then, using regular expression matching, itstructured each candidate numeric expression into four compo-nents: a candidate quantitative feature, a comparison symbol(i.e., ‘‘=,’’ ‘‘>,’’ ‘‘<,’’ ‘‘>=,’’ and ‘‘<=’’), a threshold value, and a measure-ment unit (e.g., ‘‘lb’’ or ‘‘kg’’). For example, from an exclusion crite-rion ‘‘evidence for Type 2 diabetes, including fasting plasma glucosegreater than or equal to 126 mg/dl or HbA1c greater than 6.5%,’’ weextracted two numeric expressions: [‘‘Glucose’’, ‘‘>=’’, 126.0, ‘‘mg/dL’’] and [‘‘HbA1c’’, ‘‘>’’, 6.5, ‘‘%’’]. Valx built n-grams (i.e., continu-ous subsequence of n words) of the candidate quantitative featureafter removing special characters and punctuation from it. Itremoved n-grams composed of only English stop-words or irrele-
246 Z. He et al. / Journal of Biomedical Informatics 54 (2015) 241–255
vant grammatical structures. Each n-gram was matched againstthe pre-compiled list of quantitative features and retained if atleast one substring was in the list. It normalized allowable mea-surement units to enable meaningful aggregation of quantitativevalues. Lastly, it performed heuristic rule-based removal of invalidnumeric expressions by comparing the threshold value with theallowable value range of the quantitative feature specified in thepre-compiled list, i.e., the expressions with a threshold value abovemax_allowed_value ⁄ 2 or below min_allowed_value/2 were consid-ered invalid and therefore removed. To unifying the exclusion cri-teria and inclusion criteria, it converted all numeric expressions inexclusion criteria to inclusion criteria using negations, such asreplacing ‘‘<’’, ‘‘<=’’, ‘‘>’’, ‘‘>=’’ with ‘‘>=’’, ‘‘>’’, ‘‘<=’’, ‘‘<’’, respectively.Valx converted the aforementioned two expressions extractedfrom the example exclusion criterion to [‘‘Glucose’’, ‘‘<’’, 126.0,‘‘mg/dL’’] and [‘‘HbA1c’’, ‘‘<=’’, 6.5, ‘‘%’’], respectively.
In a previously conducted evaluation of Valx for a paper underpreparation, the precision, recall, and F-measure for extractingnumeric expressions with the quantitative feature ‘‘HbA1c’’ were99.6%, 98.1%, 98.8% for Type 1 diabetes trials, and 98.8%, 96.9%,97.8% for Type 2 diabetes studies, respectively. The results of thecorresponding measures for extracting numeric expressions withthe quantitative feature ‘‘Glucose’’ were 97.3%, 94.8%, 96.1% forType 1 diabetes studies, and 92.3%, 92.3%, 92.3% for Type 2 diabetestrials, respectively. We stored in COMPACT all the structurednumeric expressions extracted from eligibility criteria of all thedownloaded study summaries. These numeric expressions wereused in the eligibility feature frequency analysis module and thedistribution analysis module (described below).
2.2. The eligibility feature frequency analysis module
To provide the user with the list of frequently used eligibilityfeatures in a condition-specific set of studies we built an eligibilityfeature frequency analysis module. Given a condition and the num-ber of frequent features to retrieve – ‘‘K’’, this module will analyzethe K most frequent qualitative and quantitative eligibility featuresused by the studies on the selected condition. Multiple occurrencesof the same feature in a study are counted only once when comput-ing the frequency. Given this information, when designing eligibil-ity criteria for a new study, a user might reuse some of thosefrequent features or verify whether a feature s/he considers impor-tant is missing.
2.3. The query builder
The query builder module allows users to build a distributionanalysis query on a selected set of studies. After a user selects a fre-quent quantitative feature of a condition-specific set of studies, thequery builder module will analyze (1) the distribution of numberof studies over the value spectrum of the quantitative featureand (2) the distribution of studies by the values of a specific studydescriptor (e.g., study phase, intervention type). The distribution ofnumber of studies over the value spectrum of the chosen quantita-tive feature allows the user to specify a narrower value range ofinterest for closer investigation. In the query builder, the user mustspecify (1) a value range (with an upper bound and a lower bound)of the quantitative feature to be analyzed, (2) whether the distribu-tion is on unbinned consecutive value points or binned non-over-lapping value intervals, (3) whether the width of value intervalsis fixed or varying.
Study descriptors are organized in categories, such as gender,study type, intervention type, status, sponsor type, and phase. Eachdescriptor value is followed by the percentage of selected studieshaving that descriptor, which allows the user to estimate the num-ber of studies to be included in the analysis. For example, if a user
chooses ‘‘HbA1c’’ for Type 2 diabetes studies, s/he will see that95.66% of these studies using ‘‘HbA1c’’ are interventional, whereas4.29% are observational. A range of age and study start date can bespecified to further restrict the list of studies to analyze. The NCTnumber of studies satisfying the query will be passed to the distri-bution analysis module for further processing.
2.4. The distribution analysis module
Five types of distribution analyses are supported for each quan-titative feature as described more fully below: (1) distribution ofnumber of studies over its unbinned consecutive value points ornon-overlapping value intervals within the user-specified valuerange; (2) distribution of enrollment over its value points or valueintervals within the user-specified value range; (3) distribution ofnumber of studies over boundary values; (4) distribution of num-ber of studies over permissible value ranges; and (5) distributionof number of studies over permissible value range widths. In thesystem, we grouped the analysis results of (3–5) together. The usermust choose one kind of distribution analysis at a time.
2.4.1. Distribution of number of studiesDistribution of number of studies reveals which parts of a quan-
titative feature’s permissible value range is widely or rarely per-mitted across the selected studies. This module calculates thedistribution of the number of studies over consecutive value pointsor non-overlapping value intervals of a quantitative feature withinthe user-specified value range. If a user chooses to plot the distri-bution of studies on unbinned value points, for each consecutivevalue in the user-specified value range, we count the number ofstudies for which patients having the value are eligible. Of note,the distance between two consecutive value points can be fixed(i.e., the user-specified width) or varying (i.e., the actual boundaryvalues are the value points). If s/he chooses to plot on value inter-vals, we count the number of studies for each value interval withinthe user-specified value range. One study may cover multiple valuepoints or value intervals. If a user has specified a fixed-width forthe value intervals and has picked multiple phases in the querybuilder, s/he can stratify the distribution by multiple phases inthe same figure for comparison. If a user does not pick any phase,studies of any phase (including those that do not specify a phase)will be included in the analysis.
2.4.2. Distribution of enrollmentDistribution of enrollment presents the size of the target popu-
lation across the selected studies for value points or value intervalsof the quantitative feature. (In this paper, we do not distinguishbetween actual and anticipated enrollment due to a data issue inClinicalTrials.gov. We will discuss this limitation later in Section 4.)If a user chooses to plot the distribution of enrollment on consec-utive value points, we sum the enrollment for the studies for whichpatients having a specific value within the user-specified valuerange are eligible to obtain the maximum enrollment. If s/hechooses to plot by value intervals, for each interval in the user-specified value range, we sum the enrollment for the studies inthe interval to obtain the maximum enrollment. To obtain theaverage enrollment, for each value point or value interval, wedivide the corresponding maximum enrollment by the number ofstudies. Distribution of enrollment can also be stratified by phases.
2.4.3. Distribution of number of studies over boundary valuesThe distribution of number of studies over boundary values
shows the most commonly used upper bound and lower boundof a quantitative feature in selected studies. For this analysis, weretrieve all the boundary values of the feature in the selected stud-ies and count the number of studies for each boundary value. Then
Z. He et al. / Journal of Biomedical Informatics 54 (2015) 241–255 247
we analyze the distribution stratified by upper bound values andlower bound values. For open value range such as HbA1c >= 7%,we only include one threshold value 7% in this analysis.
2.4.4. Distribution of number of studies over permissible value rangesThe distribution of the number of studies over permissible value
ranges highlights frequently used value ranges of the quantitativefeature in the selected studies. We itemize all the permissible valueranges of the chosen quantitative feature in the selected studies,count the number of studies that use each value range, and orderthe result by the number of studies. In the case of open ranges,we use �inf or +inf as needed for the missing boundary value.For example, BMI >= 15 kg/m2 is denoted as ‘‘[15,+inf)’’, whereasHbA1c < 7.0% is denoted as ‘‘(�inf, 7.0)’’. ‘‘[ ]’’ refers to being inclu-sive, while ‘‘()’’ refers to being non-inclusive. Of note, in this anal-ysis we do not consider studies that allow only a single value, e.g.,the study NCT00519857 with an inclusion criterion ‘‘subjects wereto have a Body Mass Index (BMI) = 34 kg/m2.’’
2.4.5. Distribution of number of studies over permissible value rangewidths
The value range width is the difference between the upperbound and the lower bound of the selected quantitative featurein a study. For example, the value range width of BMI derived fromthe criterion ‘‘BMI value between 20 and 25 kg/m2’’ is 5 (=25 � 20).This distribution reveals frequently used value range width. In thisanalysis, we do not consider open value ranges such asHbA1c >= 7.0%, because the difference of1 and 7.0 is not a definitenumber.
2.5. Visualization module
The distribution analysis module passes the results of the distri-bution analysis module to the visualization module. With GoogleCharts API [54], we plot as line graphs the results of four out ofthe five analyses described in the previous section: (1) distributionof number of studies (Section 2.4.1), (2) distribution of maximumand average enrollment (Section 2.4.2), (3) distribution of numberof studies over boundary values (Section 2.4.3), and (4) distributionof number of studies over permissible value range widths (Sec-tion 2.4.5). The line graphs are employed to visualize these fouranalyses because (1) the x-axis values are non-overlapping, (2)multiple curves can be drawn on the same line graph (e.g., to showdistribution of enrollment stratified by study phases, or distribu-tion of boundary values stratified by upper bound values and lowerbound values), and (3) among all the figure types supported byGoogle Chart API, the line graph is the most suitable figure typeto plot two-dimensional distributions of a continuous variable. Incontrast, because permissible value ranges of the different studiesare likely to be overlapping, we plot the distribution of number ofstudies over permissible value ranges (Section 2.4.4) as a bar graph,where the value ranges are displayed in descending order of fre-quency. We leverage the applicable functions of the Google ChartsAPI to make the graphs interactive. A user may see the detail of theanalysis result by hovering the mouse cursor on the figure. Multi-ple curves on the same figure are distinguished by different colors.The user may hide a curve by clicking on its symbol in the legend.The ranges of the x- and y-axes of the line graphs can scale itselfautomatically to the currently visible curves. The user may zoomin on a figure to investigate an area more closely or zoom out toview the global pattern.
2.6. The Web-based prototype of VITTA
VITTA is a Web-based implementation of the aforementionedmethodology framework. We have made VITTA publicly available
at http://is.gd/VITTA. It has five pages for users to interact with:i.e., (1) ‘‘condition and feature selection’’, (2) ‘‘query builder’’, andthree pages for visualization of the analysis results: (3) distributionof number of studies, (4) distribution of enrollment, and (5) distri-butions of number of studies over boundary values, permissiblevalue ranges and value range widths.
The ‘‘condition and feature selection page’’ has a dropdownmenu containing 1311 conditions pre-indexed by ClinicalTri-als.gov. Currently, a user can choose only one value each time. Auser can type the first letter of the condition for quick navigation.After a user chooses a condition and specifies the number of fre-quent features to return, VITTA will analyze qualitative and quan-titative eligibility features of the studies indexed to that conditionand display a certain number of them (specified by the user) inseparate sections in descending order of frequency. The qualitativefeatures are listed in a two-column table (one for inclusion, theother for exclusion criteria) on the web page. Quantitative featuresare listed in a dropdown menu that allows selection. Currently, ouranalysis does not include a detailed view of qualitative featuresbeyond their frequency. After the user selects a quantitative fea-ture, VITTA will analyze the characteristics of studies using thequantitative feature and send the user to the ‘‘query builder page,’’where the user can narrow his/her selection based on values ofstudy descriptors such as study type (interventional or observa-tional), intervention type, study status, sponsor type, and phase.After the user chooses a certain type of distribution analysis andsubmit the query, s/he can view the analysis results online ordownload a CSV file that includes NCT numbers and the data forvisualizing the results for offline analysis using MATLAB, R, etc.On the result page, the user can also modify the query or startagain.
2.7. Preliminary evaluation by potential users
In order to assess the user-perceived usefulness of VITTA, wedesigned a questionnaire consisting of five Likert-scaled [55] mul-tiple-choice questions and four open-ended questions. The fivemultiple-choice questions adapted the well-adopted SystemUsability Scale (SUS) [56,57], as shown in Table 3. Of the fouropen-ended questions, two are about their current practice andthe other two are about VITTA. We recruited a convenience sampleof five potential users to perform a preliminary evaluation ofVITTA. These recruited users had a variety of backgrounds, includ-ing three researchers from academia with specialties such as pedi-atric, cardiology, and health IT usability evaluation as well as twomedical informaticians from pharmaceutical companies, and vari-ous levels of involvement in clinical research. We conducted theevaluation sessions either in the office of the user or remotelyusing WebEx. We first gave a comprehensive demonstration ofVITTA to the users. Then the users tried the tool with their ownqueries of interest.
3. Results
We downloaded all 163,285 XML files of clinical study summa-ries (one XML file for each study) registered on ClinicalTrials.gov asof March 18, 2014. After excluding studies without eligibility crite-ria, 162,586 records were further processed. Using Valx, weextracted 97,560 distinct quantitative features from 682,718numeric expressions from inclusion criteria and 89,555 distinctquantitative features from 385,421 numeric expressions fromexclusion criteria. After unifying exclusion criteria and inclusioncriteria, there were in total 180,458 distinct quantitative features,out of which 133 had each a frequency of more than 500.
1 When designing new studies, using VITTA may help me identify frequent value ranges of a quantitative feature for eligibilitydetermination
2 Using VITTA could help explain my rationale for subject selection more explicitly when designing new studies3 I find it easier to see global patterns of clinical study eligibility criteria design using VITTA4 Assuming VITTA would be available on my job as a clinical trialist, I would use it in the future5 I would prefer using VITTA tool for eligibility criteria design rather than manually find similar studies on ClinicalTrials.gov
Open-ended 6 What is your current process for designing clinical study eligibility criteria?7 What is the difficulty when designing clinical study eligibility criteria?8 What do you see as potential value of VITTA for supporting clinical study designs?9 Do you have any suggestions on improving VITTA?
248 Z. He et al. / Journal of Biomedical Informatics 54 (2015) 241–255
The parsed data are stored in the COMPACT database, currentlyhosted as a MySQL database instance on Amazon Rational Data-base Service, which is part of Amazon Web Services. The contentof COMPACT will be updated twice a year to reflect the changesin ClinicalTrials.gov. The access to the COMPACT database is giventhrough the Web-based application VITTA described in this paper.
3.1. Frequently used eligibility features and trend analysis
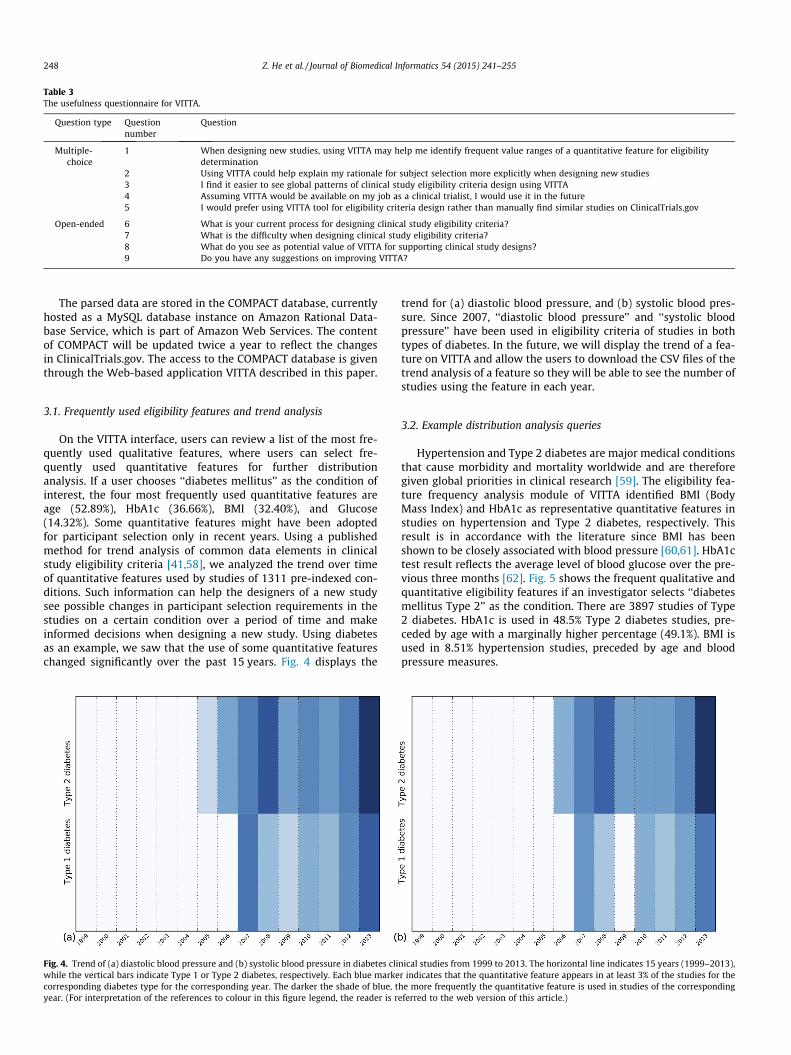
On the VITTA interface, users can review a list of the most fre-quently used qualitative features, where users can select fre-quently used quantitative features for further distributionanalysis. If a user chooses ‘‘diabetes mellitus’’ as the condition ofinterest, the four most frequently used quantitative features areage (52.89%), HbA1c (36.66%), BMI (32.40%), and Glucose(14.32%). Some quantitative features might have been adoptedfor participant selection only in recent years. Using a publishedmethod for trend analysis of common data elements in clinicalstudy eligibility criteria [41,58], we analyzed the trend over timeof quantitative features used by studies of 1311 pre-indexed con-ditions. Such information can help the designers of a new studysee possible changes in participant selection requirements in thestudies on a certain condition over a period of time and makeinformed decisions when designing a new study. Using diabetesas an example, we saw that the use of some quantitative featureschanged significantly over the past 15 years. Fig. 4 displays the
Fig. 4. Trend of (a) diastolic blood pressure and (b) systolic blood pressure in diabetes cliwhile the vertical bars indicate Type 1 or Type 2 diabetes, respectively. Each blue markecorresponding diabetes type for the corresponding year. The darker the shade of blue, tyear. (For interpretation of the references to colour in this figure legend, the reader is r
trend for (a) diastolic blood pressure, and (b) systolic blood pres-sure. Since 2007, ‘‘diastolic blood pressure’’ and ‘‘systolic bloodpressure’’ have been used in eligibility criteria of studies in bothtypes of diabetes. In the future, we will display the trend of a fea-ture on VITTA and allow the users to download the CSV files of thetrend analysis of a feature so they will be able to see the number ofstudies using the feature in each year.
3.2. Example distribution analysis queries
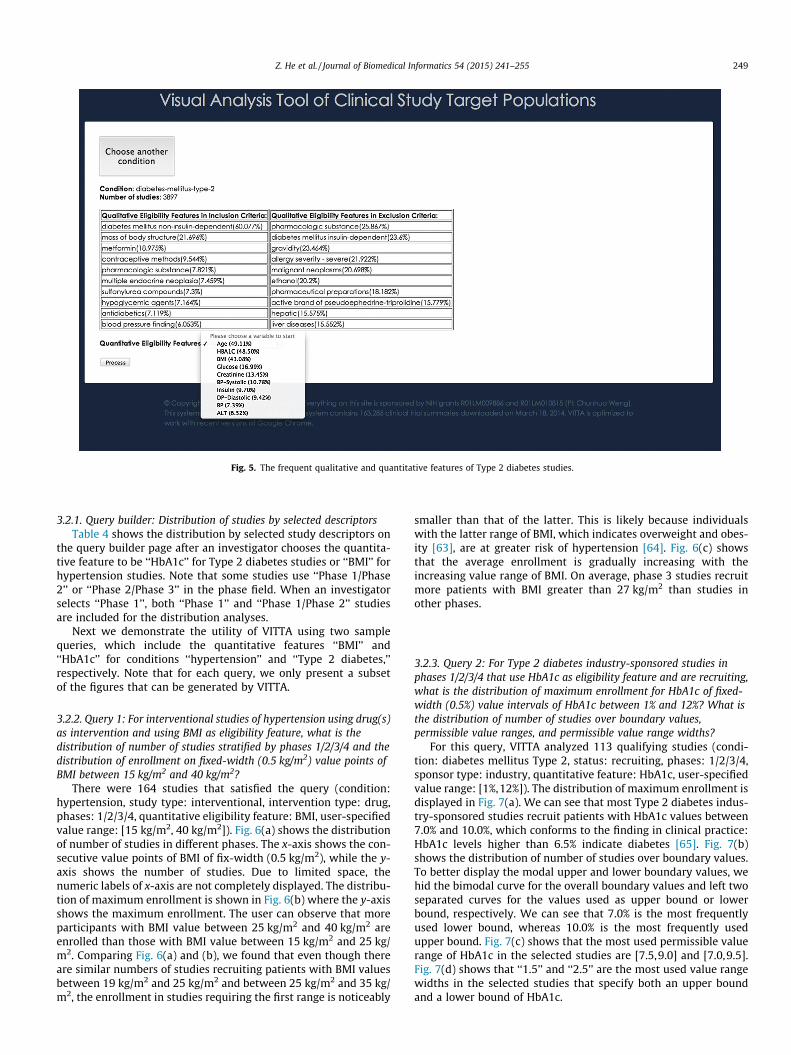
Hypertension and Type 2 diabetes are major medical conditionsthat cause morbidity and mortality worldwide and are thereforegiven global priorities in clinical research [59]. The eligibility fea-ture frequency analysis module of VITTA identified BMI (BodyMass Index) and HbA1c as representative quantitative features instudies on hypertension and Type 2 diabetes, respectively. Thisresult is in accordance with the literature since BMI has beenshown to be closely associated with blood pressure [60,61]. HbA1ctest result reflects the average level of blood glucose over the pre-vious three months [62]. Fig. 5 shows the frequent qualitative andquantitative eligibility features if an investigator selects ‘‘diabetesmellitus Type 2’’ as the condition. There are 3897 studies of Type2 diabetes. HbA1c is used in 48.5% Type 2 diabetes studies, pre-ceded by age with a marginally higher percentage (49.1%). BMI isused in 8.51% hypertension studies, preceded by age and bloodpressure measures.
nical studies from 1999 to 2013. The horizontal line indicates 15 years (1999–2013),r indicates that the quantitative feature appears in at least 3% of the studies for thehe more frequently the quantitative feature is used in studies of the correspondingeferred to the web version of this article.)
Fig. 5. The frequent qualitative and quantitative features of Type 2 diabetes studies.
Z. He et al. / Journal of Biomedical Informatics 54 (2015) 241–255 249
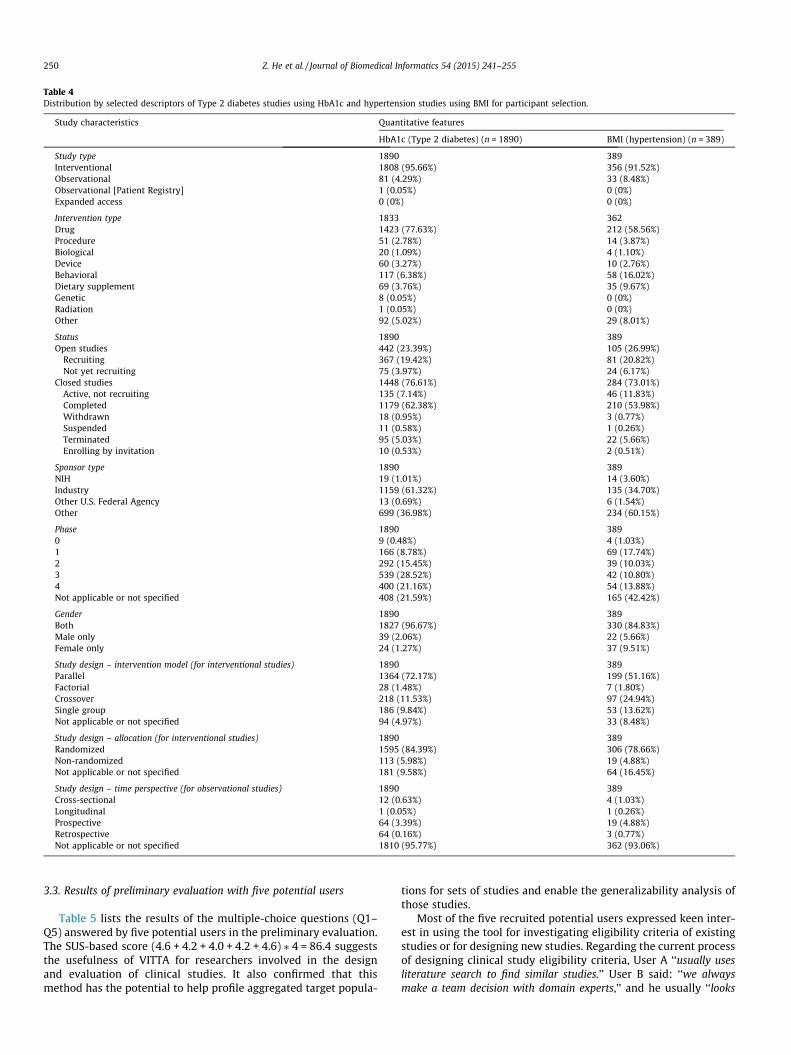
3.2.1. Query builder: Distribution of studies by selected descriptorsTable 4 shows the distribution by selected study descriptors on
the query builder page after an investigator chooses the quantita-tive feature to be ‘‘HbA1c’’ for Type 2 diabetes studies or ‘‘BMI’’ forhypertension studies. Note that some studies use ‘‘Phase 1/Phase2’’ or ‘‘Phase 2/Phase 3’’ in the phase field. When an investigatorselects ‘‘Phase 1’’, both ‘‘Phase 1’’ and ‘‘Phase 1/Phase 2’’ studiesare included for the distribution analyses.
Next we demonstrate the utility of VITTA using two samplequeries, which include the quantitative features ‘‘BMI’’ and‘‘HbA1c’’ for conditions ‘‘hypertension’’ and ‘‘Type 2 diabetes,’’respectively. Note that for each query, we only present a subsetof the figures that can be generated by VITTA.
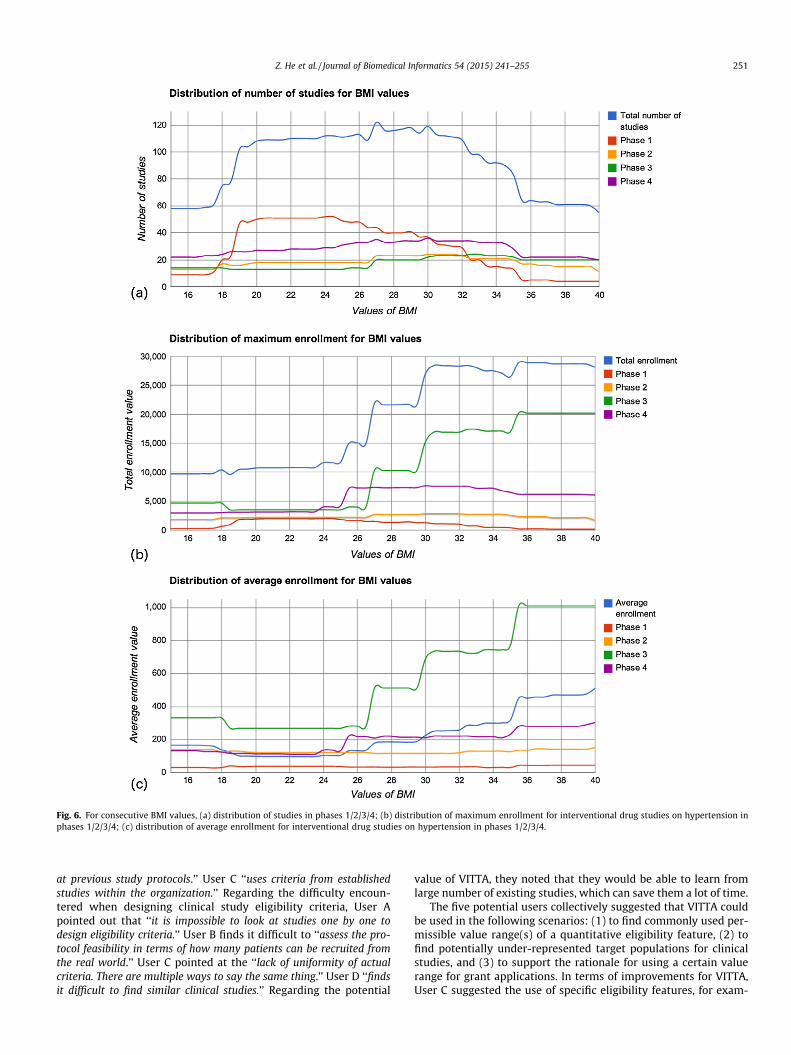
3.2.2. Query 1: For interventional studies of hypertension using drug(s)as intervention and using BMI as eligibility feature, what is thedistribution of number of studies stratified by phases 1/2/3/4 and thedistribution of enrollment on fixed-width (0.5 kg/m2) value points ofBMI between 15 kg/m2 and 40 kg/m2?
There were 164 studies that satisfied the query (condition:hypertension, study type: interventional, intervention type: drug,phases: 1/2/3/4, quantitative eligibility feature: BMI, user-specifiedvalue range: [15 kg/m2, 40 kg/m2]). Fig. 6(a) shows the distributionof number of studies in different phases. The x-axis shows the con-secutive value points of BMI of fix-width (0.5 kg/m2), while the y-axis shows the number of studies. Due to limited space, thenumeric labels of x-axis are not completely displayed. The distribu-tion of maximum enrollment is shown in Fig. 6(b) where the y-axisshows the maximum enrollment. The user can observe that moreparticipants with BMI value between 25 kg/m2 and 40 kg/m2 areenrolled than those with BMI value between 15 kg/m2 and 25 kg/m2. Comparing Fig. 6(a) and (b), we found that even though thereare similar numbers of studies recruiting patients with BMI valuesbetween 19 kg/m2 and 25 kg/m2 and between 25 kg/m2 and 35 kg/m2, the enrollment in studies requiring the first range is noticeably
smaller than that of the latter. This is likely because individualswith the latter range of BMI, which indicates overweight and obes-ity [63], are at greater risk of hypertension [64]. Fig. 6(c) showsthat the average enrollment is gradually increasing with theincreasing value range of BMI. On average, phase 3 studies recruitmore patients with BMI greater than 27 kg/m2 than studies inother phases.
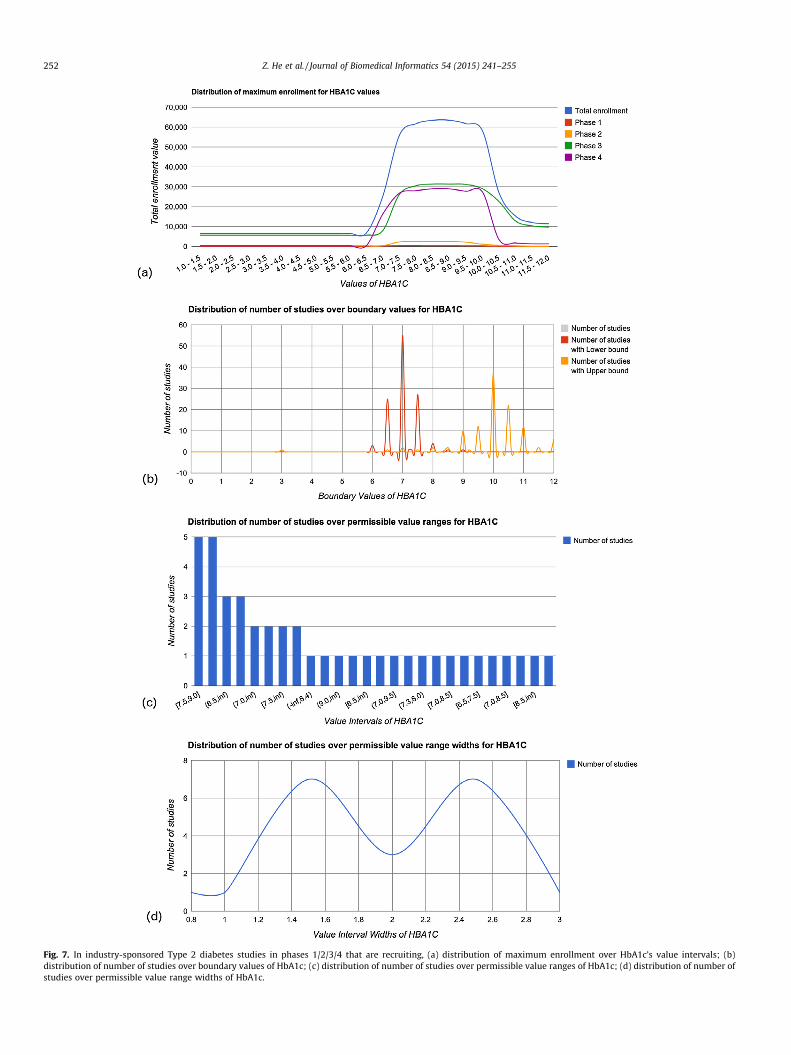
3.2.3. Query 2: For Type 2 diabetes industry-sponsored studies inphases 1/2/3/4 that use HbA1c as eligibility feature and are recruiting,what is the distribution of maximum enrollment for HbA1c of fixed-width (0.5%) value intervals of HbA1c between 1% and 12%? What isthe distribution of number of studies over boundary values,permissible value ranges, and permissible value range widths?
For this query, VITTA analyzed 113 qualifying studies (condi-tion: diabetes mellitus Type 2, status: recruiting, phases: 1/2/3/4,sponsor type: industry, quantitative feature: HbA1c, user-specifiedvalue range: [1%,12%]). The distribution of maximum enrollment isdisplayed in Fig. 7(a). We can see that most Type 2 diabetes indus-try-sponsored studies recruit patients with HbA1c values between7.0% and 10.0%, which conforms to the finding in clinical practice:HbA1c levels higher than 6.5% indicate diabetes [65]. Fig. 7(b)shows the distribution of number of studies over boundary values.To better display the modal upper and lower boundary values, wehid the bimodal curve for the overall boundary values and left twoseparated curves for the values used as upper bound or lowerbound, respectively. We can see that 7.0% is the most frequentlyused lower bound, whereas 10.0% is the most frequently usedupper bound. Fig. 7(c) shows that the most used permissible valuerange of HbA1c in the selected studies are [7.5,9.0] and [7.0,9.5].Fig. 7(d) shows that ‘‘1.5’’ and ‘‘2.5’’ are the most used value rangewidths in the selected studies that specify both an upper boundand a lower bound of HbA1c.
Table 4Distribution by selected descriptors of Type 2 diabetes studies using HbA1c and hypertension studies using BMI for participant selection.
Gender 1890 389Both 1827 (96.67%) 330 (84.83%)Male only 39 (2.06%) 22 (5.66%)Female only 24 (1.27%) 37 (9.51%)
Study design – intervention model (for interventional studies) 1890 389Parallel 1364 (72.17%) 199 (51.16%)Factorial 28 (1.48%) 7 (1.80%)Crossover 218 (11.53%) 97 (24.94%)Single group 186 (9.84%) 53 (13.62%)Not applicable or not specified 94 (4.97%) 33 (8.48%)
Study design – allocation (for interventional studies) 1890 389Randomized 1595 (84.39%) 306 (78.66%)Non-randomized 113 (5.98%) 19 (4.88%)Not applicable or not specified 181 (9.58%) 64 (16.45%)
Study design – time perspective (for observational studies) 1890 389Cross-sectional 12 (0.63%) 4 (1.03%)Longitudinal 1 (0.05%) 1 (0.26%)Prospective 64 (3.39%) 19 (4.88%)Retrospective 64 (0.16%) 3 (0.77%)Not applicable or not specified 1810 (95.77%) 362 (93.06%)
250 Z. He et al. / Journal of Biomedical Informatics 54 (2015) 241–255
3.3. Results of preliminary evaluation with five potential users
Table 5 lists the results of the multiple-choice questions (Q1–Q5) answered by five potential users in the preliminary evaluation.The SUS-based score (4.6 + 4.2 + 4.0 + 4.2 + 4.6) ⁄ 4 = 86.4 suggeststhe usefulness of VITTA for researchers involved in the designand evaluation of clinical studies. It also confirmed that thismethod has the potential to help profile aggregated target popula-
tions for sets of studies and enable the generalizability analysis ofthose studies.
Most of the five recruited potential users expressed keen inter-est in using the tool for investigating eligibility criteria of existingstudies or for designing new studies. Regarding the current processof designing clinical study eligibility criteria, User A ‘‘usually usesliterature search to find similar studies.’’ User B said: ‘‘we alwaysmake a team decision with domain experts,’’ and he usually ‘‘looks
Fig. 6. For consecutive BMI values, (a) distribution of studies in phases 1/2/3/4; (b) distribution of maximum enrollment for interventional drug studies on hypertension inphases 1/2/3/4; (c) distribution of average enrollment for interventional drug studies on hypertension in phases 1/2/3/4.
Z. He et al. / Journal of Biomedical Informatics 54 (2015) 241–255 251
at previous study protocols.’’ User C ‘‘uses criteria from establishedstudies within the organization.’’ Regarding the difficulty encoun-tered when designing clinical study eligibility criteria, User Apointed out that ‘‘it is impossible to look at studies one by one todesign eligibility criteria.’’ User B finds it difficult to ‘‘assess the pro-tocol feasibility in terms of how many patients can be recruited fromthe real world.’’ User C pointed at the ‘‘lack of uniformity of actualcriteria. There are multiple ways to say the same thing.’’ User D ‘‘findsit difficult to find similar clinical studies.’’ Regarding the potential
value of VITTA, they noted that they would be able to learn fromlarge number of existing studies, which can save them a lot of time.
The five potential users collectively suggested that VITTA couldbe used in the following scenarios: (1) to find commonly used per-missible value range(s) of a quantitative eligibility feature, (2) tofind potentially under-represented target populations for clinicalstudies, and (3) to support the rationale for using a certain valuerange for grant applications. In terms of improvements for VITTA,User C suggested the use of specific eligibility features, for exam-
Fig. 7. In industry-sponsored Type 2 diabetes studies in phases 1/2/3/4 that are recruiting, (a) distribution of maximum enrollment over HbA1c’s value intervals; (b)distribution of number of studies over boundary values of HbA1c; (c) distribution of number of studies over permissible value ranges of HbA1c; (d) distribution of number ofstudies over permissible value range widths of HbA1c.
252 Z. He et al. / Journal of Biomedical Informatics 54 (2015) 241–255
Table 5The usefulness evaluation results (see Table 3 for the questions).
Question number Average score Strongly agree (5) (%) Agree (4) (%) Neutral (3) Disagree (2) Strongly disagree (1)
Z. He et al. / Journal of Biomedical Informatics 54 (2015) 241–255 253
ple, ‘‘pharmacologic substance’’ should be replaced with more spe-cific substance concepts. User E suggested aligning the workflowwith the development process of clinical studies.
4. Discussion
Our results confirmed the feasibility and usefulness of profilingthe quantitative eligibility features of the target populations of setsof clinical studies. When complemented by similar work on quali-tative features, our approach promises to enhance the ability tocharacterize, understand, and improve clinical research generaliz-ability. Our preliminary evaluation suggests that our method hasthe potential to improve the accessibility of design patterns in eli-gibility criteria through a global view of sets of clinical studies withcommon characteristics. It is laborious and sometimes impossibleto obtain such a global view through manual review of many clin-ical study summaries.
Our method also establishes a highly desirable prerequisite forgeneralizability analyses of sets of clinical studies, which involvecomparisons between target populations and real-world patientpopulations. A data-driven analytical system such as VITTA profilesthe distribution of the collective target populations in multipleexisting studies along the value spectrum of a selected quantitativeeligibility feature, and can potentially guide the participant selec-tion of future studies in an interactive fashion. Stakeholders of clin-ical trials can use VITTA to detect potential hidden eligibilitycriteria design biases towards certain population subgroups atthe clinical research community level. For example, if most Type2 diabetes mellitus trials require eligible patients to have theirA1c equal to or above 7%, investigation may be warranted to justifywhy those patients whose A1c values are between 6.5% and 7% arenot considered for these trials. In the clinical trials research com-munity, thresholds for blood pressure (e.g., 120 mmHg vs.140 mmHg) for defining hypertension or thresholds for A1c fordefining pre-diabetic and diabetic population are still openresearch topics. Tools like VITTA can effectively make transparentthe collective design trends among clinical trial designers.Although we chose only two common conditions and their repre-sentative quantitative features to illustrate our analytical frame-work, VITTA is designed to support distribution analyses of anyquantitative feature of selected studies of any condition assumingthat the names and measurement units of all correspondingnumeric expressions are correctly recognized and parsed. Themodular design of VITTA enables flexible customization of eachmodule for different tasks. For example, the core of the visualiza-tion module can be replaced by D3 JavaScript library with moreinteractive functionalities than Google Charts API. As summaryresults of more and more studies are added to ClinicalTrials.gov[66], we imagine that systematic reviewers could use VITTA toidentify studies of interest and to profile their target populationsor study populations.
4.1. Limitations
Quite a number of limitations are noteworthy in interpretingthis study. One caveat is that the current version of the quantita-
tive feature extraction tool Valx [48] employed by this study needsmore formal evaluation and further improvement. Currently, eventhough we have filtered out many meaningless tags using pre-defined heuristics, the complexity and heterogeneity of free-texteligibility criteria makes it a daunting task to unify all the quanti-tative eligibility feature names and all the different measurementunits of a quantitative feature. In the future, we need more scalablesolutions to improve the accuracy of numeric expression parsingfor other quantitative features. In spite of the need to improvethe accuracy of the natural language processing (NLP) techniquesemployed, instead of waiting for perfect NLP techniques, we pre-sented this novel use of ‘‘good-enough’’ NLP results of clinical trialsummaries to motivate more NLP researchers to join our efforts inextracting patterns from eligibility criteria text. The modulardesign of VITTA makes it easy to provide more accurate distribu-tion analysis results when more accurate parsing results areupdated in the COMPACT database.
Another limitation is that our method was designed specificallyfor ClinicalTrials.gov, which does not include all studies world-wide. Studies that are not subject to US law may be registered onlyin the relevant countries. Many international studies registered intheir corresponding countries are included in the InternationalClinical Trials Registry Platform (ICTRP) [67] managed by theWorld Health Organization. Nevertheless, about 80% of studies inICTRP were also registered in ClinicalTrials.gov [23], indicating thatour analytical framework includes the majority of clinical studysummaries available on the Internet.
Many studies may have partial or condensed eligibility criteriaentered in ClinicalTrials.gov [68]. For some conditions, there mightnot be a representative quantitative feature to profile clinical studytarget populations. When indexing studies for a condition, thestudies returned from ClinicalTrials.gov might include studies ofa similar but not the same condition. For example, a search on con-dition ‘‘hypertension’’ will also retrieve studies on ‘‘pulmonaryhypertension’’ which is a different condition from hypertension(high blood pressure). According to COMPACT, about 40% studiesin ClinicalTrials.gov did not specify their study phases. When a userselects studies of a certain phase, some studies might be left outbecause the phase information is not available or applicable. Wheninterpreting the distribution analysis results generated by VITTA,the limitations in ClinicalTrials.gov itself should be taken intoaccount.
The last major limitation is that ClinicalTrials.gov defines onlyone field for ‘‘enrollment’’, which is initially used to indicate antic-ipated enrollment before study starts but later used to indicate theactual enrollment after the completion of the study. Therefore, themeaning of this data field is not stable throughout the study. Wesuggest that both anticipated enrollment and actual enrollmentbe reported separately for comparing the difference between targetpopulations and actually enrolled patient populations. This is adesign that can be incorporated to improve ClinicalTrials.gov.
4.2. Ongoing and future work
Our future work along this line will focus on adding more studydescriptors of VITTA for selecting studies, e.g., interventions, spon-
254 Z. He et al. / Journal of Biomedical Informatics 54 (2015) 241–255
sors, locations, etc. Currently, it only stratifies the distribution ofstudies or enrollment by phase. In the future, it will support studystratification using other study descriptors, e.g., study design,recruiting status, etc. To test the feasibility of this system, werecruited only a convenience sample of a small number of potentialusers to evaluate the usefulness of VITTA. In the future, a larger andmore comprehensive evaluation with clinical investigators andsponsors from both academia and industry can provide moreinsights into their needs for the analysis of clinical study targetpopulations. We also acknowledge the limitation in profiling targetpopulations using only one quantitative feature each time. There-fore, we are investigating analytical methods for profiling targetpopulations using multiple eligibility features simultaneously.After incorporating the data of real patients, we also plan to ana-lyze how the application order of eligibility criteria would affectthe cohort size, which might provide actionable knowledge toaccelerate patient recruitment.
5. Conclusions
We contribute a novel method for profiling the collective targetpopulations of sets of studies registered in ClinicalTrials.gov basedon quantitative eligibility features extracted from free-text eligibil-ity criteria. The Web-based system VITTA enables interactive dis-tribution analyses and visualization of frequently used eligibilityfeatures. Our preliminary evaluation with a small number ofpotential users demonstrated the potential of VITTA for improvingthe transparency for participant selection for clinical research. Thismethod can also potentially help clinical trialists, patients, spon-sors, and policy makers identify global patterns in eligibility crite-ria in studies registered in ClinicalTrials.gov. In the future we willconduct more evaluation studies to assess how VITTA can supportpatient-centered outcomes research and improve the usability andutility of VITTA based on user feedback accordingly.
Funding
This study is sponsored by Grants R01LM009886 from the Uni-ted States National Library of Medicine (PI: Weng) and UL1TR000040 from the United States National Center for AdvancingTranslational Sciences (PI: Ginsberg).
Contributions of authors
All authors meet the ICMJE criteria for authorship. ZH per-formed system development, analysis and interpretation of data,and drafting of the manuscript. SC and IS participated in the systemdesign and edited the manuscript critically. CW conceptualizedand directed the research and made significant methodology con-tributions and edits to this paper.
Ethics approval
The Columbia University Medical Center Institutional ReviewBoard approved the study.
Acknowledgments
We thank Dr. Tianyong Hao for providing Valx for extractingand parsing numeric expressions from free-text eligibility criteria,Dr. Riccardo Miotto for helping us mine frequent qualitative eligi-bility features and for analyzing the trends of quantitative eligibil-ity features, and potential users, Drs. Melissa Stockwell, CarlosLopez-Jimenez, John Cai, Michael Cantor, and Po-Yin Yen for pro-viding feedback regarding the value and usability of VITTA.
References
[1] From the NIH director: the importance of clinical trials. <http://www.nlm.nih.gov/medlineplus/magazine/issues/summer11/articles/summer11pg2-3.html>[09.04.14].
[2] Somerson JS, Bhandari M, Vaughan CT, Smith CS, Zelle BA. Lack of diversity inorthopaedic trials conducted in the United States. J Bone Joint Surg Am2014;96(7):e56.
[3] Rodriguez MI, Gordon-Maclean C. The safety, efficacy and acceptability of tasksharing tubal sterilization to midlevel providers: a systematic review.Contraception 2014;89(6):504–11.
[4] Blanco C, Olfson M, Goodwin RD, Ogburn E, Liebowitz MR, Nunes EV, et al.Generalizability of clinical trial results for major depression to communitysamples: results from the National Epidemiologic Survey on Alcohol andRelated Conditions. J Clin Psychiatr 2008;69(8):1276–80.
[5] Hamann GF. Early ischemic signs should not be used as exclusion criteria inthrombolysis trials. Stroke 2004;35(1):e3–4.
[6] Hoertel N, Le Strat Y, De Maricourt P, Limosin F, Dubertret C. Are subjects intreatment trials of panic disorder representative of patients in routine clinicalpractice? Results from a national sample. J Affect Disorders2013;146(3):383–9.
[7] Hoertel N, Le Strat Y, Lavaud P, Dubertret C, Limosin F. Generalizability ofclinical trial results for bipolar disorder to community samples: findings fromthe National Epidemiologic Survey on Alcohol and Related Conditions. J ClinPsychiatr 2013;74(3):265–70.
[8] Hoertel N, Le Strat Y, Limosin F, Dubertret C, Gorwood P. Prevalence ofsubthreshold hypomania and impact on internal validity of RCTs for majordepressive disorder: results from a national epidemiological sample. PLoS One2013;8(2):e55448.
[9] Humphreys K, Maisel NC, Blodgett JC, Finney JW. Representativeness ofpatients enrolled in influential clinical trials: a comparison of substancedependence with other medical disorders. J Stud Alcohol Drugs2013;74(6):889–93.
[10] Okuda M, Hasin DS, Olfson M, Khan SS, Nunes EV, Montoya I, et al.Generalizability of clinical trials for cannabis dependence to communitysamples. Drug Alcohol Depen 2010;111(1–2):177–81.
[11] Ronconi JM, Shiner B, Watts BV. Inclusion and exclusion criteria in randomizedcontrolled trials of psychotherapy for PTSD. J Psychiatr Pract2014;20(1):25–37.
[12] Schmidt AF, Groenwold RHH, van Delden JJM, van der Does Y, Klungel OH, RoesKCB, et al. Justification of exclusion criteria was underreported in a review ofcardiovascular trials. J Clin Epidemiol 2014;67(6):635–44.
[13] Schneider LS, Olin JT, Lyness SA, Chui HC. Eligibility of Alzheimer’s diseaseclinic patients for clinical trials. J Am Geriatr Soc 1997;45(8):923–8.
[14] Zimmermann JB, Horscht JJ, Weigand MA, Bruckner T, Martin EO, Hoppe-TichyT, et al. Patients enrolled in randomised clinical trials are not representative ofcritically ill patients in clinical practice. Observational study focus ontigecycline. Int J Antimicrob Agents 2013;42(5):436–42.
[15] Zimmerman M, Chelminski I, Posternak MA. Exclusion criteria used inantidepressant efficacy trials: consistency across studies andrepresentativeness of samples included. J Nerv Ment Dis 2004;192:87–94.
[16] Schoenmaker N, Van Gool WA. The age gap between patients in clinical studiesand in the general population: a pitfall for dementia research. Lancet Neurol2004;3(10):627–30.
[17] Hao T, Rusanov A, Boland MR, Weng C. Clustering clinical trials with similareligibility criteria features. J Biomed Inform 2014. pii: S1532-0464(14)00011-2.
[18] NCATS. NCATS Advisory Council Working Group on the IOM Report: The CTSAProgram at NIH. 2014; May 16, 2014.
[19] Milian K, Bucur A, Harmelen FV. Building a library of eligibility criteria tosupport design of clinical trials. Knowl Eng Knowl Manage Lect Notes ComputSci 2012;7603:327–36.
[20] ClinicalTrials.gov. <http://www.clinicaltrials.gov/> [February 2014].[21] History, Policies, and Laws of ClinicalTrials.gov. <http://www.clinicaltrials.gov/
ct2/about-site/history> [09.04.14].[22] Tasneem A, Aberle L, Ananth H, Chakraborty S, Chiswell K, McCourt BJ, et al.
The database for Aggregate Analysis of ClinicalTrials.gov (AACT) andsubsequent regrouping by clinical specialty. PLoS ONE 2012;7(3):e33677.
[23] Goswami ND, Pfeiffer CD, Horton JR, Chiswell K, Tasneem A, Tsalik EL. The stateof infectious diseases clinical trials: a systematic review of ClinicalTrials.gov.PLoS One 2013;8(10):e77086.
[24] Hirsch BR, Califf RM, Cheng SK, Tasneem A, Horton J, Chiswell K, et al.Characteristics of oncology clinical trials: insights from a systematic analysisof ClinicalTrials.gov. JAMA. Intern Med 2013;173(11):972–9.
[25] Lakey WC, Barnard K, Batch BC, Chiswell K, Tasneem A, Green JB. Are currentclinical trials in diabetes addressing important issues in diabetes care?Diabetologia 2013;56(6):1226–35.
[26] Ross J, Tu S, Carini S, Sim I. Analysis of eligibility criteria complexity in clinicaltrials. AMIA Summits Transl Sci Proc 2010;2010:46–50.
[27] Overby CL, Pathak J, Haerian K, Perotte A, Murphy S, Bruce K, et al. Acollaborative approach to develop an electronic health record phenotypingalgorithm for drug-induced liver injury. J Am Med Inform Assoc2013;20:e243–52.
[28] Miotto R, Weng C. Unsupervised mining of frequent tags for clinical eligibilitytext indexing. J Biomed Inform 2013;46(6):1145–51.
Z. He et al. / Journal of Biomedical Informatics 54 (2015) 241–255 255
[29] Miotto R, Jiang S, Weng C. ETACTS: a method for dynamically filtering clinicaltrial search results. J Biomed Inform 2013;46(6):1060–7.
[30] Boland MR, Miotto R, Weng C. A method for probing disease relatedness usingcommon clinical eligibility criteria. Stud Health Technol Inform2013;192:481–5.
[31] Hao T, Rusanov A, Weng C. Extracting and normalizing temporal expressionsin clinical data requests from researchers. In: International conference forsmart health, Lecture notes in computer science, vol. 8040; 2013. p. 41–51.
[32] Boland MR, Miotto R, Gao J, Weng C. Feasibility of feature-based indexing,clustering, and search of clinical trials. A case study of breast cancer trials fromClinicalTrials.gov. Methods Inf Med 2013;52(5):382–94.
[33] Luo Z, Miotto R, Weng C. A human-computer collaborative approach toidentifying common data elements in clinical trial eligibility criteria. J BiomedInform 2013;46(1):33–9.
[34] Weng C, Wu X, Luo Z, Boland MR, Theodoratos D, Johnson SB. EliXR: anapproach to eligibility criteria extraction and representation. J Am Med InformAssoc 2011;18(Suppl. 1):i116–24.
[35] Luo Z, Yetisgen-Yildiz M, Weng C. Dynamic categorization of clinical researcheligibility criteria by hierarchical clustering. J Biomed Inform2011;44(6):927–35.
[36] Luo Z, Johnson SB, Lai AM, Weng C. Extracting temporal constraints fromclinical research eligibility criteria using conditional random fields. AMIAAnnu Symp Proc 2011;2011:843–52.
[37] Boland MR, Tu SW, Carini S, Sim I, Weng C. EliXR-TIME: a temporal knowledgerepresentation for clinical research eligibility criteria. AMIA Summits TranslSci Proc 2012;2012:71–80.
[38] Weng C, Tu SW, Sim I, Richesson R. Formal representation of eligibility criteria:a literature review. J Biomed Inform 2010;43(3):451–67.
[39] Luo Z, Johnson SB, Weng C. Semi-automatically inducing semantic classes ofclinical research eligibility criteria using UMLS and hierarchical clustering.AMIA Annu Symp Proc 2010;2010:487–91.
[40] Luo Z, Duffy R, Johnson S, Weng C. Corpus-based approach to creating asemantic lexicon for clinical research eligibility criteria from UMLS. AMIASummits Transl Sci Proc 2010;2010:26–30.
[41] Weng C, Yaman A, Lin K, He Z. Trend and network analysis of commoneligibility features for cancer trials in ClinicalTrials.gov. In: Internationalconference for smart health, Lecture notes in computer science, vol. 8549;2014. p. 130–41.
[42] He Z, Carini S, Hao T, Sim I, Weng C. A method for analyzing commonalities inclinical trial target populations. AMIA Annu Symp Proc 2014;2014:1777–86.
[43] Weng C, Li Y, Ryan P, Zhang Y, Gao J, Liu F, et al. A distribution-based methodfor assessing the differences between clinical trial target populations andpatient populations in electronic health records. Appl Clin Inform2014;5(2):463–79.
[44] Abousalh-Neto NA, Kazgan S, editors. Big data exploration through visualanalytics. In: 2012 IEEE conference on visual analytics science and technology.Seattle (WA); 2012.
[45] Simpao AF, Ahumada LM, Galvez JA, Rehman MA. A review of analytics andclinical informatics in health care. J Med Syst 2014;38(4):45.
[47] Gotz D, Wang F, Perer A. A methodology for interactive mining and visualanalysis of clinical event patterns using electronic health record data. J BiomedInform 2014;48:148–59.
[48] Hao T, Weng C. Valx – numeric expression extraction and normalization tool;2013. <http://columbiaelixr.appspot.com/valx> [February 2014].
[49] NLM. List of medical conditions in ClinicalTrials.gov. <http://www.clinicaltrials.gov/ct2/search/browse?brwse=cond_alpha_all> [March 2014].
[50] How to find studies by topic or on a map in ClinicalTrials.gov. <https://clinicaltrials.gov/ct2/help/how-find/browse#Topic> [August 2014].
[51] WebMD homepage. <http://www.webmd.com/> [May 2014].[52] WHO homepage. <http://www.who.int/> [May 2014].[53] Bodenreider O. The Unified Medical Language System (UMLS): integrating
biomedical terminology. Nucl Acids Res 2004;32:D267–70 (Database issue).[54] Google Charts API homepage. <https://developers.google.com/chart/>
[07.04.14].[55] Jamieson S. Likert scales: how to (ab)use them. Med Educ
2004;38(12):1217–8.[56] Brooke J. SUS. a ‘quick and dirty’ usability scale. In: Jordan PW, Thomas B,
McClelland IL, Weerdmeester BA, editors. Usability evaluation inindustry. London: Taylor and Francis; 1996. p. 189–94.
[57] Bangor A, Kortum P, Miller J. Determining what individual SUS scores mean:adding an adjective rating scale. J Usability Stud 2009;4:114–23.
[58] Weng C. Temporal knowledge acquisition from clinical research documents forcommunity-based clinical research data standards development. In: 2014AMIA joint summits on translational science. Podium abstract; 2014.
[59] WHO. Burden: mortality, morbidity and risk factors. Global status report onnoncommunicable diseases 2010; 2011.
[60] Egan BM, Zhao Y, Axon RN. US trends in prevalence, awareness, treatment, andcontrol of hypertension, 1988–2008. JAMA 2010;303(20):2043–50.
[61] Abu-Saad K, Chetrit A, Eilat-Adar S, Alpert G, Atamna A, Gillon-Keren M, et al.Blood pressure level and hypertension awareness and control differ by maritalstatus, sex, and ethnicity: a population-based study. Am J Hypertens 2014.
[62] MedlinePlus. <http://www.nlm.nih.gov/medlineplus/> [February 2014].[63] NHLBI. Range of body mass index. <https://http://www.nhlbi.nih.gov/
guidelines/obesity/BMI/bmicalc.htm> [April 2014].[64] Foulds HJ, Bredin SS, Warburton DE. The relationship between hypertension
and obesity across different ethnicities. J Hypertens 2012;20(2):359–67.[65] HbA1c value range. <http://www.webmd.com/diabetes/guide/glycated-
hemoglobin-test-hba1c> [February 2014].[66] Hudson KL, Collins FS. Sharing and reporting the results of clinical trials. JAMA
2015;313(4):355–6.[67] International Clinical Trials Registry Platform (ICTRP) Homepage. <http://
www.who.int/ictrp/en/> [09.04.14].[68] Bhattacharya S, Cantor MN. Analysis of eligibility criteria representation in


![ZHE LIU, arXiv:2007.06842v1 [cs.CV] 14 Jul 2020](https://static.documents.pub/doc/80x56/61d290036fb7cc4f6563ae84/zhe-liu-arxiv200706842v1-cscv-14-jul-2020.jpg)


