COMPARISON OF THE RESULTS OF PUMPING AND TRACER TESTS IN A KARST TERRAIN ALIREZA NASSIMI AND ZARGHAM MOHAMMADI* Department of Earth Sciences, Shiraz University, Faculty of Science, Adabiat Crossroads, 7146713565; Shiraz, Fars Province, Iran Abstract: Pumping and tracer tests are commonly used to measure aquifer parameters such as hydraulic conductivity. Hydraulic conductivity is, however, difficult to characterize; especially in heterogeneous karst terrain. In this research, results of pumping and tracer tests are combined to determine hydraulic conductivities of the karst terrain at the Salman Farsi Dam Site. Pumping test data were analyzed by dual-porosity analytical models. The tracer tests were used to determine seepage velocities based on the assump‐ tion of Darcy’s law, with calculated Reynolds numbers consistent with laminar flow. Geometric means of the hydraulic conductivities calculated from tracer tests were consistently higher than results derived from pumping tests. Movement of injected dye in a natural groundwater flow system is strongly controlled by preferential flow paths; therefore the estimated hydraulic conductivity is mainly affected by major dissolution openings. However, estimated hydraulic conductivity based on the pumping-test data is representative of the average hydraulic conductivity. In addition, Lugeon (or packer) tests were used to delineate the distribution of hydraulic conductivity within three boreholes. INTRODUCTION Aquifers in karst terrains are generally heterogeneous, anisotropic, and complex. These aquifers have an intercon- nected array of fractures and dissolution routes (Cacas et al., 1990; Hestir and Long, 1990). The dual-porosity model is an effective tool for modeling karst systems (Kovács and Sauter, 2007). The dual-porosity model was initially pro- posed by Barenblatt et al. (1960) and developed in detail by Streltsova-Adams (1978) and Gringarten (1982). The het- erogeneity of karst aquifers, where solutional pathways have orders-of-magnitude higher hydraulic conductivity than the surrounding matrix porosity, requires careful application of analytical tools. A pumping test induces a perturbation to an aquifer by pumping from a well, while at the same time measuring aquifer responses in the form of head variations (Renard et al., 2009). Selection of appropriate analytical and numer- ical models is a key part of calculating the hydraulic char‐ acteristics, such as hydraulic conductivity, transmissibility, and storage coefficient, of the aquifer (Renard et al., 2009). Hydrodynamic coefficients of aquifers in water resource studies vary of many orders of magnitude, and small errors in the calculation of these coefficients can produce errors of several orders of magnitude in budgets and numerical models of groundwater. Pumping tests do, however, directly produce results for transmissivity and storage, which are the key factors in groundwater studies (Drew and Goldscheider, 2007). A simultaneous plot of the drawdown and the log‐ arithmic derivative of the drawdown as a function of time in a log-log scale is called a diagnostic plot (Bourdet et al., 1983). A conceptual model for interpretation of the pumping test data is selected based on the diagnostic plot technique combined with knowledge of the local geology (Samani et al., 2006; Renard et al., 2009; Hammond and Field, 2014). The major advantage of diagnostic plots is that they provide a unified procedure to interpret pumping test data (Renard et al., 2009). The main limitation of the drawdown derivative approach to unsteady test analysis is the discrete measurements of drawdown data from indivi- dual times, because the rate of change of drawdown cur- rently cannot be measured directly (Samani et al., 2006). Modern data loggers can produce much better temporal resolution than conventional hand measurements, as well as more consistent vertical resolution. Tracer tests are a powerful tool for determining the origin, movement, and destination of groundwater in hydrogeological investigations, particularly in karst areas (Benischke et al., 2007). In hydrogeology, a tracer is any kind of substance in the water or some other measurable property of the water. It can be used to obtain information on the groundwater flow and impurity transport (Benischke et al., 2007). Through tracer testing, longitudinal and trans- verse dispersivity and the ratio of hydraulic conductivity and effective porosity can be determined (Lee et al., 2003). Tracer tests have many advantages, allowing the direct determination of flow routes and velocities and the determination of the catchment area of springs (Drew and Goldscheider, 2007; Löfgren et al., 2007). Tracer tests do have limitations, especially where no tracer is recovered (negative traces), where tracers from other studies interfere * Corresponding author: [email protected]Alireza Nassimi and Zargham Mohammadi – Comparison of the results of pumping and tracer tests in a karst terrain. Journal of Cave and Karst Studies, v. 78, no. 2, p. 110–118, DOI: 10.4311/2015ES0119 110 . Journal of Cave and Karst Studies, August 2016
Transcript
COMPARISON OF THE RESULTS OF PUMPING ANDTRACER TESTS IN A KARST TERRAIN
ALIREZA NASSIMI AND ZARGHAM MOHAMMADI*
Department of Earth Sciences, Shiraz University, Faculty of Science, Adabiat Crossroads, 7146713565;Shiraz, Fars Province, Iran
Abstract: Pumping and tracer tests are commonly used to measure aquifer parameters suchas hydraulic conductivity. Hydraulic conductivity is, however, difficult to characterize;especially in heterogeneous karst terrain. In this research, results of pumping and tracertests are combined to determine hydraulic conductivities of the karst terrain at theSalman Farsi Dam Site. Pumping test data were analyzed by dual-porosity analyticalmodels. The tracer tests were used to determine seepage velocities based on the assump‐tion of Darcy’s law, with calculated Reynolds numbers consistent with laminar flow.Geometric means of the hydraulic conductivities calculated from tracer tests wereconsistently higher than results derived from pumping tests. Movement of injected dye ina natural groundwater flow system is strongly controlled by preferential flow paths;therefore the estimated hydraulic conductivity is mainly affected by major dissolutionopenings. However, estimated hydraulic conductivity based on the pumping-test data isrepresentative of the average hydraulic conductivity. In addition, Lugeon (or packer) testswere used to delineate the distribution of hydraulic conductivity within three boreholes.
INTRODUCTION
Aquifers in karst terrains are generally heterogeneous,anisotropic, and complex. These aquifers have an intercon-nected array of fractures and dissolution routes (Cacas et al.,1990; Hestir and Long, 1990). The dual-porosity model isan effective tool for modeling karst systems (Kovács andSauter, 2007). The dual-porosity model was initially pro-posed by Barenblatt et al. (1960) and developed in detailby Streltsova-Adams (1978) and Gringarten (1982). The het-erogeneity of karst aquifers, where solutional pathways haveorders-of-magnitude higher hydraulic conductivity than thesurrounding matrix porosity, requires careful applicationof analytical tools.
A pumping test induces a perturbation to an aquifer bypumping from a well, while at the same time measuringaquifer responses in the form of head variations (Renardet al., 2009). Selection of appropriate analytical and numer-ical models is a key part of calculating the hydraulic char‐acteristics, such as hydraulic conductivity, transmissibility,and storage coefficient, of the aquifer (Renard et al., 2009).Hydrodynamic coefficients of aquifers in water resourcestudies vary of many orders of magnitude, and small errorsin the calculation of these coefficients can produce errorsof several orders of magnitude in budgets and numericalmodels of groundwater. Pumping tests do, however, directlyproduce results for transmissivity and storage, which are thekey factors in groundwater studies (Drew and Goldscheider,2007).
A simultaneous plot of the drawdown and the log‐arithmic derivative of the drawdown as a function oftime in a log-log scale is called a diagnostic plot (Bourdet
et al., 1983). A conceptual model for interpretation of thepumping test data is selected based on the diagnostic plottechnique combined with knowledge of the local geology(Samani et al., 2006; Renard et al., 2009; Hammond andField, 2014). The major advantage of diagnostic plots isthat they provide a unified procedure to interpret pumpingtest data (Renard et al., 2009). The main limitation of thedrawdown derivative approach to unsteady test analysis isthe discrete measurements of drawdown data from indivi-dual times, because the rate of change of drawdown cur-rently cannot be measured directly (Samani et al., 2006).Modern data loggers can produce much better temporalresolution than conventional hand measurements, as wellas more consistent vertical resolution.
Tracer tests are a powerful tool for determining theorigin, movement, and destination of groundwater inhydrogeological investigations, particularly in karst areas(Benischke et al., 2007). In hydrogeology, a tracer is anykind of substance in the water or some other measurableproperty of the water. It can be used to obtain informationon the groundwater flow and impurity transport (Benischkeet al., 2007). Through tracer testing, longitudinal and trans-verse dispersivity and the ratio of hydraulic conductivityand effective porosity can be determined (Lee et al., 2003).
Tracer tests have many advantages, allowing thedirect determination of flow routes and velocities and thedetermination of the catchment area of springs (Drew andGoldscheider, 2007; Löfgren et al., 2007). Tracer tests dohave limitations, especially where no tracer is recovered(negative traces), where tracers from other studies interfere
Alireza Nassimi and ZarghamMohammadi – Comparison of the results of pumping and tracer tests in a karst terrain. Journal of Cave andKarst Studies, v. 78, no. 2, p. 110–118, DOI: 10.4311/2015ES0119
110. Journal of Cave and Karst Studies, August 2016
(false positives), where deep hydrogeological settings pro-vide few monitoring points, and where high concentrationsof tracer may impact potable water supplies (Drew andGoldscheider, 2007; Löfgren et al., 2007).
The combined application of pumping and tracer testswas conducted first by De Laguna (1970) in a two-layeredsandy aquifer where a forced gradient tracer test was usedto determine what proportion of the pumped water wascoming from each sandy aquifer. Later applications of thisdual method include Dann et al. (2008) in a channelizedaquifer and Thorbjarnarson et al. (1998) in a stratified aqui-fer, who showed higher hydraulic conductivity values fromtracer tests in comparison to pumping tests, though studiesby Niemann and Rovey (2000) in an area of glacial out‐wash and by Rovey and Niemann (2005) under laboratoryconditions in a sand tank have shown the opposite result.Vandenbohede and Lebbe (2003), in a phreatic coastal plainaquifer, found good agreement between pumping and tracertests. Given the dual porosity common in karst terrains,a combined pumping and tracer tests allow evaluation ofhydraulic conductivities in solutional conduits within theaquifer matrix. Tracer tests directly measure the ground-water flow velocity better by taking into account andcompensating for heterogeneity (Vandenbohede and Lebbe,2003; Drew and Goldscheider, 2007).
Technical projects in a karst terrain normally face cru-cial technical, managerial, and political challenges due tothe complexity of the karst environment. Some engineeringproblems in karst environments are caused by the presenceof caverns, sinkholes, shafts, and other preferential flowpaths that influence groundwater hydraulics (Milanovic,2002; Parise et al., 2008, 2015a; Gutiérrez et al., 2014).
The objectives of this research were the comparison ofthe hydraulic-conductivity values derived from pumping
and tracer tests and the evaluation of the effect of karst devel-opment on the values obtained from selected tests at the Sal-man Farsi Dam Site (SFDS), Fars Province, southern Iran.
MATERIALS AND METHODS
GEOLOGICAL SETTING
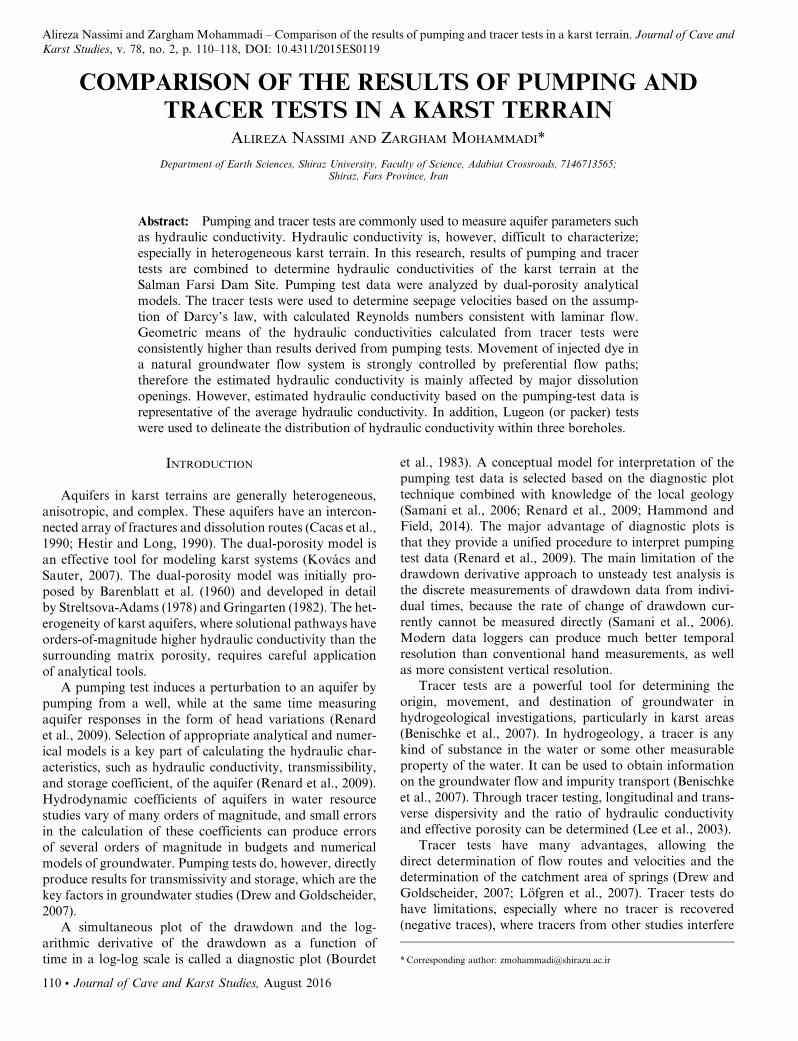
The SFDS is located near Ghir city, 190 km from thecity of Shiraz in Fars Province, in south Iran (Fig. 1). TheSalman Farsi Dam is an arch-gravity dam with 125 mheight and reservoir volume of 1,400 million cubic metersthat was constructed on the Ghareh-Aghaj River in FarsProvince.
The study area is situated at the Changal Anticline(Fig. 1) of the Zagros Folded Belt, which is 200 to 300 kmwide and formed in the Upper Cenozoic. The SFDS is onthe northern limb of the Changal Anticline, which trendsNW-SE. The stratigraphy and structural framework of thestudy area were studied in detail by Fars Regional WaterAuthority (1990), Rahbari and Bagheri (1996), Vuckovicand Milanovic (2001), and Fazeli (2007). In this region,the strata are from the Upper Cretaceous to the presenttime. Overburden includes slopewash deposits of angularrock fragments and alluvial terraces of cobbles, gravel,sand, and silt located along the rivers. The Bakhtiari For-mation (Pliocene-Pleistocene) includes conglomerate of het-erogeneous particles with calcareous cement and has a largeextent within the Salman Farsi reservoir area. The MishanFormation (early to mid-Miocene) includes gray to greenmarls, shaly limestone, and marly limestone outcropping inthe bottom and the banks of the reservoir (Vuckovic andMilanovic, 2001). The Razak Formation (Miocene) consistsof gypsum, marl, siltstone, and shale with marly limestone.
Figure 1. General geological map of the study area (modified from Mohammadi et al., 2010).
ALIREZA NASSIMI AND ZARGHAM MOHAMMADI
Journal of Cave and Karst Studies, August 2016 .111
Upstream of the dam site the dip of the Razak deposits var-ies from 55 to 65 degrees. This formation is widespreadin the reservoir area. The Asmari Formation (Oligocene-Miocene) is dominated by limestones and is divided intoUpper, Middle, and Lower units. The Upper Asmari, con-sisting of shelly limestone, marl, and marly limestone, out-crops upstream of the dam axis, forming the eastern andwestern reservoir banks (Fazeli, 2007). The Middle Asmariis about 180 m thick and composed of limestone calcarenite,cherty limestone, and nomolitic and oolitic limestones aswell as a small number of marl and marly limestone inter-beds. The dam and its appurtenances, including groutingcurtain, are on the Middle Asmari, with its great lithologicaldiversity and highly developed karst features such as con-duits, big caverns, and chimneys. The Lower Asmari is foundbelow the dam site and includes regularly bedded limestonealternating with marls at the top, and thin to very thin lime-stone and marly layers at the bottom (Fazeli, 2007). The rela-tively impermeable Pabdeh-Gurpi Formation (Paleocene toOligocene) contains purple shale and marl with thin clayeyand marly limestone interbeds. Outcrops of Pabdeh-Gurpiare found about 600 m downstream of the dam axis in theriver bed section.
HYDROGEOLOGIC SETTING
The hydrogeology of the study site was described by FarsRegional Water Authority (1994), Aghili and Meidani(1998), Milanovic et al. (2002), and Fazeli (2007). Tectonicsare the major control of karst structure and speleogenesisof the karst massif. At the initial stage of karstification (frac-tured limestone aquifer), groundwater movement through thefractured limestone aquifer created dissolutional enlarge-ment. Therefore, cave systems are composed of many seg-ments of interconnected nets of discontinuities, such asbedding planes, joints and shear fractures, faults, and their
intersections. These structural elements play a key role inthe initial stage of karstification by directing the groundwaterflows (Vuckovic and Milanovic, 2001; De Waele et al., 2011;Parise et al., 2015b; Taheri et al., 2015). The Upper andLower Asmari have low permeability due to the existenceof some marly layers. The Middle Asmari contains a greaterproportion of pure limestone than the Upper and LowerAsmari limestone. Brittle deformation is more predominantin the Middle Asmari, producing ample pathways forgroundwater flow (Fazeli, 2007). The Middle Asmari consti-tutes the main aquifer system at the SFDS and is confined bythe Upper Asmari at the SFDS (Aghili and Meidani, 1998;Vuckovic and Milanovic, 2001). Temperature was 38 uC inthe pumping well (QR 8) during the pumping test. Averagetemperature was 28.4 uC in the injection and detection pointsat the SFDS during the tracer test. Before the construction ofthe Salman Farsi Dam, several springs and boreholes wereknown to discharge into the Ghareh-Aghaj River from theAsmari Formation; the sum of discharge of these springsand boreholes was about 8 L s−1 (Milanovic et al., 2002).
DATA USED
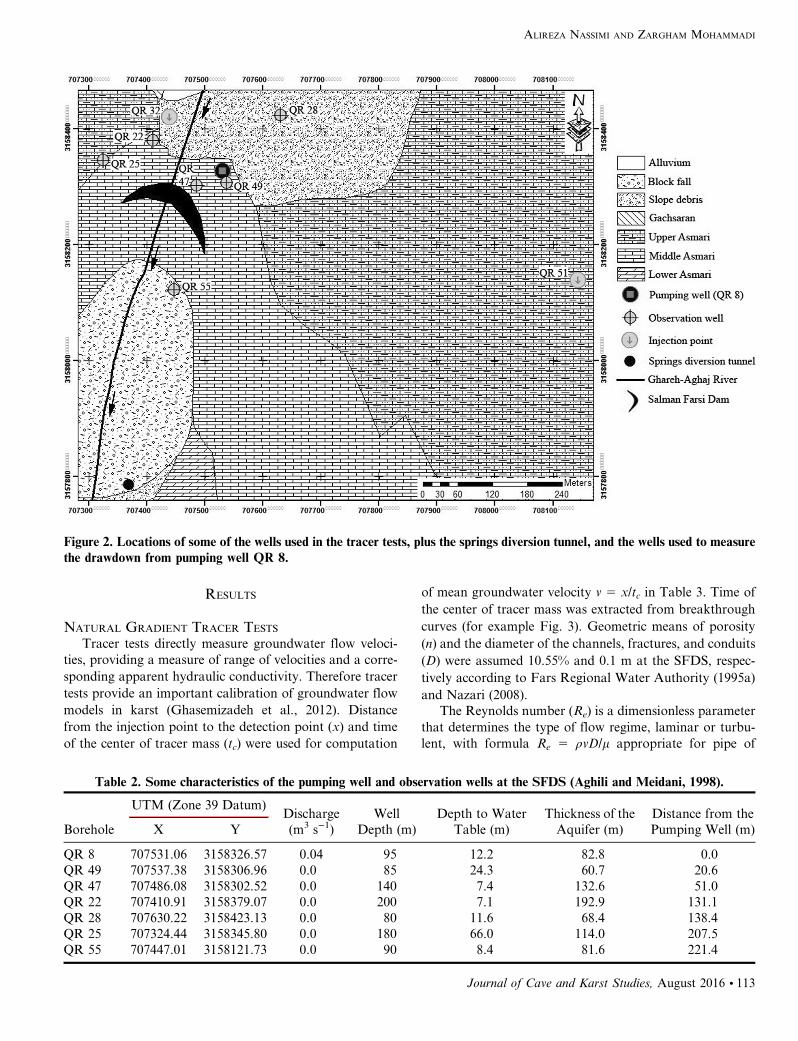
Five tracer tests were performed at the SFDS fromNovember 1996 to February 1997 by the Water ResearchCenter of the Ministry of Power. Table 1 lists the injectionand sampling points and the detections, if any (Fig. 2).
One pumping test was conducted in well QR 8, and draw-downs were measured in the six observation wells QR 49, QR47, QR 22, QR 28, QR 25 and QR 55 (Fig. 2) on November1997 by the Mahab Ghodss Consulting Engineering Com-pany. Table 2 shows the radial distance of the observationwells from the pumping well and some of their characteris-tics. Lugeon tests were done in three of the boreholes (QR22, QR 28 and QR 32) that were also used in the pumpingand tracer tests (Fars Regional Water Authority, 1995b).
Table 1. Summary of the tracer tests parameters at the SFDS (extracted from Khalaj Amirhosseini, 1997).
InjectionPoint Sampling Points Detection Points
TracerUsed
QR F QR 8, QR 12, QR 25, QR 28, QR 32, QR 34, QR 55,P.W. 2, Springs diversion tunnel, The river at location the dam,QR 22, QR 26, G 6, The river at location bridge Abnema
No detection Uranine
QR 51 QR 8, QR 12, QR 25, QR 28, QR 32, QR 34, QR 55,P.W. 2, Springs diversion tunnel, The river at location the dam,QR 22, QR 46, G 6, The river at location bridge Abnema
Springs diversiontunnel
Rhodamin B
QR 56 QR 53, QR 54, Spring Yargh, River upstream of the injectionpoint, River downstream of the injection point
No detection Uranine
QR 32 QR 8, QR 12, QR 25, QR 28, QR F, QR 34, QR 55,P.W. 2, Springs diversion tunnel, The river at location the dam,QR 22, QR 26, G 6, The river at location bridge Abnema
QR 28, The river atlocation the dam
KCl
QR 28 QR 8, QR 12, QR 25, QR F, QR 32, QR 34, QR 55,P.W. 2, Springs diversion tunnel, The river at location the dam, QR 22,QR 26, G 6, The river at location bridge Abnema
QR 8, QR 55 NaCl
COMPARISON OF THE RESULTS OF PUMPING AND TRACER TESTS IN A KARST TERRAIN
112. Journal of Cave and Karst Studies, August 2016
RESULTS
NATURAL GRADIENT TRACER TESTS
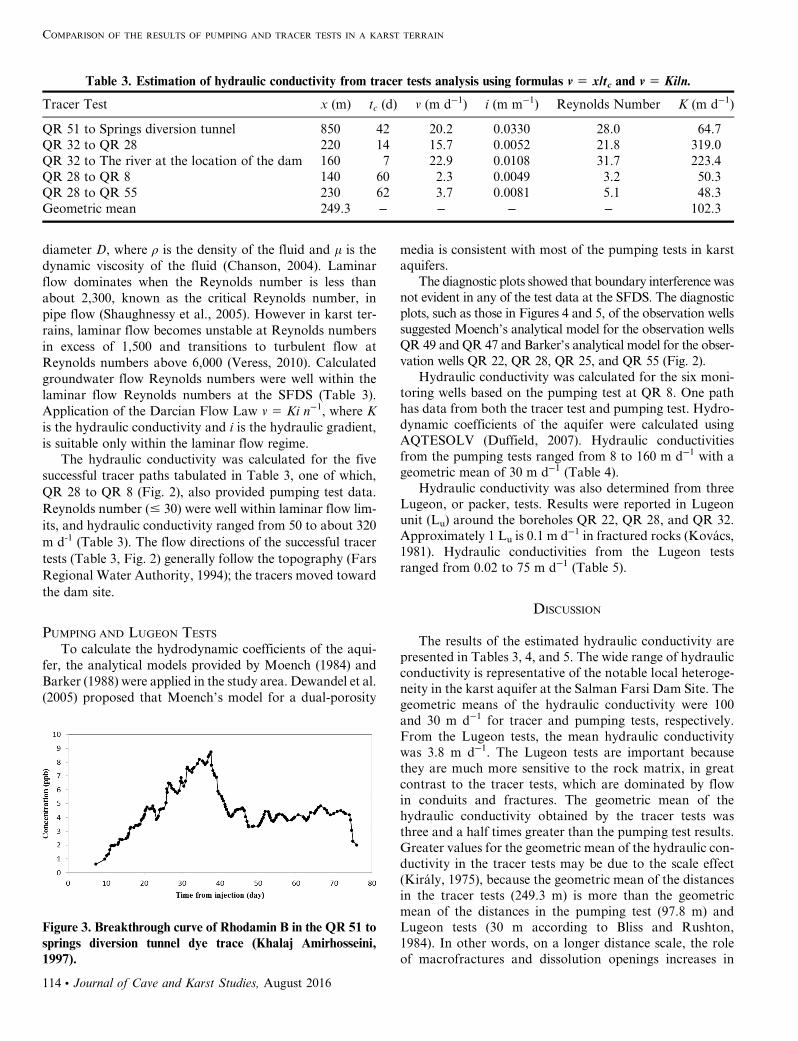
Tracer tests directly measure groundwater flow veloci-ties, providing a measure of range of velocities and a corre-sponding apparent hydraulic conductivity. Therefore tracertests provide an important calibration of groundwater flowmodels in karst (Ghasemizadeh et al., 2012). Distancefrom the injection point to the detection point (x) and timeof the center of tracer mass (tc) were used for computation
of mean groundwater velocity v 5 x/tc in Table 3. Time ofthe center of tracer mass was extracted from breakthroughcurves (for example Fig. 3). Geometric means of porosity(n) and the diameter of the channels, fractures, and conduits(D) were assumed 10.55% and 0.1 m at the SFDS, respec-tively according to Fars Regional Water Authority (1995a)and Nazari (2008).
The Reynolds number (Re) is a dimensionless parameterthat determines the type of flow regime, laminar or turbu-lent, with formula Re 5 ρvD/m appropriate for pipe of
Figure 2. Locations of some of the wells used in the tracer tests, plus the springs diversion tunnel, and the wells used to measurethe drawdown from pumping well QR 8.
Table 2. Some characteristics of the pumping well and observation wells at the SFDS (Aghili and Meidani, 1998).
Journal of Cave and Karst Studies, August 2016 .113
diameter D, where ρ is the density of the fluid and m is thedynamic viscosity of the fluid (Chanson, 2004). Laminarflow dominates when the Reynolds number is less thanabout 2,300, known as the critical Reynolds number, inpipe flow (Shaughnessy et al., 2005). However in karst ter-rains, laminar flow becomes unstable at Reynolds numbersin excess of 1,500 and transitions to turbulent flow atReynolds numbers above 6,000 (Veress, 2010). Calculatedgroundwater flow Reynolds numbers were well within thelaminar flow Reynolds numbers at the SFDS (Table 3).Application of the Darcian Flow Law v 5 Ki n−1, where Kis the hydraulic conductivity and i is the hydraulic gradient,is suitable only within the laminar flow regime.
The hydraulic conductivity was calculated for the fivesuccessful tracer paths tabulated in Table 3, one of which,QR 28 to QR 8 (Fig. 2), also provided pumping test data.Reynolds number (# 30) were well within laminar flow lim-its, and hydraulic conductivity ranged from 50 to about 320m d-1 (Table 3). The flow directions of the successful tracertests (Table 3, Fig. 2) generally follow the topography (FarsRegional Water Authority, 1994); the tracers moved towardthe dam site.
PUMPING AND LUGEON TESTS
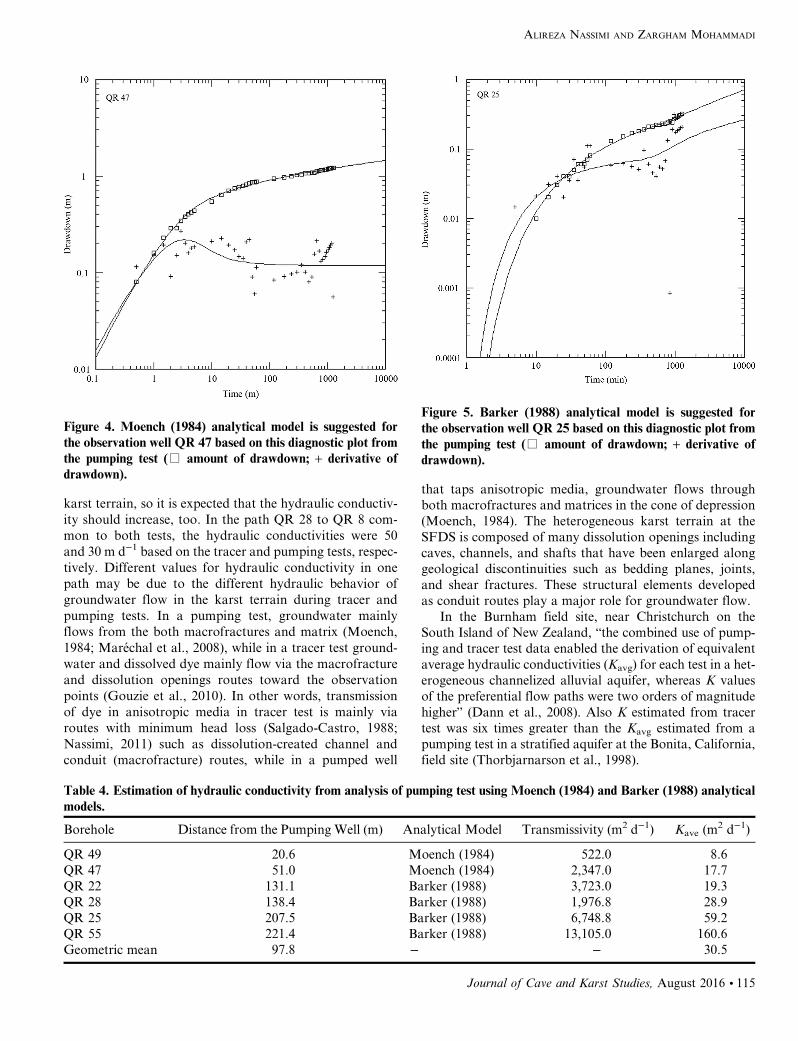
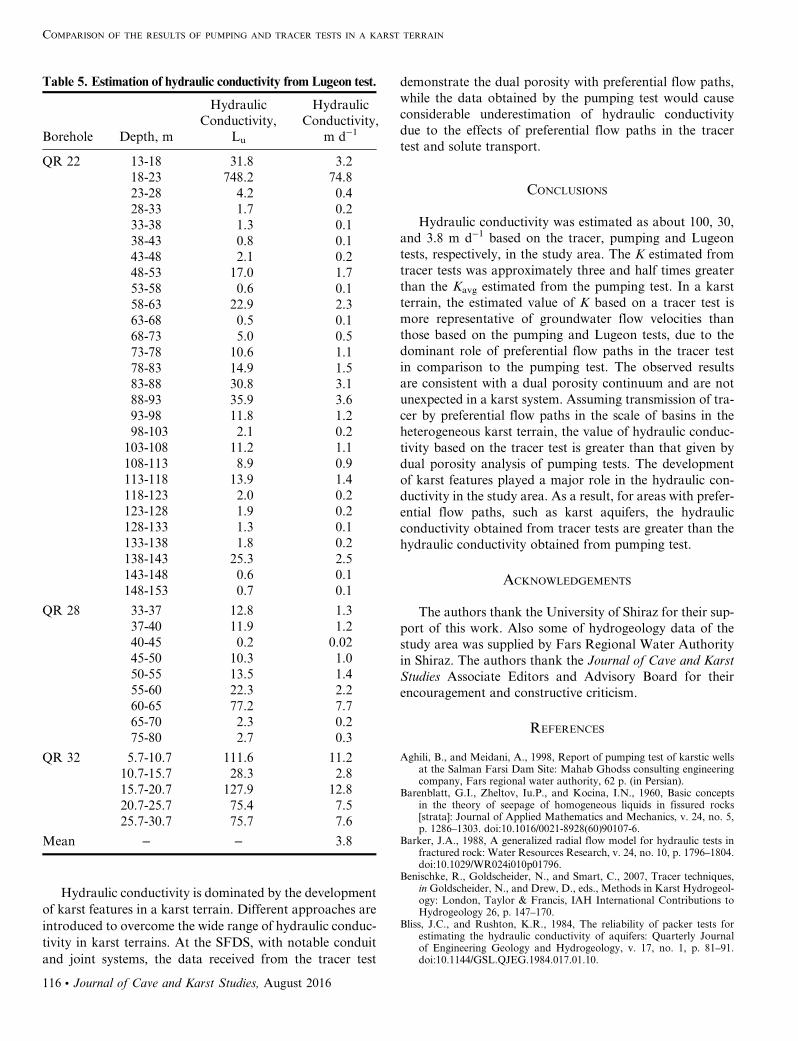
To calculate the hydrodynamic coefficients of the aqui-fer, the analytical models provided by Moench (1984) andBarker (1988) were applied in the study area. Dewandel et al.(2005) proposed that Moench’s model for a dual-porosity
media is consistent with most of the pumping tests in karstaquifers.
The diagnostic plots showed that boundary interference wasnot evident in any of the test data at the SFDS. The diagnosticplots, such as those in Figures 4 and 5, of the observation wellssuggested Moench’s analytical model for the observation wellsQR 49 and QR 47 and Barker’s analytical model for the obser-vation wells QR 22, QR 28, QR 25, and QR 55 (Fig. 2).
Hydraulic conductivity was calculated for the six moni-toring wells based on the pumping test at QR 8. One pathhas data from both the tracer test and pumping test. Hydro-dynamic coefficients of the aquifer were calculated usingAQTESOLV (Duffield, 2007). Hydraulic conductivitiesfrom the pumping tests ranged from 8 to 160 m d−1 with ageometric mean of 30 m d−1 (Table 4).
Hydraulic conductivity was also determined from threeLugeon, or packer, tests. Results were reported in Lugeonunit (Lu) around the boreholes QR 22, QR 28, and QR 32.Approximately 1 Lu is 0.1 m d−1 in fractured rocks (Kovács,1981). Hydraulic conductivities from the Lugeon testsranged from 0.02 to 75 m d−1 (Table 5).
DISCUSSION
The results of the estimated hydraulic conductivity arepresented in Tables 3, 4, and 5. The wide range of hydraulicconductivity is representative of the notable local heteroge-neity in the karst aquifer at the Salman Farsi Dam Site. Thegeometric means of the hydraulic conductivity were 100and 30 m d−1 for tracer and pumping tests, respectively.From the Lugeon tests, the mean hydraulic conductivitywas 3.8 m d−1. The Lugeon tests are important becausethey are much more sensitive to the rock matrix, in greatcontrast to the tracer tests, which are dominated by flowin conduits and fractures. The geometric mean of thehydraulic conductivity obtained by the tracer tests wasthree and a half times greater than the pumping test results.Greater values for the geometric mean of the hydraulic con-ductivity in the tracer tests may be due to the scale effect(Király, 1975), because the geometric mean of the distancesin the tracer tests (249.3 m) is more than the geometricmean of the distances in the pumping test (97.8 m) andLugeon tests (30 m according to Bliss and Rushton,1984). In other words, on a longer distance scale, the roleof macrofractures and dissolution openings increases in
Table 3. Estimation of hydraulic conductivity from tracer tests analysis using formulas v 5 x/tc and v 5 Ki/n.
Tracer Test x (m) tc (d) v (m d−1) i (m m−1) Reynolds Number K (m d−1)
QR 51 to Springs diversion tunnel 850 42 20.2 0.0330 28.0 64.7QR 32 to QR 28 220 14 15.7 0.0052 21.8 319.0QR 32 to The river at the location of the dam 160 7 22.9 0.0108 31.7 223.4QR 28 to QR 8 140 60 2.3 0.0049 3.2 50.3QR 28 to QR 55 230 62 3.7 0.0081 5.1 48.3Geometric mean 249.3 − − − − 102.3
Figure 3. Breakthrough curve of Rhodamin B in the QR 51 tosprings diversion tunnel dye trace (Khalaj Amirhosseini,1997).
COMPARISON OF THE RESULTS OF PUMPING AND TRACER TESTS IN A KARST TERRAIN
114. Journal of Cave and Karst Studies, August 2016
karst terrain, so it is expected that the hydraulic conductiv-ity should increase, too. In the path QR 28 to QR 8 com-mon to both tests, the hydraulic conductivities were 50and 30 m d−1 based on the tracer and pumping tests, respec-tively. Different values for hydraulic conductivity in onepath may be due to the different hydraulic behavior ofgroundwater flow in the karst terrain during tracer andpumping tests. In a pumping test, groundwater mainlyflows from the both macrofractures and matrix (Moench,1984; Maréchal et al., 2008), while in a tracer test ground-water and dissolved dye mainly flow via the macrofractureand dissolution openings routes toward the observationpoints (Gouzie et al., 2010). In other words, transmissionof dye in anisotropic media in tracer test is mainly viaroutes with minimum head loss (Salgado-Castro, 1988;Nassimi, 2011) such as dissolution-created channel andconduit (macrofracture) routes, while in a pumped well
that taps anisotropic media, groundwater flows throughboth macrofractures and matrices in the cone of depression(Moench, 1984). The heterogeneous karst terrain at theSFDS is composed of many dissolution openings includingcaves, channels, and shafts that have been enlarged alonggeological discontinuities such as bedding planes, joints,and shear fractures. These structural elements developedas conduit routes play a major role for groundwater flow.
In the Burnham field site, near Christchurch on theSouth Island of New Zealand, “the combined use of pump-ing and tracer test data enabled the derivation of equivalentaverage hydraulic conductivities (Kavg) for each test in a het-erogeneous channelized alluvial aquifer, whereas K valuesof the preferential flow paths were two orders of magnitudehigher” (Dann et al., 2008). Also K estimated from tracertest was six times greater than the Kavg estimated from apumping test in a stratified aquifer at the Bonita, California,field site (Thorbjarnarson et al., 1998).
Figure 5. Barker (1988) analytical model is suggested forthe observation well QR 25 based on this diagnostic plot fromthe pumping test (% amount of drawdown; + derivative ofdrawdown).
Figure 4. Moench (1984) analytical model is suggested forthe observation well QR 47 based on this diagnostic plot fromthe pumping test (% amount of drawdown; + derivative ofdrawdown).
Table 4. Estimation of hydraulic conductivity from analysis of pumping test using Moench (1984) and Barker (1988) analyticalmodels.
Borehole Distance from the Pumping Well (m) Analytical Model Transmissivity (m2 d−1) Kave (m2 d−1)
Journal of Cave and Karst Studies, August 2016 .115
Hydraulic conductivity is dominated by the developmentof karst features in a karst terrain. Different approaches areintroduced to overcome the wide range of hydraulic conduc-tivity in karst terrains. At the SFDS, with notable conduitand joint systems, the data received from the tracer test
demonstrate the dual porosity with preferential flow paths,while the data obtained by the pumping test would causeconsiderable underestimation of hydraulic conductivitydue to the effects of preferential flow paths in the tracertest and solute transport.
CONCLUSIONS
Hydraulic conductivity was estimated as about 100, 30,and 3.8 m d−1 based on the tracer, pumping and Lugeontests, respectively, in the study area. The K estimated fromtracer tests was approximately three and half times greaterthan the Kavg estimated from the pumping test. In a karstterrain, the estimated value of K based on a tracer test ismore representative of groundwater flow velocities thanthose based on the pumping and Lugeon tests, due to thedominant role of preferential flow paths in the tracer testin comparison to the pumping test. The observed resultsare consistent with a dual porosity continuum and are notunexpected in a karst system. Assuming transmission of tra-cer by preferential flow paths in the scale of basins in theheterogeneous karst terrain, the value of hydraulic conduc-tivity based on the tracer test is greater than that given bydual porosity analysis of pumping tests. The developmentof karst features played a major role in the hydraulic con-ductivity in the study area. As a result, for areas with prefer-ential flow paths, such as karst aquifers, the hydraulicconductivity obtained from tracer tests are greater than thehydraulic conductivity obtained from pumping test.
ACKNOWLEDGEMENTS
The authors thank the University of Shiraz for their sup-port of this work. Also some of hydrogeology data of thestudy area was supplied by Fars Regional Water Authorityin Shiraz. The authors thank the Journal of Cave and KarstStudies Associate Editors and Advisory Board for theirencouragement and constructive criticism.
REFERENCES
Aghili, B., and Meidani, A., 1998, Report of pumping test of karstic wellsat the Salman Farsi Dam Site: Mahab Ghodss consulting engineeringcompany, Fars regional water authority, 62 p. (in Persian).
Barenblatt, G.I., Zheltov, Iu.P., and Kocina, I.N., 1960, Basic conceptsin the theory of seepage of homogeneous liquids in fissured rocks[strata]: Journal of Applied Mathematics and Mechanics, v. 24, no. 5,p. 1286–1303. doi:10.1016/0021-8928(60)90107-6.
Barker, J.A., 1988, A generalized radial flow model for hydraulic tests infractured rock: Water Resources Research, v. 24, no. 10, p. 1796–1804.doi:10.1029/WR024i010p01796.
Benischke, R., Goldscheider, N., and Smart, C., 2007, Tracer techniques,in Goldscheider, N., and Drew, D., eds., Methods in Karst Hydrogeol-ogy: London, Taylor & Francis, IAH International Contributions toHydrogeology 26, p. 147–170.
Bliss, J.C., and Rushton, K.R., 1984, The reliability of packer tests forestimating the hydraulic conductivity of aquifers: Quarterly Journalof Engineering Geology and Hydrogeology, v. 17, no. 1, p. 81–91.doi:10.1144/GSL.QJEG.1984.017.01.10.
Table 5. Estimation of hydraulic conductivity from Lugeon test.
COMPARISON OF THE RESULTS OF PUMPING AND TRACER TESTS IN A KARST TERRAIN
116. Journal of Cave and Karst Studies, August 2016
Bourdet, D., Whittle, T.M., Douglas, A.A., and Pirard, Y.M., 1983,A new set of type curves simplifies well test analysis: World Oil,v. 196, p. 95–106.
Cacas, M.C., Ledoux, E., de Marsily, G., Tillie, B., Barbreau, A., Durand,B., Feuga, B. and Peadecerf, P., 1990, Modeling fracture flow witha stochastic discrete fracture network: Calibration and validation: 1.The flow model: Water Resources Research, v. 26, no. 3, p. 479–489.doi:10.1029/WR026i003p00479.
Chanson, H., 2004, The Hydraulics of Open Channel Flow: An Introduc-tion: Basic Principles, Sediment Motion, Hydraulic Modelling, Designof Hydraulic Structures, second edition: Oxford, Butterworth-Heine-mann, 634 p.
Dann, R.L., Close, M.E., Pang, L., Flintoft, M.J., and Hector, R.P., 2008,Complementary use of tracer and pumping tests to characterize a het-erogeneous channelized aquifer system in New Zealand: HydrogeologyJournal, v. 16, no. 6, p. 1177–1191. doi:10.1007/s10040-008-0291-4.
De Laguna, W., 1970, Tracer aids interpretation of pumping test:Water Resources Research, v. 6, no. 1, p. 172–184. doi:10.1029/WR006i001p00172.
De Waele J., Gutiérrez F., Parise M., and Plan, L., 2011, Geomorphologyand natural hazards in karst areas: A review: Geomorphology, v. 134,no. 1-2, p. 1–8. doi:10.1016/j.geomorph.2011.08.001.
Dewandel, B., Lachassagne, P., Boudier, F., Al-Hattali, S., Ladouche, B.,Pinault, J.-L., and Al-Suleimani, Z., 2005, A conceptual hydrogeologi-cal model of ophiolite hard-rock aquifers in Oman based on a multi-scale and a multidisciplinary approach: Hydrogeology Journal, v. 13,no. 5-6, p. 708–726. doi:10.1007/s10040-005-0449-2.
Drew, D., and Goldscheider, N., 2007, Combined use of methods, in Gold-scheider, N., and Drew, D., eds., Methods in Karst Hydrogeology:London, Taylor & Francis, p. 223–228.
Duffield, G.M., 2007, AQTESOLV (pumping tests, constant-head tests andslug tests) Software for Windows. Version 4.5, User’s Guide: Reston,Virginia, HydroSOLVE Inc., 530 p.
Fars Regional Water Authority, 1990, Report of geology at the SalmanFarsi Dam Site: Mahab Ghodss consulting engineering company,71 p. (in Persian).
Fars Regional Water Authority, 1994, Report of studies at the SalmanFarsi Dam Site: Mahab Ghodss consulting engineering company,869 p.
Fars Regional Water Authority, 1995a, Report the results of experimentson rock samples of the Salman Farsi Dam Site: Khak & Sangcivil work contractor & geotechnical consultant company, 274 p.(in Persian).
Fars Regional Water Authority, 1995b, Report of the results of Lugeon testsat the Salman Farsi Dam Site: Khak & Sang civil work contractor &geotechnical consultant company, 243 p. (in Persian).
Fazeli, M.A., 2007, Construction of grout curtain in karstic environmentcase study: Salman Farsi Dam: Environmental Geology, v. 51, no. 5,p. 791–796. doi:10.1007/s00254-006-0397-8.
Ghasemizadeh, R., Hellweger, F., Butscher, C., Padilla, I., Vesper,D., Field, M., and Alshawabkeh, A., 2012, Review: Groundwaterflow and transport modeling of karst aquifers, with particular referenceto the North Coast Limestone aquifer system of Puerto Rico: Hydro-geology Journal, v. 20, no. 8, p. 1441–1461. doi:10.1007/s10040-012-0897-4.
Gouzie, D., Dodd, R.P., and White, D.M., 2010, Dye-tracing studies insouthwestern Missouri, USA: Indication of stratigraphic flow controlin the Burlington Limestone: Hydrogeology Journal, v. 18, no. 4,p. 1043–1052. doi:10.1007/s10040-010-0581-5.
Gringarten, A.C., 1982, Flow test evaluation of fractured reservoirs, inNarasimhan, T.N., ed., Recent Trends in Hydrogeology: GeologicalSociety of America special paper 189, p. 237–263. doi:10.1130/SPE189-p237.
Gutiérrez, F., Parise, M., De Waele, J., and Jourde, H., 2014, A reviewon natural and human-induced geohazards and impacts in karst:Earth Science Reviews, v. 138, p. 61–88. doi:10.1016/j.earscirev.2014.08.002.
Hammond, P.A., and Field, M.S., 2014, A reinterpretation of historic aqui-fer tests of two hydraulically fractured wells by application of inverseanalysis, derivative analysis, and diagnostic plots: Journal of WaterResource and Protection, v. 6, no. 5, p. 481–506. doi:10.4236/jwarp.2014.65048.
Hestir, K., and Long, J.C.S., 1990, Analytical expressions for the perme-ability of random two-dimensional Poisson fracture networks based
on regular lattice percolation and equivalent media theories: Journalof Geophysical Research: Solid Earth, v. 95, no. B13, p. 21565–21581.doi:10.1029/JB095iB13p21565.
Khalaj Amirhosseini, Y., 1997, Report of tracer tests at the Salman FarsiDam Site: Water Research Center of the Ministry of Power, FarsRegional Water Authority, 68 p. (in Persian).
Király, L., 1975, Rapport sur l’état actuel des connaissances dansle domaine des caracteres physique des roches karstique, in Burger,A., and Dubertet, L., eds., Hydrogeology of Karstic Terrains: Paris,International Union of Geological Sciences, series B, number 3, p.53–67.
Kovács, G., 1981, Seepage Hydraulics: Amsterdam, Elsevier, Develop-ments in Water Science 10, 730 p.
Kovács, A., and Sauter, M., 2007, Modelling karst hydrodynamics, inGoldscheider, N., and Drew, D., eds., Methods in Karst Hydrogeol-ogy: London, Taylor & Francis, p. 201–222.
Lee, Jin-Yong, Kim, Jung-Woo, Cheon, Jeong-Yong, Yi, Myeong-Jae, andLee, Kang-Kim, 2003, Combined performance of pumping and tracertests: A case study: Geosciences Journal, v. 7, no. 3, p. 237–241.doi:10.1007/BF02910290.
Löfgren, M., Crawford, J., and Elert, M., 2007, Tracer Tests - Possibil‐ities and Limitations. Experience from SKB Fieldwork: 1977-2007:Swedish Nuclear Fuel and Waste Management Co., SKB reportR-07-39, 121 p.
Maréchal, J.C., Ladouche, B., Dörfliger, N., Lachassagne, P., 2008,Interpretation of pumping tests in a mixed flow karst system: WaterResources Research, v. 44, no. 5, paper W05401. doi:10.1029/2007WR006288.
Milanovic, P., 2002, The environmental impacts of human activitiesand engineering constructions in karst regions: Episodes, v. 25, no. 1,p. 13–21.
Milanovic, P., Kreuzer, H., Dolder, T., 2002, Report on design ofthe Grout Curtain, Salman Farsi Dam Project in Iran: Mahab Ghodssconsulting engineering company, Fars Regional Water Authority,202 p.
Moench, A.F., 1984, Double-porosity models for a fissured groundwaterreservoir with fracture skin: Water Resources Research, v. 20, no. 7,p. 831–846. doi:10.1029/WR020i007p00831.
Mohammadi, Z., Bagheri, R., Jahanshahi, R., 2010, Hydrogeochemistryand geothermometry of Changal thermal springs, Zagros region, Iran:Geothermics, v. 39, no. 3, p. 242–249. doi:10.1016/j.geothermics.2010.06.007.
Nassimi, A., 2011, Groundwater: Tehran, Dibagaran Tehran, 300 p.(in Persian).
Nazari, M.H., 2008, Sealing the karst cavity base on the scale at theSalman Farsi Dam Site, in Proceedings of 2nd National Conferenceon Dam and Hydropower, May 14-15, Tehran, Ministry of Power,p. 1–9 (in Persian).
Niemann, W.L., and Rovey, II, C.W., 2000, Comparison of hydraulicconductivity values obtained from aquifer pumping tests and conserva-tive tracer tests: Groundwater Monitoring & Remediation, v. 20, no. 3,p. 122–128. doi: 10.1111/j.1745-6592.2000.tb00278.x.
Parise, M., De Waele, J., and Gutierrez, F., 2008, Engineering and environ-mental problems in karst – An introduction: Engineering Geology,v. 99, no. 3-4, p. 91–94. doi:10.1016/j.enggeo.2007.11.009.
Parise, M., Closson, D., Gutiérrez, F., and Stevanovic, Z., 2015a,Anticipating and managing engineering problems in the complex karstenvironment: Environmental Earth Sciences, v. 74, no. 12, p. 7823–7835. doi:10.1007/s12665-015-4647-5.
Parise, M., Ravbar, N., Živanovic, V., Mikszewski, A., Kresic, N.,Mádl-Szőnyi, J., and Kukuric, N., 2015b, Hazards in karst andmanaging water resources quality, in Stevanovic, Z., ed., KarstAquifers – Characterization and Engineering: Cham, Switzerland,Springer, p. 601–687. doi:10.1007/978-3-319-12850-4_17.
Rahbari, A., and Bagheri, S., 1996, Report on the geology and geomor-phology in the Salman Farsi Dam Catchment: Jihad Engineering Ser-vices Co. and Parsab Consulting Engineers, Ministry of AgricultureJihad, 225 p. (in Persian).
Renard, P., Glenz, D., and Mejias, M., 2009, Understanding diagnosticplots for well-test interpretation: Hydrogeology Journal, v. 17, no. 3,p. 589–600. doi:10.1007/s10040-008-0392-0.
Rovey, II, C.W., and Niemann, W.L., 2005, Do conservative solutesmigrate at average pore-water velocity?: Groundwater, v. 43, no. 1,p. 52–62. doi:10.1111/j.1745-6584.2005.tb02285.x.
ALIREZA NASSIMI AND ZARGHAM MOHAMMADI
Journal of Cave and Karst Studies, August 2016 .117
Salgado-Castro, R.O., 1988, Computer modelling of water supply distribu-tion networks using the gradient method [Ph.D. thesis]: Newcastleupon Tyne, Newcastle University, 419 p.
Samani, N., Pasandi, M., and Barry, D.A., 2006, Characterizing a hetero-geneous aquifer by derivative analysis of pumping and recovery testdata: Journal of Geological Society of Iran, v. 1, p. 29–41.
Shaughnessy, E.J., Jr., Katz, I.M., and Schaffer, J.P., 2005, Introduction toFluid Mechanics: New York, Oxford University Press, 1057 p.
Streltsova-Adams, T.D., 1978, Well hydraulics in heterogeneous aquiferformations: Advances in Hydroscience, v. 11, p. 357–423. doi:10.1016/B978-0-12-021811-0.50011-5.
Taheri, K., Taheri, M., and Parise, M., 2015, Unprotected karst resourcesin western Iran: the environmental impacts of intensive agriculturalpumping on the covered karstic aquifer, a case in Kermanshahprovince: Geophysical Research Abstracts, v. 17, p. 1640.
Thorbjarnarson, K.W., Huntley, D., and McCarty, J.J., 1998, Absolutehydraulic conductivity estimates from aquifer pumping and tracer testsin a stratified aquifer: Groundwater, v. 36, no. 1, p. 87–97. doi:10.1111/j.1745-6584.1998.tb01068.x.
Vandenbohede, A., and Lebbe, L., 2003, Combined interpretation ofpumping and tracer tests: theoretical considerations and illustrationwith a field test: Journal of Hydrology, v. 277, p. 134–149. doi:10.1016/S0022-1694(03)00090-8.
Veress, M., 2010, Karst Environments: Karren Formation in HighMountains: Dortrecht, Springer, 238 p. doi:10.1007/978-90-481-3550-9.
Vuckovic, D., and Milanovic, S., 2001, Report on the speleological inves-tigation (mission report) at the Salman Farsi Dam Site: MahabGhodss consulting engineering company, Fars Regional WaterAuthority, 35 p.
COMPARISON OF THE RESULTS OF PUMPING AND TRACER TESTS IN A KARST TERRAIN
118. Journal of Cave and Karst Studies, August 2016