A previously reported eigh49] was applied to optimisconsidering solvent contearranged in a central compredict efficiency and pechromatographic objectivconditions yielding full rethe separation capabilityconstants originated by chsuggested that the rankerise to relatively narrow din the optimisation of selresolution regions were voptimisation factor, satisf
1. Introduction
The success in a chromatographic separation relies on theachievement of a differential interaction of the components inthe mixture with the column, which is done by tuning carefullythe environmental variables with a main impact on selectivityto precise levels. In order to optimise selectivity, trial-and-errorapproaches based on the chromatographer experience are com-monly used. Unfortunately, these strategies can be time-consumingand prone to fail, which happens especially in problems involvinga large number of compounds or multiple variables whose effectsare difficult to predict. The situation worsens when the resolutionpower in the chromatographic order is insufficient and cannot becompleted by the richness of the signal provided by the detector orby a second separation. Not surprisingly, there is a strong interestin the chromatographic field to develop approaches able to find theoptimal separation conditions in a systematic way.
The factors usually selected to govern separation and analy-sis time in high-performance liquid chromatography (HPLC) are
ameter mechanistic model [Part I of this work, J. Chromatogr. A 1163 (2007)separation of 11 ionisable compounds (nine diuretics and two �-blockers),
mperature and pH as experimental factors. The data from 21 experiments,e design, were used to model the retention. Local models were used to
ymmetry. The optimisation strategy, based on the use of peak purity astion and derived concepts, was able to find the most suitable experimentalion in reasonable analysis times. It also allowed a detailed inspection ofstudied factors, and of the consequences of the shifts in the protonation
s in solvent content and temperature. The size of the resolution structuresortance of the factors was pH, organic solvent and temperature, giving
ins of full resolution. The three factors were found, however, worthwhilety. Predicted optimal conditions corresponding to two different optimald experimentally. In spite of the difficulties associated to the use of pH as
pH, temperature, flow-rate, or the concentrations of one or moreorganic solvents, buffers, accompanying salts, amine modifiers,
surfactants and ion-pairing reagents. The experimental effort toachieve the best separation grows exponentially with the num-ber of factors. Hence, the chromatographer focuses on the mostrelevant, usually one or two. In simple situations, problems can besolved as single-factor cases by restricting the experimental ranges,so that factor interactions become negligible and chromatographicproperties vary linearly [1]. However, decreasing the number offactors or their ranges also diminishes the probability of success,particularly in situations where more than two factors are domi-nant and strong interactions exist among them.
Tables 1 and 2 illustrate the reported approaches in problemswhere the final optimisation concerns three or more factors. Table 1considers optimisations where temperature is not an active fac-tor, and Table 2, those where temperature was used to govern theseparation. As observed, the applied tools are those common inoptimisation problems in other fields. Most approaches imply sys-tematic method development through experimental design, andonly in a few cases, direct search methods (such as simplex optimi-sation [20,22,28]) have been applied. Indeed, simplex optimisationis not very suited in chromatographic problems, owing to the multi-modal nature of the resolution surfaces (due to peak reversals) and
pH, methanol and buffer (acetate) Window diagram technique: only pH and methanol/buffer ratio were optimisedAmiloride and hydrochlorothiazide [6]Methyldopa, amiloride andhydrochlorothiazide
[7]
pH, methanol and buffer (phosphate) Experimental design and neural networks Deoxycytidine monophosphate andmethyldeoxycytidine monophosphate
[8]
pH, methanol and methylamine Factorial design, response surface modelling and window diagrams Chlorpromazine and 13 metabolites [9]
pH, methanol and octanesulphonate/citrate Minimal resolution plot based on a mixture design constituted by methanoland two buffers at different pH
Two mixtures of four water-soluble vitaminsand four local anesthetics
[10]
pH, acetonitrile (gradient slope) and tetrabutylammoniumhydrogensulphate
Central composite (faced-centered) experimental design Erythromycin A and seven related compounds [11]
pH, acetonitrile, alkyl chain and concentration ofion-interaction reagent (several alkylamines)
Fractional factorial and star-design using the Box-Cox transformation 21 Aromatic sulfonates pH [12]
pH, tetrabutylammonium and a salt (Na2HPO4) (ion-pairchromatography)
Central composite design, response surface modelling and tracing ofiso-response functions
Monomethylarsonate and dimethylarsonate, orselenomethionine and selenite
[13]
Quaternary mobile phase: pH, acetonitrile, sodiumheptanesulphonate and buffer (acetate)
Window diagram technique based on mixtures of two solutions Catecholamines [14]
pH, methanol and flow-rate Factorial design and response surface modelling Ochratoxin A from matrix components in grain [17]
pH, acetonitrile and octylsulphate Fractional and full factorial designs for screening and modelling retention time 17 Monoamine neurotransmitters [18]
pH, acetonitrile, concentration and chain length of ion-pairagent (alkylammonium salts) and flow-rate(ion-interaction chromatography)
Fractional and Hoke designs, and neural networks Five pesticides [19]
S. Pous-Torres et al. / J. Chromatogr. A 1193 (2008) 117–128 119
Table 2re as a
gn and
olutio
gn an
rame
gn, re
gn an
s of th
A survey of multi-factor chromatographic separations in RPLC involving temperatu
Optimised factors Mathematical tools
Temperature, gradient shape and flow-rate Simplex
Temperature, acetonitrile and flow-rate Central composite desi
Temperature, methanol, heptanesulphonate, pH 3 buffer(phosphate) and flow-rate
Simplex mixing three scomposition
Temperature, acetonitrile, methanol, HCl, gradientsteepness and flow-rate (the three first factors wereconsidered for maximising resolution)
D-optimal design
Temperature, acetonitrile and trifluoroacetic acid(collateral changes in pH)
Fractional factorial desi
Temperature, pH, methanol and buffer (acetate) Limited-range multi-pa
Temperature, pH, acetonitrile and buffer (acetate) (onlypH and acetonitrile were optimised)
Fractional factorial desisimplex
Temperature, pH, methanol and triethylamine(optimisation was done at fixed temperature)
Fractional factorial desimodelling
Temperature, pH and methanol Graphic representationmodels)
Temperature, pH, buffer and flow-rate Modified simplex
the requirement of satisfying one or more aims simultaneously(e.g. maximal resolution, minimal time and minimal cost). Methodsbased on experimental designs are prevalent in the literature. Ide-ally, an optimisation procedure includes two steps: the so-calledscreening, and the optimisation itself. In the screening step, theimpact of each factor and the interactions between them are stud-ied in order to rank them, find the most favourable levels and fixthe less influent factors. In the optimisation step, the most rele-vant factors are fine-tuned with more comprehensive experimentaldesigns. This work concerns the optimisation step.
The most frequent designs in optimisation problems involvingthree or more factors are mixture designs [4,10], central compos-ite designs [2,11,13,21], D-optimal designs [23], and others, such asHoke designs [19]. Mixture designs involve interdependent vari-ables, such as percentages of solvents, and have the advantage ofbeing economical in number of experiments. Central compositedesigns are the most appropriate to detect curvatures in a multi-dimensional space, but require a large number of experimentsbeyond two factors. D-optimal designs are less frequent, but ade-quate in cases involving linear functions where the factors can onlybe varied over a restricted area, and thereby create an irregularexperimental domain in which orthogonality cannot be achieved.
Hoke designs are useful whenever the results of the experiments lieon the limits of the factor domain, but except in these situations,they do not present relevant advantages over central compositedesigns.
Factorial designs deserve a special mention in the chromato-graphic field. Strictly speaking, these are not optimisation designs.However, they allow modelling retention in many situations, whichopens the possibility of calculating the resolution, with the limita-tion of their inability to account curvatures. For this reason, there isa number of reports in Tables 1 and 2 that include factorial designsin optimisation [5,9,17,18,24–26].
Most experimental designs in Tables 1 and 2 are more or lessorthogonal and allow the fitting of extended linear models (i.e.response surface designs), which involve one factor terms, inter-action terms and quadratic terms:
where the response (y) can be either retention or resolution, x1–3represent the experimental factors, and bi and bij are regressed
factor
Solutes Ref.
Five steroids [20]
taboo search Seven p-hydroxybenzoic esters [21]
ns to account variations in Five aromatic bases [22]
Cyclosporin A and three metabolites [23]
d neural networks Neuroprotective peptides [24]
ter mapping with Drylab Nine benzoic acid derivatives [1]
sponse surface modelling and Five calcium channel blockers of the1,4-dihydropyridine subgroup
[25]
d pair-wise response surface Imatinib mesylate and impurity [26]
e experimental data (without Bupivacaine hydrochloride andadrenaline
[27]
Eight carboxylic acids [28]
parameters. Models based on mechanistic equations have beenalso proposed [15,16]. Artificial neural networks represent anotheralternative [8,19,24], where there is no explicit model but a setof interconnected transfer functions that are associated througha continuous iterative adjustment of the assigned weights.
The optimisation process implies finding the values of the exper-imental factors that maximise the resolution or achieve a balancebetween resolution and other aims, such as analysis time, peaksymmetry or solvent consumption. Several aims can be combinedusing multi-criteria decision making functions [2,29], or otherapproaches that explore the combined effects [22].
To our knowledge, there is no truly simultaneous optimisation oforganic solvent content, temperature and pH reported in the litera-ture. In some instances, one of these factors was set to the best levelfound in a screening study that included additional factors, and theother two factors were then tuned carefully [25,26]. In other cases,the factor ranges were narrowed to get linearity and the studies car-ried out in a univariate fashion [1]. There is also one report, wherethere is no underlying model, but a large number of experiments,the best of which was selected [27].
Recently, we proposed a model accounting the combined effectsof solvent content, temperature and pH on the chromatographic
retention of ionisable compounds, which was successfully appliedto predict retention times of nine ionisable diuretics and two �-blockers [30]. The model includes the effect of temperature andacid–base equilibria through the Van’t Hoff equation and weightedaverages of the retention factors of the acidic and basic species,respectively, and is able to account the shifts in the protonationconstants induced by changes in solvent content and temperature.
In this work, the model in Ref. [30] is used to optimise the sep-aration of mixtures of diuretics and �-blockers, and appraise thebenefits associated to the simultaneous optimisation of solventcontent, temperature and pH. Antecedents on the use of mecha-nistic models in three-factor optimisations are Refs. [15,16], wherethe involved variables were pH and the concentration of organicsolvent and micellised surfactant.
The applied optimisation strategy, based on the use of peakpurity and related concepts, allows a comprehensive diagnostic ofthe resolution expectancies of any chromatographic system, includ-ing the impact of each factor in wide experimental ranges, theexistence of interactions among the factors and the detection ofcritical solutes. All this allows finding the most suitable separationconditions with reliability.
omato
versus ϕ model [35], but with the number of fitting parametersreduced in one.
3.2. Prediction of peak profiles
In our study, we considered the existence of possible varia-tions in peak profile with mobile phase composition, for a greaterrealism. In order to propose a general treatment, asymmetricalchromatographic peaks were assumed. The available informationfor predicting peak profiles for any solute at any mobile phase was:(i) retention times, which were predicted from Eq. (2) and the deadtime value, (ii) peak areas, which were considered the same forall peaks, and (iii) left (A) and right (B) half-widths at 10% peakheight, which were calculated from the definition of efficiency (N)and asymmetry factor (fB/A) given in Ref. [36], using interpolatedvalues from the closest mobile phases in the design.
Peak profile predictions were based on the linearly modifiedGaussian model (PMG1) [37]:
h(t) = h0 exp
[−1
2
(t − tR
s0 + s1(t − tR)
)2]
(4)
Table 3Experimental design
Point Acetonitrile (v/v, %) Temperature (◦C) pH
Previous experimentsa
1 Cube 25 50 3.272 Star (ϕ) 40 30 5.403 Star (ϕ) 45 30 5.614 30 30 3.22
120 S. Pous-Torres et al. / J. Chr
2. Experimental
2.1. Reagents
Acetonitrile (HPLC grade, Scharlab, Barcelona, Spain) was usedas organic modifier. The pH was buffered with 0.1 M citric acid(Panreac, Barcelona) and NaOH (Scharlab), and measured afterthe addition of the organic solvent to the mobile phase. Theprobe compounds were nine diuretics: benzthiazide, bumetanide,furosemide, probenecid, trichloromethiazide (Sigma, St. Louis,MO, USA), bendroflumethiazide (Davur, Madrid), chlorthalidone(Ciba-Geigy, Barcelona), piretanide (Cusi, Barcelona), and xipamide(Lacer, Barcelona), and two �-blockers: oxprenolol (Ciba-Geigy)and propranolol (Aldrich, Steinheim, Germany). Other details aregiven in Ref. [30].
2.2. Apparatus
The pH was measured with a potentiometer provided with acombined Ag/AgCl/glass electrode (Crison Model GLP 22, Alella,Barcelona). The HPLC system (Agilent, Series 1100, Waldbronn, Ger-many) consisted of an isocratic pump, an autosampler, a UV–visibledetector and a temperature controller module. The signals weremonitored at 254 nm. The separations were carried out with a Zor-bax SB C18 column (150 mm × 4.6 mm, 5 �m particle size, Agilent),protected with a precolumn (30 mm × 4.0 mm) of similar features.The flow-rate and injected volume were 1 mL/min and 5 �L, respec-tively. Data acquisition was carried out with an HPChemStation(Agilent), and mathematical treatment was carried out in MATLAB6.5 (The Mathworks, Natick, MA, USA).
3. Data treatment
The optimisation approach applied in this work is based on themaximisation of the product of peak purities (i.e. non-overlappedpeak fractions) [31], which is an objective function that considersaltogether the distribution of the chromatographic peaks (selec-tivity and analysis time), their profiles (width and symmetry),and sizes (related to concentrations and instrumental responses).Peak purities can be predicted by computer simulation and allowanalysing comprehensively the resolution expectancies of a chro-matographic system (maximal possible resolution and associatedchromatographic conditions, incompatible compounds, compat-ible subsets, etc.). This assessment allows especial optimisation
strategies, such as the search of complementary conditions (mobilephases, columns or separation systems) [32,33], or best separationconditions in low resolution cases [34]. More details are given inRef. [31].
3.1. Prediction of retention
In Part I [30], we suggested the following eight-parameter(c1–c8) model to describe the combined effect of organic solventcontent, temperature and pH on the retention factors (k):
log k = c1 + c2
T+ c3PN
M
+ log
(c4 + 10c5+c6ϕ+(
c7T )+c8( ϕ
T )h
1 + 10c5+c6ϕ+(c7T )+c8( ϕ
T )h
(1 − c4)
)(2)
where a particular set of c1–c8 parameters describes the retentionbehaviour of a specific solute. In Eq. (2), T is the absolute tem-perature, h the proton concentration, and PN
M a normalised mobilephase polarity parameter, which depends on the volume fraction oforganic solvent (ϕ). This parameter was proposed in a framework,
gr. A 1193 (2008) 117–128
where the polar contribution to retention of solute, stationary andmobile phases were splitted [35].
For acetonitrile–water mixtures, PNM was established as:
PNM = 1.00 − 2.068ϕ
1 + 1.341ϕ(3)
In Eq. (2), the dependence of the logarithm of retention factorwith T is based on the Van’t Hoff equation, as also happens withthe protonation constant, log Kp (i.e. the exponent involving c5–c8,which coincides with pKa). Log Kp has been assumed to depend notonly on temperature, but also on the organic solvent content, andstrong interactions between these two factors are expected. The useof PN
M instead of ϕ was found useful to extend the linearity rangeof log k, allowing a prediction quality similar to the quadratic log k
10 Star (ϕ) 25 30 5.1111 Star (ϕ) 30 30 5.2012 Star (ϕ) 40 30 5.5313 Star (ϕ) 45 30 5.5414 Star (T) 35 20 5.4215 Star (T) 35 25 5.4216 Star (T) 35 40 5.4217 Star (T) 35 50 5.4218 Star (pH) 35 30 3.6319 Star (pH) 35 30 4.1020 Star (pH) 35 30 6.0821 Star (pH) 35 30 7.25
a Points 1–3 coincide with points in the central composite design.
S. Pous-Torres et al. / J. Chromatogr. A 1193 (2008) 117–128 121
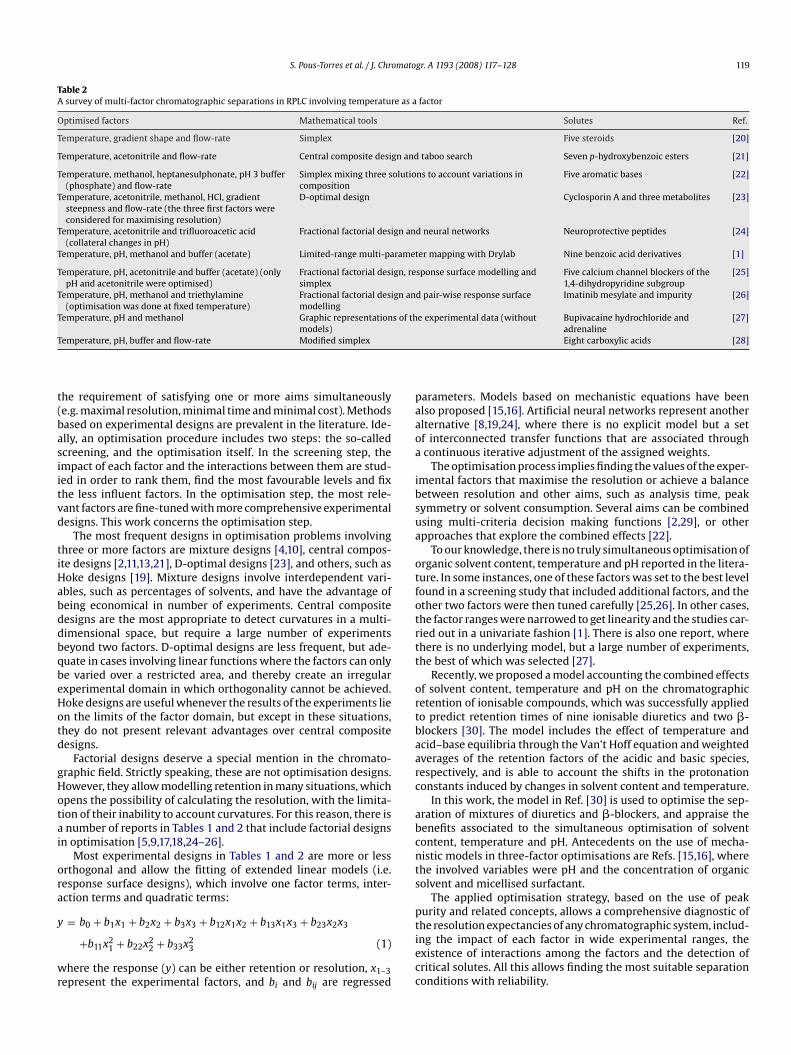
Fig. 1. Experimental conditions for which each solute is virtually b
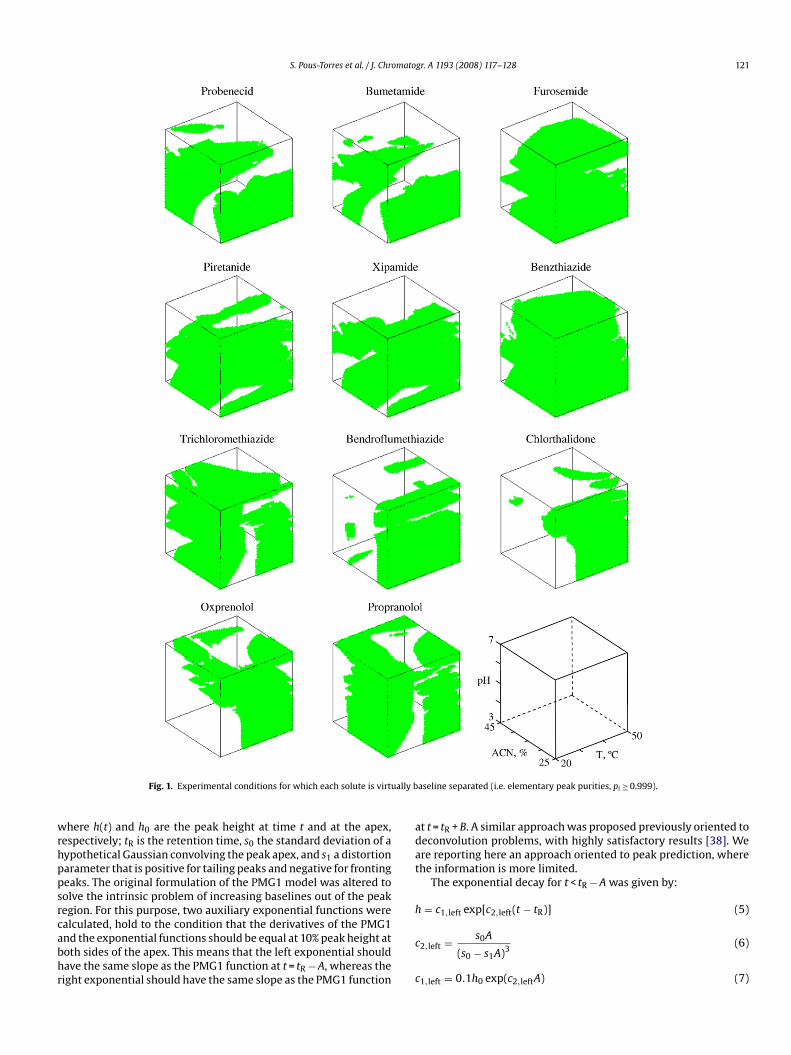
where h(t) and h0 are the peak height at time t and at the apex,respectively; tR is the retention time, s0 the standard deviation of ahypothetical Gaussian convolving the peak apex, and s1 a distortionparameter that is positive for tailing peaks and negative for frontingpeaks. The original formulation of the PMG1 model was altered tosolve the intrinsic problem of increasing baselines out of the peakregion. For this purpose, two auxiliary exponential functions werecalculated, hold to the condition that the derivatives of the PMG1and the exponential functions should be equal at 10% peak height atboth sides of the apex. This means that the left exponential shouldhave the same slope as the PMG1 function at t = tR − A, whereas theright exponential should have the same slope as the PMG1 function
aseline separated (i.e. elementary peak purities, pi ≥ 0.999).
at t = tR + B. A similar approach was proposed previously oriented todeconvolution problems, with highly satisfactory results [38]. Weare reporting here an approach oriented to peak prediction, wherethe information is more limited.
The exponential decay for t < tR − A was given by:
h = c1,left exp[c2,left(t − tR)] (5)
c2,left = s0A
(s0 − s1A)3(6)
c1,left = 0.1h0 exp(c2,leftA) (7)
122 S. Pous-Torres et al. / J. Chromatogr. A 1193 (2008) 117–128
Fig. 2. Experimental conditions for which each solute is ful
whereas the exponential decay for t > tR + B was calculated as:
h = c1,right exp[c2,right(t − tR)] (8)
c2,right = − s0B
(s0 + s1B)3(9)
c1,right = 0.1h0 exp(c2,rightB) (10)
where
A =
√41.7t2
RN(1.25 + fB/A)
11 + fB/A
(11)
ly overlapped (i.e. elementary peak purities pi < 0.01).
and B is obtained by multiplying A by the asymmetry factor (fB/A);c1,left, c2,left, c1,right and c2,right are the parameters defining theauxiliary exponential functions. In spite of the apparent complex-ity, implementing all these functions in a programming language isstraightforward, and the degree of realism that they confer to theoptimisation system is worthwhile.
3.3. Prediction of the separation performance
Equations in Sections 3.1 and 3.2 allowed the prediction of solutepeak profiles in a chromatogram obtained for a given experimen-tal condition, from which individual purities were calculated. Theoverall separation quality was obtained by multiplying the indi-
omatogr. A 1193 (2008) 117–128 123
S. Pous-Torres et al. / J. Chr
vidual peak purities. This process was carried out for a syntheticarrangement of evenly distributed experimental conditions. Theconsidered factor ranges were 25–45% acetonitrile, pH 3–7, and20–50 ◦C, with 51 levels by factor (513 = 132,651 synthetic phases).
4. Results and discussion
4.1. Description of the solute set
The analysed mixture consisted of 11 ionisable compoundsshowing diverse acid–base behaviour, which according to theiracidity are (log Kp values in water are given [39]): the diureticsprobenecid (3.4), bumetanide (3.6, 7.7), furosemide (3.8, 7.5), pire-tanide (4.1), xipamide (4.8, 10.0), benzthiazide (6.0), trichlorome-thiazide (7.3, 8.6, 10.6), bendroflumethiazide (9.0), and chlorthali-done (9.3), and the �-blockers oxprenolol (9.5) and propranol(9.5). This set constitutes a particularly difficult separation problemowing to: (i) the number of experimental factors (i.e. acetonitrilecontent, temperature and pH) affecting the retention and selectiv-ity; (ii) the incomplete sampling of the protonation process offeredby the experimental design for some solutes; (iii) the multiple peakcrossings happening at pH values close to the logarithm of thesolute acid–base constants; and (iv) the complex dependence ofthe protonation process (and consequently, the k versus pH curves)with the organic solvent content and temperature.
In all cases, the species most retained was the neutral one(i.e. the acidic species for the diuretics, and the basic species forthe �-blockers). The retention of the protonated species of �-blockers, kHA, could be measured without problems. For somediuretics, kHA was available at the maximal acidity level (pH 3),at least at certain combinations of acetonitrile content and temper-ature. For others, it could be extrapolated with enough accuracy,because the inflection point of the protonation curves was withinthe domain. The establishment of the retention of the basic species,kA, was more troublesome, since the most weakly acidic andthe basic compounds were not well sampled at the basic edgeof the experimental domain (pH 7). Consequently, the followingweak acids were properly sampled by the experimental design:bumetanide, furosemide, piretanide, probenecid and xipamide(with log K = 4.5–5.5), whereas benzthiazide and trichloromethi-azide (with log K > 5.5) were undersampled. The basic oxprenololand propranolol were undersampled as well.
It should be noted that the protonation constants of mostpolyprotic compounds are separated enough to evidence only one
protonation process in a conventional pH window of four pH units(i.e. 3–7), whereas other polyprotic compounds, with closer con-stants can be processed as a hypothetical monoprotic compound.It should be considered that charged species are scarcely retained.This means that only the transition giving rise to a neutral specieswill be significant in retention terms.
4.2. Experimental design
Five initial experiments (Table 3, upper rows) were developed toestablish a design exploring the factor ranges that provided appro-priate retention times through rough linear models:
log k = c0 + c1ϕ + c21T
+ c3pH (12)
Additional experiments suggested shifting the centre of thedesign. This lead to the following final ranges: 25–45% (v/v) ace-tonitrile, pH 3–7, and 20–50 ◦C.
New experiments were then developed following approxi-mately a central composite design (Table 3, lower rows), wherethe star-design included five levels for modelling complex curva-
Fig. 3. Optimal global peak purities (Popt) found in the planes defined foreach factor separately: (a) pH (acetonitrile/temperature planes); (b) acetonitrile(pH/temperature); (c) temperature (acetonitrile/pH).
tures. However, the different levels were not evenly distributed.The number of experiments in the central composite design was21, three of which were already included in the previous explor-ing design. The two remaining experiments in the exploring designwere also added to enrich the information. Some replicates wereperformed to assure the absence of drifts in retention times due
124 S. Pous-Torres et al. / J. Chromato
to column degradation or instrument instabilities throughout thedevelopment of the experimental design.
The details about the validation of Eq. (2) are given in Part I [30].The accuracy of this model was good enough to tackle predictiontasks with certain guarantees.
4.3. Resolution plots
In the chromatographic optimisation of ionisable compounds,the most convenient factor to tune retention and selectivity is thesolvent content (at constant temperature and pH): it has a general(and often large) effect on any kind of solute. However, restrictingthe optimisation to only one factor impoverishes the probabilitiesof succeeding in the separation. On the other hand, even in caseswhere the pH is kept unaltered, acid–base constants may changewith the solvent content (and with temperature). This will affect theretention, especially for pH values close to the pKa. In other words,when the solvent content is changed, there is a second underly-
Fig. 4. Optimal elementary peak purities found in the planes
gr. A 1193 (2008) 117–128
ing factor (the pH), which is collaterally modified, affecting in adifferent extent each solute in the mixture.
Peak purity, which is a normalised objective function, was usedto optimise the resolution. This concept has allowed the develop-ment of tools useful to explore the resolution expectancies of achromatographic system, namely, (i) the elementary limiting peakpurities, which are the maximal purities for each solute in a mix-ture, considering all possible experimental conditions in the factorspace, and (ii) the global limiting peak purity, obtained as the prod-uct of the individual values, similarly to the optimal global peakpurity. The global limiting peak purity represents the maximalexpectancy of resolution in a chromatographic system. Optimal val-ues can be straightforwardly compared with this limit to establishhow much the resolution can be enhanced up to exhaust the systemcapability.
The individual limiting peak purities for the probe compoundswere found to be plim,i = 1 (with a residual overlapping below 10−8).This means that all solutes can be fully separated from the others
defined for each factor separately. See Fig. 3 for details.
omato
lution is achieved at the highest contents (i.e. above 40%, as canbe expected since stronger elution strength forces co-elution),but also in a wide intermediate region.
(iii) The pH requires a special consideration, since the separationis clearly favoured at low pH, and in a narrow intermediateregion, especially below pH 4. However, fitting the retentionmodels requires exploring a pH domain as large as possible toinfer correctly the retention behaviour of the acidic and basicspecies, which is essential for each compound in the mixture.In spite of this, in order to enhance the accuracy in the regionof higher resolution, a more comprehensive scanning at lowpH is advised.
Plots in Figs. 3 and 4 give a partial perspective of the influenceand worth of each factor; the combined effect can be more com-plex. Resolving a mixture implies balancing the resolution needs ofall solutes simultaneously, which reduces the valid regions in theexperimental domain. Fig. 5a shows a projection of the combinedimpact of the three variables, where the experimental conditionsyielding a global purity P ≥ 0.95 are depicted with dots. The plotillustrates the complexity of the outlined separation problem: the
S. Pous-Torres et al. / J. Chr
up to perfect baseline, at least at one composition. In practice, fullresolution can be achieved in more than one experimental condi-tion. Fig. 1 shows the compositions within the experimental designgiving rise to elementary purities, pi > 0.999, which imply virtu-ally baseline separation. It may be observed that each compoundcan be baseline separated in large domains of experimental con-ditions. In principle, the weakest acids and the basic compoundscan be expected to be more problematic due to their fast elutionin the pH range 3–7. Indeed, this happens for bendroflumethiazide,chlorthalidone and oxprenolol, for which the full resolution regionstend to be narrower.
Fig. 2 provides a complementary perspective. This figure depictsthe experimental conditions where pi < 0.01, which means nearlyfull overlapping. As can be seen, the extension of these regionsis remarkably larger for bendroflumethiazide, chlorthalidoneand oxprenolol. The basic propranolol presents more favourableexpectancies. On the other hand, benzthiazide is the least problem-atic compound in the set, whereas furosemide is only problematicat intermediate pH.
Fig. 3 plots the optimal global peak purities (Popt) in a synthetic513 domain of simulated conditions. Each plot shows the optimalresolution found in the planes that can be defined for each factorseparately (pH, acetonitrile content and temperature), but do notoffer the specific conditions of the other factors allowing reachingthese resolutions. These plots explore the continuity of the reso-lution structures in the factor space. The extension of the featureswith a similar purity indicates the size of the three-dimensionalstructures projected by planes.
The most critical factor is pH (Fig. 3a), since the purity featuresare narrower. Only a few sharp maxima, corresponding to three-dimensional features with small projections in the pH axis, witha global optimal peak purity usually below Popt = 0.9 are observed.Above pH 5, the resolution features are so narrow that there arescarce possibilities to find conditions yielding separation. In addi-tion, errors coming from modelling, together with the difficultiesin implementing the conditions in the chromatograph, will makethese conditions scarcely feasible.
Fig. 4a is equivalent to Fig. 3a but drawn with the elemen-tary optimal peak purities, instead of the global ones. The mostproblematic compounds are probenecid and bumetanide, partic-ularly the former. Both compounds are the main responsible ofthe lack of resolution in a significant fraction of the pH domain.It may be again observed that benzthiazide is the least critical,since it can be well separated for specific acetonitrile/temperature
combinations at any pH. This figure shows that the threementioned compounds (bendroflumethiazide, chlorthalidone andoxprenolol) are less problematic than what they seemed to be fromFigs. 1 and 2.
The second critical factor is the acetonitrile content, whose pro-jections are wider (Fig. 3b). In this case, bendroflumethiazide andchlorthalidone are the most critical (Fig. 4b). Finally, temperatureis less problematic than the other two variables under the pointof view of separation, since the rate of change in selectivity isslower (Fig. 3c). Fig. 4c indicates that finding specific conditionsof acetonitrile/pH to resolve any compound at any temperature ispossible.
All these results should be taken with caution, because pro-jections always imply losses in information. In spite of this, Fig. 3allows concluding the rank in importance of the three factors. Evenmore interesting is the appearance of windows of full separation inthe ranges of pH 3–4.4 and 4.7–5.1; 25–31% and 38.5–40.2% acetoni-trile; and 35–50 ◦C. This suggests that the effort should be focusedin these regions, and constraining the experimental domain couldbe beneficial. However, there are several reasons that advise againstthis:
gr. A 1193 (2008) 117–128 125
(i) First, in the case of temperature, the whole domain can beconsidered as valid, and cropping the domain could be detri-mental. Interestingly, the separation is improved at highertemperature in spite of the shorter retention times.
(ii) The effect of acetonitrile content is less predictable: poor reso-
Fig. 5. Three-dimensional plot depicting global peak purities P ≥ 0.95: (a) withoutanalysis time restrictions, and (b) restricting the analysis time below 30 min.
126 S. Pous-Torres et al. / J. Chromato
4.4. Predicted versus experimental chromatograms
The chromatograms in Fig. 7 are given as a proof of thereliability of the optimisation. They compare two predicted opti-mal chromatograms with the corresponding experimental ones,corresponding to Region III (mobile phase A: 29.0% acetoni-trile/50.0 ◦C/pH 4.12, Fig. 7a and b) and Region I (mobile phase B:39.4% acetonitrile/20.6 ◦C/pH 3.00, Fig. 7c and d). Predicted globalpeak purities were P = 0.9999, and 0.9850, respectively. Note thatthe elution order in the chromatograms is different for several com-pounds.
The agreement between predicted and experimental chro-matograms for both mobile phases is rather satisfactory, regardingto the elution order, retention times and resolution. There are,however, some discrepancies between predicted and experimen-tal retention times for piretanide and xipamide eluted with mobilephase A, and benzthiazide, piretanide and xipamide eluted withmobile phase B. In order to interpret this result, we first consideredwhether the largest prediction errors corresponded to solutes thatwere experiencing the transition between acidic and basic species
mixture is resolved only in narrow regions of the factor space. Theseregions would be difficult to find without the assistance of a rigor-ous computer-based approach.
Fig. 6 shows the evolution of the resolution purity features asthe most critical factor, the pH, changes. It depicts the resolutionslices in the pH range 3–5. Beyond this range, the global separationimpoverishes quickly (see Fig. 5a). The combination of Figs. 5a and 6helps to visualise the separation possibilities. Three full resolutionregions can be differentiated:
Region I: 36–42% acetonitrile/20–25 ◦C/pH 3.0–3.7, which is asmall region at low temperature and high acetonitrilecontent.
Region II: 32–40% acetonitrile/27–30 ◦C/pH 3.5–4.5, which corre-sponds to a diagonal feature clearly seen in Fig. 6 atrelatively low pH.
Region III: 25–30% acetonitrile/32–50 ◦C/pH 3.0–4.75, with severalpeak reversals in the pH direction.
Region III is the one a priori expected for good separation, dueto the smaller elution strength, although interestingly, it happensat high temperature. However, it has the inconvenience of yieldingtoo long analysis times (tR,max). Proper optimal conditions shouldbalance good separation and short analysis time. Fig. 5b depictsthe experimental conditions yielding P ≥ 0.95 and tR,max < 30 min.It can be observed that only Region I and the upper conditions ofRegion III survive in the plot. Finding these regions by trial-and-error or with a less comprehensive strategy is still more unlikelythan above (Fig. 5a).
gr. A 1193 (2008) 117–128
Fig. 7. Predicted (a, c) versus experimental (b, d) chromatograms: (a) 29.0%acetonitrile/50.0 ◦C/pH 4.12; (b) 29.0% acetonitrile/50.0 ◦C/pH 4.11; (c) 39.4% ace-tonitrile/20.6 ◦C/pH 3.00; (d) 39.2% acetonitrile/20.9 ◦C/pH 3.02. Probe compounds:(1) bendroflumethiazide, (2) chlorthalidone, (3) oxprenolol, (4) trichloromethiazide,(5) propranolol, (6) furosemide, (7) benzthiazide, (8) piretanide, (9) xipamide, (10)probenecid, and (11) bumetanide. The asterisk in (a) corresponds to a degradationpeak of bendroflumethiazide.
omato
[
[
S. Pous-Torres et al. / J. Chr
in a region close to the mobile phase pH. In this case, minor changesin acidity (i.e. 0.05 pH units) could displace the peaks significantly.
The protonation constants given in Section 4.1 for the probecompounds were measured in water, but the acid–base behaviour isaffected by both acetonitrile content and temperature. Fortunately,the retention model used in this work (Eq. (2)) allows the predic-tion of log Kp values at specific acetonitrile content/temperaturecombinations. Thus, for 29.0% acetonitrile/50.0 ◦C (mobile phaseA) and 39.4% acetonitrile/20.6 ◦C (mobile phase B), the log Kp val-ues were, respectively: probenecid (4.7, 5.1), bumetanide (4.6, 4.9),furosemide (4.7, 4.7), piretanide (4.2, 4.7), xipamide (5.0, 5.2), ben-zthiazide (5.7, 5.7), chlorthalidone (7.5, 8.5), oxprenolol (7.0, 6.7),and propranol (8.6, 7.6). Log Kp values were out of the pH windowin the design for trichloromethiazide and bendroflumethiazide (i.e.the retention factors did not change with pH).
For mobile phase A, there are five solutes with log Kp close tothe mobile phase pH (4.12): probenecid, bumetanide, furosemide,xipamide, and piretanide. This explains, at least partially, theshifts of the peaks for the four most retained solutes in the chro-matograms (Fig. 7a and b). It should be noted that log Kp forpiretanide virtually coincides with the mobile phase pH, and con-sequently, the prediction of its retention factor is very critical. Theshifts in retention times for mobile phase B (pH 3.00) are smaller.In this case, there are no log Kp values too close to the mobile phasepH. However, some uncertainty still remains from the modellingstep, especially with regard to pH.
5. Conclusions
The use of pH as a separation factor is particularly problem-atic, since its effect on retention cannot be well assumed by theusual polynomial models applied in factorial design approaches,except in very narrow ranges, which do not allow a full bene-fit of its deep impact on selectivity. The proposed mechanisticmodel is able to predict retention with enough accuracy in orderto face optimisations with three experimental factors (solventcontent, temperature and pH), considering their mutual interac-tions. Polynomial models need a larger number of parametersto get similar accuracy, the risk of overfitting is larger, and thevalid experimental domain, smaller. The outlined optimisationstrategy, based on the peak purity concept as chromatographicobjective function and the mechanistic model, was able to findthe most suitable full-resolution experimental conditions, andinsight in detail the separation performance of the chromato-
graphic system, taking into account the particularities of eachcompound.
The optimisation strategy was applied to a complex problem,where the solutes exhibited diverse acid–base strengths, and inaddition, the protonation behaviour suffered shifts with the ace-tonitrile content and temperature, giving rise to multiple peakcrossings. Full resolution in reasonable analysis times was foundonly in narrow domains of the factor space. Solving problems likethis with combinations of only two factors can be risky, except if thethird factor is fixed to an adequate level. It should be noted that thetemperature is here a useful factor, although its impact is smallerthan the solvent content and pH.
The order of importance of the three studied factors and theirimpact on selectivity depends on the compound and the regionof the experimental domain. For a given compound, the pH is themost critical factor in the neighbourhood of its acid–base transi-tion, which covers around two pH units. The problem is magnifieddue to the fact that the solvent content and temperature affect theacid–base strength of solutes. If the mixture involves several com-pounds with particular acid–base behaviours, the combination ofthe outlined effects yields thin resolution structures. This is trans-
[[[
[
[
[[[[[
[[
[
[
[
[
gr. A 1193 (2008) 117–128 127
lated in a critical optimisation. In addition, the implementation ofthe predicted optimal separation will be hard.
In this work, we are assuming that the predictions of retentionare strictly accurate. This means that the existence of errors asso-ciated to the retention modelling step, and to the translation of thefound optimal conditions to the chromatograph, is neglected. Theeffect of incidental sources of error was only checked when thepredicted separation was contrasted with the experimental one.A more realistic optimisation demands including these sources oferror in the search of the optimal separation conditions. Finally,the experimental design applied in the optimisation was that usedto propose and validate the retention model outlined in Part I.This design was necessarily comprehensive to guarantee the properexamination of the candidate equations. Certainly, there is one fac-tor remarkably more problematic than the others, the pH, whichimplies that a hypothetical optimal design should attend this fac-tor preferentially. This kind of considerations may allow enhancingthe information capability of the design and, incidentally, reduc-ing the number of experiments. Both issues (i.e. the inclusion ofthe sources of error in the optimisation and the reduction of thenumber of experiments) will be analysed in detail in further work.
Acknowledgements
This work was supported by Projects CTQ2004–02760/BQU andCTQ2007–61828/BQU (Ministerio de Educacion y Ciencia of Spain,MEC) and FEDER funds. SPT thanks a FPI grant from the MEC.
References
[1] J.W. Dolan, D.C. Lommen, L.R. Snyder, J. Chromatogr. 535 (1990) 55.[2] T. Sivakumar, R. Manavalan, C. Muralidharan, K. Valliappan, J. Pharm. Biomed.
Anal. 43 (2007) 1842.[3] P. Chaminade, A. Baillet, D. Bayloq-Ferrier, Analusis 22 (1994) 55.[4] S. Pichini, I. Altieri, A.R. Passa, M. Rosa, P. Zuccaro, R. Pacifici, J. Chromatogr. A
697 (1995) 383.[5] H.B. Wan, W.G. Lan, M.K. Wong, C.Y. Mok, Anal. Chim. Acta 289 (1994) 371.[6] M. Zecevic, L.J. Zivanovic, S. Agatonovic-Kustrin, D. Ivanovic, M. Maksimovic, J.
Pharm. Biomed. Anal. 22 (2000) 1.[7] M. Zecevic, L. Zivanovic, S. Agatonovic-Kustrin, D. Minic, J. Pharm. Biomed. Anal.
24 (2001) 1019.[8] J. Havlis, J.E. Madden, A.L. Revilla, J. Havel, J. Chromatogr. B 755 (2001) 185.[9] J.S. Kiel, S.L. Morgan, R.K. Abramson, J. Chromatogr. 485 (1989) 585.10] P.M.J. Coenegracht, Nguyen-Van-Tuyen, H.J. Metting, P.J.M. Coenegracht-
Lamers, J. Chromatogr. 389 (1987) 351.[11] V. Harang, D. Westerlund, Chromatographia 50 (1999) 525.12] E. Marengo, M.C. Gennaro, V. Gianotti, Chemometr. Intell. Lab. Syst. 53 (2000)
57.13] B. Do, S. Robinet, D. Pradeau, F. Guyon, Analyst 126 (2001) 594.14] H.B. He, R.J. Deegan, M. Wood, A.J.J. Wood, J. Chromatogr. 574 (1992) 213.15] J.R. Torres-Lapasio, D.L. Massart, J.J. Baeza-Baeza, M.C. Garcıa-Alvarez-Coque,
Coque, J. Chromatogr. A 893 (2000) 321.[17] M. Zecevic, D. Minic, D. Stojsic, L. Zivanovic, I. Ivanovic, Pharmazie 59 (2004)
175.18] P. Wester, J. Gottfries, K. Johansson, F. Klinteback, B. Winblad, J. Chromatogr. 415
(1987) 261.19] E. Marengo, M.C. Gennaro, S. Angelino, J. Chromatogr. A 799 (1998) 47.20] D.M. Fast, P.H. Culbreth, E.J. Sampson, Clin. Chem. 28 (1982) 444.21] Y.C. Guillaume, E. Peyrin, Talanta 51 (2000) 579.22] J.C. Berridge, Analyst 109 (1984) 291.23] M. Hermann, H. Christensen, J.L.E. Reubsaet, J. Pharm. Biomed. Anal. 30 (2002)
1263.24] K. Novotna, J. Havlis, J. Havel, J. Chromatogr. A 1096 (2005) 50.25] A.B. Baranda, N. Etxebarria, R.M. Jimenez, R.M. Alonso, J. Chromatogr. Sci. 43
(2005) 505.26] M. Medenica, B. Jancic, D. Ivanovic, A. Malenovic, J. Chromatogr. A 1031 (2004)
243.27] M. Medenica, D. Ivanovic, S. Markovic, A. Malenovic, D. Misljenovic, J. Liq. Chro-
matogr. Relat. Technol. 26 (2003) 3401.28] R.M. Marce, M. Calull, R.M. Manchobas, F. Borrull, F.X. Rius, Chromatographia
29 (1990) 54.29] P.M.J. Coenegracht, A.K. Smilde, H.J. Metting, D.A. Doornbos, J. Chromatogr. 485
(1989) 195.
[
[
[
[
[
128 S. Pous-Torres et al. / J. Chromato
30] S. Pous-Torres, J.R. Torres-Lapasio, J.J. Baeza-Baeza, M.C. Garcıa-Alvarez-Coque,J. Chromatogr. A 1163 (2007) 49.
31] J.R. Torres-Lapasio, M.C. Garcıa-Alvarez-Coque, J. Chromatogr. A 1120 (2006)308.
32] G. Vivo-Truyols, J.R. Torres-Lapasio, M.C. Garcıa-Alvarez-Coque, J. Chromatogr.A 876 (2000) 17.