Highly dispersed iron vanadate catalyst supported on TiO 2 for the selective catalytic reduction of NO x with NH 3 Fudong Liu a , Hong He a,⇑ , Zhihua Lian a , Wenpo Shan a , Lijuan Xie a , Kiyotaka Asakura b , Weiwei Yang a , Hua Deng a a Research Center for Eco-Environmental Sciences, Chinese Academy of Sciences, Beijing 100085, PR China b Catalysis Research Center, Hokkaido University, Sapporo 001-0021, Japan article info Article history: Received 10 April 2013 Revised 7 July 2013 Accepted 7 August 2013 Available online 17 September 2013 Keywords: Iron vanadate catalyst Selective catalytic reduction High dispersion Surface enrichment Electronic inductive effect DeNO x process abstract An iron vanadate (FeVO 4 ) catalyst supported on TiO 2 with high dispersion has been developed and applied in the selective catalytic reduction (SCR) of NO x with NH 3 , showing high activity, N 2 selectivity, and H 2 O/SO 2 durability in medium temperature range. The formation of Fe 3+ –O–V 5+ linkages with low coordination number of vanadium atoms was evidenced by EXAFS, indicating the presence of abundant surface defects for reactant adsorption and activation. The XPS showed that the FeVO 4 phase was surface- enriched with VO x species acting as true active sites, and thus, high NH 3 -SCR activity and H 2 O/SO 2 dura- bility could be preserved similar to that of V 2 O 5 /TiO 2 . Additionally, the presence of electronic inductive effect between Fe 3+ and V 5+ as confirmed by XANES and XPS could effectively decrease the unwanted NH 3 unselective oxidation, thus resulting in high N 2 selectivity at high temperatures. This FeVO 4 /TiO 2 cat- alyst is a potential candidate for the deNO x process for stationary flue gas or diesel exhaust. Ó 2013 Elsevier Inc. All rights reserved. 1. Introduction Selective catalytic reduction (SCR) of NO x with NH 3 over V 2 O 5 – WO 3 (MoO 3 )/TiO 2 catalysts is a well-established system for the re- moval of NO x from stationary sources, such as coal-fired power plants and industrial boilers [1,2]. The vanadium-based catalysts have also been successfully used in the deNO x process for heavy duty diesel engines in 2005 using urea as an efficient reductant [3]. However, although it has been utilized industrially for several decades, some disadvantages still remain for this catalyst system, such as a narrow operation temperature window, low N 2 selectiv- ity, and sublimation of V 2 O 5 at high reaction temperatures [1,4,5], which greatly restrict its further application in the deNO x process for mobile sources. Accordingly, the in-depth study and improve- ment of vanadium-based catalysts for the NH 3 -SCR process is still of great concern in the field of environmental catalysis [5–13]. Nowadays, much attention has also been paid to the investiga- tion of non-vanadium NH 3 -SCR catalysts worldwide, including Fe- and Cu-exchanged zeolite catalysts (e.g., Fe-ZSM-5, Fe-BEA, Cu- ZSM-5, Cu-SSZ-13, etc.) [14–22] and Fe-, Cu-, Mn-, and Ce-based oxide catalysts (e.g. c-Fe 2 O 3 , FeTiO x , Fe 2 (SO 4 ) 3 /TiO 2 , Fe 2 O 3 /WO 3 / ZrO 2 , CuO x /WO x –ZrO 2 , MnO x /TiO 2 , CrO x –MnO x , (Fe 3x Mn x ) 1d O 4 , CeWO x , CeO 2 –WO 3 /TiO 2 , etc.) [23–32]. All the above-mentioned catalysts show relatively high deNO x efficiency in different temper- ature ranges, and the Fe-based catalysts among them usually show good NH 3 -SCR activity, N 2 selectivity, and H 2 O/SO 2 durability at medium or high temperatures above 200 °C [23,29,30]. Therefore, it is promising to combine the advantages of vanadium species and iron species for the NH 3 -SCR process into one catalyst, such as an FeVO 4 catalyst, to enlarge the operation temperature window and enhance the N 2 selectivity at high temperatures. The introduc- tion of the Fe component into the V 2 O 5 –TiO 2 catalyst system has already been reported by Yang et al. [33,34], who found that Fe– Ti–V spinel and V 2 O 5 /Fe 2 O 3 –TiO 2 catalysts exhibited good NH 3 - SCR performance in the medium temperature range. They did not observe the formation of the FeVO 4 phase in their catalysts, probably due to the different preparation methods used or the lim- itation of detection accuracy using XRD, yet the importance of the FeVO 4 phase for NH 3 -SCR reaction is highly worthy of investiga- tion. The promoting effect of Fe doping on the low temperature NH 3 -SCR activity over ErVO 4 /TiO 2 –WO 3 –SiO 2 catalysts was also observed by Sagar et al. [35], where the existence of the FeVO 4 phase might also be an important factor influencing the deNO x effi- ciency. Besides, it is interesting that the FeVO 4 phase has a much higher melting point (ca. 850 °C) than that of V 2 O 5 (ca. 690 °C) [36,37], thus possessing higher thermal stability, which is benefi- cial for use in NO x removal from diesel engines, especially when the SCR converter is installed downstream of the diesel particulate 0021-9517/$ - see front matter Ó 2013 Elsevier Inc. All rights reserved. http://dx.doi.org/10.1016/j.jcat.2013.08.003 ⇑ Corresponding author. Address: P.O. Box 2871, 18 Shuangqing Road, Haidian District, Beijing 100085, PR China. Fax: +86 10 62849123. E-mail address: [email protected](H. He). Journal of Catalysis 307 (2013) 340–351 Contents lists available at ScienceDirect Journal of Catalysis journal homepage: www.elsevier.com/locate/jcat
Transcript
Journal of Catalysis 307 (2013) 340–351
Contents lists available at ScienceDirect
Journal of Catalysis
journal homepage: www.elsevier .com/locate / jcat
Highly dispersed iron vanadate catalyst supported on TiO2
for the selective catalytic reduction of NOx with NH3
0021-9517/$ - see front matter � 2013 Elsevier Inc. All rights reserved.http://dx.doi.org/10.1016/j.jcat.2013.08.003
Fudong Liu a, Hong He a,⇑, Zhihua Lian a, Wenpo Shan a, Lijuan Xie a, Kiyotaka Asakura b, Weiwei Yang a,Hua Deng a
a Research Center for Eco-Environmental Sciences, Chinese Academy of Sciences, Beijing 100085, PR Chinab Catalysis Research Center, Hokkaido University, Sapporo 001-0021, Japan
a r t i c l e i n f o
Article history:Received 10 April 2013Revised 7 July 2013Accepted 7 August 2013Available online 17 September 2013
Keywords:Iron vanadate catalystSelective catalytic reductionHigh dispersionSurface enrichmentElectronic inductive effectDeNOx process
a b s t r a c t
An iron vanadate (FeVO4) catalyst supported on TiO2 with high dispersion has been developed andapplied in the selective catalytic reduction (SCR) of NOx with NH3, showing high activity, N2 selectivity,and H2O/SO2 durability in medium temperature range. The formation of Fe3+–O–V5+ linkages with lowcoordination number of vanadium atoms was evidenced by EXAFS, indicating the presence of abundantsurface defects for reactant adsorption and activation. The XPS showed that the FeVO4 phase was surface-enriched with VOx species acting as true active sites, and thus, high NH3-SCR activity and H2O/SO2 dura-bility could be preserved similar to that of V2O5/TiO2. Additionally, the presence of electronic inductiveeffect between Fe3+ and V5+ as confirmed by XANES and XPS could effectively decrease the unwantedNH3 unselective oxidation, thus resulting in high N2 selectivity at high temperatures. This FeVO4/TiO2 cat-alyst is a potential candidate for the deNOx process for stationary flue gas or diesel exhaust.
� 2013 Elsevier Inc. All rights reserved.
1. Introduction
Selective catalytic reduction (SCR) of NOx with NH3 over V2O5–WO3 (MoO3)/TiO2 catalysts is a well-established system for the re-moval of NOx from stationary sources, such as coal-fired powerplants and industrial boilers [1,2]. The vanadium-based catalystshave also been successfully used in the deNOx process for heavyduty diesel engines in 2005 using urea as an efficient reductant[3]. However, although it has been utilized industrially for severaldecades, some disadvantages still remain for this catalyst system,such as a narrow operation temperature window, low N2 selectiv-ity, and sublimation of V2O5 at high reaction temperatures [1,4,5],which greatly restrict its further application in the deNOx processfor mobile sources. Accordingly, the in-depth study and improve-ment of vanadium-based catalysts for the NH3-SCR process is stillof great concern in the field of environmental catalysis [5–13].
Nowadays, much attention has also been paid to the investiga-tion of non-vanadium NH3-SCR catalysts worldwide, including Fe-and Cu-exchanged zeolite catalysts (e.g., Fe-ZSM-5, Fe-BEA, Cu-ZSM-5, Cu-SSZ-13, etc.) [14–22] and Fe-, Cu-, Mn-, and Ce-basedoxide catalysts (e.g. c-Fe2O3, FeTiOx, Fe2(SO4)3/TiO2, Fe2O3/WO3/ZrO2, CuOx/WOx–ZrO2, MnOx/TiO2, CrOx–MnOx, (Fe3�xMnx)1�dO4,
CeWOx, CeO2–WO3/TiO2, etc.) [23–32]. All the above-mentionedcatalysts show relatively high deNOx efficiency in different temper-ature ranges, and the Fe-based catalysts among them usually showgood NH3-SCR activity, N2 selectivity, and H2O/SO2 durability atmedium or high temperatures above 200 �C [23,29,30]. Therefore,it is promising to combine the advantages of vanadium speciesand iron species for the NH3-SCR process into one catalyst, suchas an FeVO4 catalyst, to enlarge the operation temperature windowand enhance the N2 selectivity at high temperatures. The introduc-tion of the Fe component into the V2O5–TiO2 catalyst system hasalready been reported by Yang et al. [33,34], who found that Fe–Ti–V spinel and V2O5/Fe2O3–TiO2 catalysts exhibited good NH3-SCR performance in the medium temperature range. They did notobserve the formation of the FeVO4 phase in their catalysts,probably due to the different preparation methods used or the lim-itation of detection accuracy using XRD, yet the importance of theFeVO4 phase for NH3-SCR reaction is highly worthy of investiga-tion. The promoting effect of Fe doping on the low temperatureNH3-SCR activity over ErVO4/TiO2–WO3–SiO2 catalysts was alsoobserved by Sagar et al. [35], where the existence of the FeVO4
phase might also be an important factor influencing the deNOx effi-ciency. Besides, it is interesting that the FeVO4 phase has a muchhigher melting point (ca. 850 �C) than that of V2O5 (ca. 690 �C)[36,37], thus possessing higher thermal stability, which is benefi-cial for use in NOx removal from diesel engines, especially whenthe SCR converter is installed downstream of the diesel particulate
F. Liu et al. / Journal of Catalysis 307 (2013) 340–351 341
filter (DPF) in view of the timed thermal shock (� 800 �C) in theregeneration processes of DPF systems.
In this study, an FeVO4 catalyst supported on TiO2 with highdispersion was prepared using a facile co-impregnation methodand applied as an NH3-SCR catalyst for the first time. The highSCR activity, N2 selectivity, and H2O/SO2 durability of this catalystin the medium temperature range were demonstrated. Based oncombined characterizations using XRD, Raman spectra, X-rayabsorption spectra (XAS), and XPS, the microstructure of the activeFeVO4 phase was determined, in which an electronic inductive ef-fect was found to exist between Fe3+ and V5+ species that was ben-eficial for the retention of high deNOx efficiency and N2 selectivitysimultaneously. The conclusions drawn from this study are impor-tant for understanding the structure–activity relationships ofFeVO4/TiO2 catalyst in the NH3-SCR reaction and guiding its possi-ble practical use.
2. Experimental
2.1. Catalyst synthesis
Iron vanadate catalysts supported on TiO2 with different load-ing amounts were prepared by the conventional co-impregnationmethod using Fe(NO3)3�9H2O and NH4VO3 as precursors, whichare denoted as x wt.% FeVO4/TiO2. Firstly, a mixed solution ofFe(NO3)3, NH4VO3, and oxalic acid in distilled water was preparedaccording to the calculated stoichiometric ratio with Fe:V = 1:1 ona molar basis. Then, a certain amount of anatase TiO2 support (DT-51) purchased from Millennium Inorganic Chemicals was addedinto the mixed solution and continuously stirred for 1 h. Thereaf-ter, the excess water was removed in a rotary evaporator at 80 �Cwith the help of a vacuum pump. Finally, the sample was desic-cated in an oven at 120 �C for 12 h, followed by calcination in amuffle furnace at 400 �C for 6 h in air. For comparison, 9 wt.%FeVO4/Al2O3 (PURALOX SBa-90, SASOL Germany GmbH), 9 wt.%FeVO4/WO3–TiO2 (DT-52 with 10 wt.% WO3, Millennium InorganicChemicals), 9 wt.% Fe2O3/TiO2, and 9 wt.% V2O5/TiO2 catalysts werealso prepared by the same co-impregnation or impregnation meth-od using Fe(NO3)3�9H2O and NH4VO3 as precursors. To further testthe thermal stability of 9 wt.% FeVO4/TiO2 catalyst, different calci-nation temperatures were also used, i.e. 500, 600, 650, 700, and800 �C for 6 h in air condition.
As reference material, the commercial TiO2 support was cal-cined in a muffle furnace at 400 �C for 6 h in air. FeVO4 was pre-pared by direct evaporation of a mixed solution of Fe(NO3)3,NH4VO3, and oxalic acid with molar ratio Fe:V = 1:1, followed bydesiccation at 120 �C for 12 h and calcination at 400 �C for 6 h. Pris-tine Fe2O3 was prepared by a precipitation method using Fe(NO3)3-
�9H2O as precursor and standard NH3�H2O (25 wt.%) aqueoussolution as precipitator, in which process the precipitate waswashed by distilled water, desiccated at 120 �C for 12 h and cal-cined at 400 �C for 6 h in sequence. Pristine V2O5 was preparedby direct decomposition of NH4VO3 at 400 �C for 6 h in air.
2.2. Activity testing
The steady-state NH3-SCR activity over the series of x wt.%FeVO4/TiO2 catalysts as well as 9 wt.% FeVO4/Al2O3, 9 wt.% FeVO4/WO3–TiO2, 9 wt.% Fe2O3/TiO2, and 9 wt.% V2O5/TiO2 catalysts wastested in a fixed-bed quartz tube reactor at atmospheric pressure,and the reaction conditions were controlled as follows: 500 ppmNO, 500 ppm NH3, 5 vol.% O2, 200 ppm SO2 (when used), 5 vol.%H2O (when used), and N2 balance; 0.6 ml catalyst, 20–40 mesh ifnot noted (to check if the internal diffusional limitation was pres-ent, the smaller particle sizes of 9 wt.% FeVO4/TiO2 catalyst were
also used including 40–60 mesh and 60–80 mesh); total flow rateof 500 ml/min and gas hourly space velocity (GHSV) of 50,000 h�1.The effluent gas was continuously analyzed using an FTIR spec-trometer (Nicolet Nexus 670) equipped with a heated, low volumemultiple-path gas cell (2 m).
2.3. Characterization
The N2 adsorption–desorption isotherms over x wt.% FeVO4/TiO2, 9 wt.% Fe2O3/TiO2, and 9 wt.% V2O5/TiO2 catalysts and corre-sponding reference samples were obtained at �196 �C using aQuantachrome Autosorb-1C instrument. Prior to the N2 physisorp-tion, all samples were degassed at 300 �C for 4 h. Surface areaswere determined by the BET equation in the 0.05–0.35 partial pres-sure range. Pore volumes and average pore diameters were deter-mined by the Barrett–Joyner–Halenda (BJH) method from thedesorption branches of the isotherms.
The powder XRD measurements of x wt.% FeVO4/TiO2, 9 wt.%Fe2O3/TiO2, and 9 wt.% V2O5/TiO2 catalysts and corresponding ref-erence samples were carried out on a computerized PANalyticalX’Pert Pro Diffractometer with CuKa radiation source(k = 0.15406 nm). The data for 2h from 10� to 80� were collectedat 8�/min with the step size of 0.07�.
The Raman spectra of x wt.% FeVO4/TiO2, 9 wt.% Fe2O3/TiO2, and9 wt.% V2O5/TiO2 catalysts and corresponding reference sampleswere collected at room temperature on a Spex 1877 D Triplematespectrograph with the spectral resolution of 2 cm�1. A 532 nmDPSS diode-pumped solid-state semiconductor laser was used asthe excitation source, and the power output was about 30 mW. Be-fore measurements, the samples were well ground and mountedinto a spinning holder to avoid thermal damage during the scan-ning. In order to eliminate the impact of color change in catalystswith different FeVO4 loadings on the variation of Raman signals,we used white CaCO3 powder as internal reference (with the ratioof target sample to CaCO3 being 2.5:1) to normalize the Ramanbands of TiO2 for more reasonable comparison. The Raman signalswere collected with conventional 90� geometry. All Raman spectraused in this paper are unsmoothed.
The XAS of Fe and V K-edges were measured in a transmissionmode at room temperature on the BL-7C beam line, Photon Fac-tory, Institute of Materials Structure Science, High Energy Acceler-ator Research Organization (IMSS-KEK), Japan and the BL14W1beam line, Shanghai Synchrotron Radiation Facility (SSRF). Thestorage ring was operated at 2.5 GeV with 300 mA as an averagestorage current for the BL-7C beam line and 3.5 GeV with200 mA as an average storage current for the BL14W1 beam line.The synchrotron radiation beam line was monochromatized witha Si (111) double crystal monochromator, and mirrors were usedto eliminate higher harmonics. The incident and transmitted beamintensities were monitored using ionization chambers filled withpure N2. Before measurements, all samples were crushed andsieved to 200 mesh or finer and then diluted with flour powderat appropriate ratios and pressed into thin disks. XAS data wereanalyzed using the REX2000 program (Rigaku Co.). XANES spectraof Fe, V K-edges were normalized with the edge height, and then,the first-order derivatives were taken to compare the variation inabsorption edge energies. Since the strong absorption of Ti waspresent in V–Ti-containing samples, it was too difficult to obtainV K-edge EXAFS with good S/N. The EXAFS oscillation v(k) of theFe K-edge was extracted using spline smoothing with a Cook-Say-ers criterion [38] and weighted by k3 in order to compensate forthe diminishing amplitude in the high k range due to the decayof the photoelectron wave. Thereafter, the filtered k3-weightedv(k) was Fourier transformed into R space in the k range of 2.5–13 Å�1 with a Hanning function window. In the curve-fitting step,
342 F. Liu et al. / Journal of Catalysis 307 (2013) 340–351
the possible backscattering amplitude and phase shift were calcu-lated using FEFF8.4 code [39].
The XPS of FeVO4/TiO2, Fe2O3/TiO2, and V2O5/TiO2 catalysts andcorresponding reference samples were recorded on an ImagingPhotoelectron Spectrometer (Axis Ultra, Kratos Analytical Ltd.)using Al Ka radiation (1486.7 eV). Binding energies of Fe 2p, V2p, and Ti 2p were calibrated using the C 1s peak (BE = 284.8 eV)as standard.
2.4. Density functional theory (DFT) calculation
The geometry optimization of the three kinds of stoichiometricFe2O3, V2O5, and FeVO4 crystals was carried out using CASTEP mod-ule in Materials Studio software package. The generalized gradientapproximation (GGA) with PBE functional was used to describe theexchange–correlation effect. The electron–ion interaction was de-scribed by the ultrasoft potential in the reciprocal space. A tightconvergence of the plane-wave expansion was obtained with akinetics energy cutoff of 300 eV.
The Brillouin zone using the Monkhorst–Pack scheme was sam-pled by 3 � 3 � 2, 1 � 4 � 3, and 2 � 2 � 1 for Fe2O3, V2O5, andFeVO4, respectively. For all calculations, the convergence in energyand force was set to 2 � 10�5 eV and 0.05 eV/Å. The atomic chargeswere calculated using the Hirshfeld approach. The electron densitydifference of the investigated crystal models was also analyzed.
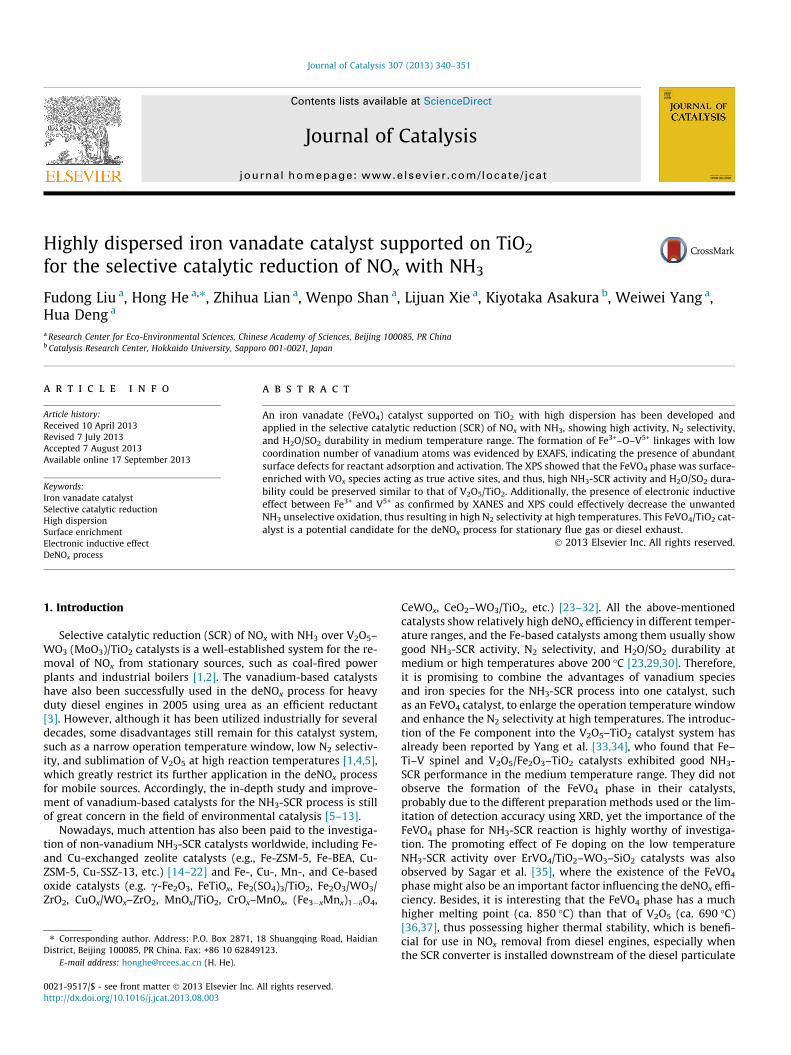
Fig. 1. (A) NOx conversion and (B) N2 selectivity in NH3-SCR reaction as a functionof temperature over x wt.% FeVO4/TiO2 catalysts; (C) the NH3-SCR reaction ratesnormalized by surface area at 175 �C over x wt.% FeVO4/TiO2 catalysts.
3. Results and discussion
3.1. NH3-SCR activity
Fig. 1A and B shows the NOx conversion and N2 selectivity overthe series of x wt.% FeVO4/TiO2 catalysts (20–40 mesh) as a func-tion of temperature in the NH3-SCR reaction. As shown in Fig. 1A,the pristine TiO2 was inactive for NOx reduction below 350 �C. Onlyca. 30% NOx conversion was obtained at 400 �C over TiO2. With asmall amount of FeVO4 supported onto TiO2, such as over1.5 wt.% FeVO4/TiO2 catalyst, the NOx conversion showed a markedincrease, especially in the temperature range of 200–400 �C. Withthe increase of FeVO4 loading amount from 1.5 to 9 wt.%, the SCRactivity below 300 �C showed a monotonic increase. Furtherincreasing the FeVO4 loading amount to 15 wt.% led to no signifi-cant enhancement of SCR activity at low temperatures, but re-sulted in some decrease of NOx conversion above 350 �C. Inaddition, as presented in Fig. 1B, the N2 selectivity showed a mono-tonic decrease above 350 �C with the increase of FeVO4 loadingamount, which was mainly due to the occurrence of unselectivecatalytic oxidation of NH3. Therefore, the 9 wt.% FeVO4/TiO2 is anoptimal catalyst with the appropriate FeVO4 loading for the NH3-SCR reaction, showing high activity and N2 selectivity simulta-neously. It is noteworthy that the pristine FeVO4 exhibited a rela-tively narrow operation temperature window for NOx reductionand also the lowest N2 selectivity, indicating that the sufficient dis-persion of FeVO4 onto TiO2 support was very important for theNH3-SCR reaction, which might influence the electronic state ofthe active phase due to interaction with TiO2 support. Furthermore,as the results shown in Fig. S1 of Supporting information, not onlythe NOx conversion but also the N2 selectivity in NH3-SCR reactionover 9 wt.% FeVO4/TiO2 catalysts with different particle sizes (20–40, 40–60, and 60–80 mesh) were quite similar to each other, indi-cating that the adopted catalyst particle size of 20–40 mesh inNH3-SCR activity tests of this study had already eliminated theinternal diffusional limitations. To further investigate the effectof FeVO4 loading amount onto TiO2 support on the SCR reaction,the reaction rates normalized by surface area at 175 �C (at whichthe NOx conversion over all catalysts could be kept below 40% to
eliminate the influence of mass and thermal transformation) werecalculated, as the results shown in Fig. 1C. With the increasing ofFeVO4 loading amount from 1.5 to 9 wt.%, the rate constants fordeNOx process showed a monotonic increase, implying that theFeVO4 species assembled gradually on the TiO2 surface in this pro-cess supplying more catalytically active sites for NH3-SCR reaction.Further increasing the FeVO4 loading amount did not result in theobvious increase of reaction rates which maintained at ca.3.0 � 10�9 mol s�1 m�2, indicating that above 9 wt.% loadingamount, the FeVO4 species might have already exceeded themonolayer dispersion limit leading to a surface convergence onTiO2 support. This point of view will be discussed in detail in thefollowing characterization sections.
It is reasonable that, with the monolayer dispersion of FeVO4
species on TiO2 support, the exposed active sites for SCR reactionhave already reached the maximum, and at the same time, theroles of TiO2 support in FeVO4/TiO2 catalysts interacting with Feor V species to influence their electronic state and also workingas efficient NH3 reservoir would not be weakened. Therefore, theoptimal deNOx efficiency could be obtained over 9 wt.% FeVO4/TiO2 catalyst without needing the formation of multiple FeVO4 lay-ers at higher loadings. This also means in another aspect that, evenwith the similar monolayer dispersion of FeVO4 species, the
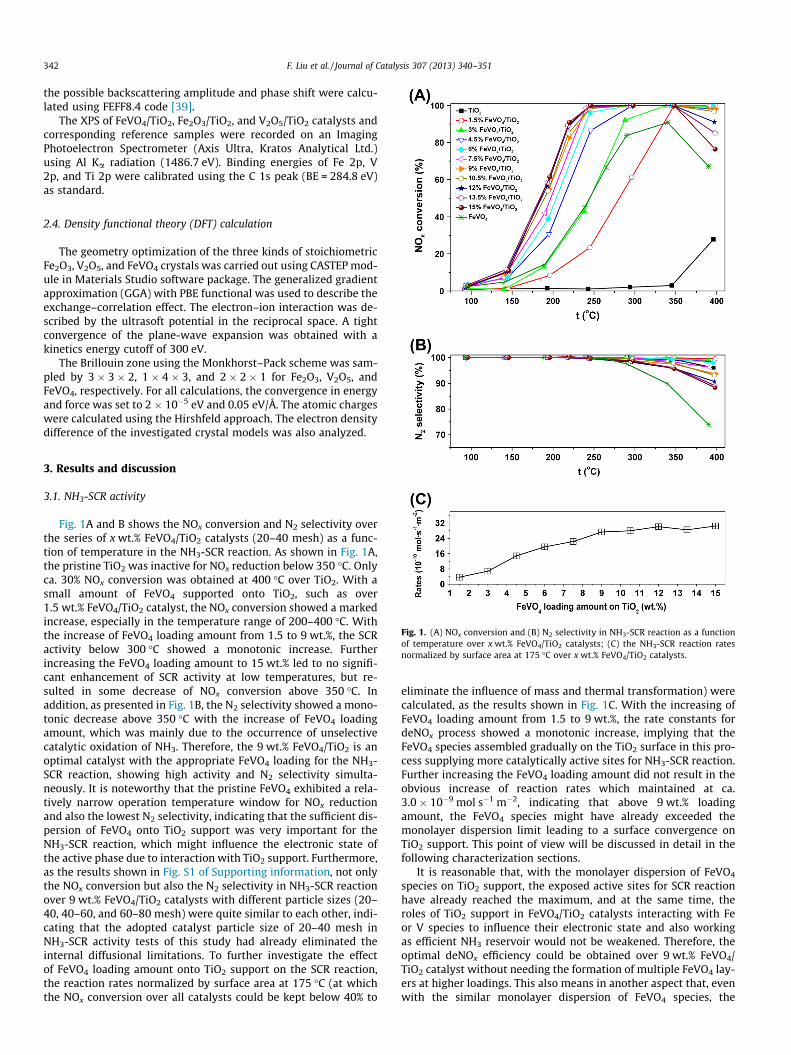
Fig. 3. (A) NOx conversion and (B) N2 selectivity in NH3-SCR reaction as a functionof temperature over 9 wt.% Fe2O3/TiO2, 9 wt.% V2O5/TiO2, 9 wt.% FeVO4/TiO2 and9 wt.% Fe2O3/TiO2 + 9 wt.% V2O5/TiO2 physically mixed catalysts.
F. Liu et al. / Journal of Catalysis 307 (2013) 340–351 343
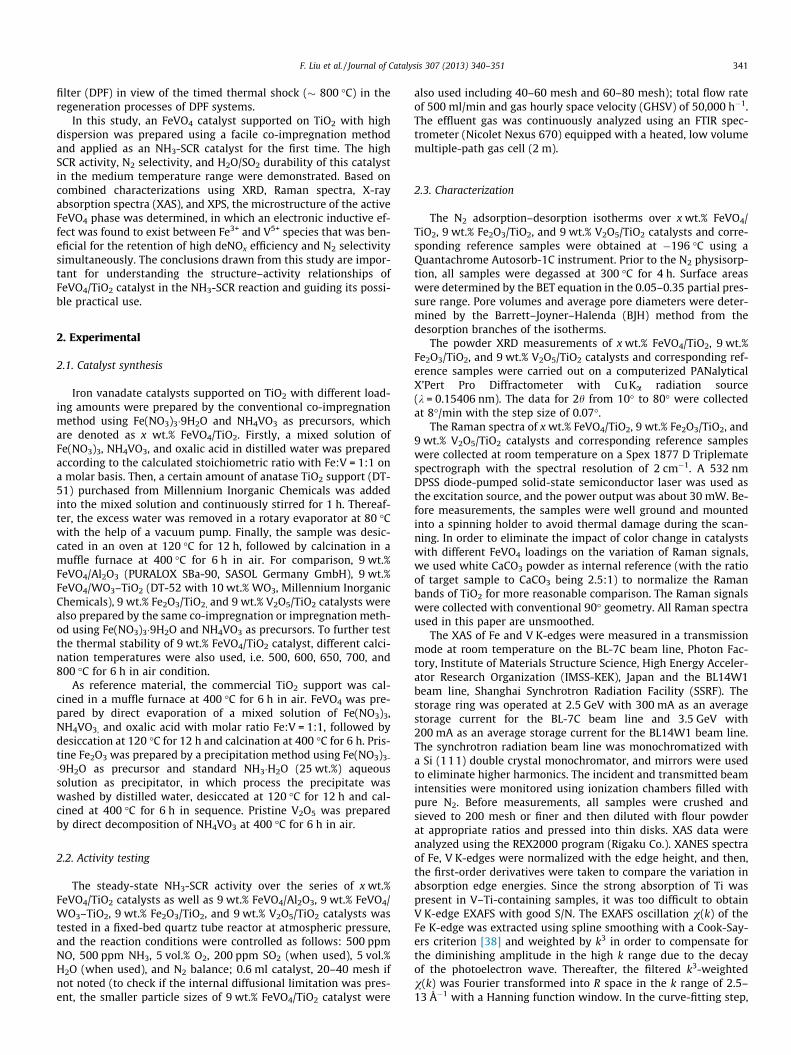
property of catalyst supports could also greatly influence the NH3-SCR activity. To prove this assumption, another two catalystsincluding 9 wt.% FeVO4/Al2O3 and 9 wt.% FeVO4/WO3–TiO2 wereprepared using the supports with similar surface areas as that ofTiO2, and their activity test results are shown in Fig. 2. As weclearly see, the 9 wt.% FeVO4/Al2O3 catalyst showed the lowestNH3-SCR activity in the whole temperature range although withthe highest N2 selectivity. Comparing with the 9 wt.% FeVO4/TiO2
catalyst, the 9 wt.% FeVO4/WO3–TiO2 showed higher NH3-SCRactivity at low temperatures probably due to the higher surfaceacidity induced by WO3 and a little lower NH3-SCR activity above350 �C, with very similar N2 selectivity in the whole temperaturerange. Therefore, besides of the dispersion degree of FeVO4 species,the property of catalyst support could indeed greatly influence itscatalytic performance for SCR reaction, which is worthy to beinvestigated in the near future. In the following studies, we mainlyused anatase TiO2 support to elucidate the structure–activity rela-tionship of FeVO4 catalyst for the deNOx process.
Fig. 3 shows the NOx conversion and N2 selectivity over 9 wt.%Fe2O3/TiO2, 9 wt.% V2O5/TiO2, and 9 wt.% FeVO4/TiO2 catalysts(20–40 mesh) for comparison. Compared with the 9 wt.% V2O5/TiO2 catalyst, the 9 wt.% FeVO4/TiO2 catalyst showed lower SCRactivity to a certain extent below 250 �C, but much higher SCRactivity and N2 selectivity above 350 �C. It is noteworthy that onlyca. 70% N2 selectivity was obtained over the 9 wt.% V2O5/TiO2 cat-alyst at 400 �C, due to the formation of a large amount of N2O.Compared with the 9 wt.% Fe2O3/TiO2 catalyst, the SCR activity ofthe 9 wt.% FeVO4/TiO2 catalyst below 300 �C was much higher,and the operation temperature window was also much wider. Fur-thermore, the presence of vanadium species in addition to ironspecies in the 9 wt.% FeVO4/TiO2 catalyst did not result in anynoticeable decrease in N2 selectivity over the whole temperaturerange. These results indicate that the interaction between ironand vanadium species in the FeVO4/TiO2 catalyst possibly led tothe formation of a new active phase, which was different fromthose in the Fe2O3/TiO2 and V2O5/TiO2 catalysts. This point of viewcan be confirmed by the activity test result of the physically mixed9 wt.% Fe2O3/TiO2 + 9 wt.% V2O5/TiO2 catalysts, as also shown inFig. 3. It is obvious that the physically mixed catalysts only showedan intermediate SCR activity at low temperatures between 9 wt.%Fe2O3/TiO2 and 9 wt.% V2O5/TiO2, and a similar SCR activity at high
Fig. 2. (A) NOx conversion and (B) N2 selectivity in NH3-SCR reaction as a functionof temperature over 9 wt.% FeVO4/Al2O3, 9 wt.% FeVO4/TiO2, 9 wt.% FeVO4/WO3–TiO2 catalysts.
temperatures as that of 9 wt.% V2O5/TiO2 (which was lower thanthat over 9 wt.% FeVO4/TiO2). The N2 selectivity over the physicallymixed catalysts also showed an intermediate state, higher than9 wt.% V2O5/TiO2 but lower than 9 wt.% Fe2O3/TiO2 and 9 wt.%FeVO4/TiO2. These catalytic results again suggest that, differentfrom the physically mixed effect, the synergistic effect betweenFe and V species must exist in FeVO4 catalyst, which can be ex-plained by the subsequent characterization results.
3.2. SO2/H2O durability
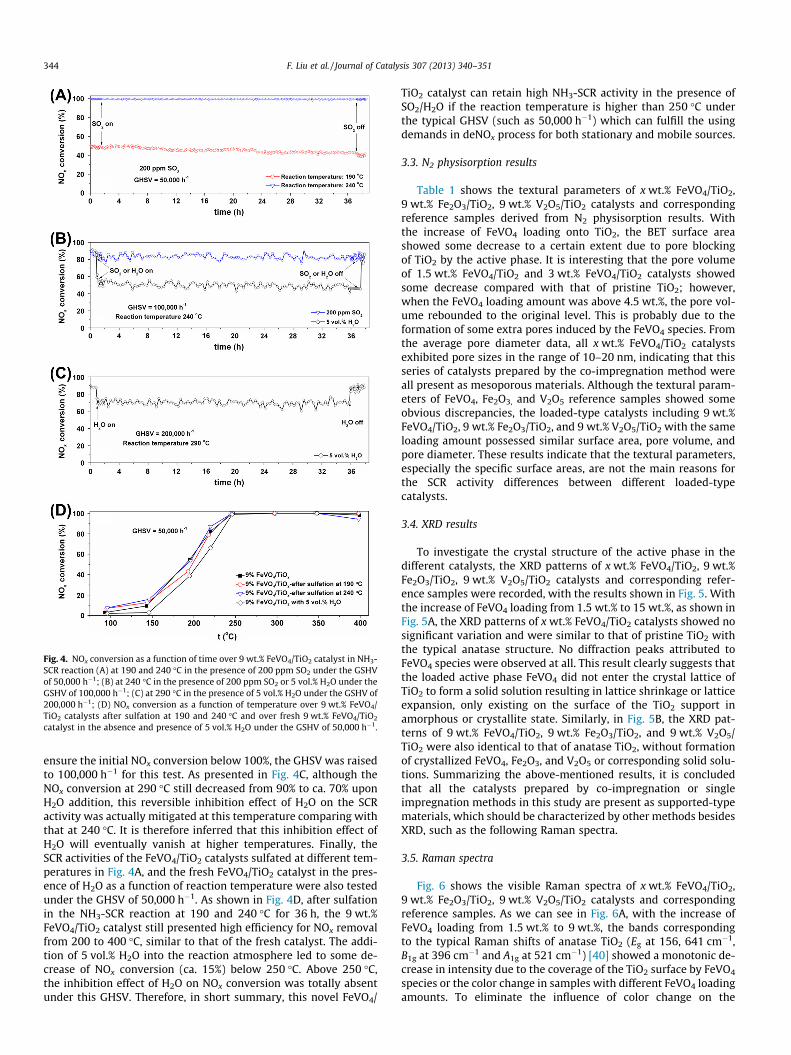
In practical use, the SCR reaction atmosphere usually containssome fractions of SO2 and water vapor. Therefore, we also testedthe SO2/H2O durability of the 9 wt.% FeVO4/TiO2 catalyst in theNH3-SCR reaction. Fig. 4A shows the NOx conversion over 9 wt.%FeVO4/TiO2 catalyst as a function of time in the presence of200 ppm SO2 at 190 and 240 �C under the GHSV of 50,000 h�1. Aswe can see, with increasing reaction time, the NOx conversion at190 �C showed a slow decrease from 50% to 40% for the first 24 hand then maintained at 40% for the next 12 h. This activity declinemight be caused by the deposition of ammonium sulfate/bisulfateon the catalyst surface, blocking some active sites for NH3-SCRreaction. At 240 �C, the introduction of 200 ppm SO2 into the reac-tion atmosphere did not result in any decrease of NOx conversionfor the 36 h test, indicating the high resistance of the FeVO4/TiO2
catalyst to SO2 poisoning. Afterward, we further increased theGHSV to 100,000 h�1 to test the SO2/H2O durability of 9 wt.%FeVO4/TiO2 catalyst at 240 �C. The stability test results in Fig. 4Bshowed that even at higher GHSV, this catalyst still showed rathergood resistance to SO2 poisoning without observing the apparentdecline of SCR activity in the long term operation. However, inthe presence of 5 vol.% H2O, the NOx conversion decreased fromthe initial 90% to ca. 50%, which was possibly due to the blockingof some active sites on the catalyst surface for reactant adsorption.After the cutting-off of H2O inlet, the NOx conversion over 9 wt.%FeVO4/TiO2 catalyst rapidly recovered to 90%, indicating a revers-ible inhibition effect of H2O on the SCR activity. To further confirmthe influence of reaction temperature on the inhibition effect ofH2O, we also recorded the NOx conversion in NH3-SCR reactionwith 5 vol.% H2O over 9 wt.% FeVO4/TiO2 catalyst at 290 �C. To
Fig. 4. NOx conversion as a function of time over 9 wt.% FeVO4/TiO2 catalyst in NH3-SCR reaction (A) at 190 and 240 �C in the presence of 200 ppm SO2 under the GSHVof 50,000 h�1; (B) at 240 �C in the presence of 200 ppm SO2 or 5 vol.% H2O under theGSHV of 100,000 h�1; (C) at 290 �C in the presence of 5 vol.% H2O under the GSHV of200,000 h�1; (D) NOx conversion as a function of temperature over 9 wt.% FeVO4/TiO2 catalysts after sulfation at 190 and 240 �C and over fresh 9 wt.% FeVO4/TiO2
catalyst in the absence and presence of 5 vol.% H2O under the GSHV of 50,000 h�1.
344 F. Liu et al. / Journal of Catalysis 307 (2013) 340–351
ensure the initial NOx conversion below 100%, the GHSV was raisedto 100,000 h�1 for this test. As presented in Fig. 4C, although theNOx conversion at 290 �C still decreased from 90% to ca. 70% uponH2O addition, this reversible inhibition effect of H2O on the SCRactivity was actually mitigated at this temperature comparing withthat at 240 �C. It is therefore inferred that this inhibition effect ofH2O will eventually vanish at higher temperatures. Finally, theSCR activities of the FeVO4/TiO2 catalysts sulfated at different tem-peratures in Fig. 4A, and the fresh FeVO4/TiO2 catalyst in the pres-ence of H2O as a function of reaction temperature were also testedunder the GHSV of 50,000 h�1. As shown in Fig. 4D, after sulfationin the NH3-SCR reaction at 190 and 240 �C for 36 h, the 9 wt.%FeVO4/TiO2 catalyst still presented high efficiency for NOx removalfrom 200 to 400 �C, similar to that of the fresh catalyst. The addi-tion of 5 vol.% H2O into the reaction atmosphere led to some de-crease of NOx conversion (ca. 15%) below 250 �C. Above 250 �C,the inhibition effect of H2O on NOx conversion was totally absentunder this GHSV. Therefore, in short summary, this novel FeVO4/
TiO2 catalyst can retain high NH3-SCR activity in the presence ofSO2/H2O if the reaction temperature is higher than 250 �C underthe typical GHSV (such as 50,000 h�1) which can fulfill the usingdemands in deNOx process for both stationary and mobile sources.
3.3. N2 physisorption results
Table 1 shows the textural parameters of x wt.% FeVO4/TiO2,9 wt.% Fe2O3/TiO2, 9 wt.% V2O5/TiO2 catalysts and correspondingreference samples derived from N2 physisorption results. Withthe increase of FeVO4 loading onto TiO2, the BET surface areashowed some decrease to a certain extent due to pore blockingof TiO2 by the active phase. It is interesting that the pore volumeof 1.5 wt.% FeVO4/TiO2 and 3 wt.% FeVO4/TiO2 catalysts showedsome decrease compared with that of pristine TiO2; however,when the FeVO4 loading amount was above 4.5 wt.%, the pore vol-ume rebounded to the original level. This is probably due to theformation of some extra pores induced by the FeVO4 species. Fromthe average pore diameter data, all x wt.% FeVO4/TiO2 catalystsexhibited pore sizes in the range of 10–20 nm, indicating that thisseries of catalysts prepared by the co-impregnation method wereall present as mesoporous materials. Although the textural param-eters of FeVO4, Fe2O3, and V2O5 reference samples showed someobvious discrepancies, the loaded-type catalysts including 9 wt.%FeVO4/TiO2, 9 wt.% Fe2O3/TiO2, and 9 wt.% V2O5/TiO2 with the sameloading amount possessed similar surface area, pore volume, andpore diameter. These results indicate that the textural parameters,especially the specific surface areas, are not the main reasons forthe SCR activity differences between different loaded-typecatalysts.
3.4. XRD results
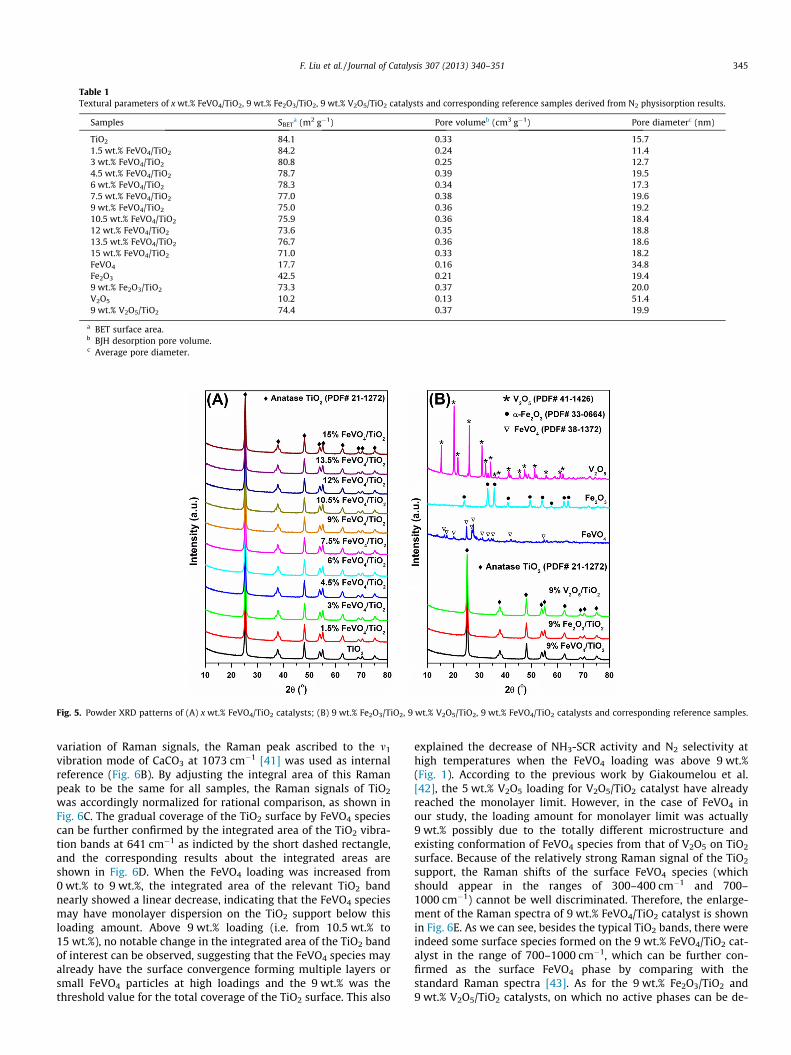
To investigate the crystal structure of the active phase in thedifferent catalysts, the XRD patterns of x wt.% FeVO4/TiO2, 9 wt.%Fe2O3/TiO2, 9 wt.% V2O5/TiO2 catalysts and corresponding refer-ence samples were recorded, with the results shown in Fig. 5. Withthe increase of FeVO4 loading from 1.5 wt.% to 15 wt.%, as shown inFig. 5A, the XRD patterns of x wt.% FeVO4/TiO2 catalysts showed nosignificant variation and were similar to that of pristine TiO2 withthe typical anatase structure. No diffraction peaks attributed toFeVO4 species were observed at all. This result clearly suggests thatthe loaded active phase FeVO4 did not enter the crystal lattice ofTiO2 to form a solid solution resulting in lattice shrinkage or latticeexpansion, only existing on the surface of the TiO2 support inamorphous or crystallite state. Similarly, in Fig. 5B, the XRD pat-terns of 9 wt.% FeVO4/TiO2, 9 wt.% Fe2O3/TiO2, and 9 wt.% V2O5/TiO2 were also identical to that of anatase TiO2, without formationof crystallized FeVO4, Fe2O3, and V2O5 or corresponding solid solu-tions. Summarizing the above-mentioned results, it is concludedthat all the catalysts prepared by co-impregnation or singleimpregnation methods in this study are present as supported-typematerials, which should be characterized by other methods besidesXRD, such as the following Raman spectra.
3.5. Raman spectra
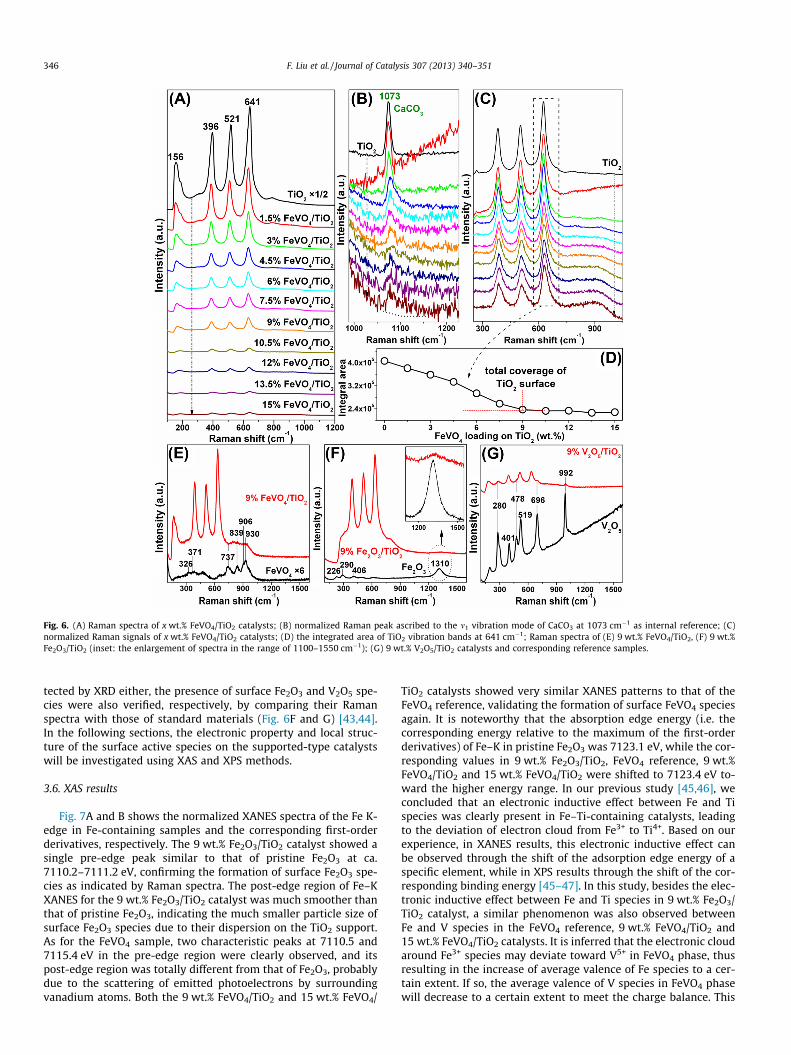
Fig. 6 shows the visible Raman spectra of x wt.% FeVO4/TiO2,9 wt.% Fe2O3/TiO2, 9 wt.% V2O5/TiO2 catalysts and correspondingreference samples. As we can see in Fig. 6A, with the increase ofFeVO4 loading from 1.5 wt.% to 9 wt.%, the bands correspondingto the typical Raman shifts of anatase TiO2 (Eg at 156, 641 cm�1,B1g at 396 cm�1 and A1g at 521 cm�1) [40] showed a monotonic de-crease in intensity due to the coverage of the TiO2 surface by FeVO4
species or the color change in samples with different FeVO4 loadingamounts. To eliminate the influence of color change on the
Table 1Textural parameters of x wt.% FeVO4/TiO2, 9 wt.% Fe2O3/TiO2, 9 wt.% V2O5/TiO2 catalysts and corresponding reference samples derived from N2 physisorption results.
a BET surface area.b BJH desorption pore volume.c Average pore diameter.
Fig. 5. Powder XRD patterns of (A) x wt.% FeVO4/TiO2 catalysts; (B) 9 wt.% Fe2O3/TiO2, 9 wt.% V2O5/TiO2, 9 wt.% FeVO4/TiO2 catalysts and corresponding reference samples.
F. Liu et al. / Journal of Catalysis 307 (2013) 340–351 345
variation of Raman signals, the Raman peak ascribed to the m1
vibration mode of CaCO3 at 1073 cm�1 [41] was used as internalreference (Fig. 6B). By adjusting the integral area of this Ramanpeak to be the same for all samples, the Raman signals of TiO2
was accordingly normalized for rational comparison, as shown inFig. 6C. The gradual coverage of the TiO2 surface by FeVO4 speciescan be further confirmed by the integrated area of the TiO2 vibra-tion bands at 641 cm�1 as indicted by the short dashed rectangle,and the corresponding results about the integrated areas areshown in Fig. 6D. When the FeVO4 loading was increased from0 wt.% to 9 wt.%, the integrated area of the relevant TiO2 bandnearly showed a linear decrease, indicating that the FeVO4 speciesmay have monolayer dispersion on the TiO2 support below thisloading amount. Above 9 wt.% loading (i.e. from 10.5 wt.% to15 wt.%), no notable change in the integrated area of the TiO2 bandof interest can be observed, suggesting that the FeVO4 species mayalready have the surface convergence forming multiple layers orsmall FeVO4 particles at high loadings and the 9 wt.% was thethreshold value for the total coverage of the TiO2 surface. This also
explained the decrease of NH3-SCR activity and N2 selectivity athigh temperatures when the FeVO4 loading was above 9 wt.%(Fig. 1). According to the previous work by Giakoumelou et al.[42], the 5 wt.% V2O5 loading for V2O5/TiO2 catalyst have alreadyreached the monolayer limit. However, in the case of FeVO4 inour study, the loading amount for monolayer limit was actually9 wt.% possibly due to the totally different microstructure andexisting conformation of FeVO4 species from that of V2O5 on TiO2
surface. Because of the relatively strong Raman signal of the TiO2
support, the Raman shifts of the surface FeVO4 species (whichshould appear in the ranges of 300–400 cm�1 and 700–1000 cm�1) cannot be well discriminated. Therefore, the enlarge-ment of the Raman spectra of 9 wt.% FeVO4/TiO2 catalyst is shownin Fig. 6E. As we can see, besides the typical TiO2 bands, there wereindeed some surface species formed on the 9 wt.% FeVO4/TiO2 cat-alyst in the range of 700–1000 cm�1, which can be further con-firmed as the surface FeVO4 phase by comparing with thestandard Raman spectra [43]. As for the 9 wt.% Fe2O3/TiO2 and9 wt.% V2O5/TiO2 catalysts, on which no active phases can be de-
Fig. 6. (A) Raman spectra of x wt.% FeVO4/TiO2 catalysts; (B) normalized Raman peak ascribed to the m1 vibration mode of CaCO3 at 1073 cm�1 as internal reference; (C)normalized Raman signals of x wt.% FeVO4/TiO2 catalysts; (D) the integrated area of TiO2 vibration bands at 641 cm�1; Raman spectra of (E) 9 wt.% FeVO4/TiO2, (F) 9 wt.%Fe2O3/TiO2 (inset: the enlargement of spectra in the range of 1100–1550 cm�1); (G) 9 wt.% V2O5/TiO2 catalysts and corresponding reference samples.
346 F. Liu et al. / Journal of Catalysis 307 (2013) 340–351
tected by XRD either, the presence of surface Fe2O3 and V2O5 spe-cies were also verified, respectively, by comparing their Ramanspectra with those of standard materials (Fig. 6F and G) [43,44].In the following sections, the electronic property and local struc-ture of the surface active species on the supported-type catalystswill be investigated using XAS and XPS methods.
3.6. XAS results
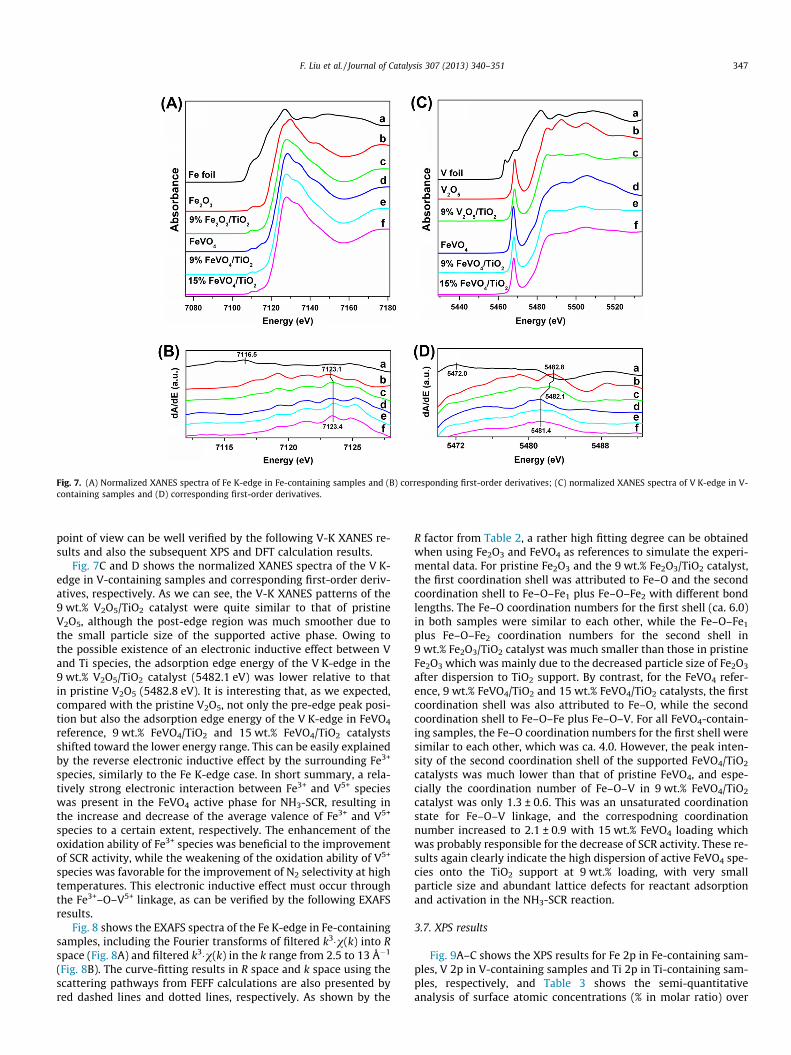
Fig. 7A and B shows the normalized XANES spectra of the Fe K-edge in Fe-containing samples and the corresponding first-orderderivatives, respectively. The 9 wt.% Fe2O3/TiO2 catalyst showed asingle pre-edge peak similar to that of pristine Fe2O3 at ca.7110.2–7111.2 eV, confirming the formation of surface Fe2O3 spe-cies as indicated by Raman spectra. The post-edge region of Fe–KXANES for the 9 wt.% Fe2O3/TiO2 catalyst was much smoother thanthat of pristine Fe2O3, indicating the much smaller particle size ofsurface Fe2O3 species due to their dispersion on the TiO2 support.As for the FeVO4 sample, two characteristic peaks at 7110.5 and7115.4 eV in the pre-edge region were clearly observed, and itspost-edge region was totally different from that of Fe2O3, probablydue to the scattering of emitted photoelectrons by surroundingvanadium atoms. Both the 9 wt.% FeVO4/TiO2 and 15 wt.% FeVO4/
TiO2 catalysts showed very similar XANES patterns to that of theFeVO4 reference, validating the formation of surface FeVO4 speciesagain. It is noteworthy that the absorption edge energy (i.e. thecorresponding energy relative to the maximum of the first-orderderivatives) of Fe–K in pristine Fe2O3 was 7123.1 eV, while the cor-responding values in 9 wt.% Fe2O3/TiO2, FeVO4 reference, 9 wt.%FeVO4/TiO2 and 15 wt.% FeVO4/TiO2 were shifted to 7123.4 eV to-ward the higher energy range. In our previous study [45,46], weconcluded that an electronic inductive effect between Fe and Tispecies was clearly present in Fe–Ti-containing catalysts, leadingto the deviation of electron cloud from Fe3+ to Ti4+. Based on ourexperience, in XANES results, this electronic inductive effect canbe observed through the shift of the adsorption edge energy of aspecific element, while in XPS results through the shift of the cor-responding binding energy [45–47]. In this study, besides the elec-tronic inductive effect between Fe and Ti species in 9 wt.% Fe2O3/TiO2 catalyst, a similar phenomenon was also observed betweenFe and V species in the FeVO4 reference, 9 wt.% FeVO4/TiO2 and15 wt.% FeVO4/TiO2 catalysts. It is inferred that the electronic cloudaround Fe3+ species may deviate toward V5+ in FeVO4 phase, thusresulting in the increase of average valence of Fe species to a cer-tain extent. If so, the average valence of V species in FeVO4 phasewill decrease to a certain extent to meet the charge balance. This
Fig. 7. (A) Normalized XANES spectra of Fe K-edge in Fe-containing samples and (B) corresponding first-order derivatives; (C) normalized XANES spectra of V K-edge in V-containing samples and (D) corresponding first-order derivatives.
F. Liu et al. / Journal of Catalysis 307 (2013) 340–351 347
point of view can be well verified by the following V-K XANES re-sults and also the subsequent XPS and DFT calculation results.
Fig. 7C and D shows the normalized XANES spectra of the V K-edge in V-containing samples and corresponding first-order deriv-atives, respectively. As we can see, the V-K XANES patterns of the9 wt.% V2O5/TiO2 catalyst were quite similar to that of pristineV2O5, although the post-edge region was much smoother due tothe small particle size of the supported active phase. Owing tothe possible existence of an electronic inductive effect between Vand Ti species, the adsorption edge energy of the V K-edge in the9 wt.% V2O5/TiO2 catalyst (5482.1 eV) was lower relative to thatin pristine V2O5 (5482.8 eV). It is interesting that, as we expected,compared with the pristine V2O5, not only the pre-edge peak posi-tion but also the adsorption edge energy of the V K-edge in FeVO4
reference, 9 wt.% FeVO4/TiO2 and 15 wt.% FeVO4/TiO2 catalystsshifted toward the lower energy range. This can be easily explainedby the reverse electronic inductive effect by the surrounding Fe3+
species, similarly to the Fe K-edge case. In short summary, a rela-tively strong electronic interaction between Fe3+ and V5+ specieswas present in the FeVO4 active phase for NH3-SCR, resulting inthe increase and decrease of the average valence of Fe3+ and V5+
species to a certain extent, respectively. The enhancement of theoxidation ability of Fe3+ species was beneficial to the improvementof SCR activity, while the weakening of the oxidation ability of V5+
species was favorable for the improvement of N2 selectivity at hightemperatures. This electronic inductive effect must occur throughthe Fe3+–O–V5+ linkage, as can be verified by the following EXAFSresults.
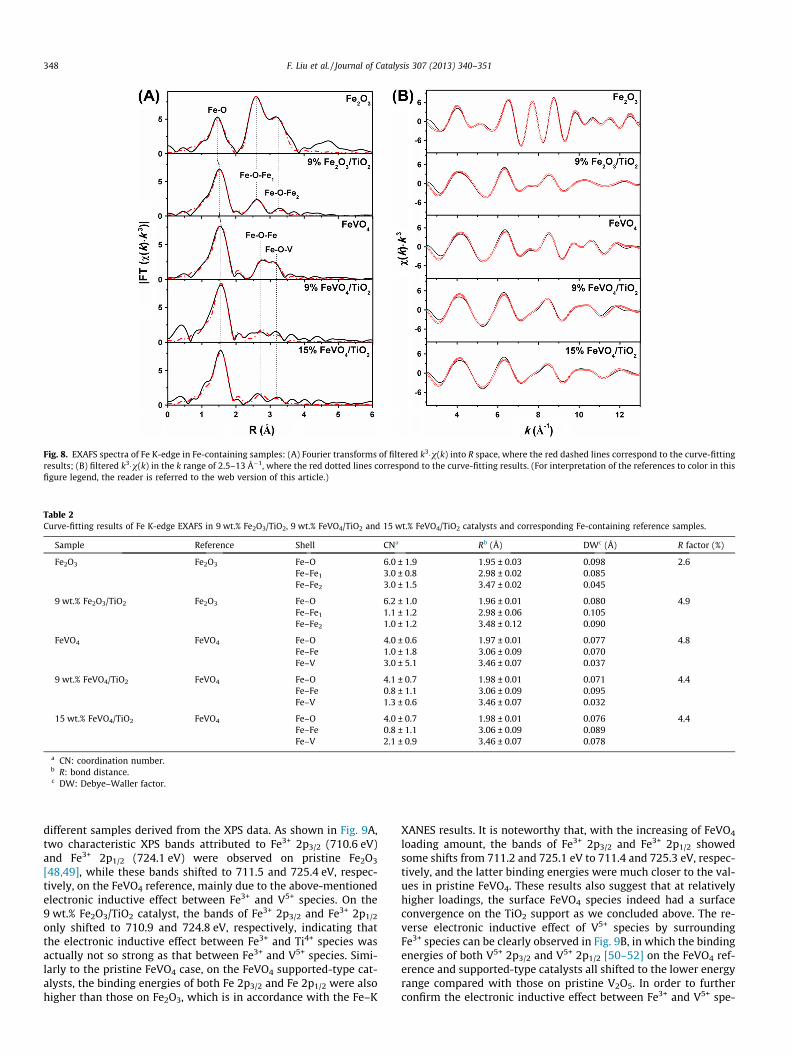
Fig. 8 shows the EXAFS spectra of the Fe K-edge in Fe-containingsamples, including the Fourier transforms of filtered k3�v(k) into Rspace (Fig. 8A) and filtered k3�v(k) in the k range from 2.5 to 13 �1
(Fig. 8B). The curve-fitting results in R space and k space using thescattering pathways from FEFF calculations are also presented byred dashed lines and dotted lines, respectively. As shown by the
R factor from Table 2, a rather high fitting degree can be obtainedwhen using Fe2O3 and FeVO4 as references to simulate the experi-mental data. For pristine Fe2O3 and the 9 wt.% Fe2O3/TiO2 catalyst,the first coordination shell was attributed to Fe–O and the secondcoordination shell to Fe–O–Fe1 plus Fe–O–Fe2 with different bondlengths. The Fe–O coordination numbers for the first shell (ca. 6.0)in both samples were similar to each other, while the Fe–O–Fe1
plus Fe–O–Fe2 coordination numbers for the second shell in9 wt.% Fe2O3/TiO2 catalyst was much smaller than those in pristineFe2O3 which was mainly due to the decreased particle size of Fe2O3
after dispersion to TiO2 support. By contrast, for the FeVO4 refer-ence, 9 wt.% FeVO4/TiO2 and 15 wt.% FeVO4/TiO2 catalysts, the firstcoordination shell was also attributed to Fe–O, while the secondcoordination shell to Fe–O–Fe plus Fe–O–V. For all FeVO4-contain-ing samples, the Fe–O coordination numbers for the first shell weresimilar to each other, which was ca. 4.0. However, the peak inten-sity of the second coordination shell of the supported FeVO4/TiO2
catalysts was much lower than that of pristine FeVO4, and espe-cially the coordination number of Fe–O–V in 9 wt.% FeVO4/TiO2
catalyst was only 1.3 ± 0.6. This was an unsaturated coordinationstate for Fe–O–V linkage, and the correspodning coordinationnumber increased to 2.1 ± 0.9 with 15 wt.% FeVO4 loading whichwas probably responsible for the decrease of SCR activity. These re-sults again clearly indicate the high dispersion of active FeVO4 spe-cies onto the TiO2 support at 9 wt.% loading, with very smallparticle size and abundant lattice defects for reactant adsorptionand activation in the NH3-SCR reaction.
3.7. XPS results
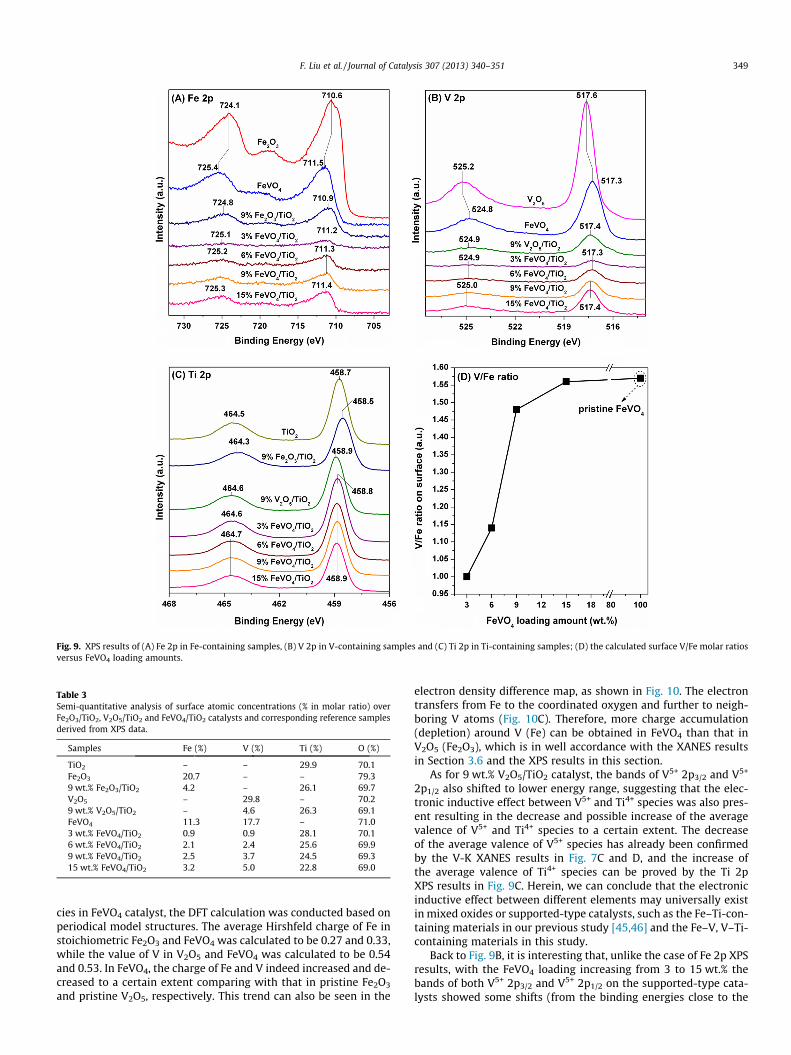
Fig. 9A–C shows the XPS results for Fe 2p in Fe-containing sam-ples, V 2p in V-containing samples and Ti 2p in Ti-containing sam-ples, respectively, and Table 3 shows the semi-quantitativeanalysis of surface atomic concentrations (% in molar ratio) over
Fig. 8. EXAFS spectra of Fe K-edge in Fe-containing samples: (A) Fourier transforms of filtered k3�v(k) into R space, where the red dashed lines correspond to the curve-fittingresults; (B) filtered k3�v(k) in the k range of 2.5–13 Å�1, where the red dotted lines correspond to the curve-fitting results. (For interpretation of the references to color in thisfigure legend, the reader is referred to the web version of this article.)
Table 2Curve-fitting results of Fe K-edge EXAFS in 9 wt.% Fe2O3/TiO2, 9 wt.% FeVO4/TiO2 and 15 wt.% FeVO4/TiO2 catalysts and corresponding Fe-containing reference samples.
a CN: coordination number.b R: bond distance.c DW: Debye–Waller factor.
348 F. Liu et al. / Journal of Catalysis 307 (2013) 340–351
different samples derived from the XPS data. As shown in Fig. 9A,two characteristic XPS bands attributed to Fe3+ 2p3/2 (710.6 eV)and Fe3+ 2p1/2 (724.1 eV) were observed on pristine Fe2O3
[48,49], while these bands shifted to 711.5 and 725.4 eV, respec-tively, on the FeVO4 reference, mainly due to the above-mentionedelectronic inductive effect between Fe3+ and V5+ species. On the9 wt.% Fe2O3/TiO2 catalyst, the bands of Fe3+ 2p3/2 and Fe3+ 2p1/2
only shifted to 710.9 and 724.8 eV, respectively, indicating thatthe electronic inductive effect between Fe3+ and Ti4+ species wasactually not so strong as that between Fe3+ and V5+ species. Simi-larly to the pristine FeVO4 case, on the FeVO4 supported-type cat-alysts, the binding energies of both Fe 2p3/2 and Fe 2p1/2 were alsohigher than those on Fe2O3, which is in accordance with the Fe–K
XANES results. It is noteworthy that, with the increasing of FeVO4
loading amount, the bands of Fe3+ 2p3/2 and Fe3+ 2p1/2 showedsome shifts from 711.2 and 725.1 eV to 711.4 and 725.3 eV, respec-tively, and the latter binding energies were much closer to the val-ues in pristine FeVO4. These results also suggest that at relativelyhigher loadings, the surface FeVO4 species indeed had a surfaceconvergence on the TiO2 support as we concluded above. The re-verse electronic inductive effect of V5+ species by surroundingFe3+ species can be clearly observed in Fig. 9B, in which the bindingenergies of both V5+ 2p3/2 and V5+ 2p1/2 [50–52] on the FeVO4 ref-erence and supported-type catalysts all shifted to the lower energyrange compared with those on pristine V2O5. In order to furtherconfirm the electronic inductive effect between Fe3+ and V5+ spe-
Fig. 9. XPS results of (A) Fe 2p in Fe-containing samples, (B) V 2p in V-containing samples and (C) Ti 2p in Ti-containing samples; (D) the calculated surface V/Fe molar ratiosversus FeVO4 loading amounts.
Table 3Semi-quantitative analysis of surface atomic concentrations (% in molar ratio) overFe2O3/TiO2, V2O5/TiO2 and FeVO4/TiO2 catalysts and corresponding reference samplesderived from XPS data.
F. Liu et al. / Journal of Catalysis 307 (2013) 340–351 349
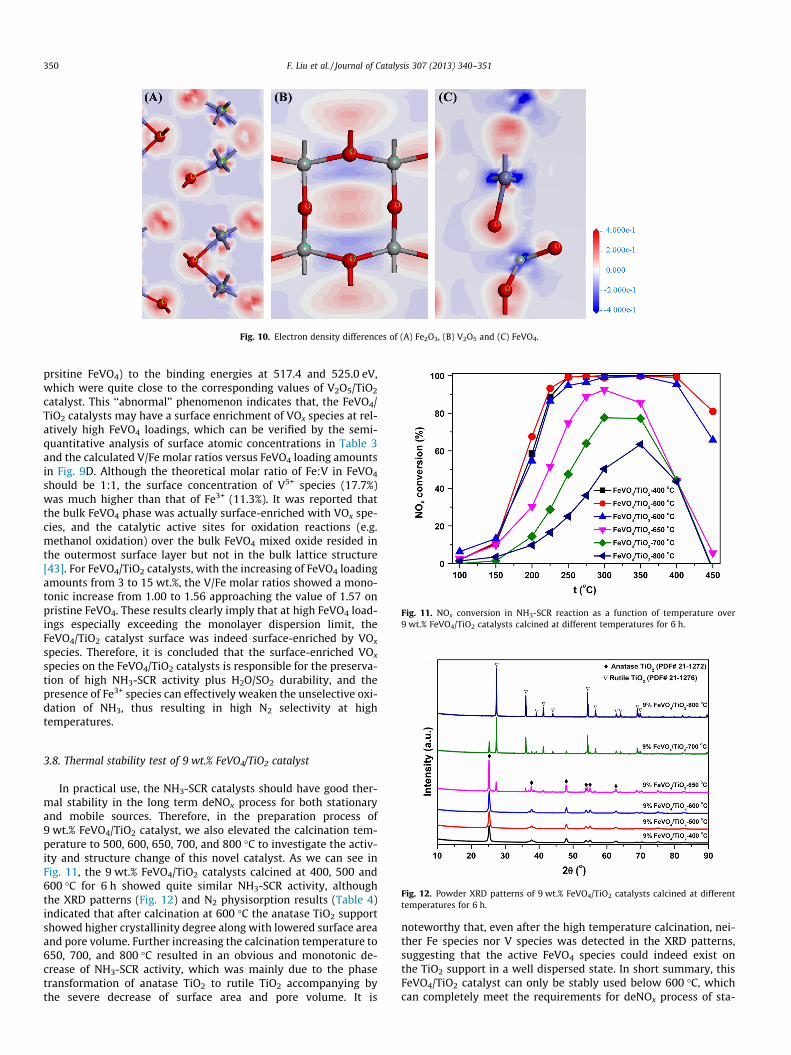
cies in FeVO4 catalyst, the DFT calculation was conducted based onperiodical model structures. The average Hirshfeld charge of Fe instoichiometric Fe2O3 and FeVO4 was calculated to be 0.27 and 0.33,while the value of V in V2O5 and FeVO4 was calculated to be 0.54and 0.53. In FeVO4, the charge of Fe and V indeed increased and de-creased to a certain extent comparing with that in pristine Fe2O3
and pristine V2O5, respectively. This trend can also be seen in the
electron density difference map, as shown in Fig. 10. The electrontransfers from Fe to the coordinated oxygen and further to neigh-boring V atoms (Fig. 10C). Therefore, more charge accumulation(depletion) around V (Fe) can be obtained in FeVO4 than that inV2O5 (Fe2O3), which is in well accordance with the XANES resultsin Section 3.6 and the XPS results in this section.
As for 9 wt.% V2O5/TiO2 catalyst, the bands of V5+ 2p3/2 and V5+
2p1/2 also shifted to lower energy range, suggesting that the elec-tronic inductive effect between V5+ and Ti4+ species was also pres-ent resulting in the decrease and possible increase of the averagevalence of V5+ and Ti4+ species to a certain extent. The decreaseof the average valence of V5+ species has already been confirmedby the V-K XANES results in Fig. 7C and D, and the increase ofthe average valence of Ti4+ species can be proved by the Ti 2pXPS results in Fig. 9C. Herein, we can conclude that the electronicinductive effect between different elements may universally existin mixed oxides or supported-type catalysts, such as the Fe–Ti-con-taining materials in our previous study [45,46] and the Fe–V, V–Ti-containing materials in this study.
Back to Fig. 9B, it is interesting that, unlike the case of Fe 2p XPSresults, with the FeVO4 loading increasing from 3 to 15 wt.% thebands of both V5+ 2p3/2 and V5+ 2p1/2 on the supported-type cata-lysts showed some shifts (from the binding energies close to the
Fig. 10. Electron density differences of (A) Fe2O3, (B) V2O5 and (C) FeVO4.
Fig. 11. NOx conversion in NH3-SCR reaction as a function of temperature over9 wt.% FeVO4/TiO2 catalysts calcined at different temperatures for 6 h.
350 F. Liu et al. / Journal of Catalysis 307 (2013) 340–351
prsitine FeVO4) to the binding energies at 517.4 and 525.0 eV,which were quite close to the corresponding values of V2O5/TiO2
catalyst. This ‘‘abnormal’’ phenomenon indicates that, the FeVO4/TiO2 catalysts may have a surface enrichment of VOx species at rel-atively high FeVO4 loadings, which can be verified by the semi-quantitative analysis of surface atomic concentrations in Table 3and the calculated V/Fe molar ratios versus FeVO4 loading amountsin Fig. 9D. Although the theoretical molar ratio of Fe:V in FeVO4
should be 1:1, the surface concentration of V5+ species (17.7%)was much higher than that of Fe3+ (11.3%). It was reported thatthe bulk FeVO4 phase was actually surface-enriched with VOx spe-cies, and the catalytic active sites for oxidation reactions (e.g.methanol oxidation) over the bulk FeVO4 mixed oxide resided inthe outermost surface layer but not in the bulk lattice structure[43]. For FeVO4/TiO2 catalysts, with the increasing of FeVO4 loadingamounts from 3 to 15 wt.%, the V/Fe molar ratios showed a mono-tonic increase from 1.00 to 1.56 approaching the value of 1.57 onpristine FeVO4. These results clearly imply that at high FeVO4 load-ings especially exceeding the monolayer dispersion limit, theFeVO4/TiO2 catalyst surface was indeed surface-enriched by VOx
species. Therefore, it is concluded that the surface-enriched VOx
species on the FeVO4/TiO2 catalysts is responsible for the preserva-tion of high NH3-SCR activity plus H2O/SO2 durability, and thepresence of Fe3+ species can effectively weaken the unselective oxi-dation of NH3, thus resulting in high N2 selectivity at hightemperatures.
Fig. 12. Powder XRD patterns of 9 wt.% FeVO4/TiO2 catalysts calcined at differenttemperatures for 6 h.
3.8. Thermal stability test of 9 wt.% FeVO4/TiO2 catalyst
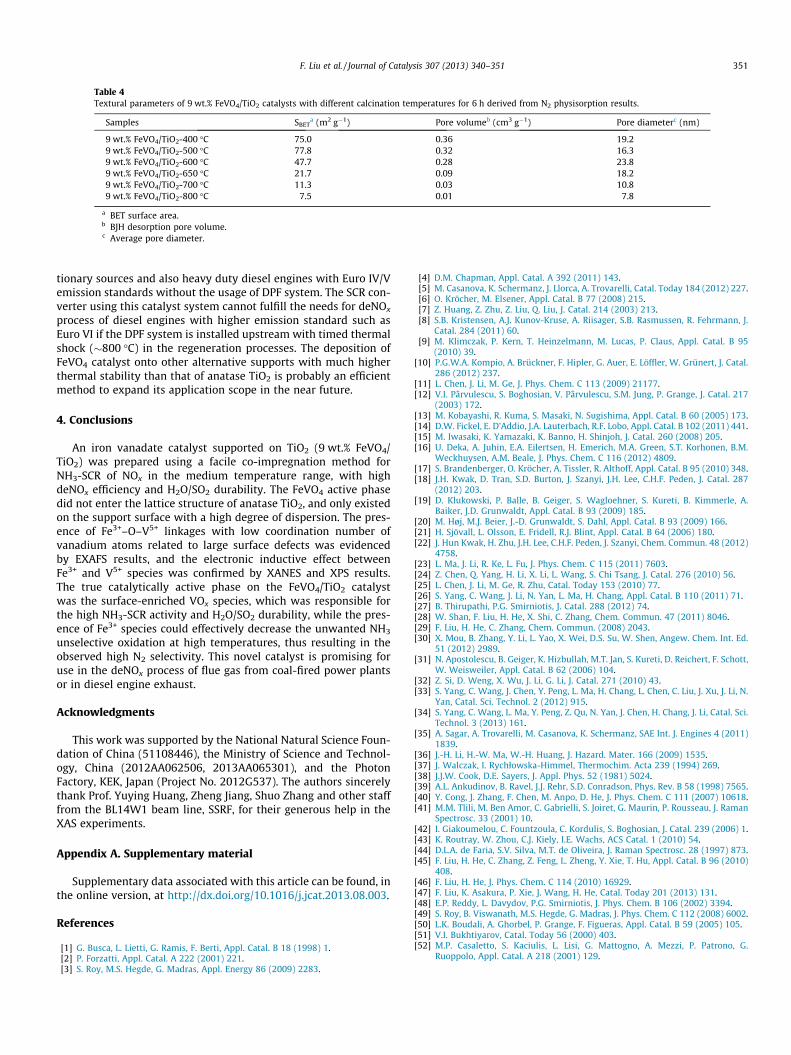
In practical use, the NH3-SCR catalysts should have good ther-mal stability in the long term deNOx process for both stationaryand mobile sources. Therefore, in the preparation process of9 wt.% FeVO4/TiO2 catalyst, we also elevated the calcination tem-perature to 500, 600, 650, 700, and 800 �C to investigate the activ-ity and structure change of this novel catalyst. As we can see inFig. 11, the 9 wt.% FeVO4/TiO2 catalysts calcined at 400, 500 and600 �C for 6 h showed quite similar NH3-SCR activity, althoughthe XRD patterns (Fig. 12) and N2 physisorption results (Table 4)indicated that after calcination at 600 �C the anatase TiO2 supportshowed higher crystallinity degree along with lowered surface areaand pore volume. Further increasing the calcination temperature to650, 700, and 800 �C resulted in an obvious and monotonic de-crease of NH3-SCR activity, which was mainly due to the phasetransformation of anatase TiO2 to rutile TiO2 accompanying bythe severe decrease of surface area and pore volume. It is
noteworthy that, even after the high temperature calcination, nei-ther Fe species nor V species was detected in the XRD patterns,suggesting that the active FeVO4 species could indeed exist onthe TiO2 support in a well dispersed state. In short summary, thisFeVO4/TiO2 catalyst can only be stably used below 600 �C, whichcan completely meet the requirements for deNOx process of sta-
Table 4Textural parameters of 9 wt.% FeVO4/TiO2 catalysts with different calcination temperatures for 6 h derived from N2 physisorption results.
a BET surface area.b BJH desorption pore volume.c Average pore diameter.
F. Liu et al. / Journal of Catalysis 307 (2013) 340–351 351
tionary sources and also heavy duty diesel engines with Euro IV/Vemission standards without the usage of DPF system. The SCR con-verter using this catalyst system cannot fulfill the needs for deNOx
process of diesel engines with higher emission standard such asEuro VI if the DPF system is installed upstream with timed thermalshock (�800 �C) in the regeneration processes. The deposition ofFeVO4 catalyst onto other alternative supports with much higherthermal stability than that of anatase TiO2 is probably an efficientmethod to expand its application scope in the near future.
4. Conclusions
An iron vanadate catalyst supported on TiO2 (9 wt.% FeVO4/TiO2) was prepared using a facile co-impregnation method forNH3-SCR of NOx in the medium temperature range, with highdeNOx efficiency and H2O/SO2 durability. The FeVO4 active phasedid not enter the lattice structure of anatase TiO2, and only existedon the support surface with a high degree of dispersion. The pres-ence of Fe3+–O–V5+ linkages with low coordination number ofvanadium atoms related to large surface defects was evidencedby EXAFS results, and the electronic inductive effect betweenFe3+ and V5+ species was confirmed by XANES and XPS results.The true catalytically active phase on the FeVO4/TiO2 catalystwas the surface-enriched VOx species, which was responsible forthe high NH3-SCR activity and H2O/SO2 durability, while the pres-ence of Fe3+ species could effectively decrease the unwanted NH3
unselective oxidation at high temperatures, thus resulting in theobserved high N2 selectivity. This novel catalyst is promising foruse in the deNOx process of flue gas from coal-fired power plantsor in diesel engine exhaust.
Acknowledgments
This work was supported by the National Natural Science Foun-dation of China (51108446), the Ministry of Science and Technol-ogy, China (2012AA062506, 2013AA065301), and the PhotonFactory, KEK, Japan (Project No. 2012G537). The authors sincerelythank Prof. Yuying Huang, Zheng Jiang, Shuo Zhang and other stafffrom the BL14W1 beam line, SSRF, for their generous help in theXAS experiments.
Appendix A. Supplementary material
Supplementary data associated with this article can be found, inthe online version, at http://dx.doi.org/10.1016/j.jcat.2013.08.003.
References
[1] G. Busca, L. Lietti, G. Ramis, F. Berti, Appl. Catal. B 18 (1998) 1.[2] P. Forzatti, Appl. Catal. A 222 (2001) 221.[3] S. Roy, M.S. Hegde, G. Madras, Appl. Energy 86 (2009) 2283.
[4] D.M. Chapman, Appl. Catal. A 392 (2011) 143.[5] M. Casanova, K. Schermanz, J. Llorca, A. Trovarelli, Catal. Today 184 (2012) 227.[6] O. Kröcher, M. Elsener, Appl. Catal. B 77 (2008) 215.[7] Z. Huang, Z. Zhu, Z. Liu, Q. Liu, J. Catal. 214 (2003) 213.[8] S.B. Kristensen, A.J. Kunov-Kruse, A. Riisager, S.B. Rasmussen, R. Fehrmann, J.
Catal. 284 (2011) 60.[9] M. Klimczak, P. Kern, T. Heinzelmann, M. Lucas, P. Claus, Appl. Catal. B 95
(2010) 39.[10] P.G.W.A. Kompio, A. Brückner, F. Hipler, G. Auer, E. Löffler, W. Grünert, J. Catal.
286 (2012) 237.[11] L. Chen, J. Li, M. Ge, J. Phys. Chem. C 113 (2009) 21177.[12] V.I. Pârvulescu, S. Boghosian, V. Pârvulescu, S.M. Jung, P. Grange, J. Catal. 217
(2003) 172.[13] M. Kobayashi, R. Kuma, S. Masaki, N. Sugishima, Appl. Catal. B 60 (2005) 173.[14] D.W. Fickel, E. D’Addio, J.A. Lauterbach, R.F. Lobo, Appl. Catal. B 102 (2011) 441.[15] M. Iwasaki, K. Yamazaki, K. Banno, H. Shinjoh, J. Catal. 260 (2008) 205.[16] U. Deka, A. Juhin, E.A. Eilertsen, H. Emerich, M.A. Green, S.T. Korhonen, B.M.
Weckhuysen, A.M. Beale, J. Phys. Chem. C 116 (2012) 4809.[17] S. Brandenberger, O. Kröcher, A. Tissler, R. Althoff, Appl. Catal. B 95 (2010) 348.[18] J.H. Kwak, D. Tran, S.D. Burton, J. Szanyi, J.H. Lee, C.H.F. Peden, J. Catal. 287
(2012) 203.[19] D. Klukowski, P. Balle, B. Geiger, S. Wagloehner, S. Kureti, B. Kimmerle, A.
Baiker, J.D. Grunwaldt, Appl. Catal. B 93 (2009) 185.[20] M. Høj, M.J. Beier, J.-D. Grunwaldt, S. Dahl, Appl. Catal. B 93 (2009) 166.[21] H. Sjövall, L. Olsson, E. Fridell, R.J. Blint, Appl. Catal. B 64 (2006) 180.[22] J. Hun Kwak, H. Zhu, J.H. Lee, C.H.F. Peden, J. Szanyi, Chem. Commun. 48 (2012)
4758.[23] L. Ma, J. Li, R. Ke, L. Fu, J. Phys. Chem. C 115 (2011) 7603.[24] Z. Chen, Q. Yang, H. Li, X. Li, L. Wang, S. Chi Tsang, J. Catal. 276 (2010) 56.[25] L. Chen, J. Li, M. Ge, R. Zhu, Catal. Today 153 (2010) 77.[26] S. Yang, C. Wang, J. Li, N. Yan, L. Ma, H. Chang, Appl. Catal. B 110 (2011) 71.[27] B. Thirupathi, P.G. Smirniotis, J. Catal. 288 (2012) 74.[28] W. Shan, F. Liu, H. He, X. Shi, C. Zhang, Chem. Commun. 47 (2011) 8046.[29] F. Liu, H. He, C. Zhang, Chem. Commun. (2008) 2043.[30] X. Mou, B. Zhang, Y. Li, L. Yao, X. Wei, D.S. Su, W. Shen, Angew. Chem. Int. Ed.
51 (2012) 2989.[31] N. Apostolescu, B. Geiger, K. Hizbullah, M.T. Jan, S. Kureti, D. Reichert, F. Schott,
W. Weisweiler, Appl. Catal. B 62 (2006) 104.[32] Z. Si, D. Weng, X. Wu, J. Li, G. Li, J. Catal. 271 (2010) 43.[33] S. Yang, C. Wang, J. Chen, Y. Peng, L. Ma, H. Chang, L. Chen, C. Liu, J. Xu, J. Li, N.
Yan, Catal. Sci. Technol. 2 (2012) 915.[34] S. Yang, C. Wang, L. Ma, Y. Peng, Z. Qu, N. Yan, J. Chen, H. Chang, J. Li, Catal. Sci.
Technol. 3 (2013) 161.[35] A. Sagar, A. Trovarelli, M. Casanova, K. Schermanz, SAE Int. J. Engines 4 (2011)
1839.[36] J.-H. Li, H.-W. Ma, W.-H. Huang, J. Hazard. Mater. 166 (2009) 1535.[37] J. Walczak, I. Rychłowska-Himmel, Thermochim. Acta 239 (1994) 269.[38] J.J.W. Cook, D.E. Sayers, J. Appl. Phys. 52 (1981) 5024.[39] A.L. Ankudinov, B. Ravel, J.J. Rehr, S.D. Conradson, Phys. Rev. B 58 (1998) 7565.[40] Y. Cong, J. Zhang, F. Chen, M. Anpo, D. He, J. Phys. Chem. C 111 (2007) 10618.[41] M.M. Tlili, M. Ben Amor, C. Gabrielli, S. Joiret, G. Maurin, P. Rousseau, J. Raman
Spectrosc. 33 (2001) 10.[42] I. Giakoumelou, C. Fountzoula, C. Kordulis, S. Boghosian, J. Catal. 239 (2006) 1.[43] K. Routray, W. Zhou, C.J. Kiely, I.E. Wachs, ACS Catal. 1 (2010) 54.[44] D.L.A. de Faria, S.V. Silva, M.T. de Oliveira, J. Raman Spectrosc. 28 (1997) 873.[45] F. Liu, H. He, C. Zhang, Z. Feng, L. Zheng, Y. Xie, T. Hu, Appl. Catal. B 96 (2010)
408.[46] F. Liu, H. He, J. Phys. Chem. C 114 (2010) 16929.[47] F. Liu, K. Asakura, P. Xie, J. Wang, H. He, Catal. Today 201 (2013) 131.[48] E.P. Reddy, L. Davydov, P.G. Smirniotis, J. Phys. Chem. B 106 (2002) 3394.[49] S. Roy, B. Viswanath, M.S. Hegde, G. Madras, J. Phys. Chem. C 112 (2008) 6002.[50] L.K. Boudali, A. Ghorbel, P. Grange, F. Figueras, Appl. Catal. B 59 (2005) 105.[51] V.I. Bukhtiyarov, Catal. Today 56 (2000) 403.[52] M.P. Casaletto, S. Kaciulis, L. Lisi, G. Mattogno, A. Mezzi, P. Patrono, G.