Journal of Economic Behavior and Organization 190 (2021) 111–124
Contents lists available at ScienceDirect
Journal of Economic Behavior and Organization
journal homepage: www.elsevier.com/locate/jebo
Gender inequality and caste: Field experimental evidence
from India
✩
Asad Islam
a , ∗, Debayan Pakrashi b , Soubhagya Sahoo
b , Liang Choon Wang
c , Yves Zenou
c
a Centre for Development Economics and Sustainability and Department of Economics, Monash University, Australia b Department of Economic Sciences, Indian Institute of Technology Kanpur, India c Department of Economics, Monash University, Australia
a r t i c l e i n f o
Article history:
Received 22 January 2021
Revised 26 July 2021
Accepted 28 July 2021
Jel codes:
J16
J15
I15
O12
Keywords:
Gender discrimination
Statistical discrimination
Caste discrimination
Intersectionality
Affirmative action
a b s t r a c t
Using a field experiment in India where patients are randomly assigned to rank among a
set of physicians of the same gender but with different castes and years of experience, we
show that the differences in patients’ physician choices are consistent with gender-based
statistical discrimination. Labor market experience cannot easily overcome the discrimina-
tion that female doctors suffer. Further, we find that gender discrimination is greater for
lower caste doctors, who typically suffer from caste discrimination. Given the increasing
share of professionals from a lower caste background, our results suggest that the ‘inter-
sectionality’ between gender and caste leads to increased gender inequality among profes-
A. Islam, D. Pakrashi, S. Sahoo et al. Journal of Economic Behavior and Organization 190 (2021) 111–124
1993, such quotas for government jobs have only been introduced in a few Indian states and for female college students in
science, technology, engineering and math (STEM) fields in recent years. Despite the fact that AA aims at improving the out-
comes of marginalized groups, women among marginalized ethnic and racial groups remain considerably more economically
disadvantaged and suffer greater inequality than men ( Conrad, 2001 ; Siddique, 2011 ; Longhi, 2020 ).
In this paper, we use a field experiment in the state of Uttar Pradesh in India to investigate the relationship between
gender inequality and caste. As gender, religion and caste-based discrimination and stigma are particularly prevalent in
South Asia; India provides an ideal setting to examine the ‘intersectionality’ between gender and caste. 1 We demonstrate
theoretically that when patients statistically discriminate doctors based on gender, differential treatment by caste may fur-
ther widen gender inequality of doctors’ outcomes. Our theoretical framework is based on the statistical discrimination
theory pioneered by Phelps (1972) . Under standard assumptions about gender differences, we first show that statistically
discriminatory patients who have a choice between a female and a male doctor with identical years of experience may
prefer the male doctor to the female doctor if both doctors are relatively experienced. However, the patients would instead
prefer the female doctor to the male doctor if both doctors are relatively inexperienced. These predictions are expected
when experience is less informative about the quality of female doctors than the quality of male doctors. When there is
also caste discrimination against lower caste doctors, the disadvantage that experienced low-caste female doctors suffer in-
creases while the advantage that inexperienced low-caste female doctors enjoy diminishes. Thus, when caste discrimination
and gender discrimination coexist, gender inequality exacerbates among lower caste doctors relative to upper caste doctors.
We use data collected from a field experiment to test: (i) whether patients statistically gender discriminate against doc-
tors; and (ii) whether discrimination-induced gender inequality is indeed greater for low-caste doctors who also suffer from
caste discrimination. The field experiment includes 3128 adult participants with demographic and social-economic charac-
teristics similar to those of the adult population in the state of Uttar Pradesh ( Islam et al., 2018 ). The participants were
invited to register for an upcoming free-of-charge health check offered by a mobile clinic. At the point of registration, the
participants were randomly assigned to express their preferences either among four male doctors or four female doctors.
The four doctors are from either a high or low-caste background and either a high-level or low-level of experience.
As the field experiment uses a correspondence method to elicit preference rankings, characteristics of doctors that cor-
respond to the features of the theoretical model are fully controlled for. As a result, we are able to make inferences without
the threats of confounding unobservables from which typical audit and observational studies of discrimination may suffer.
More importantly, because participants were randomly assigned to choose either among all male doctors or all female doc-
tors, we can attribute the mean differences in rankings of doctors of different genders by experience level and caste group
as evidence of discrimination.
We find that participants in the experiment discriminate doctors in a manner consistent with statistical discrimination
based on gender. Male doctors with a high level of experience are more preferred than female doctors with the same level
of experience on average, but the opposite is true for doctors with a low level of experience. Thus, it is difficult for female
doctors to overcome the relative disadvantage they suffer even as they accumulate more labor market experience. We also
find evidence of caste discrimination against low-caste doctors at all levels of experience. When we focus on high-caste
doctors, female doctors are more preferred than male doctors when they have similarly low level of experience, but both
genders are equally preferred when they have similarly high level of experience. In contrast, when we focus on low-caste
doctors, male doctors and female doctors are equally preferred when they have similarly low level of experience, but male
doctors are more preferred than female doctors when they have similarly high level of experience. Thus, gender discrim-
ination and inequality are worse among low-caste doctors, confirming the theoretical predictions. The findings also imply
that with the rising share of professionals coming from a lower caste background as a result of caste-based reservations,
gender inequality is expected to rise among professionals in India. The evidence of gender and caste discrimination implies
potentially significant negative effects on the general health of the population. Specifically, the undesirable labor market
consequences for women and low-caste individuals may discourage them from pursuing a medical career in the first place
or from staying in the medical profession in the longer term. This decreased supply of medical professionals can lower
competition in the healthcare market, which in turn reduces the quality of healthcare and the health of the population.
This paper contributes to the literature on gender inequality and discrimination in a number of ways. First, it adds to the
growing evidence that gender inequality can be explained by various forms of gender-based statistical discrimination (see
e.g., Castillo et al. 2013 and Bohren et al. 2019 ). Second, it advances the research on intersectionality pioneered by Crenshaw
(1989 , 1991 ) 2 by using the statistical discrimination framework to show how one marginalization dimension may worsen
outcomes of another marginalization dimension of individuals and shed light on the relationship between intersectionality
and gender inequality.
The research on intersectionality and the relationship between gender inequality and caste, especially in the context of
India, is relatively scant. Cassan (2019) shows empirically that AA for Scheduled Castes in education increases their educa-
1 Several studies have documented religion or caste-based gender differentials in India (see, for example, Bhalotra et al. 2010 , Borooah and Iyer 2005 ).
Islam et al. (2021) document that Muslims in India are perceived by Hindu as responsible for the spread of COVID-19. Delavande and Zafar (2013) find
evidence of discriminatory behavior against females among religious institution students in Pakistan. Begum et al. (2018) document evidence consistent
with gender bias in the labor market in Bangladesh while Abbink et al. (2020) document gender bias exists within households in Bangladesh. 2 The term “intersectionality” was coined in 1989 by Kimberlé Crenshaw to describe how race, class, gender, and other marginalized aspects of individual
characteristics “intersect” with one another and overlap.
112
A. Islam, D. Pakrashi, S. Sahoo et al. Journal of Economic Behavior and Organization 190 (2021) 111–124
tional attainment, especially in literacy and secondary schooling, but the benefits flow mainly to men, but not to low-caste
women. Karekurve-Ramachandra and Lee (2020) shows that gender quotas worsen the representation of low-caste politi-
cians in India. We help advance this area of research by using the statistical discrimination framework to offer insights into
how gender inequality may widen among low-caste individuals when they also suffer from caste discrimination. As prior
economics research on the unintended consequences of AA typically utilizes the statistical discrimination framework, our
findings suggest the usefulness of statistical discrimination theories in understanding the interconnection between inter-
sectionality, AA, and underrepresentation. 3 Importantly, because the representation of lower-caste professionals, especially
among the younger generation, has increased significantly in various sectors over time due to the use of caste-based AA,
the findings imply that gender inequality is expected to increase among professionals in India. The findings highlight the
importance of having appropriate policies focusing on the intersection of different discriminated groups and addressing the
cumulative effects of discrimination on them.
2. Institutional background
2.1. Gender inequality and gender-based affirmative action (AA) in India
India ranked 122 out of 162 countries on the 2018 gender inequality index ( UNDP, 2019 ). India is characterized by low
female labor force participation rates and high gender wage gaps. Women’s labor force participation rate in India is only
around a quarter in rural areas and below 20% in urban areas, whereas the world average is around half ( Lahoti and Swami-
nathan, 2016 ). Female workers only earned roughly 65% of what male workers earned on average in the year 2018 and 2019
in India ( Chakraborty, 2020 ).
The Indian government has taken a number of steps to address gender inequality, especially in the political represen-
tation of women. For example, a constitutional amendment enacted in 1993 requires the reservation of one third of all
levels of local government electoral seats in India for women. Numerous studies have looked at how these female politi-
cal reservations affect the outcomes of women politicians and electorates in India (see, e.g., Chattopadhyay and Duflo 2004 ,
Beaman et al., 2012 , Clots-Figueras 2012 , Gangadharan et al. 2016 , Afridi et al. 2017 , Maitra and Rosenblum 2021 ). In general,
these studies show that the gender quotas help improve the outcomes of women.
There has not been any constitutional mandate or laws for the reservation of seats for women in public-sector jobs or
education institutions in India. Nonetheless, a small number of states, such as Bihar, Gujarat, Madhya Pradesh, and Punjab,
have in the past 10 years introduced reservations for women in government jobs ( Kumar, 2020 ). In light of the low level of
female participation in STEM fields, the government also introduced a quota for women in the Indian Institute of Technology
(IITs) in 2018 ( Sharma, 2020 ). In the first year of implementation, 2018, 19, 14% of seats were added for women. The number
went up to 17% in 2019, 20 and 20% in 2020, 21.
2.2. The caste system and caste-based AA policy
The caste system played an important role in ancient Hindu tradition and caste dictated almost every aspect of Hindu
religious and social life in India for centuries. It divides Hindus into four main hierarchies – Brahmins, Kshatriyas, Vaishyas,
and Shudras. At the top of the hierarchy are Brahmins, who were priests and intellectuals. The second category is the
Kshatriyas, who were rulers and aristocrats of the society. The third category is Vaishyas, who were traders, landlords,
farmers, and merchants. The Shudras, who were peasants and working class of the society, lied at the bottom. Below these
four groups are the Dalits or the untouchables, who worked in degrading jobs. The first three castes were classified as the
upper caste. The upper caste had social and economic rights that the lower caste Shudras and Dalits did not have. These
days the lower caste groups are listed in three categories: (1) Scheduled Castes (SCs) who were untouchables; (2) Scheduled
Tribes (STs); and (3) Other Backward Classes (OBCs), which include Shudras.
Although the influence of caste has declined in recent decades, caste identities remain strong, and surnames are
almost always indications to which caste a person belongs. There is also evidence suggesting that the lower caste
groups continue to face discrimination and stigmatization ( Madheswaran and Attewell, 2007 ; Thorat and Attewell, 2007 ;
Siddique, 2011 ; Banerjee et al., 2009 ; Banerjee et al., 2013 ; Islam et al., 2018 ; Islam et al., 2021 ). Findings from studies
such as Siddique (2011) , Wankhede (2016) , and Chaudhury and Sinha (2020) , indicate that the extent of gender inequality
is worse for low-caste groups than for high-caste groups.
Caste-based reservation policy in India was launched in 1950 to promote equal opportunities for SCs and STs in areas
of public-sector employment, education, and politics ( Deshpande, 2013 ). After the Mandal Commission’s recommendations,
public-sector employment quotas were further extended to OBCs in the early 1990s. In 2006, educational quotas for OBCs
were established through the 93rd constitutional amendment. Government-funded universities and colleges allot seats ac-
cording to caste-based quotas, which give 7.5% to STs, 15% to SCs, and 27% to OBCs ( Deshpande, 2013 ). In order to meet
these quotas, the qualifying scores for admission are typically set differently across caste groups. For example, Bertrand
3 The literature studying the unintended consequences of AA under statistical discrimination dated back to the seminal work of Coate and Loury (1993) .
See Arcidiacono and Lovenheim (2016) for general overviews of the pros and cons of AA policies. Balafoutas et al. (2016) and Leibbrandt et al. (2018) doc-
ument some unintended consequences of gender quotas.
113
A. Islam, D. Pakrashi, S. Sahoo et al. Journal of Economic Behavior and Organization 190 (2021) 111–124
Fig. 1. Share of tertiary students enrolled in medical sciences by caste and year.
Notes: Authors’ calculation based on data drawn from the All India Survey of Higher Education (AISHE). The data include tertiary students enrolled in all
medical science programs (e.g., MBBS, pharmacy and pharmacology, nursing, etc.).
et al. (2010) document that among all students applying to an engineering college, the qualifying scores for admission were
roughly 480 out of a possible 900 for upper caste applicants, 419 for OBC applicants, and 182 for SC applicants. This gra-
dation of entrance scores by caste is also documented in Bagde et al. (2011) for a sample of 214 engineering colleges. The
reservation policy has resulted in an increasing share of tertiary students enrolled in various medical science programs to
come from a lower caste background, especially so for OBC (see Fig. 1 ).
3. Theory and predictions
3.1. Gender-based statistical discrimination
Statistical discrimination theory pioneered by Phelps (1972) and Arrow (1973) posits that in the absence of direct infor-
mation about quality or productivity, individuals would use beliefs about group identities and other signals of quality or
productivity to make inferences about the unobserved quality or productivity. Following Aigner and Cain (1977) , we present
a simple model of statistical discrimination to highlight how patients may discriminate doctors on the basis of gender and
to draw predictions that we test in the field experiment.
The experience, x , of a doctor of gender type, s , provides gender-based statistical discriminatory patients a signal of the
doctor’s quality, q , with an error (noise), ∈ :
x s = q s + ∈ s , (1)
where ∈ s ∼ N( 0 , σ 2 ∈ ,s ) , q s ∼ N( βs , σ 2 q,s ) , and cov ( q s , ∈ s ) = 0 . It follows that E( x s ) = βs and v ar( x s ) = σ 2
q,s + σ 2 ∈ ,s . Each patient’s decision problem is first to forecast the expected value of the doctor quality, q , from the noisy signal, x ,
on the basis of the doctor’s gender, s . After forming the expected quality of each doctor, E( qx, s ) ≡ ˆ q x,s , the patient can then
rank the available doctors accordingly. Following Phelps (1972) and Ewens et al. (2014) , a patient uses the sample of doctors
they have encountered to estimate γs and βs for each gender type s = { f, m } via the Ordinary Least Squares estimator and
obtain the following plug-in equation:
ˆ q x,s = ( 1 − γs ) βs + γs x s , (2)
where γs =
cov ( q s , x s ) v ar( x s )
. Note that Phelps (1972) assumes that each patient has previously encountered a large independently
and identically distributed sample of individuals (doctors) in each group, while Ewens et al. (2014) allows the sample of
individuals to be correlated and small (i.e., non-representative or biased sampling). Recently, using data on responses of
experimental subjects observed over time, Bohren et al. (2019) demonstrate that these estimates (beliefs) can be biased.
Since the field experimental data that we have are cross-sectional and we do not observe the history of each patient’s
encounters with different doctors, we are agnostic as to whether the individuals update their beliefs and the beliefs are
114
A. Islam, D. Pakrashi, S. Sahoo et al. Journal of Economic Behavior and Organization 190 (2021) 111–124
biased or not. Note that we can potentially include an intercept term in Eq. (1) to allow for bias, but it has no bearing on
γs , which is the focus here.
To predict the quality of a newly encountered doctor, the patient plugs in x s using Eq. (2) to obtain ˆ q x,s . The numerator
cov ( q s , x s ) of γs is σ 2 q,s given Eq. (1) , and it is positive as Eq. (1) specifies that experience provides positive signal of quality. In
reality, cov ( q s , x s ) can be negative as it depends on the sample of doctors the patient previously encountered ( Ewens et al.,
2014 ; Islam et al., 2018 ). As we are interested in predictions on average, we hypothesize that cov ( q s , x s ) > 0 for the average
patient. The denominator v ar( x s ) of γs is the sum of σ 2 q,s and σ 2 ∈ ,s .
To explain the discrimination from which highly skilled female workers suffer in the labor market, the labor economics
literature typically assumes that σ 2 ∈ , f
> σ 2 ∈ ,m
, while maintaining that βm
= β f = β and σ 2 q, f
= σ 2 q,m
(e.g., see Aigner and Cain
1977 ). The assumption that σ 2 ∈ , f
> σ 2 ∈ ,m
corresponds to the notion that signal is a less reliable indicator of quality for female
workers than for male workers. It is typically argued in the labor market context that employers find it more difficulty in
assessing the quality of female workers based on their observable characteristics Lesner, 2018 ). Ewens et al. (2014) shows
that the observed sample of individuals can give the estimates that σ 2 ∈ , f
> σ 2 ∈ ,m
when signals of individuals in the sample
are positively correlated and the sample size is smaller for f than m . We follow these studies and assume that σ 2 ∈ , f
> σ 2 ∈ ,m
,
which means that experience is less informative about the quality of female doctors than the quality of male doctors. Given
these assumptions and Eqs. (1) and ( (2) , we have:
0 < γ f < γm
< 1 (3)
Proposition 1. Given the assumptions made for Eqs. (1) and (2) and inequality (3) , there exists a value of experience x ∗ = βfor which ˆ q x ∗,m
= ˆ q x ∗, f . For x > x ∗, ˆ q x,m
> ˆ q x, f and for x < x ∗, ˆ q x,m
< ˆ q x, f .
Proof. Solving ( 1 − γm
) β + γm
x ∗ = ( 1 − γ f ) β + γ f x ∗ yields x ∗ = β . Given that x ∗ = β , when ˆ q x,m
> ˆ q x, f , we have
( 1 − γm
) x ∗ + γm
x > ( 1 − γ f ) x ∗ + γ f x . The solution yields x > x ∗. Similarly, when ˆ q x,m
< ˆ q x, f , the solution yields x < x ∗.
Proposition 1 implies that male doctors are more preferred than female doctors at a high level of experience, whereas
female doctors are more preferred than male doctors at a low level of experience. Note that this situation is unique to
statistical discrimination. Islam et al. (2018) shows that this situation cannot arise under taste-based discrimination when
preferences satisfy several fundamental axioms. Following Becker’s (1957) notion of distaste, the online appendix uses an
example to illustrate why taste-based discrimination cannot generate this prediction.
It is possible that βm
� = β f in reality. Note that even if βm
> β f instead of βm
= β f = β as we have assumed, there still
exists a value of experience x ∗ at which ˆ q x ∗,m
= ˆ q x ∗, f , but the value that x ∗ takes will become ( 1 −γm ) βm −( 1 −γ f ) β f
γ f −γm . Similarly, it
is possible that σ 2 q, f
> σ 2 q,m
in reality. As long as the extent to which σ 2 ∈ , f
> σ 2 ∈ ,m
is relatively greater than the extent to which
σ 2 q, f
> σ 2 q,m
, inequality (3) will hold. Without data on actual quality, the assumptions that βm
= β f = β and σ 2 q, f
= σ 2 q,m
suffice. More importantly, if the empirical evidence is consistent with inequality (3) , then these assumptions are reasonable.
3.2. Preliminary assessment of the theoretical assumptions
We first use publicly available data from India to provide some preliminary assessment of the key feature of the gender-
based statistical discrimination model: greater return to experience is for male doctors than female doctors.
The most recent publicly available data that may allow for such a preliminary investigation is the 2004 Employment
Survey as it contains information about the weekly earnings of medical professionals in addition to other important demo-
graphic characteristics. Using earnings as a proxy for quality of healthcare of a doctor, we find that the return to experience
is indeed greater for male medical professionals than female medical professionals in India. In particular, Table 1 shows that
the return to experience is significantly positive for male medical professionals (columns (1) and (2)), but not statistically
different from zero for female medical professionals (columns (3) and (4)). Given the greater return to experience for male
than female, the intercept term is lower for male than female (column 5). As we also assume that the mean quality of
healthcare is identical by gender in the model, we also check whether the earnings data are consistent. Indeed, we cannot
reject the null hypothesis that mean earnings is similar between male and female medical professionals in the range of
experience that we focus on ( p = 0.928). Thus, the observational data are consistent with the key assumptions of the sta-
tistical discrimination model. Since observational data are generally susceptible to various confounds due to unobservables,
our focus in this paper is to examine the predictions of the model using field experimental data.
3.3. Caste discrimination and gender inequality
When there is caste discrimination, it is possible for patients to expect the mean quality of low-caste ( L ) doctors to be
lower than the mean quality of high-caste ( H ) doctors on average, so that: βL < βH ( Islam et al., 2018 ).
Proposition 2. With caste discrimination against low-caste doctors, the experience level above which the predicted quality
is greater for male doctors than for female doctors would occur is at a lower point for low-caste doctors than high-caste
doctors: x ∗ < x ∗ .
L H
115
A. Islam, D. Pakrashi, S. Sahoo et al. Journal of Economic Behavior and Organization 190 (2021) 111–124
Table 1
Gender differences in the weekly earnings of medical professionals.
(1) (2) (3) (4) (5)
Male Male Female Female All
Experience 84.11 ∗ 86.19 ∗∗∗ 73.91 11.19 8.96
(43.60) (25.88) (74.76) (30.59) (32.55)
Male × Experience 76.12 ∗
(44.51)
Male -601.70 ∗∗
(274.32)
Controls No Yes No Yes Yes
Observations 325 325 84 84 409
Notes: Sampling weights are used. The occupations included in the sample are
physicians and surgeons, dental surgeons, veterinarians, pharmacists, dieticians and
nutritionists, and public health physicians. The sample is restricted to those aged
25 to 39. Experience is age minus 23. Additional control variables include wage
employee dummy, urban status, and a set of occupation fixed effects.
Source: The 2004 Employment Survey (Socio-Economic Survey, Household Sched-
ule 10: Employment and Unemployment) was collected by the National Sample
Survey Organization (NSSO). We obtained the data from Minnesota Population Cen-
ter’s (2020) Integrated Public Use Microdata Series.
Fig. 2. The relationship between predicted quality and experience of doctor.
Proof. At x ∗c , the condition ( 1 − γm,c ) βc + γm,c x ∗c = ( 1 − γ f,c ) βc + γ f,c x
∗c holds for each of caste group c = { L, H } . The solution
yields x ∗c = βc . Because βL < βH , we have x ∗L < x ∗H .
Corollary 1. Given the range of experience where 0 ≤ x ∗L
< x ∗H
, the mean male-female predicted quality difference is larger
for low-caste doctors than for high-caste doctors. That is, Ga p L > Ga p H , where
Ga p L ≡∞
∫ ˆ q L
0 ,m
ˆ q L x,m
f (
ˆ q L x,m
)d ̂ q L x,m
−∞
∫ ˆ q L
0 , f
ˆ q L x, f f (
ˆ q L x, f
)d ̂ q L x, f , and
Ga p H ≡∞
∫ ˆ q H
0 ,m
ˆ q H x,m
f (
ˆ q H x,m
)d ̂ q H x,m
−∞
∫ ˆ q H
0 , f
ˆ q H x, f f (
ˆ q H x, f
)d ̂ q H x, f
Note that ˆ q c 0 ,s
is the predicted quality for doctor of caste c and gender s at x = 0 and f (·) denotes the probability density
function of ˆ q c 0 ,s
.
Fig. 2 illustrates the relationship between the predicted quality ( y -axis) and experience level ( x -axis) of doctor by the
gender of doctor. Fig. 2 A shows that the predicted quality increases with experience at a higher rate for male doctors
(dashed line) than female doctors (solid line). This feature is driven by the standard assumption that the reliability of signal
(i.e., how informative experience is about a doctor’s quality) is lower among female doctors than among male doctors.
When x < x ∗, the predicted quality is greater for female doctors than for male doctors. When x > x ∗, the predicted quality
is greater for male doctors than female doctors. Basically, the noisy (unreliable) signal benefits female doctors more when
they are less experienced because patients infer their quality more from the mean quality of all female doctors than their
noisy signal. At x = x ∗, the predicted quality is identical for both male and female doctors. Fig. 2 B shows that with caste
discrimination, for x > 0 , the range of experience levels at which the predicted quality is greater for low-caste male doctors
than low-caste female doctors become larger relative to Fig. 2 A. Fig. 2 C shows that with caste discrimination, for x > 0 ,
the range of experience levels at which the predicted quality is greater for high-caste male doctors than low-caste female
116
A. Islam, D. Pakrashi, S. Sahoo et al. Journal of Economic Behavior and Organization 190 (2021) 111–124
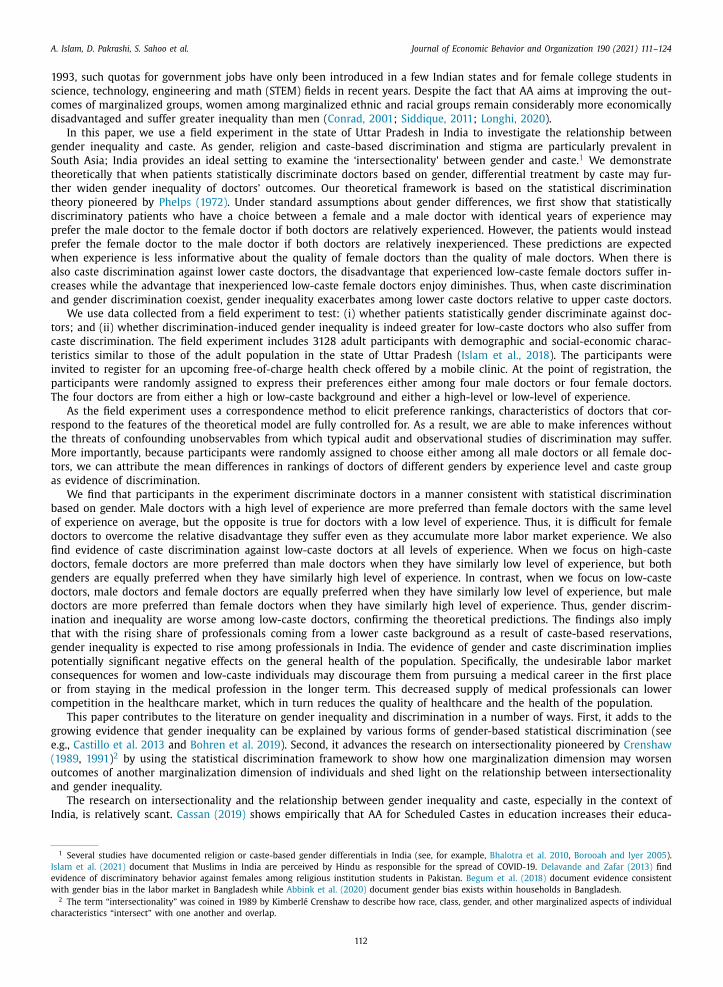
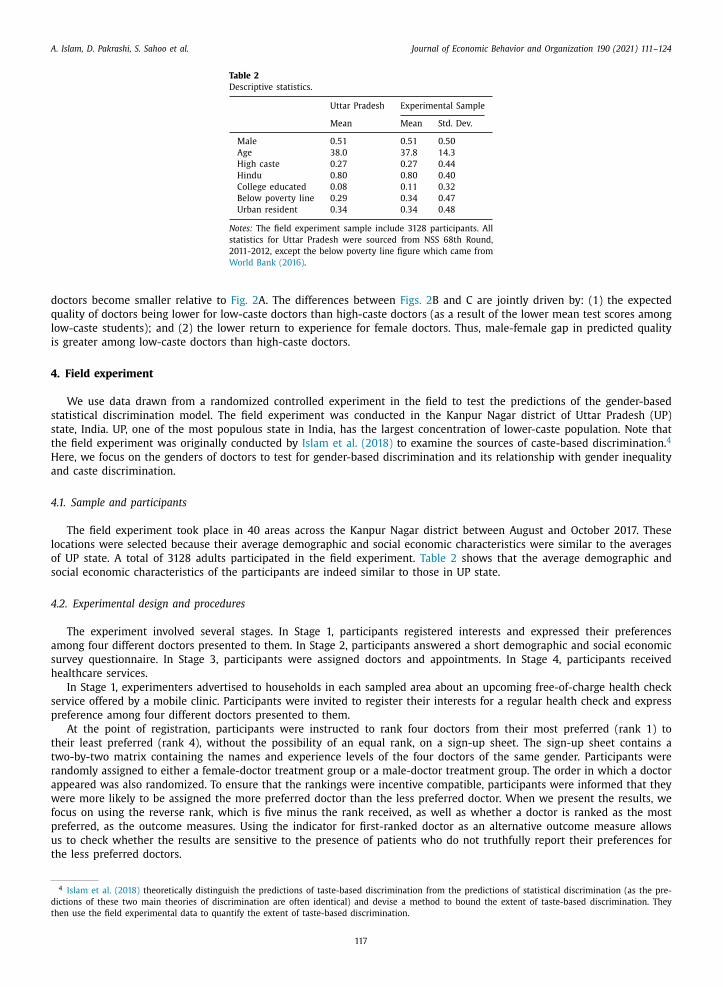
Table 2
Descriptive statistics.
Uttar Pradesh Experimental Sample
Mean Mean Std. Dev.
Male 0.51 0.51 0.50
Age 38.0 37.8 14.3
High caste 0.27 0.27 0.44
Hindu 0.80 0.80 0.40
College educated 0.08 0.11 0.32
Below poverty line 0.29 0.34 0.47
Urban resident 0.34 0.34 0.48
Notes: The field experiment sample include 3128 participants. All
statistics for Uttar Pradesh were sourced from NSS 68th Round,
2011-2012, except the below poverty line figure which came from
World Bank (2016) .
doctors become smaller relative to Fig. 2 A. The differences between Figs. 2 B and C are jointly driven by: (1) the expected
quality of doctors being lower for low-caste doctors than high-caste doctors (as a result of the lower mean test scores among
low-caste students); and (2) the lower return to experience for female doctors. Thus, male-female gap in predicted quality
is greater among low-caste doctors than high-caste doctors.
4. Field experiment
We use data drawn from a randomized controlled experiment in the field to test the predictions of the gender-based
statistical discrimination model. The field experiment was conducted in the Kanpur Nagar district of Uttar Pradesh (UP)
state, India. UP, one of the most populous state in India, has the largest concentration of lower-caste population. Note that
the field experiment was originally conducted by Islam et al. (2018) to examine the sources of caste-based discrimination. 4
Here, we focus on the genders of doctors to test for gender-based discrimination and its relationship with gender inequality
and caste discrimination.
4.1. Sample and participants
The field experiment took place in 40 areas across the Kanpur Nagar district between August and October 2017. These
locations were selected because their average demographic and social economic characteristics were similar to the averages
of UP state. A total of 3128 adults participated in the field experiment. Table 2 shows that the average demographic and
social economic characteristics of the participants are indeed similar to those in UP state.
4.2. Experimental design and procedures
The experiment involved several stages. In Stage 1, participants registered interests and expressed their preferences
among four different doctors presented to them. In Stage 2, participants answered a short demographic and social economic
survey questionnaire. In Stage 3, participants were assigned doctors and appointments. In Stage 4, participants received
healthcare services.
In Stage 1, experimenters advertised to households in each sampled area about an upcoming free-of-charge health check
service offered by a mobile clinic. Participants were invited to register their interests for a regular health check and express
preference among four different doctors presented to them.
At the point of registration, participants were instructed to rank four doctors from their most preferred (rank 1) to
their least preferred (rank 4), without the possibility of an equal rank, on a sign-up sheet. The sign-up sheet contains a
two-by-two matrix containing the names and experience levels of the four doctors of the same gender. Participants were
randomly assigned to either a female-doctor treatment group or a male-doctor treatment group. The order in which a doctor
appeared was also randomized. To ensure that the rankings were incentive compatible, participants were informed that they
were more likely to be assigned the more preferred doctor than the less preferred doctor. When we present the results, we
focus on using the reverse rank, which is five minus the rank received, as well as whether a doctor is ranked as the most
preferred, as the outcome measures. Using the indicator for first-ranked doctor as an alternative outcome measure allows
us to check whether the results are sensitive to the presence of patients who do not truthfully report their preferences for
the less preferred doctors.
4 Islam et al. (2018) theoretically distinguish the predictions of taste-based discrimination from the predictions of statistical discrimination (as the pre-
dictions of these two main theories of discrimination are often identical) and devise a method to bound the extent of taste-based discrimination. They
then use the field experimental data to quantify the extent of taste-based discrimination.
117
A. Islam, D. Pakrashi, S. Sahoo et al. Journal of Economic Behavior and Organization 190 (2021) 111–124
Table 3
Balance tests.
Doctor Treatment Group Group
Female Male Difference
Male 0.513 0.502 -0.012
(0.013) (0.013) (0.018)
Age 37.850 37.770 -0.080
(0.365) (0.356) (0.510)
General caste 0.266 0.268 0.002
(0.011) (0.011) (0.016)
Married 0.834 0.828 -0.006
(0.009) (0.010) (0.013)
Hindu 0.814 0.784 -0.030 ∗∗
(0.010) (0.010) (0.014)
College educated 0.117 0.112 -0.006
(0.008) (0.008) (0.011)
Employed 0.442 0.438 -0.004
(0.013) (0.013) (0.018)
Below poverty line 0.343 0.339 -0.004
(0.012) (0.012) (0.017)
Urban 0.347 0.343 -0.003
(0.012) (0.012) (0.017)
Experience is 4 vs 12 years 0.498 0.507 0.009
(0.013) (0.013) (0.018)
Notes: The sample size is 3128 participants; 1561 are in the female-doctor
treatment group while 1567 are in the male-doctor treatment group. Ro-
bust standard errors are reported in parentheses. ∗∗∗ p < 0.01; ∗∗ p < 0.05; ∗ p < 0.1.
There are several reasons why participants were not allowed to rank doctors equally. First, it is impossible to elicit
true indifference because choosing one doctor over another is fully consistent with indifference between the two doctors. In
other words, a person may randomly choose one of the two doctors when the person is indifferent between the two doctors.
Second, by forcing participants to give strict ranking, participants with weak preferences could not give equal ranking out
of social desirability concerns. Third, as long as we are able to detect treatment differences, any measurement errors due to
indifferences are differenced out on average.
The four doctors are: (1) a doctor with a high-caste surname and a high level of experience; (2) a doctor with a low-
caste surname and a high level of experience; (3) a doctor with a high-caste surname and a low level of experience; and (4)
a doctor with a low-caste surname and a low level of experience. The high-caste surname belongs to the general-category
(GC) caste. The low-caste surname belongs to either a schedule-caste (SC), schedule-tribe (ST), or other-backward-class (OBC)
group, but never both. The high level of experience is either 12 years or eight years of experience but never both, whereas
the low level of experience is always four years. The first name of the doctor was not disclosed, but only the initial. 5
Once participants’ rankings of the four doctors were elicited, they filled out a short demographic and social economic
survey questionnaire in Stage 2. The survey collected information about their age, gender, caste identity, education level,
religious affiliation, and so on. The field experiment concluded by the end of Stage 2.
In Stage 3, participants were informed about the doctor they were assigned to and the location and time of their upcom-
ing health-check appointment. In Stage 4, the mobile clinic arrived in the area to deliver service. The mobile clinic delivered
the service within one week of registration.
4.3. Verification of randomization
Patients were randomly assigned to either the female-doctor treatment group or male-doctor treatment group. Table 3
reports the balance tests by treatment group. Apart from Hindu religion, the characteristics of patients who see male doctors
are statistically similar to the characteristics of patients who see female doctors. The statistically significant difference in
religious affiliation between the two groups are expected to occur by chance given that the treatment was randomized at
the point when the large sample of participants were contacted. More importantly, our results are robust to controlling for
the difference in religious affiliation.
5 The high-caste surnames used are Bajpai, Dixit, Mishra, and Pandey. The low-caste surnames used are Katiyar, Pal, Rajput, Yadav, Kanaujiya, Kureel,
Sonkar, and Valmiki.
118
A. Islam, D. Pakrashi, S. Sahoo et al. Journal of Economic Behavior and Organization 190 (2021) 111–124
Fig. 3. Statistical discrimination of doctors based on gender.
Notes: Reverse rank is five minus the rank of a doctor receives from a participant. A doctor who receives a higher reverse rank is more preferred. Error
bars represent mean ±SEM.
5. Results
In this section, we report the field experimental results. First, we report evidence that the overall mean ranking of doc-
tors is consistent with the model that patients statistically discriminate against doctors of different genders. Second, we
report evidence that gender inequality in doctors’ outcomes is greater among low-caste doctors, who also suffer from caste
discrimination.
5.1. Gender-based statistical discrimination
According to inequality (3) in Section 3.1 , we expect the return to experience for female doctors, γ f , to be lower than
that for male doctors, γm
, if patients statistically discriminate doctors by gender. Fig. 3 confirms that inequality (3) holds
in the field experiment by plotting the mean reverse rank of a doctor against the doctor’s experience by gender of the
doctor. Note that the reverse rank is five minus the rank the doctor receives from a patient. For doctors with a low level of
experience, female doctors are on average more preferred than male doctors. For doctors with a high level of experience,
male doctors are on average more preferred than female doctors. Fig. 3 also indicates that x ∗, where the expected quality
of male doctors equals the expected quality of female doctors in Proposition 1 , occurs between the low level of experience
and the high level of experience that patients were presented.
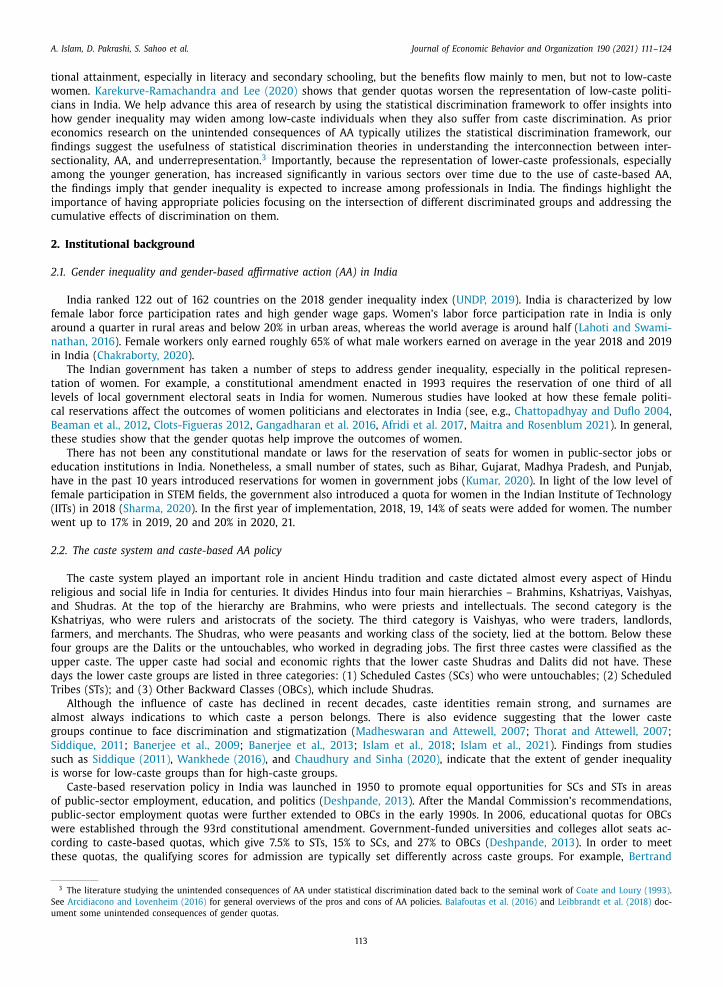
The regression estimates reported in Table 4 confirm the patterns shown in Fig. 3 . Table 4 reports the estimates based
on regression specifications when we use the reverse rank of a doctor as the dependent variable (columns (1) to (3)). The
specification in column (1) does not include additional patient’s or doctor’s control variables, whereas the specifications in
columns (2) and (3) include additional patient’s and doctor’s controls. Column (1) shows that female doctors with a low level
of experience receive a reverse rank of 1.8 on average. In comparison, male doctors with a low level of experience receive
a reverse rank of 1.3 on average, and the average difference of -0.5 in reverse rank is statistically significant ( p < 0.01).
For female doctors with a higher level of experience, their reverse rank increases significantly by approximately 1.3 on
average. For male doctors with a high level of experience, their reverse rank increases significantly by approximately 1.4 on
average. As experienced doctors are more preferred by the participants, the results indicate that doctor’s experience signals
better quality, which is consistent with Eqs. (1) and (2) in Section 3.1 . Once we include additional controls, the return to
experience becomes larger for female doctors, while the difference in the return to experience between female and male
doctors fall slightly. The statistically and significantly greater return to experience for male doctors than female doctors,
as measured by the difference in reverse rank that is between 0.08 and 0.1, confirms inequality (3) of the gender-based
statistical discrimination model.
Table 4 also reports the estimates based on linear probability models where the dependent variable is the dummy for
whether a doctor is ranked the most preferred (columns (4) to (6)). The results are similar to those using reverse rank as the
dependent variable. Only about 7% of low-experience female doctors are the most preferred (column (1)). Low-experience
male doctors are 2 percentage-point less likely to be ranked first than low-experience female doctors. Doctors with more
119
A. Islam, D. Pakrashi, S. Sahoo et al. Journal of Economic Behavior and Organization 190 (2021) 111–124
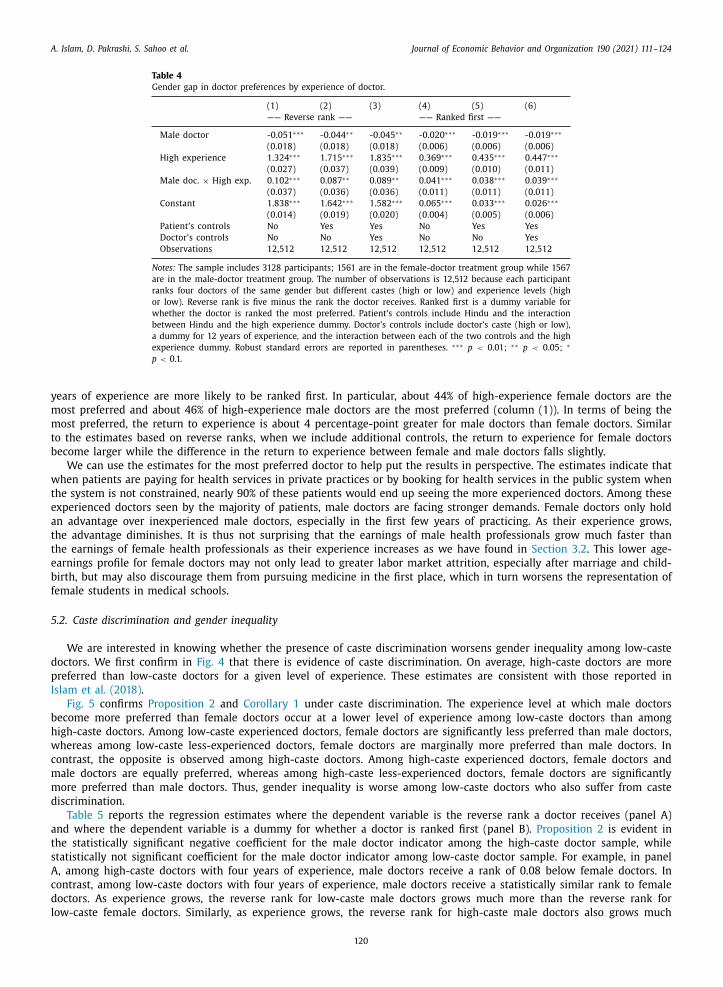
Table 4
Gender gap in doctor preferences by experience of doctor.
(1) (2) (3) (4) (5) (6)
—— Reverse rank —— —— Ranked first ——
Male doctor -0.051 ∗∗∗ -0.044 ∗∗ -0.045 ∗∗ -0.020 ∗∗∗ -0.019 ∗∗∗ -0.019 ∗∗∗
low-experience doctor. None of the 90% confidence intervals of a type of doctor contains the mean reverse rank of another type of doctor.
Fig. 5. Statistical discrimination of doctors on the basis of gender by caste of doctor.
Notes: Reverse rank is five minus the rank of a doctor receives from a participant. A doctor who receives a higher reverse rank is more preferred. Error
bars represent mean ±SEM.
more than the reverse rank for high-caste female doctors. The main difference between low-caste male doctors and high-
caste male doctors is that the return to experience is much stronger for the former. Over the range of experience levels
in the experiment, there exists a range in which high-caste male doctors are statistically less preferred than high-caste
female doctors. In comparison, no such range of experience is present for low-caste female doctors. The results imply that
as doctors accumulate more experience, gender inequality becomes more severe among low-caste doctors. The results are
similar when we examine whether a doctor is ranked the most preferred (panel B), but the estimates are generally noisier.
Thus, Corollary 1 that gender inequality is worse among lower caste doctors is evident here.
In summary, the field experimental evidence is consistent with the theoretical prediction that gender inequality exacer-
bates among low-caste doctors when there is also caste discrimination against low-caste doctors. When patients statistically
121
A. Islam, D. Pakrashi, S. Sahoo et al. Journal of Economic Behavior and Organization 190 (2021) 111–124
Table 5
Gender gap in doctor preferences by experience and caste of doctor.
(1) (2) (3) (4) (5) (6)
—- Low-caste doctor —- —- High-caste doctor —-
A Reverse rank
Male doctor -0.020 -0.015 -0.018 -0.081 ∗∗ -0.072 ∗∗ -0.072 ∗∗
Notes: The sample includes 3128 participants; 1561 are in the female-doctor treatment group while 1567 are in the male-doctor treatment group. The
number of observations is 6256 because each participant ranks two doctors of the same gender but different experience levels (high or low) from the
same caste group. Reverse rank is five minus the rank the doctor receives. Ranked first is a dummy variable for whether the doctor is ranked the most
preferred. Patient’s controls include Hindu and the interaction between Hindu and the high experience dummy. Doctor’s controls include a dummy for 12
years of experience and its interaction with the high experience dummy. Robust standard errors are reported in parentheses. ∗∗∗ p < 0.01; ∗∗ p < 0.05; ∗
p < 0.1.
Fig. 6. Share of young high-caste health professionals over time.
Note: Individuals aged 21 to 25 who listed occupation as a health professional and had graduated from university.
Source: Authors’ calculation based on data drawn from the 1999, 2004, and 2009 Employment Surveys (Socio-Economic Survey, Household Schedule 10:
Employment and Unemployment) collected by the National Sample Survey Organization (NSSO). We obtained the data from Minnesota Population Center’s
(2020) Integrated Public Use Microdata Series.
122
A. Islam, D. Pakrashi, S. Sahoo et al. Journal of Economic Behavior and Organization 190 (2021) 111–124
discriminate doctors based on gender, caste discrimination further worsens gender inequality among low-caste doctors. The
estimates regarding gender differences by the experience and caste of doctor indicate that within each caste, the demand for
male doctors grows relatively more than that for female doctors as they become more experienced. Since there is caste dis-
crimination against low-caste doctors, the results mean that any relative disadvantage that low-caste female doctors suffer
does not diminish with greater labor market experience, at least in the range of experience investigated in the experiment.
5.3. The implication for overall gender inequality
The evidence so far indicates that patients statistically discriminate doctors based on gender and that the presence of
caste discrimination worsens gender inequality among low-caste doctors relative to gender inequality among high-caste
doctors. In the field experiment patients are presented with the same number of low-caste and high-caste doctors with
different years of experience as well as similar fractions of male and female doctors. However, the actual shares of doctors
of different genders and caste groups in India are different. If doctors are predominantly and increasingly from a lower caste
background, our results imply an overall increase in gender inequality as a result of this intersectionality in India.
We use several years of national employment survey from India to extrapolate how the increasing representation of
low-caste individuals in medical professions may influence overall gender inequality among doctors. Fig. 6 shows that it
is increasingly less likely for health professionals who recently graduated from university to come from a high-caste back-
ground. The share was approximately 88% in 1999 but it fell to a bit below 50% by 2009. These figures indicate that younger
generations of health professionals are more likely to come from a lower caste background than older generations of health
professionals. Given the trend in the growing share of lower caste health professionals, our findings here imply that gender
inequality among health professionals is likely to worsen in India over time.
6. Conclusion
In this paper, we show theoretically and empirically that when patients statistically discriminate doctors based on gender,
while also discriminate doctors based on caste, gender inequality among low-caste doctors exacerbates with an increase in
experience. Although our findings cannot rule out alternative mechanisms that are inconsistent with statistical discrimina-
tion, they imply that the intersectionality between gender and caste discrimination can exacerbate overall gender inequality
among high-skilled workers in India given the increasing representation of low-caste workers in high-skilled occupations.
The findings call for greater policy attention to individuals at the intersection of different discriminated groups.
The primary policy responses to address the underrepresentation of women and lower caste individuals in politics and
governments in India have been the use of gender-based and caste-based reservations. Although gender-based reservations
for enrollments in STEM fields in higher educational institutions were introduced in recent years in a few Indian states,
caste-based reservations have been used in higher educational institutions for decades. These caste-based reservations have
undoubtedly led to improved representation of lower-caste individuals in a variety of high-skilled occupations, which have
in turn increased their earnings ( Bertrand et al., 2010 ). However, caste-based discrimination persists, raising the question
of whether alternative approaches in the implementation of AA other than reservations should be considered ( Islam et al.,
2018 ). The seminal work of Coate and Loury (1993) on AA policy suggests that when individuals are statistical discriminators,
quotas can lead to the patronizing equilibrium where the intended beneficiary group is not benefitted.
An alternative AA policy to reservations can potentially be to allocate additional educational resources to improve the
preparation of students from underrepresented groups for college admissions. By improving their preparation for college
admissions without altering the admission standards, such an alternative form of AA may reduce negative stereotype peo-
ple may hold against underrepresented individuals and consequently the discrimination they suffer. Given the implications
of the intersectionality of gender and caste discrimination on gender inequality among high-skilled workers, it is worth-
while to consider this alternative form of AA. Such an alternative form of AA has the potential to improve representation
without reinforcing statistical discrimination against women and low-caste individuals. The increased representation and
reduced discrimination against women and low-caste individuals in various high-skilled occupations should ultimately lead
to increased market competition and higher overall quality of goods and services.
Declaration of Competing Interest
None.
Supplementary materials
Supplementary material associated with this article can be found, in the online version, at doi: 10.1016/j.jebo.2021.07.034 .
References
Abbink, K. , Islam, A. , Nguyen, C. , 2020. Whose voice matters? An experimental examination of gender bias in intra-household decision-making. J. Econ.Behav. Organ. 176, 337–352 .
A. Islam, D. Pakrashi, S. Sahoo et al. Journal of Economic Behavior and Organization 190 (2021) 111–124
Afridi, F. , Iversen, V. , Sharan, M.R. , 2017. Women political leaders, corruption, and learning: evidence from a large public program in India. Econ. Dev. Cult.Change 66 (1), 1–30 .
Aigner, D.J. , Cain, G.G. , 1977. Statistical theories of discrimination in labor markets. Ind. Labor Relat. Rev. 30 (2), 175–187 . Arcidiacono, P. , Lovenheim, M. , 2016. Affirmative action and the quality-fit trade-off. J. Econ. Lit. 54 (1), 3–51 .
Arrow, K.J., 1973. The Theory of Discrimination in O. Ashenfelter, A. Rees (Ed.), Discrimination in labor markets. Princeton University Press. 3-33. Balafoutas, L. , Davis, B.J. , Sutter, M. , 2016. Affirmative action or just discrimination? A study on the endogenous emergence of quotas. J. Econ. Behav. Organ.
127, 87–98 .
Banerjee, A. , Bertrand, M. , Datta, S. , Mullainathan, S. , 2009. Labor market discrimination in Delhi: evidence from a field experiment. J. Comp. Econ. 37 (1),14–27 .
Banerjee, A. , Duflo, E. , Ghatak, M. , Lafortune, J. , 2013. Marry for what? Caste and mate selection in modern India. Am. Econ. J. Microecon. 5 (2), 33–72 . Beaman, L. , Duflo, E. , Pande, R. , Topalova, P. , 2012. Female leadership raises aspirations and educational attainment for girls: a policy experiment in India.
Science 335 (6068), 582–586 . Becker, G.S. , 1957. The Economics of Discrimination. Chicago University Press .
Begum, L. , Grossman, P.J. , Islam, A. , 2018. Gender bias in parental attitude: an experimental approach. Demography 55 (5), 1641–1662 . Bertrand, M. , Hanna, R. , Mullainathan, S. , 2010. Affirmative action in education: evidence from engineering college admissions in India. J. Public Econ. 94
(1-2), 16–29 .
Bhalotra, S. , Valente, C. , Van Soest, A. , 2010. The puzzle of Muslim advantage in child survival in India. J. Health Econ. 29 (2), 191–204 . Bohren, J.A. , Imas, A. , Rosenberg, M. , 2019. The dynamics of discrimination: theory and evidence. Am. Econ. Rev. 109 (10), 3395–3436 .
Borooah, V.K. , Iyer, S. , 2005. Vidya, Veda, and Varna: the influence of religion and caste on education in rural India. J. Dev. Stud. 41 (8), 1369–1404 . Cassan, G. , 2019. Affirmative action, education and gender: evidence from India. J. Dev. Econ. 136, 51–70 .
Castillo, M. , Petrie, R. , Torero, M. , Vesterlund, L. , 2013. Gender differences in bargaining outcomes: a field experiment on discrimination. J. Public Econ. 99,35–48 .
Chakraborty, S. , 2020. Gender wage differential in public and private sectors in India. Indian J. Labour Econ. 63 (3), 765–780 .
Chattopadhyay, R. , Duflo, E. , 2004. Women as policy makers: evidence from a randomized policy experiment in India. Econometrica 72 (5), 1409–1443 . Chaudhury, A.R. , Sinha, M. , 2020. Does education produce identical labour market outcomes for all? A Study on India. Margin J. Appl. Econ. Res. 14 (3),
309–331 . Clots-Figueras, I. , 2012. Are female leaders good for education? Evidence from India. Am. Econ. J. Appl. Econ. 4 (1), 212–244 .
Coate, S. , Loury, G.C. , 1993. Will affirmative-action policies eliminate negative stereotypes? Am. Econ. Rev. 1220–1240 . Conrad, C. , 2001. Racial trends in labor market access and wages: Women. In: America Becoming: Racial Trends And Their Consequences, 2. National
Research Council, pp. 124–151 .
Crenshaw, K. , 1989. Demarginalizing The Intersection of Race And Sex: A Black Feminist Critique of Antidiscrimination Doctrine, Feminist Theory AndAntiracist Politics. University of Chicago Legal Forum, pp. 139–167 .
Crenshaw, K. , 1991. Mapping the margins: intersectionality, identity politics, and violence against women of color. Stanf. Law Rev. 43 (6), 1241–1299 . Delavande, A., Zafar, B., 2013. Gender discrimination and social identity: experimental evidence from Urban Pakistan. Staff Reports 593, Federal Reserve
Bank of New York. UNDP report: http://hdr.undp.org/sites/default/files/hdr2019.pdf . Deshpande, A. , 2019. Double jeopardy? Stigma of identity and affirmative action. Rev. Black Political Econ. 46 (1), 38–64 .
Deshpande, A. , 2013. Social justice through affirmative action in India: an assessment. Capitalism on Trial. Edward Elgar Publishing .
Ewens, M. , Tomlin, B. , Wang, L.C. , 2014. Statistical discrimination or prejudice? A large sample field experiment. Rev. Econ. Stat. 96 (1), 119–134 . Fins, A., 2019. National Snapshot: Poverty Among Women and Families. National Women’s Law Center Available at https://nwlc.org/wp-content/uploads/
2019/10/PovertySnapshot2019-2.pdf . Gangadharan, L. , Jain, T. , Maitra, P. , Vecci, J. , 2016. Social identity and governance: the behavioral response to female leaders. Eur. Econ. Rev. 90, 302–325 .
Islam, A., Pakrashi, D., Wang, L.C. and Zenou, Y., 2018. Determining the extent of statistical discrimination: evidence from a field experiment in India. CEPRDiscussion Paper No. 12955.
Islam, A. , Pakrashi, D. , Vlassopoulos, M. , Wang, L.C. , 2021. Stigma and misconceptions in the time of the COVID-19 pandemic: a field experiment in India.
Soc. Sci. Med. 278, 113966 . Karekurve-Ramachandra, V. , Lee, A. , 2020. Do gender quotas hurt less privileged groups? Evidence from India. Am. J. Political Sci. 64 (4), 757–772 .
Kumar, R., 2020. Why states are eagerly giving job quota to women? It’s the game of votes, News18, 17 October. Available at: https://www.news18.com/news/opinion/why- states- are- eagerly- giving- job- quota- to- women- its- the- game- of- votes-2974910.html .
Lahoti, R. , Swaminathan, H. , 2016. Economic development and women’s labor force participation in India. Fem. Econ. 22 (2), 168–195 . Leibbrandt, A. , Wang, L.C. , Foo, C. , 2018. Gender quotas, competitions, and peer review: experimental evidence on the backlash against women. Manag. Sci.
64 (8), 3501–3516 .
Lesner, R.V. , 2018. Testing for statistical discrimination based on gender. Labour 32 (2), 141–181 . Longhi, S. , 2020. Racial wage differentials in developed countries. IZA World of Labor 365 .
Madheswaran, S. , Attewell, P. , 2007. Caste discrimination in the Indian urban labour market: evidence from the national sample survey. Econ. Political Wkly.42 (41), 4146–4153 .
Maitra, P. , Rosenblum, D. , 2021. Upstream effects of female political reservations. Eur. J. Political Econ., 102061 . Oostendorp, R.H. , 2009. Globalization and the gender wage gap. World Bank Econ. Rev. 23 (1), 141–161 .
Phelps, E.S. , 1972. The statistical theory of racism and sexism. Am. Econ. Rev. 62 (4), 659–661 . Sharma, K., 2020. IITs take women’s quota to 20% as govt pushes gender balance in tech education, The Print, 17 March. Available at: https://theprint.in/
Siddique, Z. , 2011. Evidence on caste-based discrimination. Labour Econ. 18, S146–S159 . Thorat, S. , Attewell, P. , 2007. Legacy of social exclusion: a correspondence study of job discrimination in India. Econ. Political Wkly. 42 (41), 4141–4145 .
UNDP (United Nations Development Programme), 2019. Human development report 2019. Beyond income, beyond averages, beyond today: Inequalities in human development in the 21st Century. New York: United Nations development programme.
Varma, R. , 2018. US science and engineering workforce: underrepresentation of women and minorities. Am. Behav. Sci. 62 (5), 692–697 . Wankhede, G.G. , 2016. Higher education and the scheduled castes in Maharashtra. Econ. Political Wkly. 51 (6), 83–86 .
World Bank, 2016. Uttar Pradesh – Poverty, Growth and Inequality (English). World Bank Group, Washington D.C. India state briefs .