L Journal of Experimental Marine Biology and Ecology 244 (2000) 181–201 www.elsevier.nl / locate / jembe A comparative study of differences among species and patches of habitat on movements of three species of intertidal gastropods * M.G. Chapman Centre for Research on Ecological Impacts of Coastal Cities, Marine Ecology Laboratories A11, University of Sydney, Sydney NSW 2006, Australia Received 21 April 1999; received in revised form 24 August 1999; accepted 15 September 1999 Abstract Information about how animals move through complex and patchy habitats is crucial to understanding how animals utilize habitat, spatial and temporal patterns of distribution and abundance, population dynamics and patterns of biodiversity. Dispersal may be influenced by many factors, including intrinsic characteristics of a species (e.g. its mobility, specificity for different resources or its ability to perceive the quality, size or structure of patches of habitat) and / or the features of the habitat itself. It is important to understand the relative importance of these different factors. Comparative studies of movements of different species across habitats of different structure will increase our understanding of the relative importance of species- or habitat-characteristics in determining dispersal and the extent to which patterns of movement can be generalized across co-existing species or different patches of habitat. In this study, movement of three species of intertidal gastropods across patches of habitat that varied in cover of standing water, algae and topographic complexity was measured over three different periods of time in three replicate experiments. Movements were generally randomly orientated, but the linear distances displaced differed in complex ways. Over 24 h, distances displaced differed among species. Over 2 weeks, differences among species disappeared and distances moved were determined by the complexity of the topography. At intermediate times (1 week), there were no clear patterns and the results varied from one experiment to another. For 24 h and 2 weeks, patterns were consistent among experiments. For no species could patterns of movement be related to use of micro-habitats during low tide. The importance of replicating experiments and incorporating numerous temporal scales in studies of movement are discussed. 2000 Elsevier Science B.V. All rights reserved. Keywords: Experimental design; Gastropod; Habitat; Intertidal; Movement; Temporal pattern *Tel.: 161-2-9351-4778; fax: 161-2-9351-6713. E-mail address: [email protected] (M.G. Chapman) 0022-0981 / 00 / $ – see front matter 2000 Elsevier Science B.V. All rights reserved. PII: S0022-0981(99)00140-9
Transcript
LJournal of Experimental Marine Biology and Ecology244 (2000) 181–201
www.elsevier.nl / locate / jembe
A comparative study of differences among species andpatches of habitat on movements of three species of
intertidal gastropods
*M.G. ChapmanCentre for Research on Ecological Impacts of Coastal Cities, Marine Ecology Laboratories A11,
University of Sydney, Sydney NSW 2006, Australia
Received 21 April 1999; received in revised form 24 August 1999; accepted 15 September 1999
Abstract
Information about how animals move through complex and patchy habitats is crucial tounderstanding how animals utilize habitat, spatial and temporal patterns of distribution andabundance, population dynamics and patterns of biodiversity. Dispersal may be influenced bymany factors, including intrinsic characteristics of a species (e.g. its mobility, specificity fordifferent resources or its ability to perceive the quality, size or structure of patches of habitat)and/or the features of the habitat itself. It is important to understand the relative importance ofthese different factors. Comparative studies of movements of different species across habitats ofdifferent structure will increase our understanding of the relative importance of species- orhabitat-characteristics in determining dispersal and the extent to which patterns of movement canbe generalized across co-existing species or different patches of habitat. In this study, movementof three species of intertidal gastropods across patches of habitat that varied in cover of standingwater, algae and topographic complexity was measured over three different periods of time inthree replicate experiments. Movements were generally randomly orientated, but the lineardistances displaced differed in complex ways. Over 24 h, distances displaced differed amongspecies. Over 2 weeks, differences among species disappeared and distances moved weredetermined by the complexity of the topography. At intermediate times (1 week), there were noclear patterns and the results varied from one experiment to another. For 24 h and 2 weeks,patterns were consistent among experiments. For no species could patterns of movement be relatedto use of micro-habitats during low tide. The importance of replicating experiments andincorporating numerous temporal scales in studies of movement are discussed. 2000 ElsevierScience B.V. All rights reserved.
0022-0981/00/$ – see front matter 2000 Elsevier Science B.V. All rights reserved.PI I : S0022-0981( 99 )00140-9
182 M.G. Chapman / J. Exp. Mar. Biol. Ecol. 244 (2000) 181 –201
1. Introduction
Populations of organisms typically occupy patches of habitat scattered in a matrix ofdifferent habitat(s). Densities within these patches fluctuate because of local stochastic ordemographic processes and dispersal among patches, which might be via propagules,adults or both (Den Boer, 1968; Levin, 1976; Hansson, 1991; Harrison, 1991).Understanding the factors that maintain individuals within, or cause dispersal amongpatches of habitat is important in understanding how local populations interact.Movement through patchy habitats determines spatial patterns of many species (Wienset al., 1995; Underwood and Chapman, 1996) and, ultimately, spatial variability inassemblages and local patterns of biodiversity (Underwood and Chapman, 1998).
Although many experimental studies have identified how individuals move withrespect to broad-scale environmental features, e.g. height on intertidal shores (McQuaid,1981; Williams, 1995), small-scale features of habitat (Underwood, 1977; Levings andGarrity, 1983; Underwood and Chapman, 1989, 1992; With, 1994; Wiens et al., 1995,1997) or other organisms (Erlandsson and Kostylev, 1995; Chapman, 1998), quantitativecomparative studies of movements of the same species among habitats of very differentstructure and of different species moving across the same range of habitats are notcommon (but see With, 1994; Dempster et al., 1995; Wiens et al., 1995 for studies ofinsects). Without such quantitative comparative information, there cannot be generalunderstanding about the relative importance of the ecological characteristics of theorganisms themselves or the types of habitat they are moving through. This isparticularly important for invertebrates where ‘lack of knowledge of dispersal byendangered invertebrates is a major constraint for conservationists’ (Thomas and Morris,1994).
Intertidal shores are ideal environments for testing the generality of patterns ofmovement because they contain different, easily-accessible habitats which are isolated todifferent degrees and which are occupied by many taxa. These habitats containclosely-related species which forage on different food sources in different ways, but, inaddition, different taxa exploit the same food sources. Many intertidal animals can beeasily handled, marked, manipulated and relocated (Chapman, 1986; Chapman andUnderwood, 1992) and their habitats altered or moved to test specific hypotheses(Petraitis, 1982; Worthington and Fairweather, 1989; Chapman and Underwood, 1994;Crowe, 1996). Techniques for monitoring movement, the necessary controls forexperimental manipulation of species and their habitats and the levels of replicationnecessary for quantifying short- and long-term movement of gastropods have beendocumented (Mackay and Underwood, 1977; Underwood, 1977, 1988; Chapman, 1986,1999; Chapman and Underwood, 1992; Crowe, 1996). Finally, the basic ecology andpatterns of distribution and abundance of many of the organisms are understood andtherefore comparisons among species are relatively easy to interpret.
Most such experimental studies have measured movement over a specific period oftime, determined by the hypothesis being examined. For example, Underwood (1977)examined movements of Austrocochlea porcata A. Adams, Nerita atramentosa Reeveand Bembicium nanum Lamarck over 24 h because he was specifically testinghypotheses about short-term movements and use of habitat during subsequent low tides.
M.G. Chapman / J. Exp. Mar. Biol. Ecol. 244 (2000) 181 –201 183
Chapman (1999) similarly examined movement of Littorina unifasciata Gray over 24-hperiods in specific tests of variability in foraging during different conditions of the seaand weather. There have been relatively few comparative studies of movements of thesame species in the same habitat over different periods of time. Yet relationshipsbetween short-term and long-term patterns of movement are essential to understandingthe ecological consequences of different patterns of dispersal. Baur and Baur (1993)examined dispersal of the land snail Arianta arbustorum (L.) in a forest clearing andlinear patch of habitat and compared daily movements to movement over 10 months.Although daily movement in each habitat was random in distance and direction,long-term movement varied between the two habitats. Similarly, daily (Hamilton, 1977a)and long-term (Hamilton, 1977b) movements of the intertidal snail Littorina irrorataSay showed that one could not generalize from movement measured in the short-term toexplain long-term movement.
Ecologists are becoming increasingly concerned about the need for and difficulties ofgeneralizing from single experiments for improving our understanding of ecologicalpatterns and processes (Underwood et al., 1983; Menge and Farrell, 1989; Underwoodand Petraitis, 1993; Crowe, 1999). A number of studies of movements of intertidalanimals in different habitats have shown variability in the details of patterns onmovement in different experiments, but some generality of pattern when the differentexperiments were examined together (Underwood and Chapman, 1992; Chapman andUnderwood, 1994; Chapman, 1999; Crowe, 1999).
In this study, which is part of a larger study of comparative movement of a suite ofintertidal animals across natural and experimentally manipulated habitat, movement ofthree species of gastropods (N. atramentosa, B. nanum and A. porcata) was compared ina number of replicated experiments. These three species were chosen because they eachgraze micro-algae and live in the same area of the shore. Local densities of these specieshave previously been shown to be correlated with cover of water or algae (Underwood,1975, 1976). Nevertheless, despite these strong associations with particular habitats,short-term movement (over 24 h) was random with respect to distances and directionsmoved in all three species (Underwood, 1977). Although movement of these species hasnot been previously examined with respect to topographic complexity of the rock-surface, topographic complexity can have a strong influence on patterns of distribution,abundance and size-structure of populations (Emsen and Faller-Fritsch, 1976; Raffaelliand Hughes, 1978; Underwood and Chapman, 1992), patterns of dispersion (Chapman,1994) and rates and directionality of movement in intertidal gastropods (Levings andGarrity, 1983; Fairweather, 1988; Underwood and Chapman, 1989; Chapman andUnderwood, 1994).
Here, patterns of movement were compared among A. porcata, N. atramentosa and B.nanum in a number of sites with different physical structure to test the hypotheses that(i) movement will vary consistently among species across sites of different topographicand other physical complexity, (ii) movement will vary consistently across sites ofdifferent complexity in the same way for the different species or (iii) movement willvary interactively among species across habitats of different complexity. Movementswere measured in three different experiments to test the hypothesis that they would besimilar from time to time and therefore results could be generalized from single
184 M.G. Chapman / J. Exp. Mar. Biol. Ecol. 244 (2000) 181 –201
experiments. Finally, movement was measured over three periods of time (1 day, 1 weekand 2 weeks) to test the hypothesis that differences in patterns of movement amongspecies or among habitats are consistent, irrespective of the period over which they aremeasured.
2. Materials and methods
2.1. Study sites
These experiments were done in the Cape Banks Scientific Marine Research Area,Botany Bay, New South Wales, Australia (Chapman, 1994). Six sites, each | 5 m 3 5m, were selected around the shores of Cape Banks at the midshore level. The substratumwas primarily ‘bare’ rock (probably coated with micro-algae; MacLulich, 1987), withpatches of encrusting algae (primarily Hildenbrandia rubra (Sommerfelt) Meneghiniand Ralfsia verrucosa (Arescough) J. Agardh) and foliose macro-algae (primarilyHormosira banksii (Turner) Decaisne and Corallina spp.). The rock-surface varied fromrelatively smooth with few rock-pools from 5 cm to about 80 cm deep, to very complex,with numerous crevices, ledges, overhangs and pools. Three sites were chosen torepresent, subjectively, topographically simple sites with few pools, crevices oroverhangs; the other three were complex. Cover of free-standing water during low tideand of foliose macro-algae varied among sites, but were not correlated with topographiccomplexity. Each site had abundant A. porcata, N. atramentosa and B. nanum.
2.2. Methods
The complexity of the rock-surface was measured in each site at three different spatialscales because the topographic complexity on these shores appears to vary at a hierarchyof spatial scales. At the coarsest scale, the height of the substratum was measured usinga dumpy level at 1-m intervals along each of five parallel 5-m transects through the site(i.e. 25 measures of height at 1-m spacing on a grid throughout each site). At anintermediate scale, height of the substratum was similarly measured at 50-cm intervalsalong each of three 1-m transects, separated by 50 cm (providing nine measures ofheight per grid). Data were collected from two grids, placed randomly in each site. Atthe finest spatial scale (cm), height of the substratum was measured at 5-cm intervalsalong each of 10 50-cm transects, separated by 5 cm. This was repeated in each of fiverandom grids per site. At each spatial scale, the index of topographic complexity foreach grid was calculated as described in Underwood and Chapman (1989) and, for theintermediate and small scales, the indices were averaged per site.
In addition, in each site, the proportion of standing water during low tide and thecover of foliose algae (including canopy) was estimated by measuring the length of eachof five 5-m parallel transects running through each site that lay over standing water orfoliose algae. These values were averaged to give one mean measure per site. Finally,along the same transects, the relative amount of substratum was calculated as the ratio of
M.G. Chapman / J. Exp. Mar. Biol. Ecol. 244 (2000) 181 –201 185
the total length (TL) of a tape measure laid flush with the substratum to the 5-m linearlength (LL) of the transect (TL:LL).
A few days prior to the start of each experiment, | 30–60 snails of each species ineach site were individually marked using numbered plastic labels stuck onto the shells.Previous studies have shown little disturbance associated with similar handling andmarking (Chapman, 1986). Nevertheless, the snails were left undisturbed for a few daysprior to the start of each experiment. Movement was measured as the linear distancesand directions displaced by individual snails over three different periods of time; 1 day(two tidal cycles), 1 week and 2 weeks, for each of three experiments (May, August andSeptember, 1998). These measures were calculated from the subsequent positions ofsnails on the shore, measured in situ from two fixed points in each site (Underwood,1977) with no further disturbance or handling. Numbers of marked snails varied amongspecies and sites according to the proportions expected to be recovered in each site(expected sample size was n 5 20; see Chapman, 1986). Because hypotheses were aboutvariation among species and sites over different periods of time and not specificallyabout changes in movement over time, the same pool of marked animals of snails wasavailable for recovery after 1 day, 1 week and 2 weeks. Nevertheless, because not allsnails were found on each occasion, samples were different each time.
To test the hypothesis that the different species responded differently to features ofhabitat, on eight occasions during the three experiments, the use of three differentmicrohabitats by each species was measured by counting the marked animals of eachspecies in and out of three different microhabitats: in crevices or overhangs, in contactwith or under the canopy of foliose macro-algae or in water $ 1 cm deep.
3. Results
3.1. Physical differences among sites
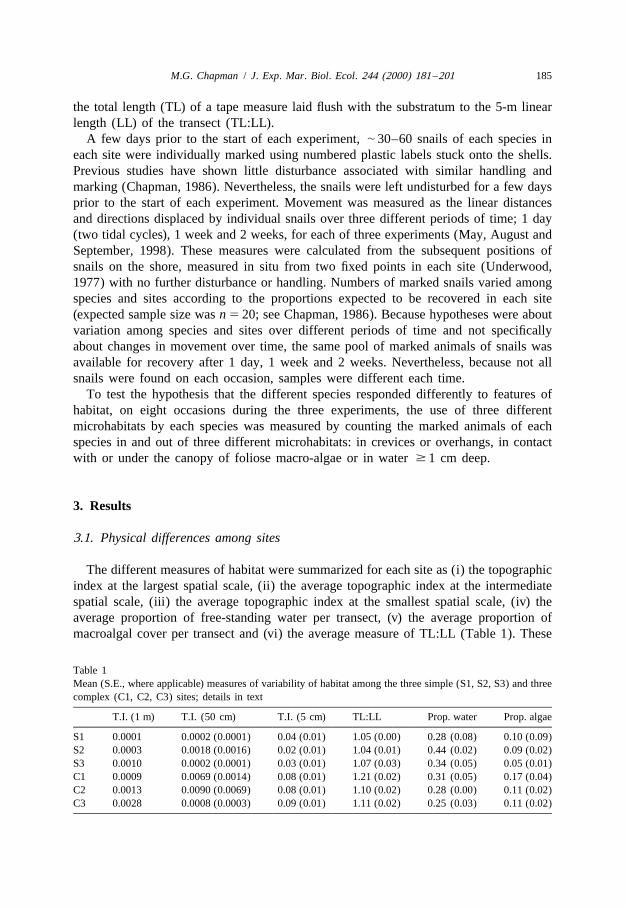
The different measures of habitat were summarized for each site as (i) the topographicindex at the largest spatial scale, (ii) the average topographic index at the intermediatespatial scale, (iii) the average topographic index at the smallest spatial scale, (iv) theaverage proportion of free-standing water per transect, (v) the average proportion ofmacroalgal cover per transect and (vi) the average measure of TL:LL (Table 1). These
Table 1Mean (S.E., where applicable) measures of variability of habitat among the three simple (S1, S2, S3) and threecomplex (C1, C2, C3) sites; details in text
T.I. (1 m) T.I. (50 cm) T.I. (5 cm) TL:LL Prop. water Prop. algae
186 M.G. Chapman / J. Exp. Mar. Biol. Ecol. 244 (2000) 181 –201
values were compared among sites and between levels of topographic complexity usinganalyses of variance (topographic complexity, fixed factor, two levels; sites, three levels,nested within topographic complexity). They were also treated as a multivariate set ofdata and compared using nMDS ordination calculated from a matrix of normalizedEuclidean distances among sites to illustrate variation among sites using all criteria.
The simple sites showed significantly smaller variation in the topographic index andno significant differences among sites at the small spatial scale (analyses of variance;P . 0.05). Similar significant differences (at P , 0.05) were not found at the inter-mediate scale because of the relatively smaller topographic index in one complex site(C3), compared to the other complex sites (Table 1). Nevertheless, the analysis ofvariance on data transformed to natural logarithms showed a relatively large differencebetween the mean topographic index of each level of topographic complexity (F 5 6.90,2 and 4 df, P , 0.06). At the coarsest spatial scale, the topographic index in S3 wassimilar to that in C1 and C2. Therefore, topographic complexity varied from one spatialscale to another among the replicate sites and between the two levels on topographiccomplexity.
There were no significant differences in cover of water (25 to 44%) or foliosemacro-algae (5 to 17%) among sites within each level of topographic complexity, noramong the two levels of topography. Finally, the TL:LL ratio showed significantdifferences among sites, with no significant difference between the two levels oftopographic complexity over and above differences among sites.
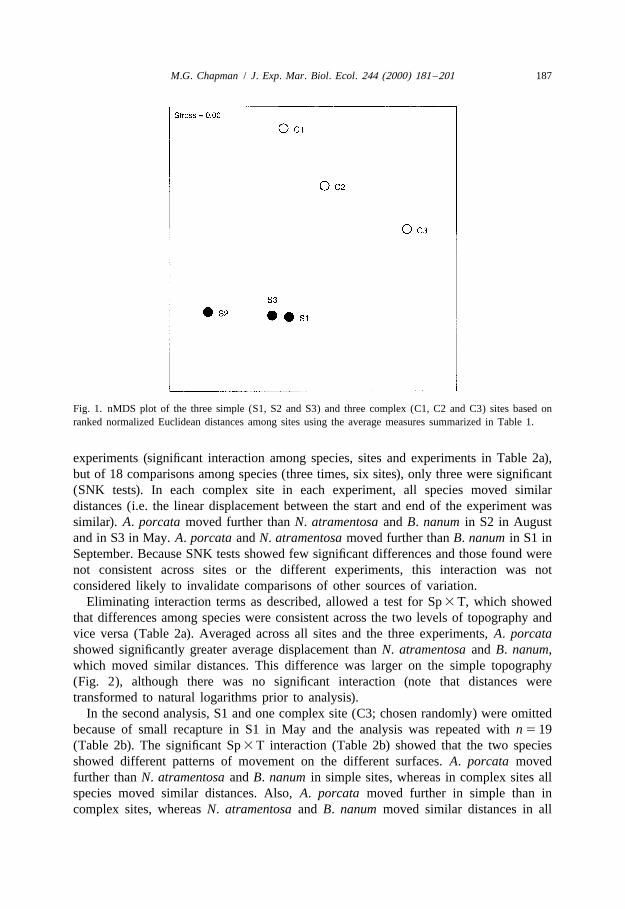
Treating each of these measures as a variable in a multivariate comparison amongsites showed that, despite considerable variability among replicate sites within each levelof topographic complexity, the two levels of complexity clearly separated in 2-dimensional space (Fig. 1). What had been deemed a priori to be simple sites wereclearly different from complex sites.
3.2. Linear distances displaced during movement
Distances displaced during movement were transformed to natural logarithms beforeanalysis because these measures are generally logarithmically distributed (Underwood,1977). Heterogeneity of variances was tested using Cochran’s test prior to analysis ofvariance and appropriate means compared using Student–Newman–Keuls (SNK) tests(Underwood, 1997). ‘Species’ and ‘topography’ were considered fixed factors, ‘experi-ment’ (i.e. May, August or September) was a random factor and ‘sites’ were nested in‘topography’. Because species and topography were fixed factors and experiments andsites random, there were no tests for the main effects of species or topography or theirinteraction. Where appropriate (i.e. interaction terms had P . 0.25; Underwood, 1997),interaction terms were eliminated to allow tests for species, topography or theirinteraction.
There was poor recapture of snails after 1 day and 2 weeks in a few of the sites inMay, 1998 because of rough seas. Therefore, distances displaced after 1 day wereexamined in two separate analyses. In the first, all sites were used, but there were only12 snails of each species in each sample (in all analyses, snails were omitted at randomto balance the samples). The species moved differently from site to site and among
M.G. Chapman / J. Exp. Mar. Biol. Ecol. 244 (2000) 181 –201 187
Fig. 1. nMDS plot of the three simple (S1, S2 and S3) and three complex (C1, C2 and C3) sites based onranked normalized Euclidean distances among sites using the average measures summarized in Table 1.
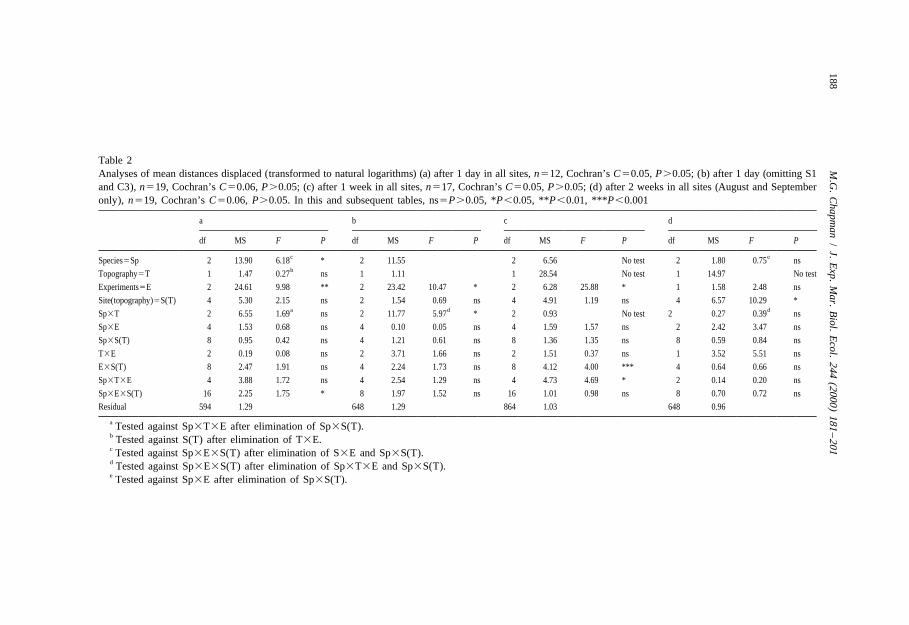
experiments (significant interaction among species, sites and experiments in Table 2a),but of 18 comparisons among species (three times, six sites), only three were significant(SNK tests). In each complex site in each experiment, all species moved similardistances (i.e. the linear displacement between the start and end of the experiment wassimilar). A. porcata moved further than N. atramentosa and B. nanum in S2 in Augustand in S3 in May. A. porcata and N. atramentosa moved further than B. nanum in S1 inSeptember. Because SNK tests showed few significant differences and those found werenot consistent across sites or the different experiments, this interaction was notconsidered likely to invalidate comparisons of other sources of variation.
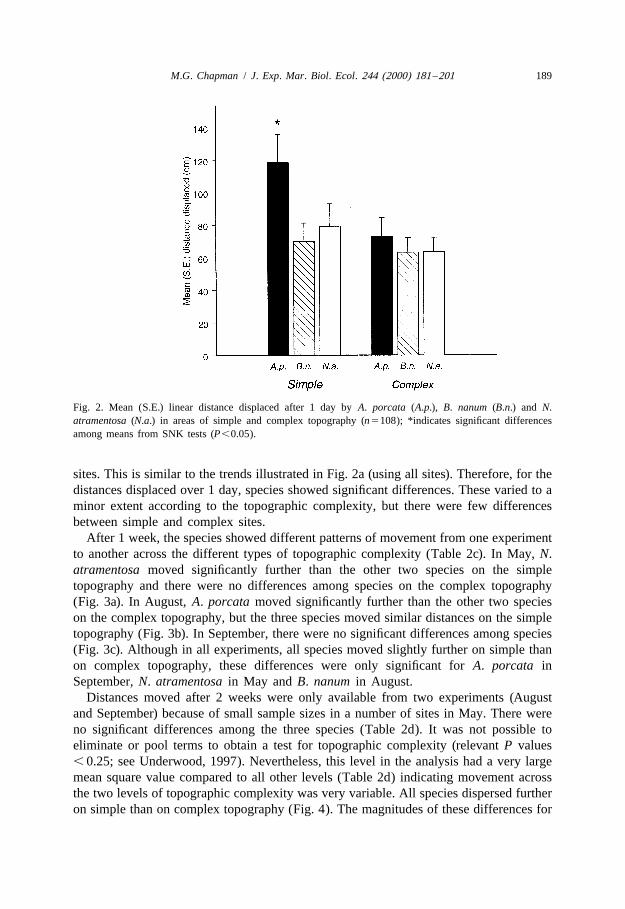
Eliminating interaction terms as described, allowed a test for Sp 3 T, which showedthat differences among species were consistent across the two levels of topography andvice versa (Table 2a). Averaged across all sites and the three experiments, A. porcatashowed significantly greater average displacement than N. atramentosa and B. nanum,which moved similar distances. This difference was larger on the simple topography(Fig. 2), although there was no significant interaction (note that distances weretransformed to natural logarithms prior to analysis).
In the second analysis, S1 and one complex site (C3; chosen randomly) were omittedbecause of small recapture in S1 in May and the analysis was repeated with n 5 19(Table 2b). The significant Sp 3 T interaction (Table 2b) showed that the two speciesshowed different patterns of movement on the different surfaces. A. porcata movedfurther than N. atramentosa and B. nanum in simple sites, whereas in complex sites allspecies moved similar distances. Also, A. porcata moved further in simple than incomplex sites, whereas N. atramentosa and B. nanum moved similar distances in all
188M
.G.
Chapm
an/
J.E
xp.M
ar.B
iol.E
col.244
(2000)181
–201
Table 2Analyses of mean distances displaced (transformed to natural logarithms) (a) after 1 day in all sites, n512, Cochran’s C50.05, P.0.05; (b) after 1 day (omitting S1and C3), n519, Cochran’s C50.06, P.0.05; (c) after 1 week in all sites, n517, Cochran’s C50.05, P.0.05; (d) after 2 weeks in all sites (August and Septemberonly), n519, Cochran’s C50.06, P.0.05. In this and subsequent tables, ns5P.0.05, *P,0.05, **P,0.01, ***P,0.001
a b c d
df MS F P df MS F P df MS F P df MS F P
c eSpecies5Sp 2 13.90 6.18 * 2 11.55 2 6.56 No test 2 1.80 0.75 nsbTopography5T 1 1.47 0.27 ns 1 1.11 1 28.54 No test 1 14.97 No test
a Tested against Sp3T3E after elimination of Sp3S(T).b Tested against S(T) after elimination of T3E.c Tested against Sp3E3S(T) after elimination of S3E and Sp3S(T).d Tested against Sp3E3S(T) after elimination of Sp3T3E and Sp3S(T).e Tested against Sp3E after elimination of Sp3S(T).
M.G. Chapman / J. Exp. Mar. Biol. Ecol. 244 (2000) 181 –201 189
Fig. 2. Mean (S.E.) linear distance displaced after 1 day by A. porcata (A.p.), B. nanum (B.n.) and N.atramentosa (N.a.) in areas of simple and complex topography (n5108); *indicates significant differencesamong means from SNK tests (P,0.05).
sites. This is similar to the trends illustrated in Fig. 2a (using all sites). Therefore, for thedistances displaced over 1 day, species showed significant differences. These varied to aminor extent according to the topographic complexity, but there were few differencesbetween simple and complex sites.
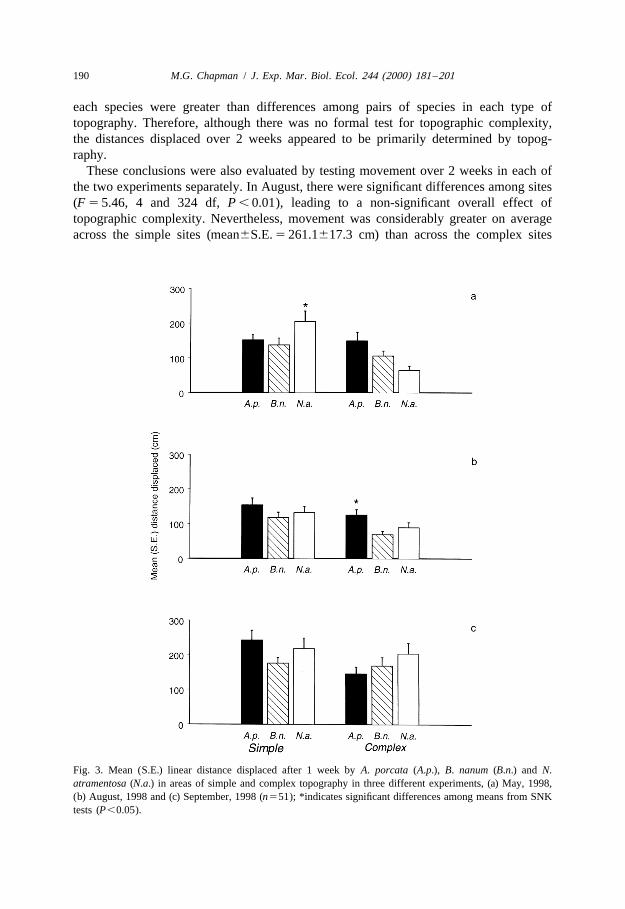
After 1 week, the species showed different patterns of movement from one experimentto another across the different types of topographic complexity (Table 2c). In May, N.atramentosa moved significantly further than the other two species on the simpletopography and there were no differences among species on the complex topography(Fig. 3a). In August, A. porcata moved significantly further than the other two specieson the complex topography, but the three species moved similar distances on the simpletopography (Fig. 3b). In September, there were no significant differences among species(Fig. 3c). Although in all experiments, all species moved slightly further on simple thanon complex topography, these differences were only significant for A. porcata inSeptember, N. atramentosa in May and B. nanum in August.
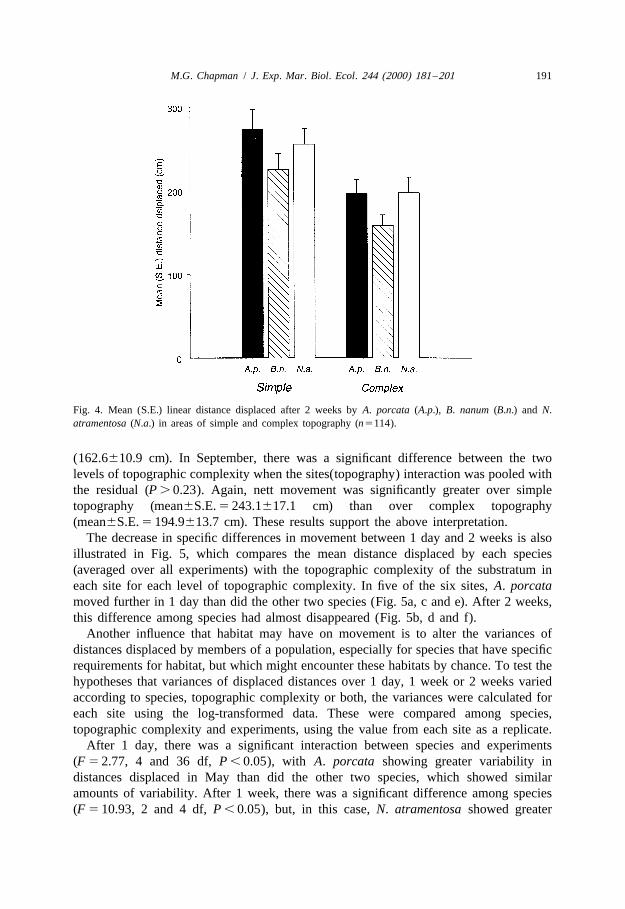
Distances moved after 2 weeks were only available from two experiments (Augustand September) because of small sample sizes in a number of sites in May. There wereno significant differences among the three species (Table 2d). It was not possible toeliminate or pool terms to obtain a test for topographic complexity (relevant P values, 0.25; see Underwood, 1997). Nevertheless, this level in the analysis had a very largemean square value compared to all other levels (Table 2d) indicating movement acrossthe two levels of topographic complexity was very variable. All species dispersed furtheron simple than on complex topography (Fig. 4). The magnitudes of these differences for
190 M.G. Chapman / J. Exp. Mar. Biol. Ecol. 244 (2000) 181 –201
each species were greater than differences among pairs of species in each type oftopography. Therefore, although there was no formal test for topographic complexity,the distances displaced over 2 weeks appeared to be primarily determined by topog-raphy.
These conclusions were also evaluated by testing movement over 2 weeks in each ofthe two experiments separately. In August, there were significant differences among sites(F 5 5.46, 4 and 324 df, P , 0.01), leading to a non-significant overall effect oftopographic complexity. Nevertheless, movement was considerably greater on averageacross the simple sites (mean6S.E. 5 261.1617.3 cm) than across the complex sites
Fig. 3. Mean (S.E.) linear distance displaced after 1 week by A. porcata (A.p.), B. nanum (B.n.) and N.atramentosa (N.a.) in areas of simple and complex topography in three different experiments, (a) May, 1998,(b) August, 1998 and (c) September, 1998 (n551); *indicates significant differences among means from SNKtests (P,0.05).
M.G. Chapman / J. Exp. Mar. Biol. Ecol. 244 (2000) 181 –201 191
Fig. 4. Mean (S.E.) linear distance displaced after 2 weeks by A. porcata (A.p.), B. nanum (B.n.) and N.atramentosa (N.a.) in areas of simple and complex topography (n5114).
(162.6610.9 cm). In September, there was a significant difference between the twolevels of topographic complexity when the sites(topography) interaction was pooled withthe residual (P . 0.23). Again, nett movement was significantly greater over simpletopography (mean6S.E. 5 243.1617.1 cm) than over complex topography(mean6S.E. 5 194.9613.7 cm). These results support the above interpretation.
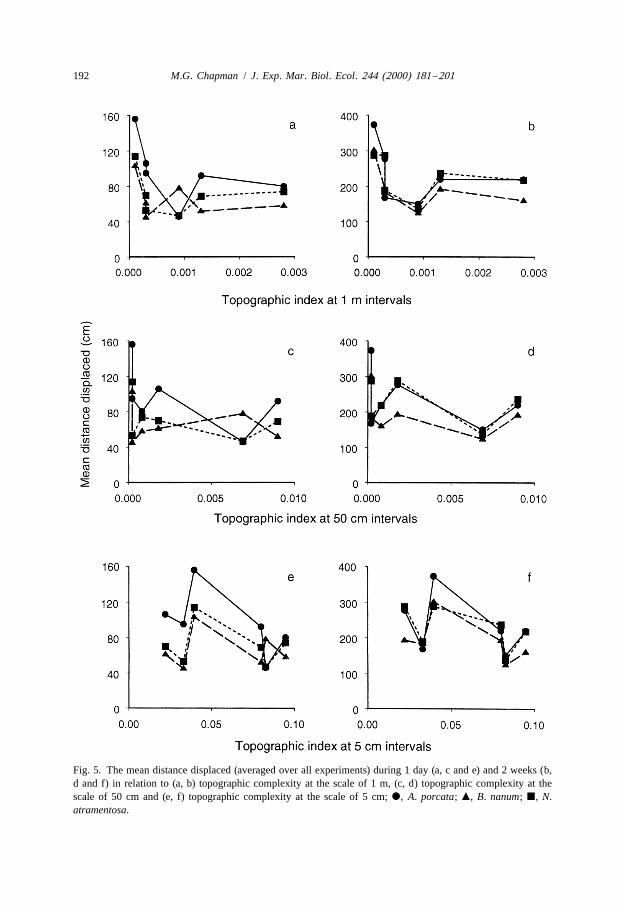
The decrease in specific differences in movement between 1 day and 2 weeks is alsoillustrated in Fig. 5, which compares the mean distance displaced by each species(averaged over all experiments) with the topographic complexity of the substratum ineach site for each level of topographic complexity. In five of the six sites, A. porcatamoved further in 1 day than did the other two species (Fig. 5a, c and e). After 2 weeks,this difference among species had almost disappeared (Fig. 5b, d and f).
Another influence that habitat may have on movement is to alter the variances ofdistances displaced by members of a population, especially for species that have specificrequirements for habitat, but which might encounter these habitats by chance. To test thehypotheses that variances of displaced distances over 1 day, 1 week or 2 weeks variedaccording to species, topographic complexity or both, the variances were calculated foreach site using the log-transformed data. These were compared among species,topographic complexity and experiments, using the value from each site as a replicate.
After 1 day, there was a significant interaction between species and experiments(F 5 2.77, 4 and 36 df, P , 0.05), with A. porcata showing greater variability indistances displaced in May than did the other two species, which showed similaramounts of variability. After 1 week, there was a significant difference among species(F 5 10.93, 2 and 4 df, P , 0.05), but, in this case, N. atramentosa showed greater
192 M.G. Chapman / J. Exp. Mar. Biol. Ecol. 244 (2000) 181 –201
Fig. 5. The mean distance displaced (averaged over all experiments) during 1 day (a, c and e) and 2 weeks (b,d and f) in relation to (a, b) topographic complexity at the scale of 1 m, (c, d) topographic complexity at thescale of 50 cm and (e, f) topographic complexity at the scale of 5 cm; d, A. porcata; m, B. nanum; j, N.atramentosa.
M.G. Chapman / J. Exp. Mar. Biol. Ecol. 244 (2000) 181 –201 193
variability in the distances displaced. After 2 weeks, the variances of the distancesdisplaced did not differ among species, the two levels of topographic complexity, thetwo experiments or with any interactions of these variables (P . 0.05 for all terms in theanalysis).
3.3. Directionality of dispersal
The original objective was to test hypotheses that the mean direction displaced wouldvary according to species, topographic complexity or their interaction and thatdirectional patterns of movement would be consistent across experiments. This was to bedone using analyses of variance for directional data (Underwood and Chapman, 1985).In fact, movement was only directional (Rayleigh’s test; Mardia, 1972) for A. porcata intwo sites in August and for N. atramentosa in two sites in May. Because there is nologic in comparing mean directions when movement is randomly orientated, theseparticular hypotheses were not tested. Neither was it possible to test the hypotheses thatdirectionality of movement varied according to species or topography, but was consistent
]across experiments, using the method described in Chapman (1986) because the Rvalues were too small. Therefore, to test the hypothesis that directionality varied among
]species, topography or experiment, R was calculated for each species in each site in eachexperiment. These values were then compared using analysis of variance.
All F-ratios were non-significant (P.0.05). Therefore, movement was similarlyrandomly orientated in all species, on complex and simple topographic complexity andduring the three different experiments.
3.4. Correlations between dispersal and environmental variables
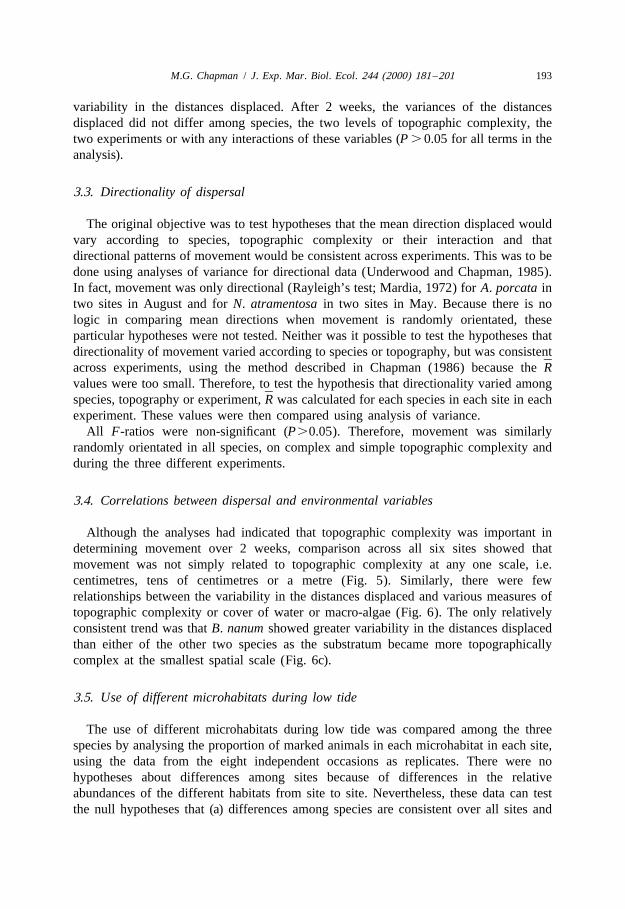
Although the analyses had indicated that topographic complexity was important indetermining movement over 2 weeks, comparison across all six sites showed thatmovement was not simply related to topographic complexity at any one scale, i.e.centimetres, tens of centimetres or a metre (Fig. 5). Similarly, there were fewrelationships between the variability in the distances displaced and various measures oftopographic complexity or cover of water or macro-algae (Fig. 6). The only relativelyconsistent trend was that B. nanum showed greater variability in the distances displacedthan either of the other two species as the substratum became more topographicallycomplex at the smallest spatial scale (Fig. 6c).
3.5. Use of different microhabitats during low tide
The use of different microhabitats during low tide was compared among the threespecies by analysing the proportion of marked animals in each microhabitat in each site,using the data from the eight independent occasions as replicates. There were nohypotheses about differences among sites because of differences in the relativeabundances of the different habitats from site to site. Nevertheless, these data can testthe null hypotheses that (a) differences among species are consistent over all sites and
194 M.G. Chapman / J. Exp. Mar. Biol. Ecol. 244 (2000) 181 –201
Fig. 6. The variance among distances (transformed to natural logarithms) displaced (averaged over allexperiments) during 2 weeks in relation to (a) topographic complexity at the scale of 1 m, (b) topographiccomplexity at the scale of 50 cm and (c) topographic complexity at the scale of 5 cm; d, A. porcata; m, B.nanum; j, N. atramentosa.
M.G. Chapman / J. Exp. Mar. Biol. Ecol. 244 (2000) 181 –201 195
(b) differences among species vary interactively from site to site, for each microhabitatseparately and n58 measures (i.e. times of sampling).
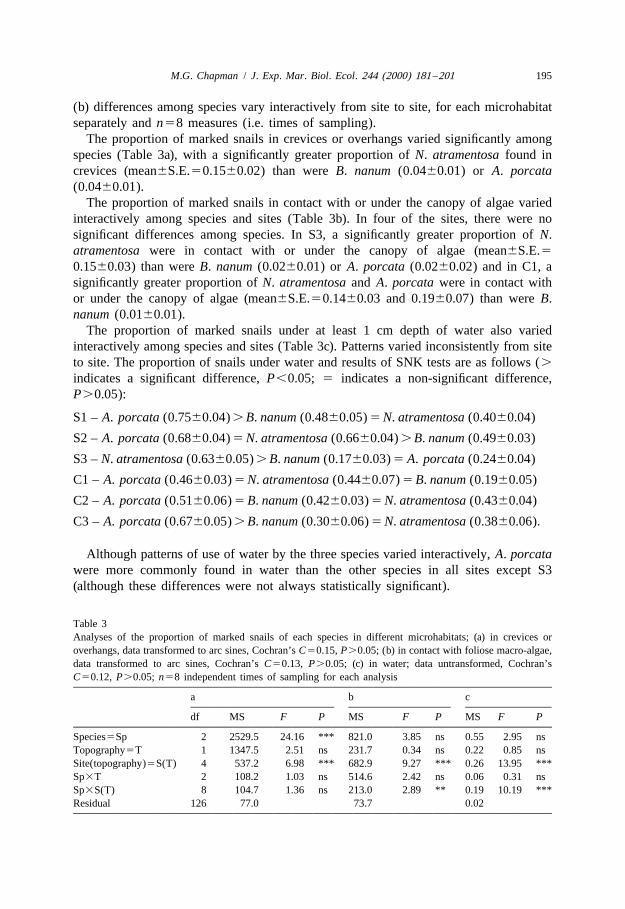
The proportion of marked snails in crevices or overhangs varied significantly amongspecies (Table 3a), with a significantly greater proportion of N. atramentosa found increvices (mean6S.E.50.1560.02) than were B. nanum (0.0460.01) or A. porcata(0.0460.01).
The proportion of marked snails in contact with or under the canopy of algae variedinteractively among species and sites (Table 3b). In four of the sites, there were nosignificant differences among species. In S3, a significantly greater proportion of N.atramentosa were in contact with or under the canopy of algae (mean6S.E.50.1560.03) than were B. nanum (0.0260.01) or A. porcata (0.0260.02) and in C1, asignificantly greater proportion of N. atramentosa and A. porcata were in contact withor under the canopy of algae (mean6S.E.50.1460.03 and 0.1960.07) than were B.nanum (0.0160.01).
The proportion of marked snails under at least 1 cm depth of water also variedinteractively among species and sites (Table 3c). Patterns varied inconsistently from siteto site. The proportion of snails under water and results of SNK tests are as follows (.
indicates a significant difference, P,0.05; 5 indicates a non-significant difference,P.0.05):
S1 – A. porcata (0.7560.04) . B. nanum (0.4860.05) 5 N. atramentosa (0.4060.04)
S2 – A. porcata (0.6860.04) 5 N. atramentosa (0.6660.04) . B. nanum (0.4960.03)
S3 – N. atramentosa (0.6360.05) . B. nanum (0.1760.03) 5 A. porcata (0.2460.04)
C1 – A. porcata (0.4660.03) 5 N. atramentosa (0.4460.07) 5 B. nanum (0.1960.05)
C2 – A. porcata (0.5160.06) 5 B. nanum (0.4260.03) 5 N. atramentosa (0.4360.04)
C3 – A. porcata (0.6760.05) . B. nanum (0.3060.06) 5 N. atramentosa (0.3860.06).
Although patterns of use of water by the three species varied interactively, A. porcatawere more commonly found in water than the other species in all sites except S3(although these differences were not always statistically significant).
Table 3Analyses of the proportion of marked snails of each species in different microhabitats; (a) in crevices oroverhangs, data transformed to arc sines, Cochran’s C50.15, P.0.05; (b) in contact with foliose macro-algae,data transformed to arc sines, Cochran’s C50.13, P.0.05; (c) in water; data untransformed, Cochran’sC50.12, P.0.05; n58 independent times of sampling for each analysis
196 M.G. Chapman / J. Exp. Mar. Biol. Ecol. 244 (2000) 181 –201
4. Discussion
This study showed that nett movement, as measured by the linear distance displacedby snails while actively foraging, was influenced by characteristics of the speciesthemselves and by the topographic complexity of the habitat, depending on the length oftime over which movement was measured. These snails move and feed during high tideand are usually inactive during low tide, except for occasional movement in pools ofwater (personal observations), although they do not home. Therefore, what wasmeasured as the linear distances displaced by snails over short periods of time (twoperiods of high tide) gave a measure of the nett distances moved over one or two feedingexcursions (snails do not necessarily feed during each high tide). The linear distancesdisplaced over longer periods gave a measure of how the animals moved through theirhabitat during subsequent foraging periods.
Over short periods of 24 h, characteristics of the species were the strongest influenceon movement, with A. porcata being displaced significantly further than B. nanum or N.atramentosa. Although this pattern was common for simple and complex sites, thedifference was greater on topographically simple substrata. These results contrast withUnderwood (1977), who found that over two 24-h periods, N. atramentosa and A.porcata moved similar distances and significantly further than B. nanum. Because of theparticular hypotheses he was testing, this comparison was not replicated over more thanone shore and the topographic complexity of the substratum was not measured. Theresults of this study (replicated three times in six different sites) suggest that, overperiods of 24 h, A. porcata does, in general, disperse further than N. atramentosa and B.nanum over a range of different complexities of habitat.
Differences in patterns of foraging among species that live in the same general area(e.g. intertidal shores) and eat the same food are not uncommon, but often the species donot co-exist in and use the same patches of habitat. For example, Nerita funiculata(Menke) live lower on intertidal shores in Panama than do N. scabricosta (Lamarck)(Levings and Garrity, 1983). Each grazes on micro-algae, but N. funiculata graze insmall areas around crevices in which they shelter when not feeding, whereas N.scabricosta forage across the shore from high- to lowshore levels. Similarly, the chitonsAcanthopleura brevispinosa (Sowerby) live slightly higher on the shores of Somaliathan do A. gemmata (Blainville) (Chelazzi et al., 1983). Each feeds on micro-algaeduring nocturnal low tides, generally foraging downshore and homing to restingpositions after feeding. Nevertheless, A. brevispinosa changed resting positions andfeeding areas more frequently than did A. gemmata. The limpets Patella rustica L. andP. coerulea L., which inhabit different levels on Mediterranean shores, show differenttemporal patterns of foraging (Della Santini and Chelazzi, 1992). Such patterns are oftenexplained by the model that they reduce interspecific competition for food, but in moststudies there have been no direct tests of this model (e.g. Chelazzi et al., 1983; DellaSantini and Chelazzi, 1992).
There have been fewer comparisons of movements of species in the same patches ofhabitat, but those that have been done also show marked differences among ecologically-similar species. For example, Underwood (1977) showed significant differences in meandistances moved by the three micro-algal grazing gastropods, A. porcata, N. atramen-
M.G. Chapman / J. Exp. Mar. Biol. Ecol. 244 (2000) 181 –201 197
tosa and B. nanum, on one shore at Cape Banks. Fairweather (1988) examined dispersalof the whelks Morula marginalba Blainville and Thais orbita Gmelin in the sameexperimental areas and found very large differences in distances dispersed and the use ofhabitats. He did not, however, have controls for disturbing or translocating the animalsinto new areas, each of which can influence dispersal (Chapman, 1986; Underwood,1988; Chapman and Underwood, 1994). Chapman and Underwood (1994) showeddifferent rates of dispersal of two co-existing upper-shore littorinids across very differenttypes of habitat. Interspecific differences in dispersal can be large, even amongco-existing species that have similar requirements for food, although the factors thatcause these differences are not clearly understood and vary among studies. For example,Levings and Garrity (1983) showed experimentally that the two species of neritid (seeabove) suffered excessive mortality from predation and physical stress if prevented fromretreating to crevices, but no explanation was given for why the two species should showsuch different patterns of foraging. Similarly, differences in requirements for shelter canlead to differences in movement (Fairweather, 1988; Underwood and Chapman, 1989;Chapman and Underwood, 1994), but the specific factors to which the animals respondare not usually known.
This study showed that the three species showed different patterns of occupation ofmicro-habitats as has been previously described (Underwood, 1975, 1976, 1977). Thesecould not, however, be easily related to patterns of movement. N. atramentosa was morecommonly found in crevices in all sites, i.e. all levels of topographic complexity.Although the proportion of crevices in each site was not directly measured, there wereno relationships between short-term rates of movement and topographic complexity(which is related in some way to amounts of crevices and overhangs) measured at anumber of scales. This contrasts with other species on these shores that are pre-dominantly found in crevices during low tides and where the presence /absence ofcrevices markedly affects dispersal over short periods of time (Underwood andChapman, 1989; Chapman and Underwood, 1994).
Despite variable cover of algae among sites, proportions of snails in contact withalgae varied interactively among species from site to site and there were no relationshipsbetween patterns of movement and the proportion of snails found in contact with orunder algae, nor with the cover of available algae in each site.
In most sites, A. porcata was more commonly found under water than were the otherspecies, thus supporting Underwood (1976). Again, however, for no species werepatterns of movement correlated with the amount of available water, nor with theproportion of snails found in water. This contrasts with Underwood (1977) who foundthat A. porcata moved greater distances in sites with greater cover of water. Cover ofwater in all sites in this study was, however, towards the lower end of the range of coverin Underwood’s (1977) study.
With increasing time over which movement was measured, patterns changed.Differences among species became smaller and the complexity of the habitat moreimportant in determining movement. As for the shorter periods of time, cover of algae orstanding water had no discernible effects on distances moved. After 1 week, there werecomplex interactions among species, topographic complexity and the different runs ofthe experiment, but, after 2 weeks, topographic complexity was the strongest deter-
198 M.G. Chapman / J. Exp. Mar. Biol. Ecol. 244 (2000) 181 –201
minant of movement, with each species being displaced smaller distances over complexsubstrata. Comparisons of the distances displaced with the TL:LL ratio (Table 1), whichis an estimate of the true length of a straight path over complex substratum relative tothe linear distance between the start and finish of the path, showed differences in theamount of habitat snails had to move over to get from A to B in a straight line did notaccount for the large differences in distances displaced between simple and complexsites. Therefore, topographic complexity itself or other variables associated with it (e.g.strength of flow of water during rising and ebbing tides, amount or quality of micro-algalfood, etc.) must influence movement. If the snails are responding directly to topographiccomplexity, then they appear to be responding to features that are not simply identifiedat one of the three scales measured here because there was no clear correlation with ratesof movement and any single measure of topographic complexity. This contrasts withmovement of L. unifasciata and N. pyramidalis which were clearly correlated with thetopographic complexity measured at the scale of 5 cm (Underwood and Chapman,1989). Therefore, the snails may respond to a composite measure of topographiccomplexity incorporating a number of spatial scales. This is presently being examined.
Alternatively, they may be responding to features of habitat that are themselvescorrelated with topography. Decreases in micro-algal food can increase dispersal(Mackay and Underwood, 1977; Branch and Branch, 1981). Underwood (1984) andMacLulich (1987) showed differences in amounts of micro-algae on these shores inrelation to height on the shore, exposure to waves and among shores, but did notexamine micro-algal abundances with respect to topographic complexity. Micro-algalfood in the sites of this study were not measured.Variability in the duration of wetting bythe sea during high tide strongly influenced movement in the littorinid, L. unifasciata, athighshore levels (Chapman, 1999), but is less likely to be important in these study sitesbecause they are submersed for similar periods each high tide.
The value of extrapolating from small-scale studies to general patterns has beenwidely discussed in the literature (Menge, 1991, 1997; Underwood and Petraitis, 1993;Wootton, 1993). Although there are obvious problems with such extrapolation, manyexperiments cannot be done at the large spatial and temporal scales needed. In terrestrialspecies that can perceive food at a distance using visual or olfactory cues, simple rulesof movement have been shown to describe longer-term foraging (insects — Kareiva,1982; Turchin, 1991; sheep — Gross et al., 1995). For some snails, however, short-termmovements cannot explain long-term patterns of movement (e.g. Hamilton, 1977a,b;Baur and Baur, 1993). Daily movement is often random, probably because the animalsdo not respond to cues at a distance (even when they have strict requirements for habitat,they may only encounter these habitats by chance, see Chapman and Underwood, 1994).Long-term movement tends, however, to keep animals within limited patches of habitat,perhaps simply because random movements in relatively large sites tends to keep mostanimals in the site, or possibly because they respond to edges of suitable habitat. Thisstudy indicates a problem with extrapolating from short-term to long-term patterns ofdispersal because interspecific differences and variability of movement across differenthabitats each varied according to the length of time over which movement wasmeasured.
There was, however, relatively good agreement among the different experiments.
M.G. Chapman / J. Exp. Mar. Biol. Ecol. 244 (2000) 181 –201 199
Differences among species over 24 h and differences among the two levels oftopographic complexity over 2 weeks were consistent over the three experiments. Onlyat the intermediate stage, movement over 1 week, were there strong interactions amongspecies and topography, which varied from one experiment to the other. It is relativelydifficult to describe cues associated with topographic complexity which will vary in theireffects from one experiment to another. The most likely cues are environmental, e.g. theroughness of the sea, or the weather, which may have local effects on foraging bydifferent species. Temporal variability in movements among species and habitats isbeing further investigated because it affects generalizations from few studies to generalpatterns.
This study is part of a larger project investigating the effects of spatial pattern ofhabitat on movements of different species across habitats with different fragmentation inorder to identify whether differences among species, or the fragmentation of the habitatare most important in determining movement. Obviously, the larger study will have toincorporate different periods over which movement is measured. These results alsoindicate that all future experiments will have to be replicated a number of times so thattemporal variability in movement over different periods of times and in different habitatscan be measured. Such data are extremely important in understanding how species usetheir habitat.
Acknowledgements
This research was funded by an Australian Research Council Small Grant and theCentre for Research on Ecological Impacts of Coastal Cities. I thank J. Grayson, V.Mathews, S. Monteiro, A. Phillips, M. Sage and A.J. Underwood for assistance in thefield, particularly J. Grayson who co-ordinated the fieldwork and all the entry andchecking of data and assisted with analyses and preparation of the figures. M. Sageassisted with computer programming. A.J. Underwood, P. Archambault and twoanonymous reviewers offered helpful comments on earlier drafts of this manuscript.[AU]
References
Baur, A., Baur, B., 1993. Daily movement patterns and dispersal in the land snail Arianta arbustorum.Malacologia 35, 89–98.
Branch, G.M., Branch, M.L., 1981. Experimental analysis of intraspecific competition in an intertidalgastropod, Littorina unifasciata. Aust. J. Mar. Freshwater Res. 32, 573–589.
Chapman, M.G., 1986. Assessment of some controls in experimental transplants of intertidal gastropods. J.Exp. Mar. Biol. Ecol. 103, 181–201.
Chapman, M.G., 1994. Small- and broad-scale patterns of distribution of the upper-shore littorinid Nodilit-torina pyramidalis in New South Wales. Aust. J. Ecol. 19, 83–95.
Chapman, M.G., 1998. Variability in trail-following and aggregation in Nodilittorina unifasciata Gray. J. Exp.Mar. Biol. Ecol. 224, 48–71.
200 M.G. Chapman / J. Exp. Mar. Biol. Ecol. 244 (2000) 181 –201
Chapman, M.G., 1999. Variability of foraging in highshore habitats: dealing with unpredictability. Hydro-biologia (in press).
Chapman, M.G., Underwood, A.J., 1992. Experimental designs for analyses of movements by molluscs. In:Grahame, J., Mill, P.J., Reid, D.G. (Eds.), Proceedings of the Third International Symposium on LittorinidBiology, The Malacological Society of London, London, pp. 169–180.
Chapman, M.G., Underwood, A.J., 1994. Dispersal of the intertidal snail, Nodilittorina pyramidalis in responseto the topographic complexity of the substratum. J. Exp. Mar. Biol. Ecol. 179, 145–169.
Chelazzi, G., Focardi, S., Deneubourg, J.L., 1983. A comparative study on the movement patterns of twosympatric tropical chitons (Mollusca: Polyplacophora). Mar. Biol. 74, 115–125.
Crowe, T.P., 1996. Different effects of microhabitat fragmentation on patterns of dispersal of an intertidalgastropod in two habitats. J. Exp. Mar. Biol. Ecol. 206, 83–107.
Crowe, T.P., 1999. Limits to generality: seasonal and temporal variation in dispersal of an intertidal gastropod.J. Exp. Mar. Biol. Ecol. 232, 177–196.
Della Santini, P., Chelazzi, G., 1992. Temporal organization of foraging in two Mediterranean limpets, Patellarustica L. and P. coerulea L. J. Exp. Mar. Biol. Ecol. 153, 75–87.
Dempster, J.P., Atkinson, D.A., Cheesman, O.D., 1995. The spatial population dynamics of insects exploiting apatchy food resource. 1. Population extinctions and regulation. Oecologia (Berl.) 104, 340–353.
Den Boer, P.J., 1968. Spreading of risk and stabilization of animal numbers. Acta Biotheor. 18, 165–194.Emsen, R.H., Faller-Fritsch, R.J., 1976. An experimental investigation into the effect of crevice availability on
abundance and size-structure in a population of Littorina rudis (Manton) (Gastropoda: Prosobranchia). J.Exp. Mar. Biol. Ecol. 23, 285–297.
Erlandsson, J., Kostylev, V., 1995. Trail following, speed and fractal dimension of movement in a marineprosobranch, Littorina littorea, during a mating and a non-mating season. Mar. Biol. 122, 87–94.
Fairweather, P.G., 1988. Movements of intertidal whelks (Morula marginalba and Thais orbita) in relation toavailability of prey and shelter. Mar. Biol. 100, 63–68.
Gross, J.E., Zank, C., Hobbs, N.T., Spalinger, D.E., 1995. Movement rules for herbivores in spatiallyheterogeneous environments: responses to small scale pattern. Landsc. Ecol. 10, 209–217.
Hamilton, P.V., 1977a. Daily movements and visual location of plant stems by Littorina irrorata (Mollusca:Gastropoda). Mar. Behav. Physiol. 4, 293–304.
Hamilton, P.V., 1977b. Intertidal distribution and long-term movement of Littorina irrorata (Mollusca:Gastropoda). Mar. Biol. 46, 49–58.
Hansson, L., 1991. Dispersal and connectivity in metapopulations. Biol. J. Linn. Soc. 42, 89–103.Harrison, S., 1991. Local extinction in a metapopulation context: an empirical evaluation. Biol. J. Linn. Soc.
42, 73–88.Kareiva, P., 1982. Experimental and mathematical analyses of herbivore movement: quantifying the influence
of plant spacing and quality on foraging discrimination. Ecol. Monogr. 52, 261–282.Levin, S.A., 1976. Population dynamic models in heterogeneous environments. Annu. Rev. Ecol. Syst. 7,
287–310.Levings, S.C., Garrity, S.D., 1983. Diel and tidal movement of two co-occurring neritid snails: differences in
grazing patterns on a tropical rocky shore. J. Exp. Mar. Biol. Ecol. 67, 261–278.Mackay, D.A., Underwood, A.J., 1977. Experimental studies on homing in the intertidal patellid limpet
Cellana tramoserica (Sowerby). Oecologia (Berl.) 30, 215–237.MacLulich, J.H., 1987. Variations in the density and variety of intertidal epilithic microflora. Mar. Ecol. Progr.
Ser. 40, 285–293.Mardia, K.V., 1972. Statistics of Directional Data, Academic Press, London.McQuaid, C.D., 1981. The establishment and vertical size gradients in populations of Littorina africana
knysnaensis (Philippi) on an exposed rocky shore. J. Exp. Mar. Biol. Ecol. 54, 77–90.Menge, B.A., 1991. Generalizing from experiments; is predation strong or weak in the New England rocky
intertidal? Oecologia (Berl.) 88, 1–8.Menge, B.A., 1997. Detection of direct versus indirect effects: were experiments long enough? Am. Nat. 149,
801–823.Menge, B.A., Farrell, T.M., 1989. Community structure and interaction webs in shallow marine hard-bottom
communities: tests of an environmental stress model. Adv. Ecol. Res. 19, 189–262.
M.G. Chapman / J. Exp. Mar. Biol. Ecol. 244 (2000) 181 –201 201
Petraitis, P.S., 1982. Occurrence of random and directional movements in the periwinkle, Littorina littorea(L.). J. Exp. Mar. Biol. Ecol. 59, 207–217.
Raffaelli, D.G., Hughes, R.N., 1978. The effects of crevice size and availability on populations of Littorinarudis and Littorina neritoides. J. Anim. Ecol. 47, 71–83.
Thomas, J.A., Morris, M.G., 1994. Patterns, mechanisms and rates of extinction among invertebrates in theUnited Kingdom. Phil. Trans. R. Soc. B 344, 47–54.
Turchin, P., 1991. Quantifying insect movements in the field. Environ. Entemol. 20, 955–963.Underwood, A.J., 1975. Intertidal zonation of prosobranch gastropods: analysis of densities of four co-existing
species. J. Exp. Mar. Biol. Ecol. 19, 197–216.Underwood, A.J., 1976. Analysis of patterns of dispersion of intertidal prosobranch gastropods in relation to
macroalgae and rock pools. Oecologia (Berl.) 25, 145–154.Underwood, A.J., 1977. Movements of intertidal gastropods. J. Exp. Mar. Biol. Ecol. 26, 191–201.Underwood, A.J., 1984. Vertical and seasonal patterns in competition for microalgae between intertidal
gastropods. Oecologia (Berl.) 64, 211–222.Underwood, A.J., 1988. Design and analysis of field experiments on competitive interactions affecting
behaviour of intertidal animals. In: Chelazzi, G., Vannini, M. (Eds.), Behavioural Adaptation to IntertidalLife. NATO ASI Series A, Life Sciences, Vol. 151, Plenum Press, New York, pp. 333–357.
Underwood, A.J., 1997. Experiments in Ecology. Their Logical Design and Interpretation using Analysis ofVariance, Cambridge University Press, Cambridge, UK.
Underwood, A.J., Chapman, M.G., 1985. Multifactorial analyses of directions of movement of animals. J. Exp.Mar. Biol. Ecol. 91, 17–43.
Underwood, A.J., Chapman, M.G., 1989. Experimental analyses of the influences of topography of thesubstratum on movements and density of an intertidal snail, Littorina unifasciata. J. Exp. Mar. Biol. Ecol.134, 175–196.
Underwood, A.J., Chapman, M.G., 1992. Experiments on topographic influences on density and dispersion ofLittorina unifasciata in New South Wales. In: Grahame, J., Mill, P.J., Reid, D.G. (Eds.), Proceedings of theThird International Symposium on Littorinid Biology, The Malacological Society of London, London, pp.181–195.
Underwood, A.J., Chapman, M.G., 1996. Scales of spatial patterns of distribution of intertidal invertebrates.Oecologia (Berl.) 107, 212–224.
Underwood, A.J., Chapman, M.G., 1998. A method for analysing spatial scales in variation in composition ofassemblages. Oecologia (Berl.) 117, 570–578.
Underwood, A.J., Denley, E.J., Moran, M.J., 1983. Experimental analyses of the structure and dynamics of themidshore intertidal communities in New South Wales. Oecologia (Berl.) 56, 202–219.
Underwood, A.J., Petraitis, P.S., 1993. Structure of intertidal assemblages in different localities: how can localprocesses be compared. In: Ricklefs, R.E., Schluter, D. (Eds.), Species Diversity in Ecological Com-munities. Historical and Geographical Perspectives, University of Chicago Press, Chicago, pp. 39–51.
Wiens, J.A., Crist, T.O., With, K.A., Milne, B.T., 1995. Fractal patterns of insect movement in microlandscapemosaics. Ecology 76, 663–666.
Wiens, J.A., Schooley, R.L., Weeks, R.D., 1997. Patchy landscapes and animal movements: do beetlespercolate? Oikos 78, 257–264.
Williams, G.A., 1995. Maintenance of zonation patterns in two species of flat periwinkle, Littorina obtusataand L. mariae. In: Mill, P.J., McQuaid, C.D. (Eds.), Developments in Hydrobiology III. Advances inLittorinid Biology, Kluwer, Dordrecht, pp. 143–150.
With, K.A., 1994. Using fractal analysis to assess how species perceive landscape structure. Landsc. Ecol. 9,25–36.
Wootton, J.T., 1993. Predicting direct and indirect effects: an integrated approach using experiments and pathanalysis. Ecology 75, 151–165.
Worthington, D.G., Fairweather, P.G., 1989. Shelter and food: interactions between Turbo undulatum(Archaeogastropoda: Turbinidae) and coralline algae on rocky seashores in New South Wales. J. Exp. Mar.Biol. Ecol. 129, 61–79.