journa l homepage: www.e lsev ier .com/ locate / jhazmat
isk assessment of dietary lead exposure among First Nations peopleiving on-reserve in Ontario, Canada using a total diet study and arobabilistic approach
manda K. Juric a, Malek Batal b, Will David c, Donald Sharp c, Harold Schwartz d,my Ing b, Karen Fediuk e, Andrew Black c, Constantine Tikhonov d, Hing Man Chan a,aurie Chan a,∗
University of Ottawa, Ottawa, CanadaUniversité de Montréal, Montreal, CanadaAssembly of First Nations, Ottawa, CanadaHealth Canada, Environmental Public Health Division, First Nations and Inuit Health Branch (FNIHB), Ottawa, CanadaDietitian and Nutrition Researcher, British Columbia, Canada
i g h l i g h t s
Lead exposure was 1.7 times higher among First Nations.Lead intake increase the risk of high blood pressure.Traditional food accounted for 73% of dietary intake.Lead containing ammunition is a major source.
r t i c l e i n f o
rticle history:eceived 25 April 2017eceived in revised form9 September 2017ccepted 21 September 2017vailable online 5 October 2017
eywords:ead
a b s t r a c t
Indigenous peoples have elevated risk of lead (Pb) exposure as hunted traditional food can be contam-inated with lead-containing ammunition. Recent scientific consensus states that there is no thresholdlevel for Pb exposure. The objective of this study was to estimate dietary exposure to Pb among FirstNations living on-reserve in the province of Ontario, Canada. A total diet study was constructed basedon a 24-h recall and Pb concentrations for traditional foods from the First Nations Food, Nutrition, andEnvironment Study (FNFNES) and Pb concentrations in market foods from Health Canada. A probabilisticassessment of annual and seasonal traditional food consumption was conducted. Results indicate thattraditional foods, particularly moose and deer meat. are the primary source of dietary Pb intake (73%),
despite providing only 1.8% of the average caloric intake. The average dietary Pb exposure (0.21 �g/kg/d)in the First Nations population in Ontario was 1.7 times higher than the dietary Pb exposure in thegeneral Canadian population. Pb intake was associated with an estimated average increase in systolicblood pressure of 1.2 mmHg. These results indicate that consumption of foods hunted with Pb containingammunition and shot puts the population at elevated risk of Pb toxicity.
Pb was widely used as an additive in common consumer itemssuch as paints and gasoline as well as in plumbing infrastructure,which resulted in elevated exposures in populations globally [1].In North America, the level of Pb in these items has been reducedor even eliminated since the 1970′s due to stringent regulations[2,3]. Despite this decline, management of Pb exposures remains a
modern health priority in North America as well as other regionsaround the world [4].
Epidemiological studies over the past 10 years have shownonclusive evidence of adverse human health effects despite declin-ng magnitudes of chronic Pb exposures in populations; this is
ost prominently observed with neurodevelopmental impairmentmong children [5–9]. In adults, the strongest weight of evidenceor adverse health effects is supported by the association betweenhronic low dose Pb exposures and coronary heart disease charac-erized by increases in systolic blood pressure, and chronic kidneyisease characterized by a reduction in the glomerular filtrationate [10–13].
In North America, diet is the predominant route of Pb expo-ure, primarily in the inorganic form [1]. In the general Canadiandult population, the average Pb intake from dietary sources was.12 �g/kg/d, as reported by the 2007 Canadian Total Diet StudyTDS) [14]. One of the limitations of TDSs is that they are a generalcreening tool and are unable to reflect the dietary exposures inopulations with unique dietary compositions, such as the Aborig-
nal people living on-reserve. In Canada, approximately 1.4 millioneople identify as Aboriginal (First Nations, Inuit, Metis), repre-enting approximately 4.3% of the Canadian population based onesults from the 2011 National Household Survey [15]. The largestroup of Aboriginal peoples in Canada are the First Nations account-ng for approximately 60% of the Aboriginal population. There arever 600 First Nation bands and communities representing over0 Nations [16]. The largest population of First Nations, compris-
ng more than 200,000 people and 21% of the total First Nationsopulation, reside in the province of Ontario, Canada [16]. About0% of First Nations peoples live on reserves [15]. The diet ofirst Nations peoples is composed of a mixture of store-boughtor market foods) and traditional foods. Traditional food systems,hich vary between Indigenous communities and are uniquely
dapted include foods obtained from “the local, natural environ-ent that are culturally acceptable” [17], which makes it distinct
rom the diet of the general Canadian population. Pb is found inany foods indirectly because of its ubiquitous nature as a pollu-
ant due to its many industrial uses and natural occurrence as aetal. In traditional foods, however, there is also the potential for
irect contamination through hunting with lead-containing shotsnd ammunition [18,19]. The assessment of dietary exposures ofb in First Nations peoples to date has focused on specific tradi-ional food items in small population samples [20–22]. Althoughraditional foods are largely unregulated from a contaminant per-pective compared to store-bought market foods, they are a keyomponent of health and connectedness in Aboriginal populationsn the levels of the individual, family, community, culture, andnvironment [23,24]. Therefore, the characterization of their con-ribution to dietary sources of Pb in First Nations populations isecessary for the development of strategic and culturally relevantisk communication. There are few comprehensive Pb exposuressessments among First Nations. Dietary Pb intake is particularlyf interest as toxicological reference values for assessing dietaryxposures have been revoked by regulatory agencies [25,26] givenhe consistent and evolving body of evidence supporting low doseffects. This has culminated in the general scientific consensus thato threshold for Pb toxicity exists [27].
The objectives of this study were to (i) characterize and quan-ify sources of Pb in the total diet of First Nations adults in Ontario;ii) assess the health risk to the population using the new non-hreshold approach; and (iii) identify the key contributing foodtems for Pb exposures. A total diet approach using results from4-h recall data was used to describe the relative contribution ofb exposure from market food, traditional food and drinking water
onsumption. A more detailed probabilistic approach using foodrequency questionnaire data was used to assess the Pb exposurerom the consumption of traditional food.
s Materials 344 (2018) 55–63
2. Method
2.1. Ethics
Ethics approvals were obtained from the Research Ethics Boardof the University of Ottawa and Health Canada.
2.2. First Nations food, nutrition and environment study(FNFNES)
Dietary patterns and contaminant concentrations in traditionalfoods were obtained through the First Nations Food, Nutrition,and Environment Study (FNFNES) Ontario region results collectedin 2011–2012 [28]. The FNFNES was designed to study the dietof First Nations adults across Canada living on-reserve south ofthe 60th parallel. A total of 18 First Nation communities fromthe province of Ontario were selected to participate based ona systematic random sampling method with probability propor-tional to the size of the community. Community selection wasdesigned to be representative of the First Nations population inthe region based on a combined ecozone/cultural area framework.In the province of Ontario, three ecozone exist: the Boreal Shield,the Hudson Plains, and the Mixedwood Plains; and two culturalareas: Northeast and Subarctic [29]. Using this framework, FirstNations communities in Ontario were stratified into four strata:Boreal Shield/Subarctic (Ecozone 1), Boreal Shield/Northeast (Eco-zone 2), Hudson Plains/Subarctic (Ecozone 3), and MixedwoodPlains/Northeast (Ecozone 4) (Fig. 1). A minimum of four communi-ties per strata, with a maximum of six were allowed. Participatinghousehold in each community were randomly selected with a tar-get response rate of 100 households per community in all but twocommunities which had larger populations and a target of 200households. At each household, one adult who met the followinginclusion criteria was invited to participate: 19 years of age or older;able to provide written informed consent; self-identified as being aFirst Nation person living on-reserve in Ontario; and whose birth-day was next among the adult members of the selected household.Participation was voluntary and a total of 1429 individuals partic-ipated [28]. All dietary exposure estimates are derived from dataobtained through random samples of communities, households andpersons. All results are adjusted with weights provided by Statisticsthat are the product of a design weight (the inverse of the selectionprobability) and of one or many adjustment factors (non-responseand other random occurrences that could induce biases in the esti-mates). These design weights and adjustment factors are specificto each stage of the sample design and to each stratum used bythe design [28]. The weighted results therefore reflect the wholepopulation of First Nations in Ontario and not merely the sampledindividuals.
All participating individuals completed a household interviewwhich included the following sections: a 24-h dietary recall; tra-ditional food frequency questionnaire (FFQ); socio/health/lifestylequestionnaire; and food security questionnaire. Interviews tookplace between mid-September and mid-December (Fall season).Interviews were conducted in person by community research assis-tants. Visual aids were used to assist participants in identifyingspecies on the FFQ and in the quantification of foods and bever-ages. For the 24 h recall, participants were asked to describe thetypes and amounts of beverages and food consumed in the previ-ous 24 h. For the FFQ, participants were asked to retrospectivelyrecall the number of days on which they consumed each food itemfor the past four seasons, which were defined as 90-day periods.
The FFQ included 143 traditional food items categorized into eightcategories based on consultation with literature and communityrepresentatives. Categories with number of food items were: fish(29), land mammals (22), wild birds (25), wild berries/nuts (27),
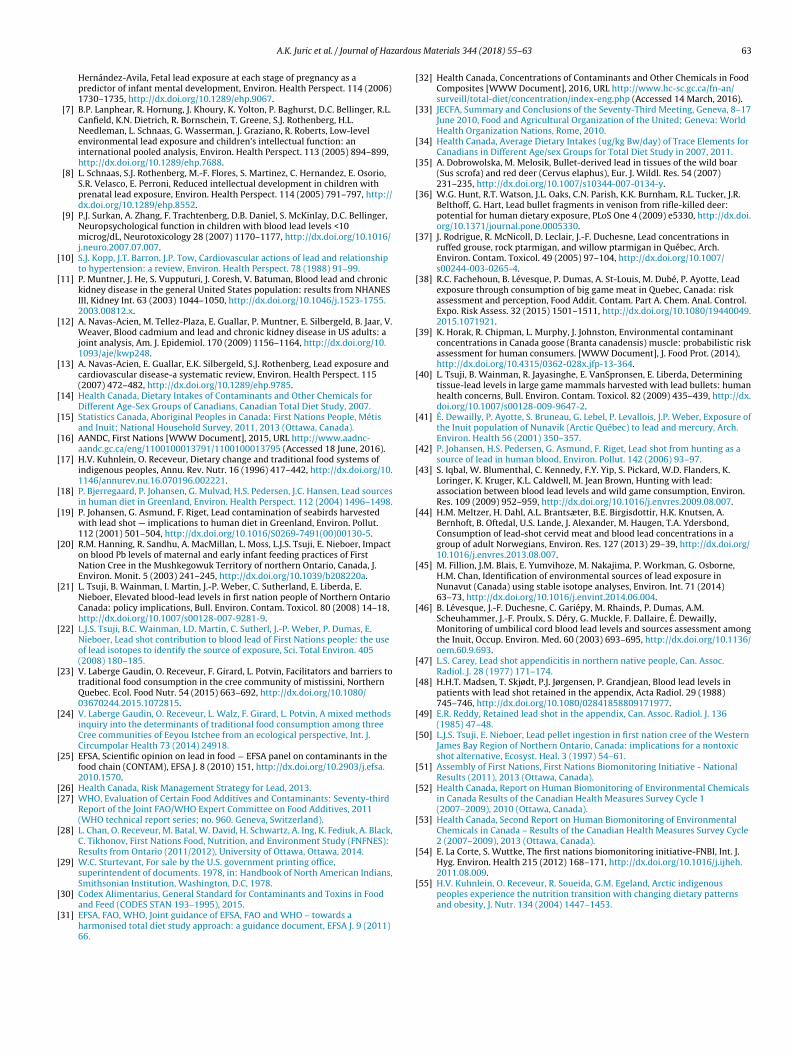
A.K. Juric et al. / Journal of Hazardous Materials 344 (2018) 55–63 57
ntario
wmfr
Fig. 1. Map of First Nations communities in O
ild plant roots, grains, shoots, and greens (29), tree foods (9), andushrooms (2). When participants recalled consuming traditional
ood items not explicitly listed in the questionnaire, open-endedesponses were recorded as “other” in the food category.
participating in the FNFNES 2011–2012 [28].
2.3. Tap water samples & analysis
In addition to the individual questionnaires, tap water sampleswere collected from a target of 20 participating households in eachcommunity through the FNFNES. Tap water samples were collected
5 ardou
aisdCat8rP
2
F(rccfp1PdhpPePa
2
e2(cctttWpibdvdwir
2
sFiew[e2t
8 A.K. Juric et al. / Journal of Haz
fter water had been run for five minutes or until the water was coldn order to flush the stagnant water out of the pipe. Prior to analy-is, water samples were filtered through a 0.45 �m pore filter andigested using nitric acid based on EPA method #200.2. Inductivelyoupled Argon Plasma Mass Spectroscopy (ICP/MS) was used tonalyse Pb concentration based on EPA method #200.8. For QA/QC,he percent recovery of certified reference material ranged from7.7–106.7%, with the percent recovery of matrix spiked samplesanging similarly from 92.3–105%. The limit of detection (LOD) forb was 0.005 �g/L.
.4. Traditional food samples & analysis
Traditional food samples were collected from participatingNFNES communities based on lists containing items that were1) commonly consumed, (2) of importance for nutrition or envi-onmental concerns, and (3) were known to accumulate higheroncentrations of contaminants. Communities provided up to 30omposite food samples, with each composite comprising tissuerom up to five replicates. A total of 419 composite food sam-les comprising a sum total of 1237 replicates and representing41 different traditional food items were analyzed for Pb content.b content was analyzed from homogenized composite samplesigested in an open vessel using a combination of nitric acid andydrogen peroxide based on EPA 200.3/6020A. Inductively cou-led plasma mass spectrometry (ICP/MS) was employed to quantifyb concentrations with a limit of detection of 0.004 �g/g. Recov-ry of certified reference material ranged between 70 and 130%.b concentrations in traditional food was compared to the CODEXlimentarius standard established by the FAO and WHO [30].
.5. Total diet study
Total diet studies are conducted to assess intakes of key nutri-nts and contaminants in a population [31]. Using data from the4-h recall survey of FNFNES, the individual intakes of recalled foodexpressed as grams per day) was multiplied by the average con-entration of Pb in that food item in the database of contaminantoncentration to determine the dietary Pb exposures. Pb concen-rations of market food were collected in 2011 and 2012 throughhe Canadian Total Diet Study by Health Canada [32]. Pb concentra-ions in traditional food items were measured as described above.
ater consumption was included in the calculation of Pb intakes aser harmonized total diet study guidance [31], with concentrations
n tap water represented by community-specific values measuredy FNFNES. Contaminant concentrations values below the limit ofetection were represented by an upper-bound approach to pro-ide conservative estimate as the limit of detection varied betweenifferent data sources. Dietary Pb intakes have been reported aseighted values to account for factors such as design weight (the
nverse of the selection probability) and adjustment factors (non-esponse rate).
.6. Risk assessment of dietary intake
In adult populations, the adverse outcome of chronic Pb expo-ure with the strongest weight of evidence as assessed by the JointAO/WHO Expert Committee on Food Additives (JECFA) was anncrease in systolic blood pressure [33]. Based on epidemiologicalvidence, JECFA concluded that a dietary exposure of 1.3 �g/kg/das associated with a 1 mmHg increase in systolic blood pressure
33]. Dietary exposures in this study were compared to this JECFAstablished level using a margin of exposure (MOE) approach ESFA,010. The MOE is the ratio between the observable effect level andhe exposure level of the studied population and MOEs less than
s Materials 344 (2018) 55–63
1 means that the studied population has in increased health riskfrom the exposure.
2.7. Traditional food probabilistic exposure assessment
A probabilistic approach was used to estimate Pb exposurefrom annual traditional food consumption. This provided a detailedassessment that reflected the variability in the types and amountsof traditional foods consumed throughout the year and the abilityto identify and prioritize patterns of exposures in this dietary com-ponent. Monte Carlo simulations were constructed in Excel 2010add-in Crystal Ball (Oracle; version 11.1.2.3). Pb intake for each iter-ation j (�g·kg−1·d−1) was modelled based on the sum of the productof the consumption of each food i (g·d−1) by Pb concentration i
(�g·g−1), divided by body weight j (Eq. (1)).
Pb Intakej(� g/kg/d) =69∑
i=1
[foodi(g/d)
]× [Pb]i(� g/g)
Body Weightj(kg)(1)
Consumption frequencies from FFQ were converted into gramsby applying age and sex specific serving size data for food groupsreported through 24-h recall responses. Daily consumption valuesin grams per day were computed by averaging intakes over a one-year period. Traditional food items were included in the simulationif consumption was reported in more than 5% of the population tolimit input parameters with negligible bearing on simulation out-puts. The total numbers of traditional food items included were 69at the regional level, 47 in Ecozone 1, 63 in Ecozone 2, 41 in Eco-zone 3, and 55 in Ecozone 4. Consumption data were parameterizedusing the custom distribution function in Crystal Ball as the sampledata were representative of the provincial and ecozone populationsof First Nations in Ontario. Input distributions of Pb concentrationsin each traditional food item was represented through FNFNES tra-ditional food composite analysis fitted to lognormal distributionsdescribed by the average, the standard deviation derived as anassumed coefficient of variation of 100%, and bounded by LOD/2 andthree standard deviations. For traditional food items with no directPb concentrations from the FNFNES samples, surrogate food itemswere selected from the data set based on trophic level and speciessimilarities. Body weight data were obtained through the FNFNESand included as an input through a custom distribution function.Simulations were constructed for the total provincial population,ecozone populations, women of child-bearing age subpopulation(n = 562), and seasonal simulations for the total provincial popula-tion. Simulations were run for 10 000 iterations with a Monte Carlosampling method.
2.8. Statistical analysis
JMP statistical software (version 12.1.0) was used to obtainsummary statistics. Output distributions did not conform toassumptions of normality prior and after a logarithmic transfor-mation. Non-parametric statistical tests were used to compareoutputs. Tests of statistical differences utilized Kruskal-Wallis test,with significance considered as p < 0.05.
3. Results
3.1. Estimate of dietary Pb exposure
Results from the total dietary study show that Ontario First
Nation had an average Pb intake of 0.21 �g/kg/day which is higherthan the average of the general Canadian population (0.12 �g/kg/d)(Table 1). Traditional food sources represent 72.7% of the aver-age Pb intake for the population, while representing only 1.8%
A.K. Juric et al. / Journal of Hazardous Materials 344 (2018) 55–63 59
Table 1Summary of Pb intake (�g/kg/d) for results of the Total Diet Study in Ontario First Nations adults living on-reserve, compared to results of the 2007 Canadian Total Diet Study.
n Mean Pb Dose(�g/kg/d)
Standard Error 50th 90th 95th 97.5th 99th
Canada Total Diet Study 2007 a 0.12Total Population Ontario 1429 0.21 0.024 0.056 0.15 1.6 2.8 5.0
f the average caloric intake (Supplementary Table A2). Based onesponses to the 24-h recall, 13% of the population reported con-uming traditional foods. Therefore, First Nations adults in Ontarioho consume traditional foods had higher Pb intakes the thoseho did not consume traditional foods on the 24-h recall (Table 1).oreover, the northern-most ecozones, ecozone 1 and ecozone
, had greater percentages of their populations (19.5% and 23.3%espectively) consuming traditional food compared to the provin-ial First Nations adult population living on-reserve (Table 1).
For the non-traditional food consumers, market foods repre-ented an average 96% of the Pb intake or 0.056 �g/kg/d (Table 2)ith the remaining 4% of the Pb intake arising from tap water con-
umption. In comparison, among adults reporting traditional foodonsumption on the 24-h recall, market foods accounted for anverage of only 3% whereas traditional foods accounted for 97%f the total Pb intake. The contribution of traditional foods to theb intake at the ecozone level ranged from 93% in ecozone 2–97% incozones 1 and 3 (northern-most ecozones). The dietary Pb intakerom traditional food sources is presented in Table 3a. Ecozone 3ad the highest average Pb intake from traditional food consump-ion; however, ecozone 1 had the widest range of Pb intakes. Theummary of estimated Pb intakes from annual traditional food con-umption, as calculated through a Monte Carlo simulation usingonsumption data from the FFQ is presented in Table 3b. Ecozone
has the highest mean Pb intakes, which is consistent with find-ngs from Pb intakes computed through a total diet study approachTable 3a). Dietary Pb intakes expressed as a daily average fromnnual traditional food consumption (Table 3b) are lower thanntakes estimated through the total diet study (Table 3a) as theatterns of traditional food consumption in the latter include lowraditional food consumers, as well as fluctuations in seasonallyvailable food items.
The top five market foods contributing to the total dietary Pbntakes accounted for 9.8% of the average total Pb intake (Table 4). Inouthern ecozones (ecozones 2 and 4), market foods were a greaterontributor to Pb intakes (16.9% and 13.3%, respectively). The top
five traditional foods contributing to the total dietary Pb intakesare presented in Table 5a. Moose and deer meat were the mainsources of Pb intakes. Table 5b presents the top five traditionalfoods based on annual traditional food consumption, and there-fore reflects seasonal availability, unlike Table 5a which was basedon a 24-h recall conducted in the fall season. Despite the temporaldifferences, moose and deer meat remain the leading traditionalfoods contributing to the Pb dose which suggests both methodscapture similar leading sources of dietary Pb.
Pb concentrations in five of the commonly consumed traditionalfood items were compared to Codex alimentarius guidance on themaximum level of Pb in the meat of cattle, pig, sheep and poultry(without bones) (Table 6). The Codex threshold (0.1 ug/g) for Pbwas exceeded the in 24% to 63% of composite samples of these fooditems (moose and mallard, respectively).
3.2. Risk assessment of total dietary Pb exposure (Total diet study)
The calculated mean (0.21 �g/kg/d) and 95th percentile intakes(1.6 �g/kg/d) were below the previous PTWI from Health Canada(25 �g/kg/wk) for total dietary Pb exposure at the province, aswell as for the ecozone level. In light of this reference dosebeing reviewed, we used an alternative margin of exposure (MOE)approach which is proposed by the European Food Safety Authority(EFSA) CONTAM panel for risk characterization of dietary Pb expo-sures [25]. Pb exposures from the total diet study were comparedto the exposure level (1.3 �g/kg/d) associated with an increase of1 mmHg in the systolic blood pressure in adults as defined by JECFA[33]. Based on the total diet, the 95th percentile of the provin-cial population as well as in ecozones 1 and 3 showed a MOE ofless than 1 (Table 7). However, the population subgroups of indi-viduals who reported no consumption of traditional food in the
past 24 h showed a 20 times reduction in risk (with MOE higherthan 1) compared to the population who reported traditional foodconsumption. This trend remains at the upper percentiles of thePb intake, as the margin of exposure was greater than 10 for the
60 A.K. Juric et al. / Journal of Hazardous Materials 344 (2018) 55–63
Table 3aSummary of Pb intakes (�g/kg/d) from traditional food sources in traditional food consumers using data from the 24-h recall (n = 190).
Table 3bSummary of Pb intakes (�g/kg/d) from traditional food consumption using Food Frequency Questionnaire and simulated through a Monte Carlo Simulation. (n = 10,000iterations).
Table 4Top 5 market foods contributing to the total Pb intake with mean intake (ug/kg/d),standard error (SE), and the percent contribution to the total Pb intake.
Table 5aTop 5 traditional foods with mean Pb intake (�g/kg/d), standard error (SE), and thepercent contribution of the total dietary Pb intake based on the Total Diet Study.
5th percentile, with exposures at less than 10% of the exposureuidance value. In the subpopulation reporting traditional foodonsumption in the past 24 h, all regions except ecozone 2 had a
argin of exposure less than 1 between the mean total dietary Pb
ose and the exposure value, suggesting an elevated risk. For therovince as a whole, the Pb intake was associated with an esti-ated average increase in systolic blood pressure of 1.2 mmHg,
and up to 2 mmHg for ecozone 3. At the 95th percentile of thesubpopulation reporting traditional food consumption in the past24 h, the total dietary Pb intake corresponded to an estimated
4.22 mmHg increase in systolic blood pressure for the population,with a regional range up to an increase of 8.9 mmHg in ecozone 4.
A.K. Juric et al. / Journal of Hazardou
Table 5bTop five traditional foods with mean Pb intake (�g/kg/d), standard error (SE), andmean consumption (g/d) based on annual traditional food consumption as reportedin the FFQ and modelled with Monte Carlo Simulation.
To assess trends in Pb intake as a function of seasonal traditionalood consumption, inputs for the consumption distributions inhe simulation were represented by seasonal average (fall, winter,pring, summer). Since seasonality influences the species availabil-ty, a moderate trend coinciding with peak hunting seasons wasxpected. Elevated Pb intakes were observed in the fall and win-er seasons for the population, and at all ecozones except ecozone
which had Pb intake peaks during the fall and spring/summerhich is reflective of a fall game hunt and a spring bird hunt.
easonal differences were statistically significant for each ecozoneSupplementary Table A3). Simulations for women of childbearingge resulted in slight, but significantly (p < 0.0001) lower mean Pbntake at the provincial level, as well as in ecozones 1 and 3 withifferences of 0.027, 0.063, 0.102 �g/kg/d, respectively.
. Discussion
Previous studies have observed terrestrial game, waterfowl, andirds hunted with lead-containing ammunition to have elevatedb concentrations in homogenized tissue samples due to fragmen-ation of bullets and shots [35,36,19,37]. Concentration of Pb in
oose, deer, and goose hunted with non-lead shot and ammunitionave been previously documented to have background Pb concen-rations below the Codex maximum contaminant level [38–40].n water fowl, the background concentration of Pb is difficult to
s Materials 344 (2018) 55–63 61
discern due to the potential ingestion of legacy and stray lead-containing shots that may become a source of internal exposureto elevated tissue Pb concentrations. The elevated Pb concentra-tions observed in mallard samples in this study may be the resultof internal distribution from such sources.
Results from the probabilistic assessments are in agreementwith the conclusion of the total diet assessment in that the upperpercentiles of the population distribution are at risk of adverseeffect when traditional foods which may be harvested by a mix ofhunting method (i.e. different types of ammunition, traps etc.) areconsumed. Previous studies in Indigenous populations corroboratethe conclusion that foods hunted with lead-containing ammuni-tion and shot elevates blood Pb values, especially consumption ofbirds and waterfowl [18,41,42]. The consumption of game meats,primarily deer and moose, hunted with lead-containing shots havealso been associated with increased blood Pb concentrations in gen-eral hunting populations [43,44]. In comparison to blood Pb levelsin southern urban population, previous studies have indicated thesources of Pb in the Inuit and First Nations populations to be pre-dominantly from lead-containing hunting shots and ammunitionbased on the analysis of isotopic ratios [45,20,46,22].
The risks of Pb exposure from dietary items may be under-estimated; since lead-containing shots and ammunition can beunintentionally ingested as whole pellets, and they may become aninternal source of Pb exposure if lodged in the gastrointestinal tractor appendix [47–50]. A study of Northern Ontario First Nations sug-gested approximately 15% of individuals have ingested lead shotslodged in abdominal regions based on a review of abdominal x-rays[50]. Despite these considerations, national biomonitoring resultsfrom the 2011 First Nations Biomonitoring Initiative (FNBI) indi-cate blood Pb values in First Nations to be significantly lower thanthe general Canadian population assessed in Cycle 1 (2007–2009)of the CHMS [51,52]. However, in comparison to CHMS Cycle 2(2009–2011) results, FNBI blood Pb levels appear to be in closeragreement with the Canadian population average although thesignificance of the trend is unknown and warrants further investi-gation [53]. Limitations in the FNBI include limited assessmentsof lifestyle or dietary parameters relevant to Pb exposures andtherefore limited profiling and insights on the traditional foodconsumption of participants can be concluded [54]. Future assess-ments should be conducted on the living, recreational and workingenvironments to provide detailed context on Pb exposures in thispopulation.
Based on the total diet study results, traditional foods are theprimary dietary contributor to Pb intakes in the First Nationspopulation in Ontario. Compared to dietary Pb exposure of thegeneral Canadian population [34], the provincial First Nations pop-ulation has an average dietary Pb exposure 1.7 times greater.However, in First Nations individuals with no reported traditionalfood consumption in the past 24-h, the total dietary Pb intake isapproximately half the Canadian average, whereas for traditionalfood consumers, the total dietary Pb intake is more than 7 timesgreater than the Canadian average. Similar patterns were observedwith mean Pb intakes generated by the probabilistic assessmentwhere levels were similar to the Canadian average in ecozone4, but elevated between 1.5–2 times in the total province andecozone 3, respectively (Table 3b). This is reflective of higher tradi-tional food consumption in northern ecozones, whereas southernecozones consume less traditional foods. The consumption of dif-ferent types of traditional food items (i.e. game vs. bird vs. fish)has been hypothesized to be closely correlated complicating theidentification of key contributing sources to the blood Pb burden in
subsistence populations. Across the province of Ontario, this studyfound a strong correlation between the consumptions of moose andCanadian goose (� = 0.6421, p < 0.0001). In regional ecozones, thiscorrelation was strongly observed only in ecozone 1, (� = 0.6485,
62 A.K. Juric et al. / Journal of Hazardous Materials 344 (2018) 55–63
Table 6Concentrations of Pb with ranges in five common food items consumed across the province.
<Codex Threshold b >Codex Threshold c
n (replicates) n (composites) Mean (SD)a ug/g GM Range ug/g Mean (SD) a ug/g % of n Mean (SD) a ug/g % of n
Table 7Summary of Margin of Exposures (MOE) between total Pb dietary intakes (from 24-h recall) and the exposure level of 1.3 �g/kg/d associated with an increase of 1 mmHg inthe systolic blood pressure in adults as defined by JECFA. MOEs less than 1 indicate elevated exposure risk, and have been bolded.
< 0.0001). However, the inclusion of correlation coefficients fortrongly correlated variables in the Monte Carlo simulation did notignificantly change the output distribution of total Pb intake, andherefore were not included.
Despite contributing to the Pb intake, traditional foods are anmportant determinant of health among First Nations peoples. TheNFNES regional analysis indicated the quality of the total dietmproves in terms of essential nutrient intake and a reduction inaturated fats, sugars, and sodium on days when traditional foodsre consumed [28], consistent with findings from previous stud-es in Canadian Indigenous populations [55]. Moreover, despite thenown relationship between blood lead concentrations and healthutcomes, population studies on dietary lead exposure and healthutcomes are limited. Risk managers need to conduct detailed risk-enefit assessment of associated with individual traditional foodnd estimate the net effect on the health of the populations beforessuing any dietary advice.
. Conclusion
This study comprehensively quantifies the dietary Pb exposuresn First Nations adults living on-reserve in Ontario for the first timen a total diet context as well as more detailed characterization ofnnual traditional food consumption patterns. Results indicate theariability in Pb concentration in traditional food items to be theost sensitive input and predictor of risk. Given the range of Pb con-
entrations in traditional foods beyond previously characterizedackground levels, it is presumed that a diet which occasionally
ncludes foods hunted with lead-containing ammunition and shot
uts the population at elevated risk of Pb toxicity. Future studies onietary Pb exposures in this population should include an assess-ent of the hunting method as well as blood Pb concentrations,
nd economic and social implications of a lead shot policy.
24 13 11 9.3 7.227 15 13 11 8.725 13 11 8.1 6.5
Acknowledgements
We would like to express our gratitude to all participantsfor their cooperation and participation in the First Nations Food,Nutrition and Environment Study (FNFNES). We thank all FirstNations community members who collected food and water sam-ples, assisted in data collection, coordinated research activities,and arranged meetings and public gathering to share informa-tion. FNFNES is funded by Health Canada and the communicationof the results to the communities was also funded by the Cana-dian Institute of Health Research. A.K. Juric was supported by aNSERC-CREATE Research in Environmental Analytical Chemistryand Toxicology scholarship. H.M. Chan is supported by the CanadaResearch Chair Program. The authors have no potential conflicts ofinterest.
Appendix A. Supplementary data
Supplementary data associated with this article can be found,in the online version, at https://doi.org/10.1016/j.jhazmat.2017.09.035.
References
[1] ATSDR, Toxicological Profile for Lead, 2007.[2] J.O. Nriagu, The rise and fall of leaded gasoline, Sci. Total Environ. 92 (1990)
13–28, http://dx.doi.org/10.1016/0048-9697(90)90318-O.[3] V.M. Thomas, R.H. Socolow, J.J. Fanelli, T.G. Spiro, Effects of reducing lead in
gasoline: an analysis of the international experience, Environ. Sci. Technol. 33(1999) 3942–3948, http://dx.doi.org/10.1021/es990231+.
[4] WHO, Exposure to Lead: A Major Public Health Concern, 2010 (Geneva,Switzerland).
Lanphear, Intellectual impairment in children with blood lead concentrationsbelow 10 microg per deciliter, N. Engl. J. Med. 348 (2003) 1517–1526, http://dx.doi.org/10.1056/NEJMoa022848.
[6] H. Hu, M.M. Téllez-Rojo, D. Bellinger, D. Smith, A.S. Ettinger, H.Lamadrid-Figueroa, J. Schwartz, L. Schnaas, A. Mercado-García, M.
[Hyg. Environ. Health 215 (2012) 168–171, http://dx.doi.org/10.1016/j.ijheh.2011.08.009.
[55] H.V. Kuhnlein, O. Receveur, R. Soueida, G.M. Egeland, Arctic indigenous
A.K. Juric et al. / Journal of Haz
Hernández-Avila, Fetal lead exposure at each stage of pregnancy as apredictor of infant mental development, Environ. Health Perspect. 114 (2006)1730–1735, http://dx.doi.org/10.1289/ehp.9067.
[7] B.P. Lanphear, R. Hornung, J. Khoury, K. Yolton, P. Baghurst, D.C. Bellinger, R.L.Canfield, K.N. Dietrich, R. Bornschein, T. Greene, S.J. Rothenberg, H.L.Needleman, L. Schnaas, G. Wasserman, J. Graziano, R. Roberts, Low-levelenvironmental lead exposure and children’s intellectual function: aninternational pooled analysis, Environ. Health Perspect. 113 (2005) 894–899,http://dx.doi.org/10.1289/ehp.7688.
[8] L. Schnaas, S.J. Rothenberg, M.-F. Flores, S. Martinez, C. Hernandez, E. Osorio,S.R. Velasco, E. Perroni, Reduced intellectual development in children withprenatal lead exposure, Environ. Health Perspect. 114 (2005) 791–797, http://dx.doi.org/10.1289/ehp.8552.
[9] P.J. Surkan, A. Zhang, F. Trachtenberg, D.B. Daniel, S. McKinlay, D.C. Bellinger,Neuropsychological function in children with blood lead levels <10microg/dL, Neurotoxicology 28 (2007) 1170–1177, http://dx.doi.org/10.1016/j.neuro.2007.07.007.
10] S.J. Kopp, J.T. Barron, J.P. Tow, Cardiovascular actions of lead and relationshipto hypertension: a review, Environ. Health Perspect. 78 (1988) 91–99.
11] P. Muntner, J. He, S. Vupputuri, J. Coresh, V. Batuman, Blood lead and chronickidney disease in the general United States population: results from NHANESIII, Kidney Int. 63 (2003) 1044–1050, http://dx.doi.org/10.1046/j.1523-1755.2003.00812.x.
12] A. Navas-Acien, M. Tellez-Plaza, E. Guallar, P. Muntner, E. Silbergeld, B. Jaar, V.Weaver, Blood cadmium and lead and chronic kidney disease in US adults: ajoint analysis, Am. J. Epidemiol. 170 (2009) 1156–1164, http://dx.doi.org/10.1093/aje/kwp248.
13] A. Navas-Acien, E. Guallar, E.K. Silbergeld, S.J. Rothenberg, Lead exposure andcardiovascular disease-a systematic review, Environ. Health Perspect. 115(2007) 472–482, http://dx.doi.org/10.1289/ehp.9785.
14] Health Canada, Dietary Intakes of Contaminants and Other Chemicals forDifferent Age-Sex Groups of Canadians, Canadian Total Diet Study, 2007.
15] Statistics Canada, Aboriginal Peoples in Canada: First Nations People, Métisand Inuit; National Household Survey, 2011, 2013 (Ottawa, Canada).
17] H.V. Kuhnlein, O. Receveur, Dietary change and traditional food systems ofindigenous peoples, Annu. Rev. Nutr. 16 (1996) 417–442, http://dx.doi.org/10.1146/annurev.nu.16.070196.002221.
18] P. Bjerregaard, P. Johansen, G. Mulvad, H.S. Pedersen, J.C. Hansen, Lead sourcesin human diet in Greenland, Environ. Health Perspect. 112 (2004) 1496–1498.
19] P. Johansen, G. Asmund, F. Riget, Lead contamination of seabirds harvestedwith lead shot — implications to human diet in Greenland, Environ. Pollut.112 (2001) 501–504, http://dx.doi.org/10.1016/S0269-7491(00)00130-5.
20] R.M. Hanning, R. Sandhu, A. MacMillan, L. Moss, L.J.S. Tsuji, E. Nieboer, Impacton blood Pb levels of maternal and early infant feeding practices of FirstNation Cree in the Mushkegowuk Territory of northern Ontario, Canada, J.Environ. Monit. 5 (2003) 241–245, http://dx.doi.org/10.1039/b208220a.
21] L. Tsuji, B. Wainman, I. Martin, J.-P. Weber, C. Sutherland, E. Liberda, E.Nieboer, Elevated blood-lead levels in first nation people of Northern OntarioCanada: policy implications, Bull. Environ. Contam. Toxicol. 80 (2008) 14–18,http://dx.doi.org/10.1007/s00128-007-9281-9.
22] L.J.S. Tsuji, B.C. Wainman, I.D. Martin, C. Sutherl, J.-P. Weber, P. Dumas, E.Nieboer, Lead shot contribution to blood lead of First Nations people: the useof lead isotopes to identify the source of exposure, Sci. Total Environ. 405(2008) 180–185.
23] V. Laberge Gaudin, O. Receveur, F. Girard, L. Potvin, Facilitators and barriers totraditional food consumption in the cree community of mistissini, NorthernQuebec. Ecol. Food Nutr. 54 (2015) 663–692, http://dx.doi.org/10.1080/03670244.2015.1072815.
24] V. Laberge Gaudin, O. Receveur, L. Walz, F. Girard, L. Potvin, A mixed methodsinquiry into the determinants of traditional food consumption among threeCree communities of Eeyou Istchee from an ecological perspective, Int. J.Circumpolar Health 73 (2014) 24918.
25] EFSA, Scientific opinion on lead in food − EFSA panel on contaminants in thefood chain (CONTAM), EFSA J. 8 (2010) 151, http://dx.doi.org/10.2903/j.efsa.2010.1570.
26] Health Canada, Risk Management Strategy for Lead, 2013.27] WHO, Evaluation of Certain Food Additives and Contaminants: Seventy-third
Report of the Joint FAO/WHO Expert Committee on Food Additives, 2011(WHO technical report series; no. 960. Geneva, Switzerland).
28] L. Chan, O. Receveur, M. Batal, W. David, H. Schwartz, A. Ing, K. Fediuk, A. Black,C. Tikhonov, First Nations Food, Nutrition, and Environment Study (FNFNES):Results from Ontario (2011/2012), University of Ottawa, Ottawa, 2014.
29] W.C. Sturtevant, For sale by the U.S. government printing office,superintendent of documents. 1978, in: Handbook of North American Indians,Smithsonian Institution, Washington, D.C, 1978.
30] Codex Alimentarius, General Standard for Contaminants and Toxins in Foodand Feed (CODES STAN 193–1995), 2015.
31] EFSA, FAO, WHO, Joint guidance of EFSA, FAO and WHO – towards aharmonised total diet study approach: a guidance document, EFSA J. 9 (2011)66.
s Materials 344 (2018) 55–63 63
32] Health Canada, Concentrations of Contaminants and Other Chemicals in FoodComposites [WWW Document], 2016, URL http://www.hc-sc.gc.ca/fn-an/surveill/total-diet/concentration/index-eng.php (Accessed 14 March, 2016).
33] JECFA, Summary and Conclusions of the Seventy-Third Meeting, Geneva, 8–17June 2010, Food and Agricultural Organization of the United; Geneva: WorldHealth Organization Nations, Rome, 2010.
34] Health Canada, Average Dietary Intakes (ug/kg Bw/day) of Trace Elements forCanadians in Different Age/sex Groups for Total Diet Study in 2007, 2011.
35] A. Dobrowolska, M. Melosik, Bullet-derived lead in tissues of the wild boar(Sus scrofa) and red deer (Cervus elaphus), Eur. J. Wildl. Res. 54 (2007)231–235, http://dx.doi.org/10.1007/s10344-007-0134-y.
36] W.G. Hunt, R.T. Watson, J.L. Oaks, C.N. Parish, K.K. Burnham, R.L. Tucker, J.R.Belthoff, G. Hart, Lead bullet fragments in venison from rifle-killed deer:potential for human dietary exposure, PLoS One 4 (2009) e5330, http://dx.doi.org/10.1371/journal.pone.0005330.
37] J. Rodrigue, R. McNicoll, D. Leclair, J.-F. Duchesne, Lead concentrations inruffed grouse, rock ptarmigan, and willow ptarmigan in Québec, Arch.Environ. Contam. Toxicol. 49 (2005) 97–104, http://dx.doi.org/10.1007/s00244-003-0265-4.
38] R.C. Fachehoun, B. Lévesque, P. Dumas, A. St-Louis, M. Dubé, P. Ayotte, Leadexposure through consumption of big game meat in Quebec, Canada: riskassessment and perception, Food Addit. Contam. Part A. Chem. Anal. Control.Expo. Risk Assess. 32 (2015) 1501–1511, http://dx.doi.org/10.1080/19440049.2015.1071921.
39] K. Horak, R. Chipman, L. Murphy, J. Johnston, Environmental contaminantconcentrations in Canada goose (Branta canadensis) muscle: probabilistic riskassessment for human consumers. [WWW Document], J. Food Prot. (2014),http://dx.doi.org/10.4315/0362-028x.jfp-13-364.
40] L. Tsuji, B. Wainman, R. Jayasinghe, E. VanSpronsen, E. Liberda, Determiningtissue-lead levels in large game mammals harvested with lead bullets: humanhealth concerns, Bull. Environ. Contam. Toxicol. 82 (2009) 435–439, http://dx.doi.org/10.1007/s00128-009-9647-2.
41] É. Dewailly, P. Ayotte, S. Bruneau, G. Lebel, P. Levallois, J.P. Weber, Exposure ofthe Inuit population of Nunavik (Arctic Québec) to lead and mercury, Arch.Environ. Health 56 (2001) 350–357.
42] P. Johansen, H.S. Pedersen, G. Asmund, F. Riget, Lead shot from hunting as asource of lead in human blood, Environ. Pollut. 142 (2006) 93–97.
43] S. Iqbal, W. Blumenthal, C. Kennedy, F.Y. Yip, S. Pickard, W.D. Flanders, K.Loringer, K. Kruger, K.L. Caldwell, M. Jean Brown, Hunting with lead:association between blood lead levels and wild game consumption, Environ.Res. 109 (2009) 952–959, http://dx.doi.org/10.1016/j.envres.2009.08.007.
44] H.M. Meltzer, H. Dahl, A.L. Brantsæter, B.E. Birgisdottir, H.K. Knutsen, A.Bernhoft, B. Oftedal, U.S. Lande, J. Alexander, M. Haugen, T.A. Ydersbond,Consumption of lead-shot cervid meat and blood lead concentrations in agroup of adult Norwegians, Environ. Res. 127 (2013) 29–39, http://dx.doi.org/10.1016/j.envres.2013.08.007.
45] M. Fillion, J.M. Blais, E. Yumvihoze, M. Nakajima, P. Workman, G. Osborne,H.M. Chan, Identification of environmental sources of lead exposure inNunavut (Canada) using stable isotope analyses, Environ. Int. 71 (2014)63–73, http://dx.doi.org/10.1016/j.envint.2014.06.004.
46] B. Lévesque, J.-F. Duchesne, C. Gariépy, M. Rhainds, P. Dumas, A.M.Scheuhammer, J.-F. Proulx, S. Déry, G. Muckle, F. Dallaire, É. Dewailly,Monitoring of umbilical cord blood lead levels and sources assessment amongthe Inuit, Occup. Environ. Med. 60 (2003) 693–695, http://dx.doi.org/10.1136/oem.60.9.693.
47] L.S. Carey, Lead shot appendicitis in northern native people, Can. Assoc.Radiol. J. 28 (1977) 171–174.
48] H.H.T. Madsen, T. Skjødt, P.J. Jørgensen, P. Grandjean, Blood lead levels inpatients with lead shot retained in the appendix, Acta Radiol. 29 (1988)745–746, http://dx.doi.org/10.1080/02841858809171977.
49] E.R. Reddy, Retained lead shot in the appendix, Can. Assoc. Radiol. J. 136(1985) 47–48.
50] L.J.S. Tsuji, E. Nieboer, Lead pellet ingestion in first nation cree of the WesternJames Bay Region of Northern Ontario, Canada: implications for a nontoxicshot alternative, Ecosyst. Heal. 3 (1997) 54–61.
51] Assembly of First Nations, First Nations Biomonitoring Initiative - NationalResults (2011), 2013 (Ottawa, Canada).
52] Health Canada, Report on Human Biomonitoring of Environmental Chemicalsin Canada Results of the Canadian Health Measures Survey Cycle 1(2007–2009), 2010 (Ottawa, Canada).
53] Health Canada, Second Report on Human Biomonitoring of EnvironmentalChemicals in Canada – Results of the Canadian Health Measures Survey Cycle2 (2007–2009), 2013 (Ottawa, Canada).
54] E. La Corte, S. Wuttke, The first nations biomonitoring initiative-FNBI, Int. J.
peoples experience the nutrition transition with changing dietary patternsand obesity, J. Nutr. 134 (2004) 1447–1453.