Multidisciplinary study with quantitative analysis of isotopic datafor the assessment of recharge and functioning of volcanic aquifers:Case of Bromo-Tengger volcano, IndonesiaAlix Touliera,*, Benjamin Bauda, Véronique de Montetya, Patrick Lachassagned,Véronique Leonardia, Séverin Pistrea, Jean-Marie Dautriab, Heru Hendrayanac,M. Haris Miftakhul Fajarc, Azwar Satrya Muhammade, Olivier Beond, Hervé Jourdea
aHSM, Univ Montpellier, CNRS, IRD, Montpellier, FrancebGéosciences Montpellier, Univ Montpellier, CNRS, Montpellier, FrancecUniversitas Gadjah Mada, Geological Engineering Department, Yogyakarta, IndonesiadWater Institute by Evian, Water Resources and Sustainability Division, Danone Waters, Evian-les-Bains, FranceeDanone Aqua group, Department of Water Resources, Jakarta, Indonesia
Study region: The Bromo-Tengger volcanic aquifer system, (East Java, Indonesia).Study focus: Andesitic volcanic aquifers in Indonesia are an important source of groundwatersupply for the population. The artesian flow from high discharge springs facilitates the access forirrigation and drinking water but continuously flowing artesian wells exert an increasing pressureon the groundwater resource. Given the complexity of the volcanic edifice, a multidisciplinaryapproach including geological, hydrometeorological, hydrochemical and isotopic measurementswas performed to characterise the hydrogeological functioning of the volcano’s northern flank.New hydrogeological insights for the region: Two main hydrogeological systems are identified: asystem with perched aquifers in the lava flows and pyroclastic complex, supplying low dischargesprings or infiltrating to a deep flow system. The latter system is unconfined and providesgroundwater to the downstream plain that hosts a confined multi-layer volcano-sedimentaryaquifer. The joint implementation of a quantitative isotopic approach and a groundwaterbudget allows characterising aquifer recharge along the whole volcano flank. It is mainly con-trolled by the rainfall distribution that peaks around 1200 m elevation. The caldera basin on thetop of the volcano has a very limited contribution to recharge. A conceptual hydrogeologicalmodel is proposed and compared to the main concepts of volcanic islands. This study is a firststep for further scientific and management discussions to implement protection policies on theBromo-Tengger aquifer system.
1. Introduction
Worldwide, insular volcanic aquifers are a serious asset for drinking water supply. In such environments, due to the growth ofwater needs, surface water resources are no longer sufficient, particularly during the dry season. In many cases, groundwater becomesan alternative resource to provide drinking water, such as on Hawaii in the Pacific ocean (Whittier et al., 2010), Jeju Island in Korea
https://doi.org/10.1016/j.ejrh.2019.100634Received 13 April 2019; Received in revised form 9 October 2019; Accepted 11 October 2019
(Hamm et al., 2005), Martinique Island in the Caribbean Sea (Vittecoq et al., 2015) or the Canary Islands in the Atlantic ocean(Izquierdo, 2014).
The Indonesian Archipelago is located on the ring of fire (Pambudi, 2018) which is an area of intense seismic and volcanic activityincluding 400 andesitic volcanoes, of which about 70 are still active. Some of them are known for the emission of the most majorPlinian eruptions already having upset global climate, such as the Mont Samalas (Guillet et al., 2017). In this region, volcanoesrepresent a concentration of significant hazards and natural livelihood for the population. The Mount Bromo-Tengger in the Easternpart of the Java island is one of the most visited andesitic volcanoes in the world (Bromo-Tengger Semeru national park, FAO 1982;Cochrane, 2006). More than a profitable touristic spot, the massif also provides a unique drinking water resource to the localpopulation through groundwater.
Several volcanic springs discharging more than 1000 L s−1 are known at the feet of the volcano and are used for irrigation and thepopulation needs, since centuries to millennials. In particular, they partly supply the second biggest city of Indonesia (Surabaya;about 4 million inhabitants, 80 km north of the volcano) and other cities surrounding the volcano such as Probolinggo (east) andMalang (west). They also totally supply the city of Pasuruan (north). The artesian spring of Umbulan is the most important spring ofthe area, with a current discharge of about 3500 L s−1.
During the last few decades, and mainly since the 80′, hundreds of wells were drilled at the feet of the volcano, particularly forpaddy fields irrigation. These continuously flowing artesian wells, with a discharge often higher than 15 L s−1, modify the hydro-geological functioning of the aquifer, as highlighted by the significant decrease of the major springs’ discharge. The knowledge of thestructure, functioning and water budget of the whole hydrogeological system in this area is thus required to ensure the sustainablequantitative management of the aquifer and also to preserve groundwater quality.
The andesitic-type volcanism hydrogeology is much less studied than the basaltic one, and there is a need for the development ofhydrogeological conceptual models. Two majors distinctions have been proposed in the literature to describe basaltic-type volcanismhydrogeological systems at the volcano/island scale: (1) the Hawaiian model and (2) the Canary Island model. The Hawaiian modeldescribes a low-lying, basal aquifer with high-level water bodies perched on low permeability layers and impounded by dikes(Ingebritsen and Scholl, 1993). The Canary model describes a continuous aquifer that domes steeply inland, to high elevation, over alow permeability volcanic core (Custodio, 2007; Hemmings et al., 2015b). However, there is now a consensus on considering onlyone single conceptual model with differences depending on local circumstances and the effects of the volcanic deposits succession,erosion and reshaping due to major landslides (Custodio, Com. Pers., Custodio, 2007; Herrera and Custodio, 2008). This singleconceptual model considers only one main stratified and heterogeneous groundwater body through a combination of a central lowpermeability volcanic core with a dyke-intrusion network, a more permeable cover and a skirt (or apron) of very transmissivematerials in periphery (Custodio, Com. Pers., Custodio et al., 2016; Marrero-Diaz et al., 2015).
Some andesitic geological environments, such as pyroclastic formations, have locally been studied, e.g. Charlier et al. (2011) inthe Caribbean or Selles et al. (2015) in Indonesia. However, the hydrogeological functioning of andesitic volcanoes, or compositeshield volcanoes such as the Bromo-Tengger, are poorly known. Moreover, the proposed case study can also be considered as anexample of the hydrological responses to changing conditions, due to anthropogenic forcings.
There is a real lack of knowledge regarding the hydrogeology of the Bromo-Tengger volcano. Previous studies mostly focused onthe volcanology and seismics of the Mount Bromo and its caldera, and some others on the geological architecture of the volcanicedifice (Aiuppa et al., 2015; Bachri et al., 2015; Bani et al., 2013; Gottschämmer and Surono, 2000; Mulyadi, 1992; Van Gerven andPichler, 1995; Zaennudin et al., 1994). The main aim of this study is thus to identify the structure and hydrogeological functioning ofthe northern flank of the Bromo-Tengger volcanic edifice. As required for a correct characterization of such complex hydrosystems, apluridisciplinary approach see for instance (Dewandel et al., 2017; Maréchal et al., 2014; Pryet et al., 2012a, 2012b) has beenimplemented. Geological, hydroclimatic, hydrochemical and isotopic investigations allow the construction of a robust conceptualmodel of the Bromo Tengger volcano. In addition, it is also important to adapt existing methodologies, such as isotope hydrology, andto reinforce their robustness into this specific context of humid tropical climate with a wide range of elevations.
The present work is structured as follows. After this Introduction (Section 1), the study area is presented in Section 2. Section 3details the methodology which combines geological surveys, the implementation of a hydro-climatologic monitoring network, hy-drochemistry and isotopes analyses. Section 4 focus on the results and interpretations of the gathered data for a better understandingof groundwater circulation. Section 5 is devoted to a discussion about the interest of a quantitative isotopic modelling coupled with ahydrological water balance to identify the recharge area of the multilayer aquifer located at the basis of this andesitic volcano and tothe set-up of its conceptual hydrogeological model.
2. Study area
The study area (Fig. 1) is approximately 1300 km², and covers the northern flank of the Bromo-Tengger volcano including thehighest caldera (Tengger caldera), and the coastal plain of Pasuruan city. While only few springs exist in the southern part of thevolcano, the northern part is of great hydrogeological interest due to the numerous high discharge water points (groundwateroutflows) known in that area.
2.1. Geology
The Bromo-Tengger (BT) mountain is one of the many volcanic edifices in the eastern part of the Java island, Indonesia (Fig. 1 a).It is a complex andesitic stratovolcano comprising, in its actual caldera, several cones such as the last active Mount Bromo (Fig. 1 b).
A. Toulier, et al. Journal of Hydrology: Regional Studies 26 (2019) 100634
2
The Bromo-Tengger is located in the Bromo-Tengger-Semeru national park and culminates at about 2700 m above sea level (m.a.s.l.).The inner caldera floor is at about 2100 m.a.s.l.
This volcanic massif began to grow about 1.4 million years ago as a result of the northwards subduction of the Indo-Australianplate beneath the Eurasian plate. This volcano is located in the back arc basin of the Sunda arc (Hamilton, 1988). The differenteruptions of the Tengger are mainly classified as VEI 2 as regards the Volcanic Explosivity Index defined by Newhall and Self (1982),that comprises 8 classes. Over time, they produced a succession of a huge accumulation of lava flows and subordinate pyroclasticdeposits which constitute the framework of the composite Bromo-Tengger volcano (Thouret, 1999). The recent collapse of themagmatic chamber created a large caldera, 16 km in diameter, with a large collapse in its North-East edge (Sapikerep valley).Widespread ash fall deposits covering the upper flanks of the Tengger are related to phreatomagmatic activity from the intra-calderacomplex (Mulyadi, 1992). Erosion by streams forms numerous canyons with very steep slopes which extend radially from the calderaand the volcano slopes to the piedmont areas.
The peripheral zones of the volcano structure, and particularly the Pasuruan north plain, are constituted by volcano-sedimentarydeposits (Quaternary in age) such as observed around most big stratovolcano volcanoes in Indonesia (Selles et al., 2015). Thethickness of this filling is more than 300 m according to the stratigraphy proposed for the Lusi mud volcano (Mazzini et al., 2017)
Fig. 1. a Relief map of the North-Eastern part of the Java Island (USGS SRTM30 dataset) with the location of the studied artesian springs, amongwhich Umbulan, and the main volcanoes active vents. The major active faults systems (Watukosek and Pasuruan) and the meteorological stationsfrom BMKG are indicated, and completed by the satellite data provided by the Tropical Rainfall Measuring Mission (TRMM) (3b42v7; Zone:25 x 25 km). b The Tengger caldera, seen from Mt Penanjakan at 2700masl. Mt Bromo still active on the left. c South-North view of the Umbulanartesian spring with the new adduction pipe that supplies the Surabaya city with drinking water (drone view). The main spring outflow is located inthe southern part of the basin in the catchwork visible on the photo.
A. Toulier, et al. Journal of Hydrology: Regional Studies 26 (2019) 100634
3
located about 40 km North from the Pasuruan plain (Fig. 1a).This volcano-sedimentary series exhibits a South-North graded bedding. It comprises all the transition terms between proximal
volcanic series, such as lava flows, pyroclastic falls and flows, lahars, reworked volcanic formations and more distal volcano-sedi-mentary deposits that are progressively more clayey towards the North. Fine clayey sediments constitute the first tens of metersbelow ground surface of this volcano-sedimentary series.
If many studies focused on the geology and geomorphology of the Tengger Caldera (Fig. 1 b), there is still an important lack ofknowledge concerning the fault system of the Tengger edifice and the detailed structure of the peripheral sectors such as the northPasuruan plain. The major tectonic structures of East Java are normal (E–W) and strike-slip (NE-SW) faults, inherited from thesubduction context (Marliyani, 2016; Susilohadi, 1995). Some authors describe the caldera structure and the caldera-bounding faultsof different type of volcanoes (Cabusson, 2012; Cole et al., 2005). In particular, for the Tengger, the northeast margin of the Tenggercaldera (Fig. 1 a) is linear, suggesting a control by a NW-SE trending fault (Newhall and Dzurisin, 1988). Additionally, Neumann vanPadang (1951) suggested the existence of two subtle alignments of vents within the caldera: NNE-SSW and E–W. No other faultsystem is described on the Tengger in the literature. However, the Watukosek fault system (Fig. 1 a) associated to the Arjuno Welirangvolcanic complex described by Moscariello et al (2017) could be extrapolated to similar regional NE-SW fault systems responsible ofthe alignment of the Semeru, Bromo and the piercement structure illustrated by the Ranu Grati maar in the Pasuruan plain. The NorthPasuruan fault zone surveyed by Marliyani (2016) suggests that the Pasuruan plain is structured by a South-North graben.
2.2. Climate
According to Badan Meteorologi, Klimatologi dan Geofisika of Malang (BMKG, 2018), East Java is characterised by a humidtropical climate with two distinct seasons: a wet season from November to April and a dry season from May to October. The East Javamean annual rainfall is about 1500 mm at sea level, with about 140 rainy days a year (BPS-Statistics Indonesia, 2017). For the Bromo-Tengger area, the precipitation recorded for the 2008–2018 period is ranging from 1290 to 2400 mm year−1, respectively for thestation 9 and 5 (BMKG, 2018), (Fig. 2 a). The mean interannual precipitation estimated on the basis of 6 rain gauges (n° 1, 2, 4, 5, 6,7; Fig. 1) regularly located on the northern flank of Bromo-Tengger is about 2000 mm year−1, with a maximum amount of rainfallfrom December to February (Fig. 2 a, b). Unfortunately, BMKG data are not precise enough to map rainfall on the Tengger volcanobecause of numerous and long gaps observed in data for all rain gauges. In such steep topographic environment, the rainfall usuallyincreases from the coastal low elevation areas to the inland highest areas, but also depends on the wind orientation. From theSurabaya and Malang stations data, the annual average wind direction is about N150° (NW-SE), with a mean velocity of about 5 kmh−1 and the annual average humidity is 76%. The 2008–2018 annual average temperature shows a minimum temperature of 18.3 °Cfor Malang (580 m.a.s.l.) and a maximum temperature of 32.1 °C for Surabaya (10 m.a.s.l.).
The mean interannual precipitation estimated by the TRMM satellite data (Kummerow et al., 1998) for the hydrological years2000–2018 (Fig. 2 c) is 2123 mm year−1. There is no significant precipitation trend observed during the last 18 years for annualrainfall as well as for rainfall during wet and dry seasons. The two last hydrological years (2017–2018) have rainfall very near theaverage, and can both be considered as representative “mean” hydrological years. In addition, the 2017 and 2018 rainfall amountmeasured during the rainy season is near the average rainfall amount of the rainy season.
2.3. Hydrogeology
In continental context, the structure of volcanic aquifers is mainly governed by the opposition between an impermeable sub-stratum (often non-volcanic), and overlying volcanic formations generally permeable (see for instance Bourlier et al. (2005) orRouquet et al. (2012). In insular volcanic context, two main manifestations of a single conceptual hydrogeological model are de-scribed in the literature, at the volcanic edifice scale or even at the whole island scale: (1) a low-lying basal aquifer linked to inlanddike-impounded and perched aquifers such as in the island of Oahu in Hawaii (Nichols et al., 1996; Peterson, 1972); (2) a continuousbasal aquifer extending far inland and at rather high elevation which is well detailed in the Canary Islands (Custodio, 2007). Thesehydrogeological models were developed for basaltic volcanism (hot spots, transform faults, etc. geodynamical context) and are stillimproved by the hydrogeological community, especially regarding the key role of the volcanic core with dike network acting asbarriers or as water conducting features through the fissures associated (Herrera and Custodio, 2008). Recent studies show a morecomplex reality, and the need for higher resolution hydrogeological studies, even in basaltic context (Join et al., 2005; Lachassagneet al., 2014).
Moreover, andesitic-type volcanism exhibits different hydrogeological patterns than the basaltic one and still need to be bettercharacterized (Charlier et al., 2011; Hemmings et al., 2015b). In such andesitic context, the volcanic formations have often morevarious lithologies than in basaltic context, with lavas, but also pyroclastic formations, and volcano-detritic series, such as lahars anddebris flows. For instance, the hydrogeological role of the extensive ignimbrite deposits frequently found in andesitic context is stillpoorly understood and may enable the presence of more than a single groundwater system. The andesitic volcanic formations are alsooften older, with several volcanic and erosion phases, and the associated weathering processes and paleosurfaces. It generatesmultiple superimposed or juxtaposed hydrogeological units with various hydrogeological relationships. Furthermore, the high reliefof volcanoes favours erosion and the associated presence of deep canyons may also laterally limit the extension of the hydrogeologicalunits. In the Merapi volcano (Indonesia), a dominant pyroclastic and volcano-detritic volcano, groundwater flow pathways aredescribed to be related to the volcanic infilling of ancient paleovalley systems, locally comprising lava flows, which act as a pre-ferential underground drainage networks (Selles et al., 2015).
A. Toulier, et al. Journal of Hydrology: Regional Studies 26 (2019) 100634
4
The volcanic context of the Tengger strato-volcano is rather different as lava flows (mainly basic andesite), extensively present onmost of the northern slope, gradually disappear to the upper reach of the North plain, where the volcano-sedimentary series appear.Only a few gravity springs with discharge of a few L s−1 are known on the flank of the volcano. In contrast, important artesian springsoutflow from the upper part of the volcano-sedimentary series of the Northern Plain, such as Umbulan (Q≈ 3500 L s−1) and BanyuBiru (Q≈ 300 L s−1) springs, which are used for irrigation and drinking water supply in the Pasuruan plain (Fig. 1 a). An artesianspring (or well) is defined as a groundwater outflow which occurs through some fissure or other opening features (lithologicalheterogeneity, fault, intrusive bodies, or drilling for a well) in the confining bed that overlies the confined aquifer (definititonmodified from UNESCO, 2012).
The plain is also characterized by hundreds of artesian wells drilled in the volcano-sedimentary formation, near or downstreamthe springs, for agricultural or domestic uses. Their depth varies between 30 and 120 m, and their discharge often reaches several Ls−1. The geometry and lateral extent of the confining units responsible of artesianism are not known but some authors present thePasuruan plain as an “extensive and productive aquifer system of moderate transmissivity and with piezometric head near or above
Fig. 2. a Mean interannual rainfall at 10 rainfall stations, as a function of their elevation (m.a.s.l.) (data from BMKG of Malang city); the location ofeach rainfall station is reported on Fig. 1 a. b Mean monthly precipitation for the 10 rain gauges. c Normalised rainfall index (i) and annualcumulative rainfall from 2000 to 2017 hydrological years, estimated from the TRMM data (3b4v7, 2011). The index is given by the equation: i = (Pi– Pmean)/σ where Pi = annual cumulative rainfall, Pmean = mean interannual rainfall and σ = standard deviation of the total annual cumulaterainfall.
A. Toulier, et al. Journal of Hydrology: Regional Studies 26 (2019) 100634
5
the land surface” (Soekardi Puspowardoyo, 1985).There is no information about hydrothermal activity on the northern flank of the Bromo-Tengger. In addition, the water tem-
perature measured in artesian wells of the volcano-sedimentary plain is about 23 °C which indicates a negative thermal anomaly incomparison with the local mean annual air temperature of about 30 °C. Then, the low temperature of the groundwater suggests arecharge at “high” elevation. The hydrogeological functioning of the 40 km2 endorheic basin at the summit of the volcano (Tenggersea sand caldera) is also unknown.
3. Methodology
The comprehension of the structure and hydrogeological functioning of complex systems requires a multidisciplinary approach; infact, each method provides some clues of the hydrosystem which can only be considered as reliable insights when they converge.Complementary methods were then applied: geological study, implementation of a hydro-climatologic monitoring network, hy-drochemistry and isotopes analyses. Results of these investigations and analyses, described here below, allow delineating the re-charge area and conceptualizing the aquifer structure and its functioning.
3.1. Geological study
A multi-scale geological field work has been conducted to gather complementary data.
- First, the main geomorphological structures of the Bromo-Tengger massif were characterized using Arcgis and Google Earth tools.An hill shade map of the SRTM30 m at a resolution of one arc-second (Farr et al., 2007) was elaborated and compared to thedifferent existing geological maps (Mulyadi, 1992; Santosa et al., 1992; Zaennudin et al., 1994).
- Second, a 5 months geological fieldwork was performed to both observe lithological features in areas where information wasmissing, and verify geological descriptions and limits of the existing maps. On the northern flank of the volcano, this work wasmainly carried out in canyons where most of the outcrops are located. Stratigraphic logs and geological data were collected fromabout 250 outcropping sites, then analyzed to corroborate and sometimes correct information from the existing geological maps.On the volcano sedimentary plain of Pasuruan, the existing geological description was completed by the geological logging ofseven wells (34 to 103 m deep) on the basis of the cuttings and cores collected during drilling (Appendix Fig. A1).
3.2. Monitoring network for recharge assessment
3.2.1. Hydro-climatological monitoringThe rainfall and temperature pattern of the Bromo volcano were characterized using 4 new meteorological stations (CIMEL RTU
station) installed along a North-South transect at different elevations: Kronto - 535 m.a.s.l., Wonorejo - 1158 m.a.s.l., Temple -2154 m.a.s.l. and Seruni - 2681 m.a.s.l. (Fig. 3).
Hourly temperature and rainfall measurements were recorded over one year from 1/04/2017 to 31/03/2018. This period is partof 2017 and 2018 hydrological years considered as mean hydrological years (see section 2.2). Rainfall was collected for isotopeanalysis and cumulated rainfall assessment in a 200 L water tank, initially filled with 1 L of motor oil to avoid evaporation. The finalvolume of water in this tank was measured at the end of the monitoring period to check the good calibration of the CIMEL raingauges. In addition, the Aqua Factory meteo station located in the Pasuruan plain (Aqua - 17 m.a.s.l.), that records daily rainfall, wasalso used.
A 5.8 km² representative surface watershed was monitored to estimate the water budget of the study area. This watershed rangesfrom 435 m.a.s.l. at the Kronto river gauging station to 2615 m.a.s.l. Stream water level was measured with a 0.5 cmH2O precisionpressure probe, during the hydrological year stemming from 01/11/2017 to 31/10/2018. A rating curve was built using 5 manualdischarge gaugings ranging between 2.5 and 60 L s−1, and completed by the discharge estimated during a peak flood (about 1500 Ls−1) from a velocity estimate performed with a floating object (a bottle), and the known section of the stream.
Water points on the volcano flank and in the plain (springs, wells, dugwells) were inventoried and stored in a database. Dischargemeasurements of the main artesian springs and the artesian wells were also realized.
3.2.2. Analysis of climatic and hydrological dataThe monitoring results were used to characterize the spatial rainfall and temperature distributions along the northern flank of the
volcano.Based on the Thornthwaite method (Thornthwaite, 1948), the aquifer recharge was computed as follows:
Re=R – (RET+Roff + ΔS) = ER - Roff - ΔS (1)
where:Re: recharge (mm)R: rainfall (mm)RET: real evapotranspiration or also known as actual evapotranspiration (AET) (mm)Roff: runoff (mm)
A. Toulier, et al. Journal of Hydrology: Regional Studies 26 (2019) 100634
6
ΔS: variation in soil moisture storage (mm)ER: effective rainfall (=R - RET) (mm)The potential and the real evapotranspiration (PET and RET) were calculated for each meteorological stations at a Monthly time
step, considering a 100 mm maximum soil moisture storage, initialized at 100 mm in April 2017 (end of the rainy season), (Ponce andShetty, 1995). Then, effective rainfall (ER) was computed monthly as ER = R – RET.
The water budget parameters (R, RET, ΔS) come from the 01/04/2017 to 31/03/2018 monitoring period. The runoff was esti-mated from the Kronto watershed hydrological data (01/11/2017 to 31/10/2018). To compute average rainfall over this watershed,the weighted surface coefficient from Thiessen polygon is applied on the surface watershed with the data from the Kronto, Wonorejoand Seruni meteo stations with respectively 20, 62 and 18%.
The total recharge of the aquifer was inferred from its outflows from the main artesian springs and artesian wells and from leakage(estimated vertical groundwater flow through the Plain aquitard).
Fig. 3. Location of the sampling sites on the Bromo-Tengger-Semeru area plotted on a DEM (STRM30 m). The sampling points are divided in 5 types:1) gravity springs, 2) artesian springs, 3) artesian wells, 4) Ranu Grati lake (Maar) and (5) rainwater from raingauges.
A. Toulier, et al. Journal of Hydrology: Regional Studies 26 (2019) 100634
7
3.3. Hydrochemical and isotopic measurements
During 4 sampling campaigns including dry and wet season (May-June 2016, November 2016, May- June 2017 and March-June2018), with sampling elevation ranging from 13 to 2700 masl, were collected:
- i) 31 groundwater samples (artesian wells, artesian and gravity springs),- ii) 1 surface water sample from a lake (Maar),- iii) 4 rainwater samples from meteorological stations.
Details of the sampling points are given in Table 1 and plotted in Fig. 3.On the northern flank of the Bromo-Tengger, the 17 groundwater samples were mainly collected from “gravity springs” such as
inter lava flows springs. In the volcano sedimentary plain, the 14 water samples were collected from artesian springs and artesianwells. For each groundwater sample, physico-chemical measurements (Electrical Conductivity (EC), pH, Temperature, DissolvedOxygen) were recorded in the field using a multiparameter probe HACH HQ40D and completed by spring/well discharge mea-surements.
Anion and alkalinity were collected in HDEP bottles of 10 ml and 50 ml respectively, and stored without air bubbles. Waterisotopes were collected in 10 ml amber glass bottles also avoiding entrapped air bubbles. Samples for cation and traces analysis werecollected in acid washed 20 ml vials and the samples were preserved by acidifying to pH 2 with concentrated trace grade HNO3−.Each vial was previously rinsed 3 times with the water being sampled. Anion, cation and trace elements were filtrated using a 022 μmMillipore filter. Samples were kept refrigerated prior to analyses.
Table 1Hydrochemical and isotopic results. Samplings and water analyses were repeated for some locations (b and c letters). NA: not available; BDL: belowdetection limit.
Coordinates WGS1984 UTM Zone 49S
No. Water point name Type Location Long Lat Elevation Well depth Discharge(m) (m) (m.a.s.l.) (m) (L s−1)
1 Kali Sukun Artesian spring Sruwi 716014 9142825 26 – < 102 Telogo Artesian spring Sruwi 715819 9142568 31 – 103 Banyu Biru Artesian spring Banyu Biru 717071 9143017 33 – 3804 Umbulan Artesian spring Umbulan 713303 9141735 33 – 35005 Aqua well Artesian well Keboncandi 713239 9145886 13 100 406 Bandaran well Artesian well Bandaran 716299 9144839 40 100 7.57 Small artesian well Sruwi Artesian well Sruwi 714614 9142240 50 NA < 0.018 Sumber Lumbang Gravity spring Cukurguling 717194 9137517 384 – 19 Sumber Gondang 1 Gravity spring Kronto 713273 9136210 551 – 210 Danyang (Wonorejo) Gravity spring Wonorejo 714011 9133531 1060 – < 0.5*11 Sumber Tengah Gravity spring Wonorejo 714114 9133282 1144 – 0.112 Posong Tepis-Tesa Sapikerep Gravity spring Sapikerep valley 723956 9125054 1261 – < 113 Kendil Gravity spring Ngadas 720153 9124239 1753 – > 1*14 Little-Spring-Tosari Gravity spring Tosari 710563 9126720 1810 – > 1*15 Banyu Ngisor Gravity spring Wonokitri 710763 9127493 1860 – < 0.0116 Widodaren Caldera Gravity spring Widodaren 714129 9120656 2200 – < 0.5*17 Seruni Gravity spring Seruni 715008 9126199 2700 – < 118 Séruni 2 Gravity spring Cemoro Lawang 714943 9125300 2675 – 0.519 Borehole 7 Artesian well Gading 715751 9145789 22 80 1220 Borehole 54 Artesian well Pandan Rejo 715293 9147863 18 125 421 Kali Pancur 3 Gravity spring Pancur 715374 9135997 672 – 122 FD1 Artesian well sruwi 715390 9142385 20 110 223 Ranu Grati Lake (Maar) Grati 721646 9145382 17 – NA24 Tirtoageng Gravity spring Sapikerep valley 727707 9133759 356 – < 2025 Madakaripura Gravity spring Sapikerep valley 721478 9131294 850 – 20026 Sumber Pitu Gravity spring Malang 700778 9113788 870 – 100027 Community drill 96m Artesian well Winongan 714339 9146170 15 96 1528 Umbulan Malang Artesian spring Malang 694643 9095612 465 – 10029 Kalimati Gravity spring Kalimati 710306 9105189 2700 – 130 Wendit Malang Artesian spring Malang 684528 9120348 478 – 30031 Coban sewu Gravity spring Lumajang 711117 9089737 526 – 10032 Ranggojalu Artesian spring Probolinggo 747589 9131545 61 – 320033 Kronto station Rain water Kronto 713990 9136958 545 – –34 Wonorejo station Rain water Wonorejo 714071 9133211 1158 – –35 Temple station Rain water Caldera bromo 715445 9122585 2154 – –36 Seruni station Rain water Seruni 715323 9126121 2681 – –
*Gravity spring selected as integrative spring in order to characterise the isotopic signature of the spring elevation.
A. Toulier, et al. Journal of Hydrology: Regional Studies 26 (2019) 100634
8
Table2
Hyd
roch
emic
alan
dis
otop
icre
sults
.Sam
plin
gsan
dw
ater
anal
yses
wer
ere
peat
edfo
rso
me
loca
tions
(ban
dc
lett
ers)
.(-):n
otav
aila
ble.
No.
Wat
erpo
intn
ame
Elev
atio
n(m
.a.s
.l.)
Type
Dat
epH
EC(μ
Scm
−1 )
T(°
C)O
2(m
gL−
1 )H
CO3−
(mg
L-
1 )Ca
2+M
g2+K+
Na+
Cl−
SO42−
NO
3−Io
nic
Bala
nce
(%)
δ18O
(‰)
δD(‰
)
1Ka
liSu
kun
26A
S13
/06/
2016
7.0
264
24.0
6.5
135.
924
.012
.12.
77.
52.
53.
02.
44
−7.
37−
44.2
2Te
logo
31A
S13
/06/
2016
7.3
204
23.7
7.3
119.
321
.010
.12.
26.
52.
73.
03.
32
−7.
46−
44.8
3Ba
nyu
Biru
33A
S13
/06/
2016
7.0
258
25.6
7.0
152.
525
.312
.92.
47.
41.
72.
33.
51
−7.
08−
41.5
b33
AS
23/1
1/20
167.
225
324
.06.
416
0.5
23.3
13.4
2.1
7.4
1.7
2.4
4.0
−3
−7.
08−
40.7
c33
AS
15/0
5/20
176.
425
723
.86.
415
3.6
23.1
13.4
2.4
7.5
2.1
2.3
3.6
−1
−7.
14−
41.4
4U
mbu
lan
33A
S11
/05/
2016
6.9
205
23.5
6.9
100.
019
.79.
22.
77.
02.
33.
24.
77
−7.
32−
42.8
b33
AS
23/1
1/20
167.
220
823
.57.
313
7.1
18.7
9.9
2.4
7.3
2.2
3.3
5.4
−7
−7.
15−
42.2
c33
AS
17/0
5/20
176.
921
723
.46.
912
2.6
19.7
10.0
2.7
7.4
2.5
3.1
5.1
−1
−7.
28−
42.7
5A
qua
wel
l17
AW
15/0
5/20
167.
130
625
.06.
413
7.8
20.9
14.5
5.2
11.5
6.1
8.1
6.4
3−
6.96
−40
.6
b17
AW
23/1
1/20
167.
231
024
.66.
517
6.4
21.5
17.0
5.2
13.1
6.5
8.4
7.5
−3
−7.
00−
39.9
c17
AW
11/1
2/20
177.
131
624
.96.
416
2.7
22.1
14.6
5.4
12.0
7.0
7.7
7.0
−3
−6.
96−
41.7
6Ba
ndar
anw
ell
17A
W13
/06/
2016
6.9
230
24.8
8.0
131.
317
.612
.24.
810
.73.
04.
33.
82
−7.
31−
43.3
7Sm
alla
rtw
ellS
ruw
i17
AW
13/0
6/20
167.
020
325
.07.
212
1.5
22.2
10.6
2.1
6.8
2.3
2.8
3.4
4−
7.44
−43
.8
8Su
mbe
rLu
mba
ng38
4G
S22
/05/
2016
7.8
148
25.1
7.8
97.6
13.9
5.3
0.3
5.9
1.1
1.8
6.9
−12
−6.
93−
42.0
b38
4G
S24
/11/
2016
7.7
147
25.6
7.9
89.4
14.0
5.8
0.3
7.1
1.1
2.0
5.6
−4
−6.
98−
39.6
9Su
mbe
rG
onda
ng1
551
GS
11/0
6/20
166.
315
825
.07.
388
.617
.16.
41.
05.
60.
91.
76.
91
−7.
18−
42.7
b55
1G
S24
/11/
2016
7.4
164
24.0
7.9
96.9
16.9
7.0
0.9
5.8
1.0
1.9
7.0
−2
−7.
21−
41.9
10D
anya
ng(W
onor
ejo)
1060
GS
11/0
6/20
166.
619
222
.27.
655
.922
.66.
40.
84.
910
.02.
124
.27
−7.
43−
44.1
(continuedon
nextpage
)
A. Toulier, et al. Journal of Hydrology: Regional Studies 26 (2019) 100634
9
Table2
(continued)
No.
Wat
erpo
intn
ame
Elev
atio
n(m
.a.s
.l.)
Type
Dat
epH
EC(μ
Scm
−1 )
T(°
C)O
2(m
gL−
1 )H
CO3−
(mg
L-
1 )Ca
2+M
g2+K+
Na+
Cl−
SO42−
NO
3−Io
nic
Bala
nce
(%)
δ18O
(‰)
δD(‰
)
b10
60G
S24
/11/
2016
7.4
173
22.0
7.6
62.5
17.5
6.1
0.6
4.8
10.0
2.1
24.4
−4
−7.
44−
41.8
*11
Sum
ber
Teng
ah11
44G
S11
/06/
2016
6.6
132
22.2
7.5
31.2
13.1
5.8
0.4
3.3
9.8
1.1
24.7
3−
7.47
−45
.8
b11
44G
S24
/11/
2016
7.0
136
22.0
7.4
35.7
12.0
5.7
0.3
3.4
10.4
1.1
26.2
−4
−7.
52−
44.1
12Po
song
Tepi
s12
61G
S07
/06/
2016
6.3
192
22.4
5.3
67.8
17.8
6.2
4.5
9.5
5.6
16.4
11.1
4−
7.26
−44
.9
13Ke
ndil
1753
GS
10/0
6/20
167.
046
218
.47.
861
.247
.215
.010
.215
.212
.242
.611
8.3
4−
8.17
−53
.3
*14
Litt
le-S
prin
g-To
sari
1810
GS
06/0
6/20
166.
730
518
.07.
638
.132
.39.
55.
710
.011
.921
.979
.35
−8.
58−
54.3
*15
Bany
uN
giso
r18
60G
S06
/06/
2016
6.6
610
19.7
7.1
103.
968
.519
.06.
019
.539
.231
.912
8.6
4−
8.85
−57
.6
16W
idod
aren
Cald
era
2200
GS
14/0
5/20
165.
667
117
.97.
07.
469
.716
.911
.623
.810
4.4
138.
60.
02
−8.
61−
55.8
*17
Seru
ni27
00G
S14
/05/
2016
7.5
170
12.5
7.2
46.0
19.2
4.4
3.2
6.8
12.2
16.4
2.2
7−
10.4
9−
68.1
b27
00G
S01
/12/
2016
7.0
170
12.6
7.3
19.9
17.2
4.3
2.7
6.5
18.1
23.3
11.4
2−
10.4
0−
66.7
18Se
runi
226
75G
S09
/06/
2016
6.7
275
15.7
7.1
33.4
28.8
8.0
3.4
9.7
24.6
55.8
0.5
4−
10.1
7−
66.9
19Bo
reho
le7
22A
W27
/06/
2016
6.7
297
26.0
5.8
166.
524
.515
.66.
012
.65.
68.
05.
51
−7.
00−
42.1
b22
AW
23/1
1/20
167.
329
625
.15.
919
1.3
21.3
16.3
5.1
12.9
5.8
8.1
6.0
−7
−6.
91−
39.7
20Bo
reho
le54
18A
W27
/06/
2016
7.3
353
26.2
3.8
207.
229
.118
.77.
917
.07.
19.
43.
11
−7.
15−
42.2
b18
AW
23/1
1/20
167.
436
125
.63.
921
0.0
26.4
19.1
6.5
16.9
7.3
9.9
4.2
−2
−7.
19−
40.6
21Ka
liPa
ncur
367
2G
S27
/06/
2016
6.0
109
24.6
2.9
61.2
12.2
3.5
0.9
4.5
0.6
1.4
1.5
2−
7.03
−42
.4
22FD
120
AW
23/1
1/20
167.
521
224
.87.
513
9.6
20.7
10.6
1.8
6.7
1.6
2.3
4.3
−4
−7.
35−
41.8
23Ra
nuG
rati
17LA
KE18
/05/
2017
8.8
470
25.2
13.9
144.
431
.421
.76.
614
.68.
86.
30.
02
−4.
96−
33.7
(continuedon
nextpage
)
A. Toulier, et al. Journal of Hydrology: Regional Studies 26 (2019) 100634
10
Table2
(continued)
No.
Wat
erpo
intn
ame
Elev
atio
n(m
.a.s
.l.)
Type
Dat
epH
EC(μ
Scm
−1 )
T(°
C)O
2(m
gL−
1 )H
CO3−
(mg
L-
1 )Ca
2+M
g2+K+
Na+
Cl−
SO42−
NO
3−Io
nic
Bala
nce
(%)
δ18O
(‰)
δD(‰
)
24Ti
rtoa
geng
356
GS
27/0
4/20
176.
247
924
.55.
020
3.5
37.6
30.5
10.2
25.2
25.0
43.5
12.5
5−
7.83
−47
.9
b35
6G
S19
/05/
2017
6.2
573
24.1
5.3
228.
233
.825
.48.
721
.520
.835
.512
.4−
4−
8.05
−51
.0
25M
adak
arip
ura
850
GS
19/0
5/20
176.
911
420
.98.
198
.213
.65.
62.
15.
52.
54.
73.
2−
12−
7.71
−46
.3
26Su
mbe
rPi
tu87
0G
S12
/06/
2017
7.1
628
20.6
7.3
312.
939
.242
.69.
824
.518
.652
.35.
70
−8.
95−
56.4
27Co
mm
unity
Dri
ll96
m15
AW
27/0
5/20
177.
030
424
.76.
114
8.8
21.6
16.4
5.6
12.7
6.3
8.0
5.6
4−
6.98
−40
.2
b-78
m15
AW
22/0
5/20
177.
131
824
.35.
414
8.4
21.6
16.5
5.6
12.7
6.1
8.0
5.5
5−
7.08
−41
.0
28U
mbu
lan
Mal
ang
465
AS
11/0
4/20
176.
720
020
.97.
110
5.1
15.9
8.2
3.4
12.0
8.1
9.3
4.0
−4
−7.
50−
42.4
29Ka
limat
i27
00G
S28
/04/
2017
6.6
––
–71
.59.
93.
02.
66.
71.
53.
30.
8−
9−
10.8
3−
68.8
30W
endi
tM
alan
g47
8A
S11
/04/
2017
6.3
327
25.0
5.4
139.
827
.413
.65.
213
.48.
215
.525
.0−
1−
6.65
−39
.5
31Co
ban
sew
u52
6G
S11
/04/
2017
7.8
359
22.6
8.4
241.
726
.120
.15.
818
.35.
09.
52.
6−
6−
6.76
−39
.1
32Ra
nggo
jalu
61A
S10
/04/
2017
6.8
381
26.5
6.1
215.
329
.917
.75.
718
.112
.75.
46.
5−
3−
6.55
−37
.0
33Kr
onto
stat
ion
535
RAIN
27/0
3/20
18–
––
––
––
––
––
––
−7.
44−
45.6
34W
onor
ejo
stat
ion
1158
RAIN
27/0
3/20
18–
––
––
––
––
––
––
−7.
97−
48.1
35Se
runi
Stat
ion
2681
RAIN
30/0
3/20
18–
––
––
––
––
––
––
−11
.83
−78
.6
36Te
mpl
est
atio
n21
54RA
IN30
/03/
2018
––
––
––
––
––
––
–−
10.4
5−
70.1
*Gra
vity
spri
ngse
lect
edas
inte
grat
ive
spri
ngin
orde
rto
defin
eth
eBS
WL.
A. Toulier, et al. Journal of Hydrology: Regional Studies 26 (2019) 100634
11
Alkalinity was determined in the field by titration with HCL (0,1 M) using a manual Titrator Hach. The other analyses wereperformed in Hydrosciences laboratory, University of Montpellier. Anions were analyzed by ionic chromatography using a IC1000Dionex. Cations and traces were analysed with an ICP-MS iCAP Q Thermo-Fisher. The analytical error for major elements is below 5%and below 0.1% for traces elements. Stable isotopes (δ18O, δD) were analysed at LAMA laboratory using an Isoprime mass spec-trometer with an accuracy of ± 0.08‰ for δ18O and of ± 0.8‰ for δD. The isotopic data are reported in the conventional delta (‰)notation as a deviation from the Vienna Standard Mean Ocean Water (VSMOW).
Comparison of the stable isotopic compositions of groundwater and rain water at different altitudes is defined as an efficient andapproved scientific tools for evaluating recharge area from complex hydrogeological systems (Gat, 1996; Jones et al., 2000). Thismethod has been successfully performed for many volcanic Islands (Heilweil et al., 2009; Hildenbrand et al., 2005; Prada et al.,2016). However, the monthly rainfall sampling required for establishing altitudinal isotopic gradient (Gonfiantini et al., 2001) ischallenging to perform in volcanic regions with difficult access due to dense vegetation and high slope, and has some drawbacks.
As no local isotopic monitoring exists on the study area, we first determined an altitudinal gradient of water isotopes using smalllocal springs (Q < 1 L s−1) called “integrative springs”, located along the northern flank of the volcano. These integrative springs arecharacterised by small watershed (< 0,5 km²) and short flowpaths between recharge and discharge locations. The geomorphologyconfirmed the limited extension of their watershed such as “Seruni” (n°17; Table 2) located in a small thalweg at less than 100 m fromthe volcano summit or “Little spring of Tosari” (n° 14; Table 2) located under a high cliff, and no relationship with stream waterinfiltrated upstream. In addition, these springs show significantly stable physicochemical parameters and water isotopes suggesting alocal aquifer, nevertheless sufficiently developed to smooth rain events and seasonal variations. Local anthropogenic impacts orvolcanic activity dry deposits influence some of these springs, in accordance with the land use of their inferred recharge area, alsoconfirming a local recharge. This methodology has been successfully applied on volcanic context such as in Guatemala (Mulliganet al., 2011). The isotopic value of the integrative springs was used to calculate a local meteoric water line referred as the BromoSpring Water Line (BSWL).
The stable isotopes of rain water were also sampled at the end of March 2018, after one full year of cumulated rainfall storage, ateach meteorological station (Fig. 3 and section 3.2.1). These samples allowed to establish a local meteoric water line (BMWL, BromoMeteoric Water Line) calculated as a first approximation with the PWLSR precipitation weighted method (Hughes and Crawford,2012). Due to uncomplete rainfall collection at Aqua station, we estimated water isotope values in the plain using the GNIP station ofJakarta (IAEA, 1961) determined for the same coast and elevation than Aqua station (IAEA, 1962–1998; 8 m.a.s.l.; δD‰ = 7,47 δ18O+ 7,99). The BMWL is then compared to the global meteoric water line (GMWL) defined by Craig (1961), (GMWL; δD‰ = 8 δ18O +10) and validated by the local meteoric water line (LMWL) based on GNIP of Jakarta.
3.4. Quantitative estimation of stable isotopes signature for recharge area delineation
To delineate the recharge area of the aquifer, we assume that the isotopic signature of the main spring (Umbulan) is re-presentative of the isotopic signature of the “basal” volcano-sedimentary aquifer, which is confirmed by isotopic sampling in theplain. The methodology developed in this paper combines the use of:
A the stable isotopes data: outflow at the main spring on the one hand, and local meteoric water line built from the integrativesprings (BSWL) on the other hand;
B the total groundwater outflow measured from the aquifer (see Section 3.2.1.), and elevation-dependent groundwater rechargecomputation.
The interest of a 2D quantitative modeling developed in this paper, as compared with a simple 1D approach, allows (1) to takeinto account the conical shape of the volcano, and (2) to accordingly compute a recharge function (leading to the water budget) thatdepends not only on the elevation, but also on the shape of the volcano, which is a key point to constrain the results. Thesegeometrical characteristics (shape) and recharge function (more precisely effective rainfall = f(elevation and shape of the volcano)are considered as fixed entry parameters, as well as the isotopic data. The infiltration rate on the contributing slices is also consideredas a fixed parameter (based on hydrological measurements). Then, the only adjusted parameters are the contributing slices (whichelevation for the recharge area), and the surface area of the whole recharge area. Geological and hydrogeological arguments are usedto validate and ensure the reliability of the results.
Of course, such a methodology provides theoretically a non-unique solution. However, constraining a maximum of parametersfrom other independent methods/approaches, and using other information, such as geology and hydrogeology, helps identify themost probable one(s).
The methodology comprises 5 steps (Fig. 4).STEPS 1–3 correspond to the preparation of the data base then of the model, STEPS 4 and 5 to its calibration to delineate the
aquifer recharge area. Computations were performed with MSExcel.
- STEP 1: Discretisation of the maximum lateral and vertical extension of the potential recharge area of the aquifer:- dividing all the northern flank of the volcano into 100 m range of elevation “slices”.
The number of slices “n” is defined as:
A. Toulier, et al. Journal of Hydrology: Regional Studies 26 (2019) 100634
12
=n Slice i( )i( ) (2)
Where:i = 0 to n, and each slice mean elevation is Mh (i).
(i) using morphological information to laterally (West-East) limit the extension of the recharge area.
This step enables to compute a first distribution of surface area for each slice, that may be refined later during the modelingprocess. The potential recharge surface area “Stotal” is computed as follows:
=S S i( )total i( ) (3)
Where:S(i): the surface of slice i (km²) enabling aquifer recharge
- STEP2: Recharge was computed for each slice along the same range of elevation by interpolating the results (R, RET from waterbudget Section 3.2.2 obtained at the 5 meteorological stations of the northern flank of the volcano), and infiltration rate. Therecharge of each slice Re i( ) is given by:
= × ×Re i ER i C S i( ) ( ) ( )inf (4)
from which the total estimated inflow to the aquifer is inferred:
=Q Re i( )total i( ) (5)
Where:ER: the effective rainfall of the slice i (mm y−1)Cinf: the coefficient of infiltration of the effective rainfall, initially fixed at 100% for each slice (%)
- STEP 3: the δ18O recharge signal for each slice was derived from the BSWL and used as an input in the model. The δ18O rechargesignal for each slice O i( )rec
18 is given by:
= = + ×O i O i grad BSWL m Mh i( ) ( 0) ( /100 ) ( )rec rec18 18 (6)
Where:δ18Orec(i = 0): δ18O input of the slice 0 m.a.s.l.grad (BSWL/100 m): δ18O gradient (Bromo Spring Water Line, BSWL).Then, the δ18O contribution of each slice is given by:
= ×O i Re i O iQ
( ) ( ) ( )cont
rec
total
1818
(7)
Fig. 4. Quantitative modeling method for recharge area delineation of the Bromo-Tengger hydrogeological system.
A. Toulier, et al. Journal of Hydrology: Regional Studies 26 (2019) 100634
13
- STEP 4: First calibration phase of the model. Here, the objective is to define the elevation slices where recharge can occur with theobjective to obtain the δ18O composition measured at the spring/aquifer. Calibration is performed first from the altitudinaldistribution of Re imposed from STEP 2 and 3.
The computed δ18O composition of the aquifer ( Ototal18 ) is calculated from:
= iO O ( )total i cont18
( )18
(8)
Based on geological or hydrogeological information (ex: low permeability layers, runoff, etc.), the coefficient of infiltration (Cinf)applied on each slice (see Eq. (4)) can be adjusted to fit with the observed δ18O composition of the aquifer/spring (A.).
- STEP 5: Second phase of the model calibration: calibration of the width of the total recharge area, and then of the total surface ofthe recharge area. The West-East width of the recharge area is adjusted to fit with the total outflow measured from the aquifer(B.).
The calibration process can be iterative, particularly between STEPS 4 and 5.Finally, sensitivity analyses are performed to estimate the accuracy of the calibration.The outputs of this process are mainly the altitudinal and lateral delineation of the recharge area, and the spatial distribution of
the recharge within this area.
4. Results and interpretations
4.1. Geological synthesis and hydrogeological implications
The existing geological maps (Mulyadi, 1992; Santosa et al., 1992; Zaennudin et al., 1994) have been compiled and completedwith field observations (Fig. 5 a).
The northern flank of the Bromo-Tengger volcanic edifice appear to be mostly composed of a thick series of calc-alkaline lavaflows, mostly andesitic and unweathered. These formations outcrop in the medial zone, from 60 to 1500 m.a.s.l. (and are referencedas Olf, BRI, Klf, Nkj on Fig. 5 a). Some lava flows series are more than 50 m thick. Cooked paleosoils, locally covered by autobreccia oflimited thickness (2–3 m max) are interstratified within the lava flows series. The upstream part of the volcano (current proximalzone), ranging from 1500 to 2700 m.a.s.l., is covered by pyroclastic materials (Wjph, Njp) mainly constituted from fall deposits (ash,lapilli) sometimes crisscrossed by lava flows. These fall deposits are unconsolidated and are deeply incised by canyons from thehydrographic network. A few slope deposits are identified at the outlet of some large valleys (Madakaripura and Sapiekerep); they arecomposed of lahars, pyroclastic flows and ignimbrites (Mulyadi, 1992) spread towards the North (SUig, NM).
In term of geomorphology, the volcanic edifice is scarred by 4 main super structures:
- the Sand sea caldera (SS) of the Bromo-Tengger summit with the Tengger caldera wall unit (TDK),- the deep Sapikerep valley (Nap), located East of the volcano, related to the Bromo-Tengger caldera collapse,- the Madakaripura valley (SM, NM) due to the Ngadisari caldera collapse,- the old caldera of Nongkojajar (Nkj) bordering the west side of the volcanic edifice.
Our observations enable to complete the geological map as follows, with the black dotted line units on Fig. 5 a:
- the pyroclastic deposits ejected by the Ranu Grati maar explosions (RG) encircle this 120 m deep volcanic lake;- the north hill of Pasuruan (Hng) is composed of pyroclastic deposits, lahars and possibly ignimbrites. This relief may be the distal
part of the Sapikerep fan deposit (SUig);- more than 100 m thick lahars deposits were mainly identified in the downstream part of the Madakaripura valley (SM and NM);- adventive cones (Cinder cones; AC) seem to correspond to the last lava outflows: Gunung Tinggi and Pandak, South-East of
Umbulan spring;- the western limit of the “old lava flows” (Olf) has been extended, and is now in contact with the Nongkojajar unit (Nkj);- a SW-NE inferred fault may explain the artesian springs alignment (Umbulan, Banyu Biru, Telogo, Kali Sukun, respectively n°4, 2,
1, 3, on Fig. 3) with the Ranu Grati Lake.
In the distal zone of the volcano (Pasuruan plain), 7 drillings (red dots on Fig. 5 b, Appendix Fig. A.1) enabled the identification ofa superficial first unit, ranging from 0 to 30 m deep, mainly composed of weathered volcanic tuffs mixed with fluvial depositscharacterized by their clayey and cinder matrix. Several cores at about 30 m deep were collected and show consolidated and clayeypyroclastic materials probably from lahars or ignimbrites deposits. The lateral variation of these materials is difficult to precise butthe thickness of each unit is about 10 m. The clayey formations described in this first unit surely confine the underlying main aquifer.The second unit (top deeper than 30–40 m deep) is composed of reworked volcanoclastics (ash and lapilli materials) with ripplesmarks, intersected by paleochannels filled with alluvial, laharic and polygenic conglomerates mostly consolidated. This deep unit isprobably contemporaneous and interstratified (at its southern limit) with the lava flows but, as these formations are difficult to drill
A. Toulier, et al. Journal of Hydrology: Regional Studies 26 (2019) 100634
14
Fig. 5. a Geological map of the Northern flank of the Bromo Tengger, modified after Mulyadi (1992); Santosa et al. (1992); Zaennudin et al. (1994).b Schematic geological cross section of the Northern flank of the Bromo Tengger from the Caldera summit (A) to the north coast of Pasuruan (B).Detailed drilling logs are provided in Appendix Fig. A.1.
A. Toulier, et al. Journal of Hydrology: Regional Studies 26 (2019) 100634
15
with the local engines, there is no drilling data in the transition zone. The volcano-sedimentary series thickness is still unknown butsome deep artesian wells may be more than 200 m deep (from farmers oral testimonies). No artesian deep wells have been in-ventoried in the northern part of the plain (in the surroundings of the Pasuruan city). The distal zone of the stratovolcano is surelycharacterized by fine deltaic sediments, such as silts and clays, carried along the hydrographic network (Selles et al., 2015). Thissurely explains the northern ending-up of the aquifer.
4.1.1. Hydrogeological implicationsFrom this complex geological structure, we propose a simplified hydrogeological structure composed by 5 main hydrogeological
units, from the volcano summit to the North coast:
- the central zone, constituted by the sand sea caldera (SS), is filled mostly by dark sand, with a high porosity. This large endorheiczone, with no permanent steam network, probably hosts an unconfined aquifer of unknown thickness, which outlets and re-lationships with other aquifers are unknown;
- in the proximal zone of the edifice, the thickness of the pyroclastic complex is difficult to estimate. However, the inner caldera rimoutcrops (TDK) indicate that it could be several hundred meters thick. It may overlay the lava flows complex described just below.A few low discharge springs were identified in this formation, at the favour of layers of lower permeability (e.g. Seruni spring,Table 1). This formation apparently exhibits a high interstices porosity and permeability;
- the medial zone is occupied by the mostly unweathered lava flow complex (LFC, with chronologically Nkj, Olf, klf, BRI…). Itconstitutes a huge geological unit. Springs and rivers discharge observations show that, at the exception of the Olf lava flow unit,which exhibits a weathering profile, the LFC can be considered as homogeneous as a whole. This is demonstrated by the fact thatonly a few low discharge (a few L s−1) inter lava flows springs have been identified indicating few perched and local aquifers.Most of these inter lava springs flow out from clinker layers in contact with cooked paleosoils (red layers) acting as local im-permeable layers. Hydrogeological surveys along the streams during the dry season show their low specific discharge (as com-pared to the efficient rainfall), and no measurable discharge increase along the stream was observed. It suggests that, beyond thesesmall springs, streams do not drain significant aquifers, nor loss significant amount of water, this later process being surely due tostream siltation. In addition, few adventives cones (AC) have been observed on the medial zone and may provide a laterallycontinuous, low permeability and high density materials, according to Kereszturi and Nmeth (2012);
- In the distal zone of the volcano, the “slope deposits” (NM, SUig, Hng) most probably have a low permeability because of theirclayey content;
- in the volcano-sedimentary plain (“distal zone”), the main hydrogeological feature is the confined aquifer which providesgroundwater to the artesian springs and wells. According to the geological logs realized during the drilling survey, the confinedaquifer is multi-layered. It is confined by a more than 10 m thick confining unit.
460 artesian wells were inventoried in the plain with an average discharge of 4.1 L s−1. Considering the density of well on thefield (≈6 well km-2), we assume that 20% of the wells have not been inventoried. A maximum of about 600 wells is then estimated,corresponding to 2400 L s−1 flowing out in the plain. All the artesian springs show a total discharge of about 4000 L s−1 (Table 1).Assuming a mean hydraulic head difference of about 5 m between the multi-layered confined aquifer and the unconfined aquifer anda confining unit of about 10 m thickness with an hydraulic conductivity of 10-8 m s−1 (Breuer et al., 2000; Charlier et al., 2011), thisgives a mean leakage of about 5 L s−1 km2. For the whole volcano-sedimentary plain where artesianism is known (about 150 km2), itresults in a discharge of about 750 L s−1 due to “natural” leakage through the upper confining unit. The first estimation of the totaloutflow from the whole aquifer system would thus be about 7000 L s−1.
4.2. Hydro-climatological monitoring of the northern flank of the Bromo-Tengger
The new meteorological data are in agreement with the duration of the dry and wet seasons in this area: from May to October andfrom November to April, respectively (Fig. 6 b). The minimum of the dry season occurred on August with only 3 mm of rainfall at theTemple station, and no rainfall at all at the other stations. The wet season peak occurred in February 2018 with a maximum rainfallvalue of 668 mm at Kronto. During both seasons, the Kronto and Wonorejo stations show higher rainfall than Aqua on one hand, butalso than Seruni and Temple that are however at a higher elevation. On the basis of all data, 9 to 21% of annual rainfall occurs duringthe dry season while 79 to 91% of rainfall is recorded during the wet season.
An important altitudinal gradient of rainfall is observed on the volcano’s flank, from Aqua station (≈20 m.a.s.l.) in the plain, toWonorejo station (≈1100 m.a.s.l.) with annual rainfall of 1878 mm and 3891 mm, respectively (Fig. 6 c). Upstream, rainfall de-creases from Wonorejo to Seruni (≈2700 m.a.s.l.) and to Temple (≈2100 m.a.s.l.), with annual rainfall of 1781 and 1552 mm,respectively. Studies about altitudinal gradient of precipitation on high tropical or equatorial mountains also show a decrease ofrainfall beyond a certain elevation, such as in Hawaii (Scholl et al., 1996, 2002), or in the Martinique French West Indies island(Vittecoq et al., 2010). The air mass reaching the volcano’s summit are cooler, however they are impoverished in vapor. Based onthese studies and our data, the most realistic precipitation pattern was drawn, with a peak at an elevation of about 1200 m a.s.l.(Fig. 7 b).
An altitudinal gradient of temperature of about −0.6 °C/100 m was assessed, with a mean annual temperature of about 30 °C inthe plain to 11.8 °C in the caldera, which is consistent with the known temperature gradient on volcanoes in such tropical en-vironment (Selles, 2014). No significant gradient is observed for the relative humidity, ranging from 75% in the plain to 83.3% in
A. Toulier, et al. Journal of Hydrology: Regional Studies 26 (2019) 100634
16
Wonorejo station. However, cloud and fog accumulation are frequently observed below Seruni (2700 m.a.s.l.), indicating a con-densation layer below this elevation. The interception of wind-blown droplets of water by the vegetation, commonly called cloudwater interception (CWI), or fog drip, is likely to increase rainfall height. In the Santa Cruz Island of the Galapagos (Ecuador), the fogdrip is negligible at 400 m.a.s.l., but represents more than 20% of incident rainfall at about 650 m.a.s.l. and directly contributes togroundwater recharge (Pryet et al., 2012a, b). This parameter can thus be a significative part of the recharge, as also identified on LaGomera (Canary Island) where it represents more than 700 mm y−1 according to the fog drip calculation models (Izquierdo, 2014).On the Bromo-Tengger, except some field observations, there is no measurement allowing to quantify fog drip.
As a summary, these first results indicate a precipitation pattern controlled by orographic effects occurring on the Northern flankof the volcano, under the influence of the dominant NW-SE winds. The rainfall thus increases to a maximum value at about1200 m.a.s.l. elevation and decreases beyond.
4.2.1. Results of the climatic and hydrological analysesThe computation of the water budget at each meteorological station allows to plot the Rainfall, RET and ER as function of the
elevation (Fig. 7 a, b, c). From April 2017 to March 2018, the recharge rate was also estimated on the representative Krontowatershed (Fig. 7 a). All results are compiled in the table from Fig. 7 c.
- PET & RET: similarly to the temperature, the potential evapotranspiration (PET) and the real evapotranspiration (RET) con-tinually decrease from the plain to the volcano summit with, for example, a RET of about 1460 mm in the Pasuruan plain, and about620 mm at Seruni. These RET results are consistent with the GLEAM satellite data (Martens et al., 2017) with a difference of less than6% (Fig. 1) (1153 mm y−1 for the mean GLEAM interannual RET from November 1980 to October 2017 and 1223 mm computed onour site for April 2017 to March 2018).
The effective rainfall (ER) is very concomitant with the rainfall (R) variation because of the RET absolute value (much lower thanR, at the exception of the lower part of the volcano) and the RET distribution along the flank of the volcano. Nevertheless, the“impact” of RET is maximum at low elevation where ER is finally rather low (about 600 mm at an elevation of 50 m.a.s.l.). Then, ERincreases steeply, to reach a maximum of 3100 mm also at about 1200 m.a.s.l. At higher elevation, ER steeply decreases with1300 mm only on the top of the volcano’s flank and 900 mm in the inner caldera.
- Re: during the period Nov-17 to Oct-18, the discharge of the Kronto representative watershed is only about 7% of the rainfall(9.5% of the effective rainfall). These data suggest that aquifer recharge is about 66% of the rainfall, and about 90.5% of the effective
Fig. 6. a Monthly rainfall monitored at the 5 meteorological stations installed during this research along the Northern flank of Bromo-Tengger. bAnnual rainfall, mean annual temperature and relative humidity for each meteorological station. The Aqua temperature and humidity have beeninferred from the temperature altitudinal gradient from April 2017 to April 2018 with the following equation: y = -2904 ln(x) + 9876.1 and fromhumidity data of Malang and Surabaya stations from BMKG, 2018. Right: location map of rain gauges (For interpretation of the references to colourin this figure legend, the reader is referred to the web version of this article).
A. Toulier, et al. Journal of Hydrology: Regional Studies 26 (2019) 100634
17
rainfall (Fig. 7 c). This result is consistent with the geological observations (cf. section 4.1) that did not identify impermeable rocks onthis experimental watershed, nor on the whole flank of the Bromo volcano. Similar results were found in tropical and andesitic(pyroclastics) context in Guadeloupe (French West Indies) where the aquifer recharge was estimated at about 85% of the annualeffective rainfall (Charlier et al., 2011). This recharge rate is an average infiltration rate on the whole representative watershed(450–2600 m.a.s.l.) as the hydrological and hydrogeological field observations did not enable to identify any preferential rechargearea.
4.3. Hydrochemistry
Field parameters and laboratory analyses, including major ions and stable isotopes (δ18O, δD) of groundwater samples fromgravity springs, artesian springs and artesian wells are reported on Tables 1 and 2 and their location is plotted on Fig. 3.
Electrical conductivity (EC) of groundwater ranges from 109 to 671 μS cm−1. In the plain, artesian wells and springs showrelatively homogeneous conductivity values (ranging from 202 to 353 μS cm−1 and 203 to 381 μS cm−1 respectively). Gravitysprings located on the flank of the volcano show a large range of conductivity (from 109 to 671 μS cm−1) and the highest values butno correlation was found between the conductivity and the location of the spring as high conductivity is mostly linked to anthro-pogenic impacts on each small watershed. In contrast, an increase of conductivity towards the North was found for artesian springsand wells located in the plain due to water-rock interactions.
The mean temperature of the water samples is 22.6 °C ± 3.6 °C. Groundwater temperature is well correlated with the elevation ofthe spring. The water temperature increases as the elevation decreases, with a minimal temperature of 12.5 °C at 2700 m.a.s.l. (Seruni
Fig. 7. a Location map of the Kronto river representative watershed and the monitoring network. b water budget parameter. c Tables of results: 1)periods for each type of computation, 2) water budget computations at each meteorological station 3) Kronto watershed water budget.
A. Toulier, et al. Journal of Hydrology: Regional Studies 26 (2019) 100634
18
spring, n°17) and a maximal temperature of 26.2 °C in the plain for the deep artesian well 20 (150 m deep). The main spring of thesystem, Umbulan, has an intermediate temperature of 23.5 °C. Temperatures of the artesian wells and springs in the plain are not atthe equilibrium with the mean local air temperature (about 30 °C) indicating a recharge at a higher elevation.
For all groundwater samples, dominant cations are Ca and Mg (Fig. 8 a, Table 2), in good agreement with the andesitic bedrockcomposition. Three dominant anions (HCO3
−, SO42-, Cl−) were found depending on the groundwater samples. Based on the
dominant anions and the relative Ca vs Mg concentration of water, three groups of groundwater were identified. They are also relatedto various elevations (Fig. 8 a):
- In the plain, water samples of artesian springs and wells are dominated by CaMg−HCO3- water type (Fig. 8 a).- On the flank of the volcano, gravity springs located higher than 1000 m.a.s.l. (Volcanic & anthropogenic group; Fig. 8 a) belong
to CaMg-Cl or CaMg-SO4 water type. The high values of Cl− and NO3− occur in the vicinity of villages or crop fields and indicate
anthropic contaminations (e.g. Banyu Ngisor n°15, Table 2). The highest SO42- contents were found in springs close to the top of the
volcano at elevation ranging between 1700 and 2700 m.a.s.l. where volcanic sulphur deposits occur. They indicate the influence ofthe volcanic activity (e.g. Widodaren, n°16).
- A last group show an intermediate composition between the volcanic-anthropogenic type and the main basal aquifer type.Groundwater samples from intermediate and artesian plain groups show a continuous geochemical evolution through an increase
of Ca/Mg towards the North (Fig. 8 b), with the distance from the volcano. The conductivity increase and Mg2+ enrichment in thevolcano-sedimentary plain, may result from an increase of residence time triggered by an intensive water-rock interaction with clayeyformations (Paternoster et al., 2010). The weathering of the volcano-sedimentary formations allows the dissolution of Mg -richminerals like Olivine ((Mg,Fe)2SiO4) and Pyroxene (X+Y−(SiO3)2). This dissolution together with the North-South groundwater flowdirection explains the Mg+ trend observed on artesian wells towards the North (Fig. 8 b). This relatively linear Mg enrichment forthese 2 groups is well correlated with the electric conductivity and water temperature increases. This spatial evolution of waterchemistry suggests that gravity springs at low elevation and artesian wells/springs belong to the same lithological and hydro-geological system with groundwater aging as it flows towards the North. Gravity springs result from perched aquifers. Direct re-charge, leaking water from these perched aquifers and surface water directly infiltrating to the main basal aquifer supply the multi-layered aquifer feeding the artesian springs and wells. As a consequence, common recharge processes can be considered for theartesian springs/wells and gravity springs of low elevation. The gravity springs above 1700 m.a.s.l. do not exactly show the sameevolution as they are also influenced by different processes, and notably deposits issuing from the active volcanic vents. Regardingthe Ca2+ increase observed on these springs, it may correspond to water rock interaction at the surface of clay-minerals within thepyroclastic complex.
No anthropogenic and volcanic chemical components are significantly observed in the plain system. This suggest a limitedcontribution from the highest part of the volcano to the recharge of the main basal aquifer (SO4) and confirm the limited extension ofagricultural activities compared to the total recharge area of the aquifer (dilution effect).
Two wells (n°7 and 22) follow the same Ca/Mg ratio trend. They are located between Umbulan and Banyu Biru springs andaligned on the supposed SW-NE fault (Fig. 5) which could explain a shorter transit time led by this fault.
The Ranu Grati maar could be a natural outflow from the same type of aquifer(s), at least as regards lithology, but with longerwater/rock interactions.
Fig. 8. a Piper diagram of major ions analysed in springs, wells and lake. b binary plot [Ca2+] vs [Mg2+] for same groundwater samples.
A. Toulier, et al. Journal of Hydrology: Regional Studies 26 (2019) 100634
19
4.4. Isotopic composition of groundwater and rainfall
Water isotopes signatures of groundwater, surface water and precipitation are reported in the Table 2 and plotted in Fig. 9 a.The four rain gauges, from 545 to 2681 m.a.s.l., have sampled one full year of annual cumulated rainfall (April 1st 2017 – March
2018). They show a large range of variation from -7.5 to -11.8‰ for δ18O and from -45.8 to -78.6‰ for δD. The observed δ18Oaltitude gradient for rainfall is consistent with to a Rayleigh adiabatic condensation process. The isotopic signature of groundwatersamples (Fig. 9 b) shows a similar range of variation (-6.6 to -10.8‰ for δ18O and from -37 to -68.8‰ for δD), for an elevation ofsampling locations ranging from about 20 to 2700 m.a.s.l. In the main artesian system of the plain (springs and wells), the range ofvariation is narrower with variations ranging from -6.91 to -7.46‰ for δ18O and from -39.70 to -44.75‰ for δD, strongly suggesting acommon recharge area. The surface water sample (Ranu Grati lake, n° 23), shows the lowest δ18O value and the highest δD (-4.9 and-33.7‰ respectively).
Most of the groundwater samples align above the global meteoric water line (GMWL) and the local meteoric water line (LMWL)calculated from the GNIP station of Jakarta (IAEA, 1961). These results show that rainwater composition undergoes the local to-pographic effects of the volcano. The sample from surface water (Ranu Grati Lake) falls below the LMWL (Fig. 9 b). This positionindicates an evaporation process in good agreement with the stagnation of the lake water and the high temperature in the plain(about 30 °C).
To take into account the local topographic effect on rainwater, the Bromo meteoric water line was calculated (BMWL; Fig. 9 b)from the four rain gauges of the area and the GNIP station of Jakarta (with weighted mean respectively -5.63 and -36.10‰ for δ18O
Fig. 9. a Location map of the water sampled on the Northern flank of the Bromo-Tengger. b δD/δ18O graph. c δ18O/elevation graph.
A. Toulier, et al. Journal of Hydrology: Regional Studies 26 (2019) 100634
20
and δD). The BMWL equation is:
δD‰=7.23 δ18O+7.53 (9)
In addition, four “integrative springs” (n°11, 14, 15 and 17; black crosses, Fig. 9) selected for their short groundwater flow pathsand no relationships with nearby stream water were used as proxies for precipitation to calculate the Bromo spring water line(BSWL), given by the equation:
δD‰=7.71 δ18O+12.37 (10)
The elevation effect is clearly visible for the Northern flank of the Bromo-Tengger (Fig. 9 c) with a δ18O and δD decrease aselevation increases. The Widodaren spring n°16, located at 2200 m.a.s.l., in the inner caldera, does not follow this trend. Its δ18Osignature is similar to the one of the springs from the Northern flank of the Bromo-Tengger, located at about 1800 m.a.s.l elevation.The difference may be explained by the impact of the local volcanic steam from the active vent of Mt Bromo, that probably emits anenriched δ18O.
There is a good correlation between the isotopic composition of the 4 elevations classes of groundwater samples (Fig. 9) and theprecipitation defined by a gradient of -0.19‰ δ18O/100 m from the BSWL and by a gradient -0.23‰ δ18O/100 m from BMWL. Thesegradient values are of the same order of magnitude than those found for other volcanoes in Indonesia such as Merapi (-0.29‰ δ18O/100 m; (Selles, 2014)), or the Vulture volcano in Italy (-0.17‰ δ18O/100 m; (Parisi et al., 2011)).
Nevertheless, a shift is observed between BMWL and BSWL. This shift cannot be solely explained by the isotopic inter-annualvariation; 1962 to 1998 data from the GNIP station of Jakarta show only a seasonal difference of 0.58‰ δ18O. But the fog dripobserved from about 2000 m.a.s.l. on the Bromo-Tengger (section 4.2) may represent a water input to the aquifer which has to betaken into account and may explain this shift. According to (Scholl et al., 2002), fog samples have isotopic signatures enriched by asmuch as 3‰ in δ18O and 21‰ in δD compared to volume-weighted average precipitation at the same elevation. Our field ob-servations comfort this hypothesis as the highest part of the volcano is covered by cloud layers, and fog drip from the trees wasobserved near Seruni rain gauge and spring. This enrichment cannot be observed on the rain isotopic results because rain gauges arelocated on a clear and open area to avoid fog drip or other quantitative artefact from vegetation, but they are registered by thesprings. As elevation decreases, the fog drip effect decreases, reducing the shift between the two lines (BMWL and BSWL).
As a consequence, the BSWL is more representative of the recharge of the aquifer. The δ18O altitudinal gradient from integrativesprings was thus used to infer recharge elevation for the artesian springs and wells (Fig. 9 c). The apparent mean recharge elevation ofthe all artesian springs and wells is from about 700 to 1300 m.a.s.l., +/-150 m if one considers analytical uncertainty (Fig. 9c).
The artesian springs and wells (< 100 m.a.s.l.) seem to have the same isotopic signature than the gravity springs below1300 m.a.s.l., (green square and orange triangle, Fig. 9). Careful hydrogeological interpretation shows that “orange triangle springs”have a small-sized recharge area and can also be considered as “integrative” springs whereas “green square springs” have a largerecharge area and are probably influenced by stream infiltration or connected perched aquifers. Stream infiltration is the mostrelevant explanation as recharge elevation inferred from these springs’ isotopic signature is consistent with the elevation range ofstreams surface watersheds near the springs. These data cannot be used to draw the BSWL.
The highest springs on the northern flank with the lowest isotopic values suggest that they are (i) disconnected from thedownstream groundwater and the artesian plain or (ii) represented a low contribution to the recharge of the main basal aquifer.
4.5. Quantitative modeling of groundwater isotopic signature
- Step I: discretisation of the potential recharge area (refer to Fig. 4 for methodology)
The whole northern flank of the Bromo-Tengger was discretized into 29 slices of 100 m elevation interval (Fig. 10). The medianelevation of each slice is ranging from 50 m.a.s.l. (1st slice) to 2750 m.a.s.l. (28th slice). A 29th slice considers the half surface of theTengger caldera with an elevation of 2150 m.a.s.l. The total surface considered (potential recharge area) is 540.8 km². The first slicewas considered without any potential recharge due to the cover of the low permeability volcano-sedimentary confining unit and theupwards piezometric gradient; it was thus not taken into account. This slice constitutes the northern limit of the potential rechargearea. The western and eastern limits of the potential recharge area are delineated on the basis of geomorphological arguments(Nongkojajar caldera rim to the West and Sapikerep valley to the East) while the southern limit is bounded by the volcano’s summitand the half of the Tengger caldera.
The lowest slices exhibit the largest surface areas (44.7 km2 for the lowest slice). Surface areas progressively decrease whenelevation increases, at the exception of the 29th slice which is larger since it comprises the half of the Tengger caldera (20 km²).
- Steps 2 and 3: Potential recharge computation
Fig. 11 reports the results from the water budget and recharge computation presented at Section 4.2.1. (Fig. 7 b) (ordinate axis) asa function of the elevation of each considered slice (abscissa axis), as well as the δ18O recharge line (BSWL) selected at Section 4.4. Atthis step of the process, recharge is still a “potential recharge” as it does not account for the isotopic composition of the water from theaquifer (here the Umbulan spring) nor for the total outflow (outflow = recharge) from the volcanic aquifer (see steps 4 and 5).
A. Toulier, et al. Journal of Hydrology: Regional Studies 26 (2019) 100634
21
Fig. 10. Discretization of the aquifer potential recharge surface area.
Fig. 11. Computed annual water budget components (R, RET and ER), potential recharge (Re) and δ18O gradient (BSWL) as a function of theelevation. The isotopic signature of the recharge in the caldera is provided by the Temple meteorological station at 2150 m mean elevation.
A. Toulier, et al. Journal of Hydrology: Regional Studies 26 (2019) 100634
22
- Steps 4 and 5: recharge area calibration:
The main outputs from step 3, with recharge = 90.5% of effective rainfall except for the slice of the sea of sand caldera where100% of effective rainfall is considered to infiltrate (i.e. Cinf = 905% as runoff = 9.5%, see section 4.2.1.), are the following:
- δ18O signature of the whole recharge (δ18Ototal) = −7.25‰, to be compared with the average Umbulan spring signature =−7.25‰ (standard deviation = 0.07‰), (Section 4.4) which is used to perform the recharge computations;
- - total estimated outflow/recharge (Qtotal) = 31 000 L.s−1, to be compared with the total outflow measured in the plain of 7 000 Ls−1 (Section 4.2.1).
At this stage, without any calibration, the computed isotopic composition (-7.25‰) is already perfectly fitting to the one of theUmbulan spring (−7.25‰). This result comforts the hypothesis that the recharge occurs along most of the northern flank of theBromo-Tengger volcano. The computed outflow is much higher than the observed one; the surface of the recharge area thus must besignificantly reduced (laterally), by a factor of about 4.4. Then, the recharge distribution (on each slice) is available (Step 4) andillustrated in Fig. 12.
Finally, the step 5 calibration was performed to proportionally reduce the surface area of each slice in order to adjust to themeasured outflow. The proportionality coefficient is 4.43 (31 000/7 000). Then, the total computed recharge area may finally beabout 122 km2.
These results show that most of the northern flank of the Bromo-Tengger may contribute to the recharge of the artesian aquifer.Consequently, the recharge pattern is strongly influenced (i) by the recharge vs elevation relationships, and (ii) by the morphology ofthe northern flank of the volcano (smaller surfaces at high elevation than at the lower ones due to the shape of the volcano). Thelimited contribution of the lowest elevation area of the volcano to aquifer recharge is supported by geological evidences: the cover ofthe lower area by low permeability sediments that confine the artesian aquifer below the about 50 m.a.s.l. elevation line (Fig. 5 a, band 10), and the observed weathering profile developed at the surface of the “Olf” old lava flows (Fig. 5 a and b). Moreover, in thisarea rainfall minus Real Evapotranspiration is at minimum (Fig. 11).
This first estimation also shows that the eastern and western morphological limits chosen at step 1 are far away from the “real”limits of the recharge area.
As a consequence of this recharge pattern, about 80% of the recharge occurs within an elevation range of 150 and 1450 m.a.s.l.,around the R, ER and Re peak (Fig. 12). This result is consistent with the hydrochemistry and isotopic results suggesting a limitedcontribution of the highest part of the volcano. The irregular shape of the recharge values between 750 and 1050 m.a.s.l. is strictlyrelated to the corresponding slices surface area which are locally less or larger in the western part of the potential recharge area (seestep 1). These variations have then no real physical signification and an average 7–8% recharge contribution must be considered. Thecomputed average recharge elevation (computed with the BSWL isotopic line) is 1038 m.a.s.l. However, this value is purely indicativeas was demonstrated by the current computations.
- Sensitivity analysis:
Fig. 12. Recharge distribution vs elevation.
A. Toulier, et al. Journal of Hydrology: Regional Studies 26 (2019) 100634
23
As said above, the quantitative modeling is mainly controlled by the recharge pattern and the recharge surface area distributionalong the volcano’s flank.
The sensitivity analysis (Table 3) shows that not considering the contribution of the caldera has a significant impact on theaquifer’s computed isotopic signature (-7.19‰ vs -7.25‰, all other parameters being the same as described above), but no significantimpact on the aquifer’s water budget (6870 L s−1 vs 7000 L s−1). It then requires to modify the calibration through reducing therecharge at lower elevation (no recharge in the 0–200 m.a.s.l. slices, 76% recharge rather than 90.5% in the 200–300 m.a.s.l. slice).Conversely, if the whole caldera surface (40 km²) is considered, it requires enabling aquifer recharge to occur much lower than the100 m threshold (even below sea level), which is impossible.
This sensitivity analysis shows that this approach is not precise enough to really demonstrate that the caldera is contributing tothe aquifer recharge, but the probability is high. On the other hand, the contribution of the whole caldera is rather inconceivableaccording to isotopic data.
A rainfall variation on all slices, for instance of +/- 15%, has a significant impact on the results. As efficient rainfall, and thenrecharge, does not evolve linearly with rainfall, a 15% decrease of rainfall logically yields a decrease of the aquifer recharge (7000 to5420 L s−1). It triggers also a shift of the computed isotopic signature (from -7.25 to -7.28‰) as the recharge is smaller mainly at thelowest elevations, which also correspond to the largest potential recharge area for the aquifer. Recalibration of the model requiresonly to decrease the contribution of the half caldera with a recharge of 52% of effective rainfall. Conversely, increasing rainfall by15% only requires to reduce the recharge in the lowest 100–200 m.a.s.l. slice of the model to 60% of effective rainfall (against90.5%). Again, similarly to the previous sensitivity test, this result shows the limits of this approach which precision is not enough toprecisely determine the upper and lower limits of the recharge area.
Logically, a similar change in the recharge rate along all the volcano’s flank has no impact on the isotopic signature of therecharging water, but only on the required recharge surface area.
The calibration carried out and the sensitivity analysis clearly shows that the recharge surely occurs along most of the volcano’sflank. Furthermore, as there is neither geological nor hydrogeological change along the flank of the volcano, the recharge pattern ismainly controlled by the effective rainfall distribution and the morphology of the volcano (surface area distribution vs elevation).
5. Discussion and implications for the conceptual hydrogeological model
5.1. Hydrogeological structure and functioning
The hydrogeological structure of the northern flank of the volcano comprises two main geological units:
- (i) an upstream volcanic geological unit mostly composed of pyroclastic and lava flow series (PC and LFC). Despite the geologicalcomplexity of these formations, this volcanic unit hydrogeologically appears as homogeneous and permeable at the scale of thewhole northern flank of the volcano. The pyroclastic formations display an interstice porosity whereas the lavas exhibit both aninterstice porosity (clinker layers) and a cooling fractures porosity. These hydrogeological formations host an unconfined aquifer,similar to a “basal aquifer” described in other shield volcanoes such as in Hawaii and parts of Reunion Island, where piezometriclevel is very deep and covered by a thick vadose zone. Local aquifers perched on ash layers and cooked paleo-soil formations feeda few low discharge springs (inter and under lava springs (Naud, 1971)) on the flank of the volcano. Isotopic results confirm thesmall extension of their hydrogeological catchment (about 0.5 km2 on average). If these local impervious layers are leaking, theseperched aquifers also partly recharge the basal aquifer. This volcanic hydrogeological unit is limited to the south by the Tenggercaldera summit. West and East the geological limits of the studied aquifer where not precisely identified; the results of the studyshows that they are much less far than the Nongkojajar caldera rim and the Sapikarep valley.
- (ii) a downstream volcano-sedimentary unit composed of volcanic coarse sand (interstratified reworked ashfall, lahar, tuff)bounded to the North by distal clayey deposits. The superficial part of the plain is composed of shallow unconfined aquifer
Table 3Results of the sensitivity analysis. The reference scenario is based on recharge in half of the caldera and satisfying (1) the δ18O measured at Umbulanspring and (2) the outflow measured in the plain. In comparison with the reference scenario, various adjustments are tested (1. no contribution ofthe caldera or full caldera and 2. +/- 15% of rainfall).
Reference scenario Sensitivity analysis
Caldera contribution Rainfall variation
Parameters Half caldera 20 km² No caldera Full caldera 40 km² −15% + 15%(1) δ18O (‰) −7.25 −7.19 −7.31 −7.28 −7.23
RecalibrationRecharge slice (%) 0% 0-100 m 0% 0-200m 90.5% <0m 0% 0-100 m 0% 0-100mdistribution 90.5% 100-2800m 76% 200-300m 90.5% 0-2800m 90.5% 100-2800m 60% 100-200mfitting the Cinf 90.5% 300-2800m 100% full caldera 52% half caldera 90.5% 200-2800m
0% half caldera 100% half caldera
A. Toulier, et al. Journal of Hydrology: Regional Studies 26 (2019) 100634
24
described as low permeability volcanic tuff intercalated with permeable fluvial deposits. The runoff coming from the rivers flankprovides water to the shallow aquifer. The confining unit identified around 30 m deep probably explains the presence of artesianaquifer in the plain. This aquifer also comprises ash fall deposits and consolidated breccia mostly impermeable, which provide itthe characteristics of a multilayer confined aquifer system. This aquifer is in continuity with the upstream volcanic basal aquifer.The hydrochemistry results (notably Ca/Mg) demonstrate a groundwater flowing and aging towards the North. A SW-NE faultsystem could explain the alignment of high discharge artesian springs (Umbulan) and maar. The other main outflow from thisaquifer is due to human activities in the plain with about 600 artesian wells.
The transition between the upstream volcanic hydrogeological unit and the downstream volcano-sedimentary hydrogeologicalunit is rather well constrained spatially from field geological observations, and also from the southern limit of the artesian wells. It ishowever not well described in terms of geological structure. The detailed characterization of this transition zone would requiremodern drilling techniques, which are not available among the local drillers, and geophysical measurements. However, thisknowledge is not of prime interest for the understanding of the aquifer’s functioning neither for its management.
5.2. Recharge distribution and hydrogeological balance
The recharge occurs on the whole northern flank of the volcano within the andesite lava flows series and the pyroclastic complex(LFC and PC) However, hydrochemical and isotopic results suggest a low contribution of the highest volcano part (> 1700 m.a.s.l.)and an apparent mean recharge elevation of about 1000 m.a.s.l. The Bromo spring water line (*BSWL) inferred from integrativesprings is a cost-effective robust way to characterize the isotopic gradient on the volcano. Such measurements enable to avoidartefacts such as seasonal rainfall selection (Blavoux et al., 2013), and to account for fog drip observed on the Bromo-Tengger. Thereare still some questions regarding the proportion of recharge input from fog drip, that was not explicitly quantitatively computed atthis stage of the research. Complex interception models, such as the Rutter-Type, (Rutter et al., 1972) could be used to better quantifyit, or even working on the shift between this BSWL and the rainfall line (BMWL).
Lower than expected groundwater temperatures in the plain (between 23 and 25 °C, whereas the expected shallow localgroundwater temperature should be about 30 °C) qualitatively confirm that recharge occurs at high elevation. Based on this quan-titative modeling of groundwater isotopic content, 80% of the recharge occurs between 150 and 1450 m.a.s.l. The recharge is mainlycontrolled by the rainfall spatial distribution, itself strongly impacted by seasonal and elevation effect. The rainfall reaches 4000 mmyear−1 at 1200 m.a.s.l. with 79–91% of which occurring during the wet season. The low precipitations recorded on the highestvolcano part associated by the δ18O impoverished values excludes the Tengger caldera as being the main recharge zone but it is quitesure that it contributes to the recharge. An additional hypothesis is to consider the Tengger caldera with a North-East groundwaterflow circulation supplying gravity springs along the Sapikerep collapse valley. The Sapikerep collapse formations may represent apreferential drainage network in agreement with other large landslides of deep erosion in volcanic context, as is the case in TenerifeIsland (Marrero-Diaz et al., 2015). This could be confirmed/infirmed by isotopic measurements at these springs.
In 2018, the outflow measured from the studied hydrogeological system occur within the volcano-sedimentary unit and is about7000 L s−1. The artesian springs constitute a large part of this outflow (about 60%), the rest is mostly flowing out from the artesianwells. A water budget estimation on a representative watershed indicates an effective rainfall infiltration of about 90.5% (i.e. 66% ofrainfall). Based on the previous quantitative insights, recharge surface area on the northern volcano flank is estimated to about 120km². However, the lateral extension of the recharge area should be precised to enable the real delineation of the recharge area. Othertracers than water isotopes could be used.
5.3. Towards a conceptual hydrogeological model
The new insights previously described enable to build a robust hydrogeological conceptual model of the northern flank of theBromo-Tengger (Fig. 13 a and b), inferred from a high-resolution and multidisciplinary approach.
The hydrogeological observations performed on the Bromo-Tengger volcano can be compared with the main volcanic hydro-geological conceptual model illustrated by the Hawaiian (Ingebritsen and Scholl, 1993) and the Canarian manifestations (Custodio,2007; Hemmings et al., 2015a). The high permeability apron, the presence of perched aquifers and the related thick vadose zone ofthe Bromo-Tengger show many similarities with the Oahu island in Hawaii (Nichols et al., 1996), additionally with the presence of anartesian basin such as in Honolulu. However, in the proximal zone of the Bromo-Tengger, there is no clear indication whether avolcanic core exists or not. Neither highly altered rocks nor dike clusters have been observed on the field, but this may be due to thelack of deep erosion incisions in this part of the volcano. On the basis of the andesitic-volcano architecture described in Indonesiasuch as in Merapi (Selles et al., 2015), we may assume an inner structure with a volcanic core but probably occupying a low to middleelevation because of the absence of gravity springs at high elevation, enabling a thick unsaturated zone (Cruz-Fuentes et al., 2014;Herrera and Custodio, 2008). The main differences between the Bromo-Tengger and the conceptual model of basaltic islands are:
- the presence of ignimbrite deposits (Sapikerep valley and North Ranu Grati), maybe playing an important role within the con-fining layers;
- a more complex volcanic architecture of the Tengger edifice induced by separated or partially overlapping, with a wide spectrumof different cumulative structures such as the calderas.
A. Toulier, et al. Journal of Hydrology: Regional Studies 26 (2019) 100634
25
Fig. 13. Hydrogeological conceptual model of the northern part of Bromo-Tengger volcano with a. the location map showing the main hydro-geological units, the main recharge area (whole flank), the groundwater samples plotted according four elevation groups and types. Arrow with fulland dashed black line show respectively the groundwater flow circulation identified or assumed. b. Schematic N–S cross section of northern volcanoflank showing the groundwater flow paths according to the identified recharge locations and the atmospheric circulation features from the sea to theTengger caldera summit.
A. Toulier, et al. Journal of Hydrology: Regional Studies 26 (2019) 100634
26
5.4. Perspectives
Now that a hydrogeological conceptual model is proposed, it opens-up perspectives for a complete deterministic 3D modeling ofthis complex hydrosystem, necessary to set-up quantitative management scenarios of this groundwater resource. Complementaryfield investigations with a piezometric survey in the plain will notably precise the West-East extension of the downstream aquifer.Modeling of δ18O from the recharge area to and within the downstream aquifer may enable explaining the slight spatial δ18Ovariations observed in the plain. Then, precise the aquifer recharge area, especially to identify the eventual hydrogeological role ofthe Nongkojajar caldera. The study of the other flanks of the volcano may provide a thorough understanding of the global hydro-geology of the Bromo-Tengger. Groundwater age dating is scheduled and will provide precious residence time data, necessary toprevent some pollution impacts, such as those induced by anthropogenic pressures on the northern flank of the volcano.
6. Conclusions
This multidisciplinary study comprising geological, hydrometeorological monitoring, hydrochemical and isotopic approaches,together with a simple quantitative modeling of groundwater isotopic content allowed designing the hydrogeological structure andfunctioning of a complex andesitic system such as the Bromo-Tengger volcano. Only a combination of results, each obtained from onediscipline, allows to build a robust conceptual model of the Bromo-Tengger.
On this volcano, two main hydrogeological systems are identified:
- the upstream host aquifer rock is composed of an andesite lava flows series topped with a pyroclastic series. These formations,geologically complex in details, appear as homogeneous and permeable at the volcano scale. They host a basal aquifer and a fewperched aquifers, the latest being characterised by low discharge gravity springs. The basal aquifer supplies the volcano-sedi-mentary aquifer from the plain;
- the downstream part is characterised by a multilayer volcano sedimentary confined aquifer. It gives rise to high discharge artesiansprings (such as Umbulan) and numerous artesian wells.
The realistic modeling of groundwater isotopic content, supported by isotopic data and the water budget of the northern flank ofthe Bromo-Tengger, shows that the recharge occurs along the whole northern flank of the volcano. It is mostly controlled by oro-graphic effects that trigger the rainfall spatial distribution. As a consequence of this recharge pattern, about 80% of the rechargeoccurs within an elevation range of 150 and 1450 m.a.s.l., around the R, ER and Re peak. The contribution of the Tengger caldera torecharge is then limited.
The insights presented here provide first valid hydrogeological constraints for further 3D numerical modeling to assess theresponse of the aquifer to anthropogenic and climate changes, on the basis of various simulation scenarios.
Declaration of Competing Interest
None.
Acknowledgements
This research was carried out in the frame of a PhD research part of the Rejoso Kita project which is co-realized by Danone AQUA,International Centre for Research in Agroforestry (ICRAF), Social investment of Indonesia (SII) and CKNet foundation, with thefinancial support of Danone Aqua and Danone Ecosystem Indonesia. Scientific and logistic supports from Gadjah Mada University isgratefully acknowledged. We thank the Montpellier (France) LAMA and Hydrosciences laboratories for the chemical and isotopicanalyses of water samples. The authors gratefully acknowledge the partnership and authorizations provided by the Ministry ofResearch, Technology and Higher Education of Indonesia (RISTEKDIKTI) and the Bromo Tengger Semeru National Park (TNBTS) forthe free access to the Tengger caldera zone. Assistance from Mas Kevin, Mas Yuda and Mas Ahmad during field measurements werevery appreciated while logistic support delivered from Jean Luc Bonjour has facilitated this research. We also warmly thank theEditor-in-Chief, Patrick Willems, as well as the 3 reviewers, E. Custodio and two anonymous, for their constructive comments thathelped improving this paper.
A. Toulier, et al. Journal of Hydrology: Regional Studies 26 (2019) 100634
27
Appendix A
Appendix B. Supplementary data
Supplementary material related to this article can be found, in the online version, at doi:https://doi.org/10.1016/j.ejrh.2019.100634.
References
Aiuppa, A., Bani, P., Moussallam, Y., Di Napoli, R., Allard, P., Gunawan, H., Hendrasto, M., Tamburello, G., 2015. First determination of magma-derived gas emissionsfrom Bromo volcano, eastern Java (Indonesia). J. Volcanol. Geotherm. Res. 304, 206–213. https://doi.org/10.1016/j.jvolgeores.2015.09.008.
Bachri, S., Stötter, J., Monreal, M., Sartohadi, J., 2015. The calamity of eruptions, or an eruption of benefits? Mt. Bromo human-volcano system a case study of anopen-risk perception. Nat. Hazards Earth Syst. Sci. Discuss. 15, 277–290. https://doi.org/10.5194/nhess-15-277-2015.
Bani, P., Surono Hendrasto, M., Gunawan, H., Primulyana, S., 2013. Sulfur dioxide emissions from Papandayan and Bromo, two indonesian volcanoes. Nat. HazardsEarth Syst. Sci. Discuss. 13, 2399–2407. https://doi.org/10.5194/nhess-13-2399-2013.
Blavoux, B., Lachassagne, P., Henriot, A., Ladouche, B., Marc, V., Beley, J.J., Nicoud, G., Olive, P., 2013. A fifty-year chronicle of tritium data for characterising thefunctioning of the Evian and Thonon (France) glacial aquifers. J. Hydrol. 494, 116–133. https://doi.org/10.1016/j.jhydrol.2013.04.029.
BMKG, 2018. . Badan Meteorologi Klimatologi Dan Geofisika (BMKG), Rainfall Dataset 2018. Malang.Bourlier, P.Y., Lachassagne, P., Desprats, J.F., Gille, E., 2005. Nouveaux éléments sur la structure et le fonctionnement hydrogéologique du plateau basaltique de
l’Aubrac (Massif central, France). Première évaluation des potentialités en eau souterraine. C. R. - Geosci. 337, 663–673. https://doi.org/10.1016/j.crte.2005.01.014.
BPS-Statistics Indonesia, 2017. Statistical Yearbook of Indonesia 2017. BPS-Statistics Indones, pp. 750. Accessed date: 12 Janurary 2019. https://www.bps.go.id/website/pdf_publikasi/Statistik-Indonesia-2017.pdf.
Breuer, B.A., Koch, M., Bardsley, E.W., 2000. Modeling the feasibility of tapping artesian flow to augment winter baseflows in a hydropower catchment in NewZealand. Water Stud. 7, 325–334.
Cabusson, B., 2012. Formation de caldera par fluage d’un système hydrothermal volcanique. Thèse, Université Blaise Pascal - Clermond Ferrand.Charlier, J.B., Lachassagne, P., Ladouche, B., Cattan, P., Moussa, R., Voltz, M., 2011. Structure and hydrogeological functioning of an insular tropical humid andesitic
volcanic watershed: a multi-disciplinary experimental approach. J. Hydrol. 398, 155–170. https://doi.org/10.1016/j.jhydrol.2010.10.006.Cochrane, J., 2006. Indonesian national parks. Understanding leisure users. Ann. Tour. Res. 33, 979–997. https://doi.org/10.1016/j.annals.2006.03.018.
Fig. A1. Lithological description of the log obtained during the 2016–2017 drillings survey.
A. Toulier, et al. Journal of Hydrology: Regional Studies 26 (2019) 100634
Cole, J.W., Milner, D.M., Spinks, K.D., 2005. Calderas and caldera structures: a review. Earth-Sci. Rev. 69, 1–26. https://doi.org/10.1016/j.earscirev.2004.06.004.Craig, H., 1961. Isotopic variations in meteoric waters. Science 133 (3465), 1702–1703. https://doi.org/10.1126/science.133.3465.1702.Cruz-Fuentes, T., Heredia, J., Cabrera, M.C., Custodio, E., 2014. Behaviour of a small sedimentary volcanic aquifer receiving irrigation return flows: La Aldea, Gran
Canaria, Canary Islands (Spain). Hydrogeol. J. 22, 865–882. https://doi.org/10.1007/s10040-013-1094-9.Custodio, E., 2007. Groundwater in volcanic hard rocks. In: Krásn´y, J., Sharp, J.M. (Eds.), Groundw. Fract. Rocks IAH Sel. Pap. Ser.Taylor and Francis, pp. 95–108.
https://doi.org/10.1201/9780203945650.ch5. (Chapter 5).Custodio, E., Cabrera, M., del, C., Poncela, R., Puga, L.O., Skupien, E., del Villar, A., 2016. Groundwater intensive exploitation and mining in Gran Canaria and
Tenerife, Canary Islands, Spain: hydrogeological, environmental, economic and social aspects. Sci. Total Environ. 557–558, 425–437. https://doi.org/10.1016/j.scitotenv.2016.03.038.
Dewandel, B., Alazard, M., Lachassagne, P., Bailly-Comte, V., Couëffé, R., Grataloup, S., Ladouche, B., Lanini, S., Maréchal, J.C., Wyns, R., 2017. Respective roles of theweathering profile and the tectonic fractures in the structure and functioning of crystalline thermo-mineral carbo-gaseous aquifers. J. Hydrol. 547, 690–707.https://doi.org/10.1016/j.jhydrol.2017.02.028.
Farr, T.G., Rosen, P.A., Caro, E., Crippen, R., Duren, R., Hensley, S., Kobrick, M., Paller, M., Rodriguez, E., Roth, L., Seal, D., Shaffer, S., Shimada, J., Umland, J.,Werner, M., Oskin, M., Burbank, D., Alsdorf, D., 2007. The shuttle radar topography mission. Rev. Geophys. 45, RG2004. https://doi.org/10.1029/2005RG000183.
Gat, J.R., 1996. Oxygen and hydrogen isotopes in the hydrologic cycle. Annu. Rev. Earth Planet. Sci. 24, 225–262. https://doi.org/10.1146/annurev.earth.24.1.225.Gonfiantini, R., Roche, M., Olivry, J., Fontes, J., Zuppi, G., 2001. The altitude effect on the isotopic composition of tropical rains. Chem. Geol. 181, 147–167.Gottschämmer, E., Surono, I., 2000. Locating tremor and shock sources recorded at Bromo Volcano. J. Volcanol. Geotherm. Res. 101, 199–209. https://doi.org/10.
Luckman, B.H., Myglan, V.S., Guiot, J., Beniston, M., Masson-Delmotte, V., Oppenheimer, C., 2017. Climate response to the Samalas volcanic eruption in 1257revealed by proxy records. Nat. Geosci. 10, 123–128. https://doi.org/10.1038/ngeo2875.
Hamilton, W., 1988. Plate tectonics and island arcs. Geol. Soc. Am. Bull. 100.Hamm, S.Y., Cheong, J.Y., Jang, S., Jung, C.Y., Kim, B.S., 2005. Relationship between transmissivity and specific capacity in the volcanic aquifers of Jeju Island, Korea.
J. Hydrol. 310, 111–121. https://doi.org/10.1016/j.jhydrol.2004.12.006.Heilweil, V.M., Solomon, D.K., Gingerich, S.B., Verstraeten, I.M., 2009. Oxygen, Hydrogen, and Helium Isotopes for Investigating Groundwater Systems of the Cape
Verde Islands, West Africa. pp. 1157–1174. https://doi.org/10.1007/s10040-009-0434-2.Hemmings, B., Gooddy, D., Whitaker, F., George Darling, W., Jasim, A., Gottsmann, J., 2015a. Groundwater recharge and flow on Montserrat, West Indies: insights
from groundwater dating. J. Hydrol. Reg. Stud. 4, 611–622. https://doi.org/10.1016/j.ejrh.2015.08.003.Hemmings, B., Whitaker, F., Gottsmann, J., Hughes, A., 2015b. Hydrogeology of Montserrat review and new insights. J. Hydrol. Reg. Stud. 3, 1–30. https://doi.org/10.
1016/j.ejrh.2014.08.008.Herrera, C., Custodio, E., 2008. Conceptual hydrogeological model of volcanic Easter Island (Chile) after chemical and isotopic surveys. Hydrogeol. J. 16, 1329–1348.
https://doi.org/10.1007/s10040-008-0316-z.Hildenbrand, A., Marlin, C., Conroy, A., Gillot, P., Filly, A., Massault, M., 2005. Isotopic approach of rainfall and groundwater circulation in the volcanic structure of
Tahiti-Nui (French Polynesia). J. Hydrol. 302, 187–208. https://doi.org/10.1016/j.jhydrol.2004.07.006.Hughes, C., Crawford, J., 2012. A new precipitation weighted method for determining the meteoric water line for hydrological applications demonstrated using
Australian and global GNIP data. J. Hydrol. https://doi.org/10.1016/j.jhydrol.2012.07.029.IAEA, 1961. Global Network of Isotopes in Precipitation (GNIP). Accessed date: 10 December 2018. http://www-naweb.iaea.org/.Ingebritsen, S., Scholl, M., 1993. The hydrogeology of Kilauea volcano. Geothermics. https://doi.org/10.1016/0375-6505(93)90003-6.Izquierdo, T., 2014. Conceptual hydrogeological model and aquifer system classification of a small volcanic island (La Gomera; Canary Islands). Catena 114, 119–128.
https://doi.org/10.1016/j.catena.2013.11.006.Jones, I.C., Banner, J.L., Humphrey, J.D., 2000. Estimating recharge in a tropical karst aquifer. Water Resour. Res. https://doi.org/10.1029/1999WR900358.Kereszturi, G., Nmeth, K., 2012. Monogenetic basaltic volcanoes: genetic classification, growth, geomorphology and degradation, in: updates in volcanology - new
advances in understanding volcanic systems. InTech. https://doi.org/10.5772/51387.Kummerow, C., Barnes, W., Kozu, T., Shiue, J., Simpson, J., 1998. The Tropical Rainfall Measuring Mission (TRMM) sensor package. J. Atmos. Ocean. Technol. 15,
809–817. https://doi.org/10.1175/1520-0426(1998)015<0809:TTRMMT>2.0.CO;2.Lachassagne, P., Aunay, B., Frissant, N., Guilbert, M., Malard, A., 2014. High-resolution conceptual hydrogeological model of complex basaltic volcanic islands: a
Mayotte, Comoros, case study. Terra Nov. 26, 307–321. https://doi.org/10.1111/ter.12102.Maréchal, J.C., Lachassagne, P., Ladouche, B., Dewandel, B., Lanini, S., Le Strat, P., Petelet-Giraud, E., 2014. Structure and hydrogeochemical functioning of a
sparkling Natural mineral water system determined using a multidisciplinary approach: a case study from southern France. Hydrogeol. J. 22, 47–68. https://doi.org/10.1007/s10040-013-1073-1.
Marliyani, G.I., 2016. Neotectonics of Java, Indonesia: Crustal Deformation in the Overriding Plate of an Orthogonal Subduction System. Arizona State University.Marrero-Diaz, R., Alcalá, F.J., Pérez, N.M., López, D.L., Melián, G.V., Padrón, E., Padilla, G.D., 2015. Aquifer recharge estimation through atmospheric chloride mass
balance at Las Cañadas Caldera, Tenerife, Canary Islands, Spain. Water (Switzerland) 7, 2451–2471. https://doi.org/10.3390/w7052451.Martens, B., Miralles, D.G., Lievens, H., Schalie, R., Van Der, Jeu, R.A.M.De, 2017. GLEAM v3: Satellite-based Land Evaporation and Root-zone Soil Moisture. pp.
1903–1925. https://doi.org/10.5194/gmd-10-1903-2017.Mazzini, A., Scholz, F., Svensen, H.H., Hensen, C., Hadi, S., 2017. The geochemistry and origin of the hydrothermal water erupted at Lusi, Indonesia. Mar. Pet. Geol.
15. https://doi.org/10.1016/j.marpetgeo.2017.06.018.Moscariello, A., Do Couto, D., Mondino, F., Booth, J., Lupi, M., Mazzini, A., 2017. Genesis and evolution of the Watukosek fault system in the Lusi area (East Java).
Mar. Pet. Geol. https://doi.org/10.1016/j.marpetgeo.2017.09.032.Mulligan, B.M., Ryan, M.C., Cámbara, T.P., 2011. Delineating volcanic aquifer recharge areas using geochemical and isotopic tools. Hydrogeol. J. 19, 1335–1347.
https://doi.org/10.1007/s10040-011-0766-6.Mulyadi, E., 1992. Le complexe de Bromo-Tengger (Est Java, Indonesie): Etude structurale et volcanologique. PhD thesis. Université Blaise Pascal - Clermont Ferrand.Naud, G., 1971. Contribution à l’étude géologique et hydrogéologique du massif du Coiron partie orientale. Université de Provence, Ardèche.Neumann van Padang, M., 1951. Catalogue of the active volcanoes of Indonesia. International Volcanological Association.Newhall, C.G., Dzurisin, D., 1988. Historical Unrest at Large Calderas of the World. https://doi.org/10.3133/b1855.Newhall, C.G., Self, S., 1982. The volcanic explosivity index (VEI) an estimate of explosive magnitude for historical volcanism. J. Geophys. Res. 87, 1231–1238.
https://doi.org/10.1029/JC087iC02p01231.Nichols, W.D., Shade, P.J., Hunt Jr, C.D., 1996. Summary of the Oahu, Hawaii, Regional Aquifer-system Analysis. U.S. Geological Survey Professional Paper 1412-A.Pambudi, N.A., 2018. Geothermal power generation in Indonesia, a country within the ring of fire: current status, future development and policy. Renew. Sustain.
Energy Rev. 81, 2893–2901. https://doi.org/10.1016/j.rser.2017.06.096.Parisi, S., Paternoster, M., Kohfahl, C., Pekdeger, A., Meyer, H., Hubberten, H.W., Spilotro, G., Mongelli, G., 2011. Groundwater recharge areas of a volcanic aquifer
system inferred from hydraulic, hydrogeochemical and stable isotope data: mount Vulture, southern Italy. Hydrogeol. J. 19, 133–153. https://doi.org/10.1007/s10040-010-0619-8.
Paternoster, M., Parisi, S., Caracausi, A., Favara, R., Mongelli, G., 2010. Groundwaters of Mt. Vulture volcano, southern Italy: chemistry and sulfur isotope compositionof dissolved sulfate. Geochem. J. 44, 125–135. https://doi.org/10.2343/geochemj.1.0050.
Peterson, F.L., 1972. Water development on tropic volcanic islands - type example: Hawaii. Groundwater. https://doi.org/10.1111/j.1745-6584.1972.tb03586.x.Ponce, V., Shetty, A.V., 1995. A conceptual model of catchment water balance : 1. Formulation and calibration. Elsevier. J. Hydrol. 173, 27–40.Prada, S., Prada, S., Cruz, J.V., Figueira, C., 2016. Using stable isotopes to characterize groundwater recharge sources in the volcanic island of Madeira, Portugal using
A. Toulier, et al. Journal of Hydrology: Regional Studies 26 (2019) 100634
stable isotopes to characterize groundwater recharge sources in the volcanic island of Madeira, Portugal. J. Hydrol. 536, 409–425. https://doi.org/10.1016/j.jhydrol.2016.03.009.
Pryet, A., D’Ozouville, N., Violette, S., Deffontaines, B., Auken, E., 2012a. Hydrogeological settings of a volcanic island (San CristÃ3bal, Galapagos) from jointinterpretation of airborne electromagnetics and geomorphological observations. Hydrol. Earth Syst. Sci. Discuss. 16, 4571–4579. https://doi.org/10.5194/hess-16-4571-2012.
Pryet, Alexandre, Domínguez, C., Tomai, P.F., Chaumont, C., D’Ozouville, N., Villacís, M., Violette, S., 2012b. Quantification of cloud water interception along thewindward slope of Santa Cruz Island, Galapagos (Ecuador). Agric. For. Meteorol. 161, 94–106. https://doi.org/10.1016/j.agrformet.2012.03.018.
Rouquet, S.I., Boivin, P.I., Lachassagne, P.A., Ledoux, E.M., 2012. A 3D genetic approach to high-resolution geological modelling of the volcanic infill of a paleovalleysystem. Application to the Volvic catchment (Chaîne des Puys, France). pp. 395–407.
Rutter, A.J., Kershaw, K.A., Robins, P.C., Morton, A.J., 1972. A predictive model of rainfall interception in forests, Derivation of the model from observation in aplantation of corsican pine. Agric. Meteorol. J. 9, 367–384.
Santosa, S., Suwarti, T., Suharsnono, 1992. Geological Map of Bromo-tengger (Malang, Probolinggo, Turen and Lumajang Quadrangle). Bandung.Scholl, M., Gingerich, S.W., Tribble, G., 2002. The influence of microclimates and fog on stable isotope signatures used in interpretation of regional hydrology: east
Maui, Hawaii. J. Hydrol. https://doi.org/10.1016/S0022-1694(02)00073-2.Scholl, M.A., Ingebritsen, S.E., Janik, C.J., Kauahikaua, J.P., 1996. Use of precipitation and groundwater isotopes to interpret regional hydrology on a tropical volcanic
island: kilauea Volcano Area, Hawaii. Hydrogeochem. Water Chem. 32 (12), 3525–3537.Selles, A., 2014. Multi-disciplinary study on the hydrogeological behaviour of the eastern flank of the Merapi volcano, Central Java. Université Pierre et Marie Curie -
Paris, Indonesia PhD thesis.Selles, A., Deffontaines, B., Hendrayana, H., Violette, S., 2015. The eastern flank of the Merapi volcano (Central Java, Indonesia): architecture and implications of
volcaniclastic deposits. J. Asian Earth Sci. 108, 33–47. https://doi.org/10.1016/j.jseaes.2015.04.026.Soekardi Puspowardoyo, R., 1985. Hydrogeological Map of Indonesia (1:250 000). Bandung, Indonesia.Susilohadi, 1995. Late Tertiary and Quaternary Geology of the East Java Basin, Indonesia.Thornthwaite, C.W., 1948. An approach toward a rational classification of climate. Geogr. Rev. 38 (1), 55–94 105, 109, 122, 136.Thouret, J.C., 1999. Volcanic geomorphology-an overview. Earth. Rev. 47, 95–131. https://doi.org/10.1016/S0012-8252(99)00014-8.Tropical Rainfall Measuring Mission (TRMM), 2011. Tropical Rainfall Measuring Mission (TRMM). https://doi.org/10.5067/TRMM/TMPA/3H/7. Accessed date: 1
January 2019. https://giovanni.gsfc.nasa.gov/giovanni/.UNESCO, U.N.E, S.O, 2012. International Glossary of Hydrology, IHP/OHP-Berichte.Van Gerven, M., Pichler, H., 1995. Some aspects of the volcanology and geochemistry of the Tengger Caldera, Java, Indonesia: eruption of a K-rich tholeiitic series. J.
Southeast Asian Earth Sci. 11, 125–133. https://doi.org/10.1016/0743-9547(95)00003-B.Vittecoq, B., Lachassagne, P., Lanini, S., Maréchal, J.C., 2010. Assessment of Martinique (FWI) water resources: effective rainfall spatial modelling and validation at
catchment scale. Rev. Des. Sci. l’eau 23, 361. https://doi.org/10.7202/045098ar.Vittecoq, B., Reninger, P.A., Violette, S., Martelet, G., Dewandel, B., Audru, J.C., 2015. Heterogeneity of hydrodynamic properties and groundwater circulation of a
coastal andesitic volcanic aquifer controlled by tectonic induced faults and rock fracturing - Martinique island (Lesser Antilles - FWI). J. Hydrol. 529, 1041–1059.https://doi.org/10.1016/j.jhydrol.2015.09.022.
Whittier, R.B., Rotzoll, K., Dhal, S., El-Kadi, A.I., Ray, C., Chang, D., 2010. Groundwater source assessment program for the state of Hawaii, USA: methodology andexample application. Hydrogeol. J. 18, 711–723. https://doi.org/10.1007/s10040-009-0548-6.
Zaennudin, A., Hadisantono, R.D., Erfan, R.D., Mulyana, A., 1994. Geological Map of Bromo-tengger Volcano, East Java. Direktorat Vulkanologi, Bandung, pp.1992–2004 Indonesia.
A. Toulier, et al. Journal of Hydrology: Regional Studies 26 (2019) 100634


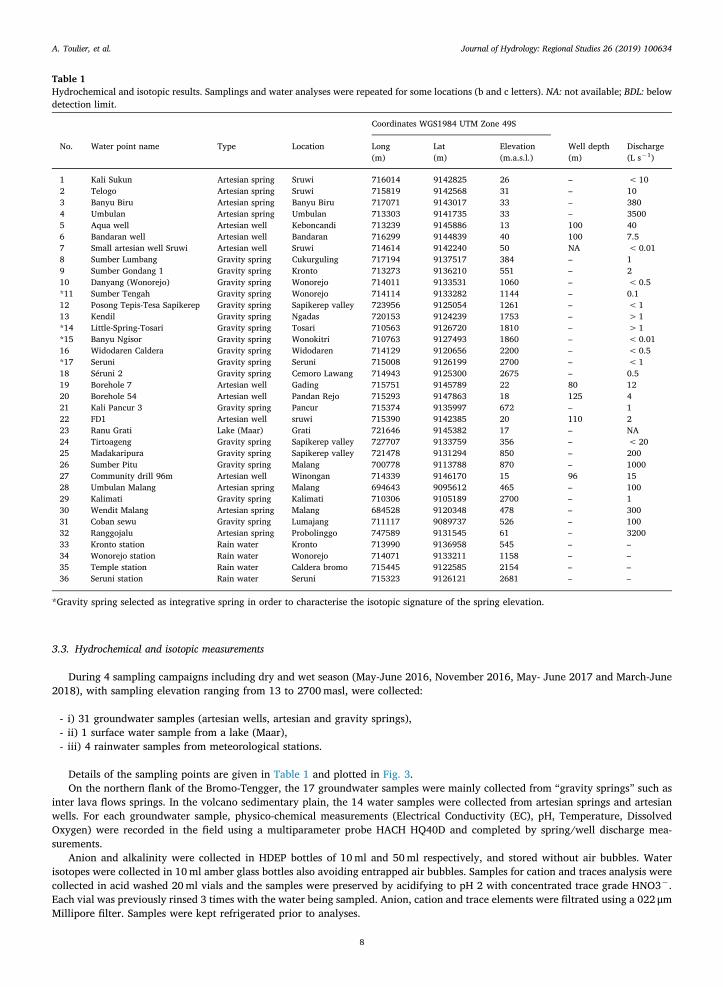


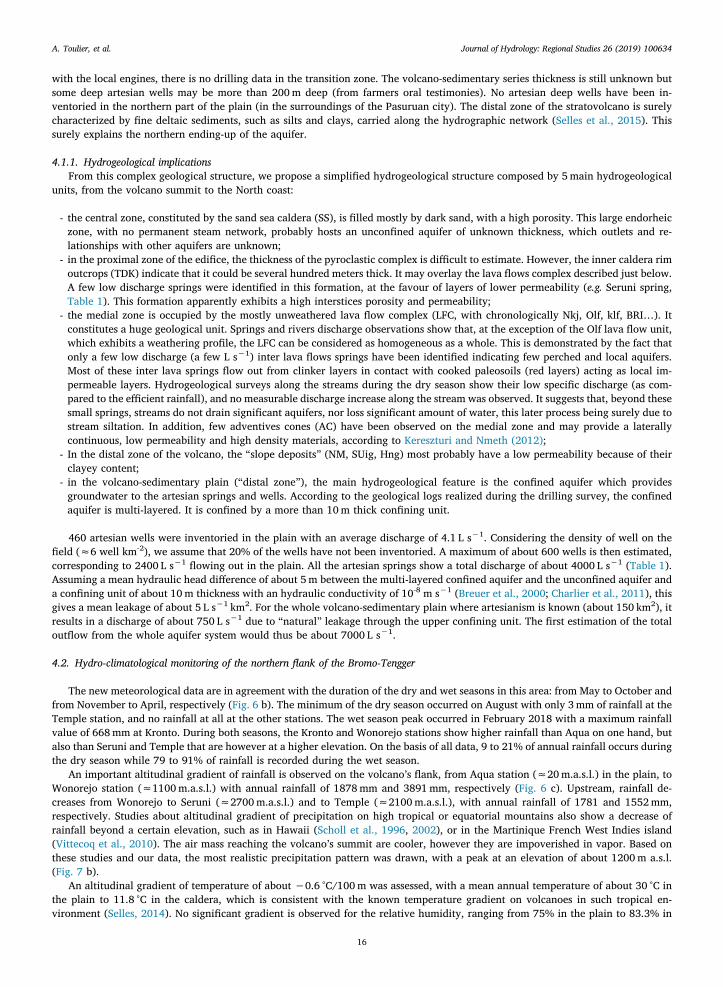


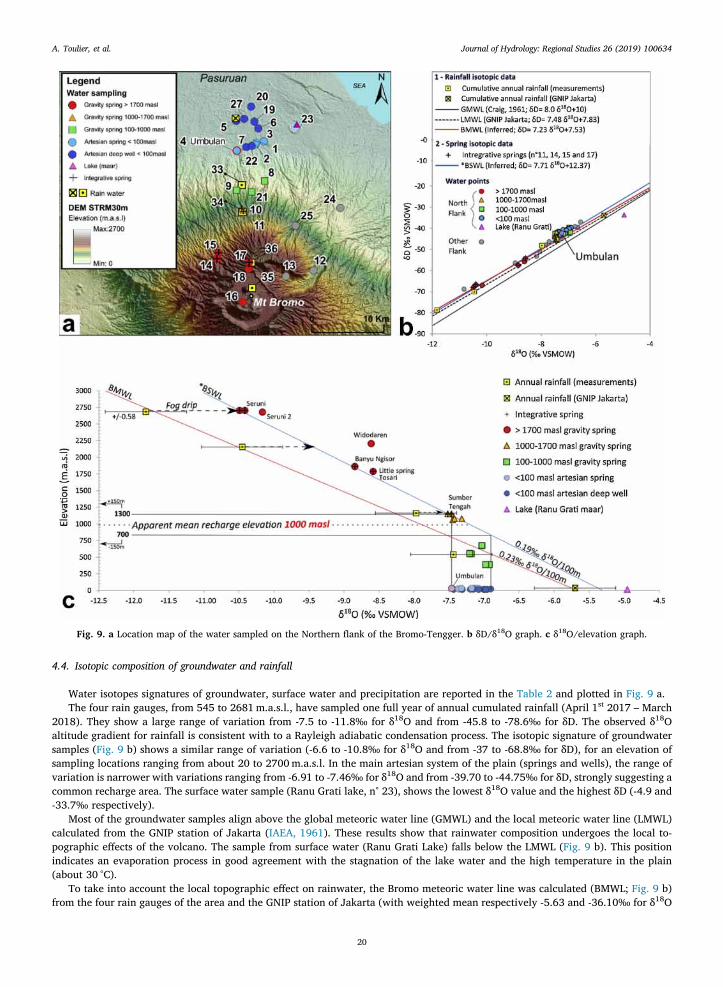


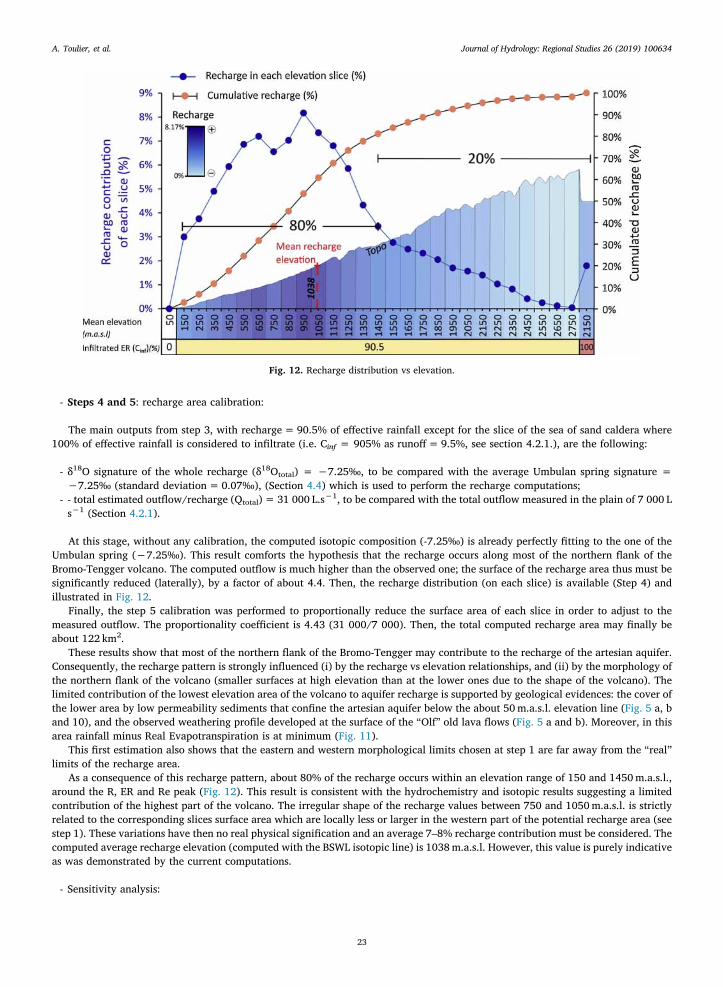


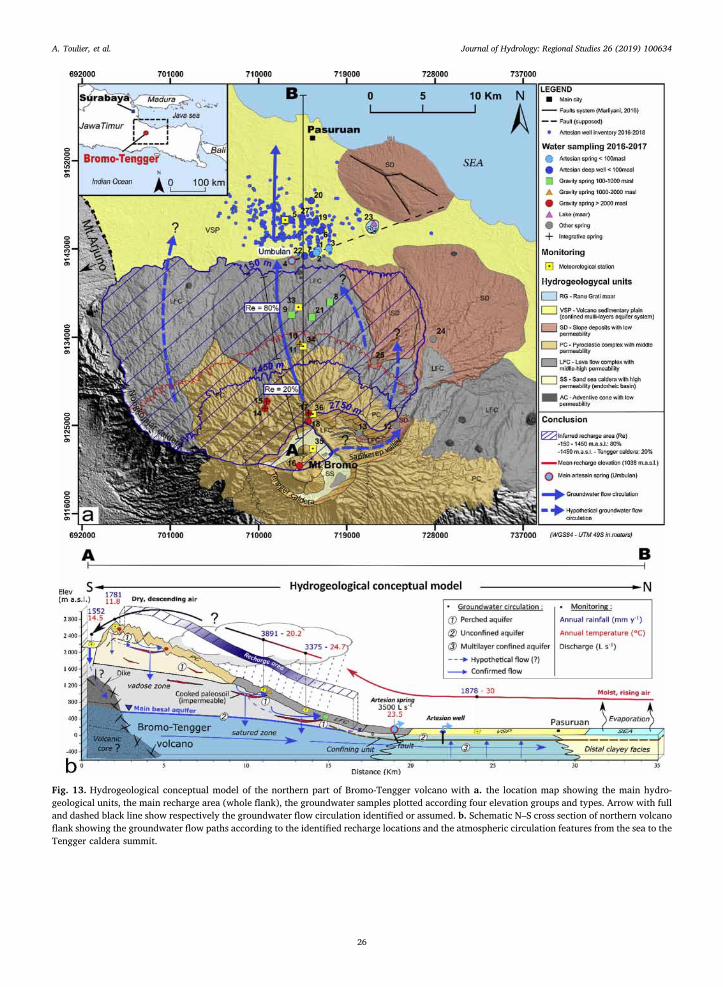


![[Hydrology] groundwater hydrology david k. todd (2005)](https://static.documents.pub/doc/80x56/55a8e6001a28ab6c2f8b4687/hydrology-groundwater-hydrology-david-k-todd-2005-55b0d9a792c06.jpg)

![[hydrology] groundwater hydrology - david k. todd (2005).pdf](https://static.documents.pub/doc/80x56/577c77961a28abe0548cb0b1/hydrology-groundwater-hydrology-david-k-todd-2005pdf.jpg)

