Journal of International Economics xxx (2012) xxx–xxx
INEC-02584; No of Pages 14
Contents lists available at SciVerse ScienceDirect
Journal of International Economics
j ourna l homepage: www.e lsev ie r .com/ locate / j i e
Financial crises and the multilateral response: What the historical record shows☆
Bergljot Barkbu a, Barry Eichengreen b,c,⁎, Ashoka Mody d
a European Department, International Monetary Fund, 700 19th Street, NW Washington DC 20431, United Statesb Department of Economics, University of California, Berkeley, 549 Evans Hall 3880, Berkeley, CA 94720-3880, United Statesc NBER, United Statesd Research Department, International Monetary Fund, 700 19th Street, NW Washington DC 20431, United States
☆ We thank Charles Engel, Kristin Forbes, and an anonments and Ajai Chopra, Jeromin Zettelmeyer, Lee Buchheitleagues at the IMF for generous feedback. The views expand do not necessarily represent the views of the IMF'sma⁎ Corresponding author at: Department of Econom
Berkeley, 549 Evans Hall 3880, Berkeley, CA 94720-388E-mail addresses: [email protected] (B. Barkbu), eich
We provide a synoptic description of financial crises and the multilateral response over the course of the lastfour decades. We present both indicators of economic performance around crisis dates and a comprehensivedescription of multilateral rescue efforts. While emergency lending has grown, reliance on debt restructuring,broadly speaking, has declined. This leads us to ask what can be done to rebalance the management of debtproblems toward a better mix of emergency lending and private sector burden sharing. In particular, we ex-plore the idea of sovereign cocos, contingent debt securities that automatically reduce payment obligations inthe event of debt-sustainability problems.
In the three decades ending in 1980, serious crises implicating fi-nancial systems and sovereign creditworthiness were few and far be-tween. Since then, however, crises have proliferated. The debt crisis ofthe 1980s, centering on syndicated bank loans to governments,engulfed a large number of Latin American countries but extendedalso to Asia, Africa, and Eastern Europe. The Tequila Crisis in1994–95 was the first since the 1930s to center on internationalbond markets. The Asian crisis of 1997–98 brought to the fore otherinternational financial contracts, including currency forwards and fu-tures and interbank credits, as well as external loans to the privatesector. The crisis in Russia and succeeding events spanning the period1998–2002 threatened financial stability in Brazil, Argentina, Ukraine,Uruguay, and Turkey. Most recently, the crisis in Europe highlightseven more prominently the connections between financial-sectorand sovereign-credit risks.
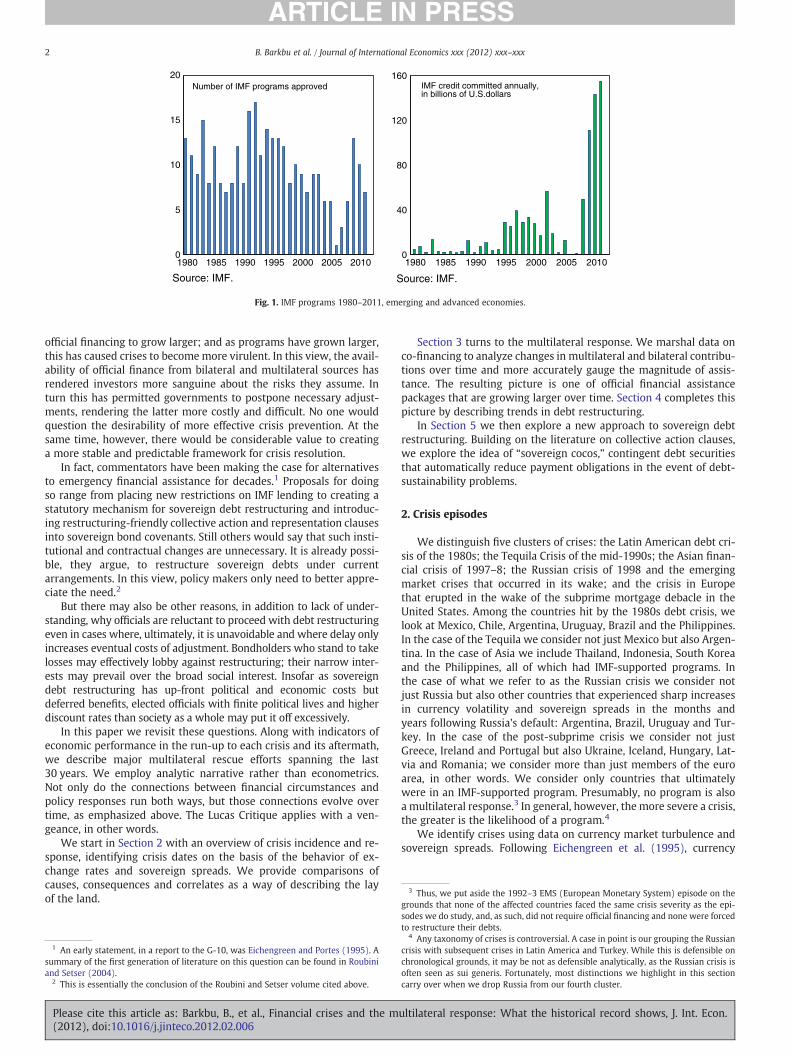
Just as the frequency and nature of crises have changed, so has themultilateral response. The number of IMF-supported programs has
ymous referee for helpful com-, Jim Boughton, and several col-ressed are those of the authorsnagement or Board of Directors.ics, University of California,
been bunched: up in the early 1980s, up again in the mid-1990s, uparound 2000, and up again starting in 2008 (see Fig. 1, left panel).New commitments of IMF credit show a similar pattern, superim-posed on a rising trend (right hand panel of Fig. 1). Co-financingfrom other official sources has further augmented program financingcommitments. IMF commitments since 2009 also include FlexibleCredit Lines to Mexico, Poland, and Colombia, which are also substan-tial although not (yet) drawn, and a Precautionary Credit Line forMacedonia, which was partly drawn in March 2011.
One strand of literature asks why crises have grownmore frequent(see e.g. Bordo et al., 2001). Another asks whether IMF programs havehelped to restore macroeconomic stability or only aggravated outputlosses by requiring additional austerity of the borrower. Yet anotherasks whether the international policy response, even when providingimmediate relief, contributes to the growing incidence of crises bycreating moral hazard.
Analysis of these issues is not straightforward. Attempts to esti-mate the effects of IMF programs must confront the problem thatboth crises and programs have changed over time. The structural re-lationship that the investigator is seeking to estimate may not be sta-ble, in other words. Moreover, analyses attempting to determine howIMF programs affect the frequency, incidence and magnitude of crisesgenerally fail to acknowledge that programs are not randomlyassigned.
Some would argue that crises and the multilateral response arecodependent. As countries have become more integrated into globalfinancial markets, financial crises have become more severe, causing
B.V. All rights reserved.
ultilateral response: What the historical record shows, J. Int. Econ.
IMF credit committed annually,in billions of U.S.dollars
Fig. 1. IMF programs 1980–2011, emerging and advanced economies.
3 Thus, we put aside the 1992–3 EMS (European Monetary System) episode on thegrounds that none of the affected countries faced the same crisis severity as the epi-
2 B. Barkbu et al. / Journal of International Economics xxx (2012) xxx–xxx
official financing to grow larger; and as programs have grown larger,this has caused crises to becomemore virulent. In this view, the avail-ability of official finance from bilateral and multilateral sources hasrendered investors more sanguine about the risks they assume. Inturn this has permitted governments to postpone necessary adjust-ments, rendering the latter more costly and difficult. No one wouldquestion the desirability of more effective crisis prevention. At thesame time, however, there would be considerable value to creatinga more stable and predictable framework for crisis resolution.
In fact, commentators have been making the case for alternativesto emergency financial assistance for decades.1 Proposals for doingso range from placing new restrictions on IMF lending to creating astatutory mechanism for sovereign debt restructuring and introduc-ing restructuring-friendly collective action and representation clausesinto sovereign bond covenants. Still others would say that such insti-tutional and contractual changes are unnecessary. It is already possi-ble, they argue, to restructure sovereign debts under currentarrangements. In this view, policy makers only need to better appre-ciate the need.2
But there may also be other reasons, in addition to lack of under-standing, why officials are reluctant to proceed with debt restructuringeven in cases where, ultimately, it is unavoidable and where delay onlyincreases eventual costs of adjustment. Bondholders who stand to takelosses may effectively lobby against restructuring; their narrow inter-ests may prevail over the broad social interest. Insofar as sovereigndebt restructuring has up-front political and economic costs butdeferred benefits, elected officials with finite political lives and higherdiscount rates than society as a whole may put it off excessively.
In this paper we revisit these questions. Along with indicators ofeconomic performance in the run-up to each crisis and its aftermath,we describe major multilateral rescue efforts spanning the last30 years. We employ analytic narrative rather than econometrics.Not only do the connections between financial circumstances andpolicy responses run both ways, but those connections evolve overtime, as emphasized above. The Lucas Critique applies with a ven-geance, in other words.
We start in Section 2 with an overview of crisis incidence and re-sponse, identifying crisis dates on the basis of the behavior of ex-change rates and sovereign spreads. We provide comparisons ofcauses, consequences and correlates as a way of describing the layof the land.
1 An early statement, in a report to the G-10, was Eichengreen and Portes (1995). Asummary of the first generation of literature on this question can be found in Roubiniand Setser (2004).
2 This is essentially the conclusion of the Roubini and Setser volume cited above.
Please cite this article as: Barkbu, B., et al., Financial crises and the m(2012), doi:10.1016/j.jinteco.2012.02.006
Section 3 turns to the multilateral response. We marshal data onco-financing to analyze changes in multilateral and bilateral contribu-tions over time and more accurately gauge the magnitude of assis-tance. The resulting picture is one of official financial assistancepackages that are growing larger over time. Section 4 completes thispicture by describing trends in debt restructuring.
In Section 5 we then explore a new approach to sovereign debtrestructuring. Building on the literature on collective action clauses,we explore the idea of “sovereign cocos,” contingent debt securitiesthat automatically reduce payment obligations in the event of debt-sustainability problems.
2. Crisis episodes
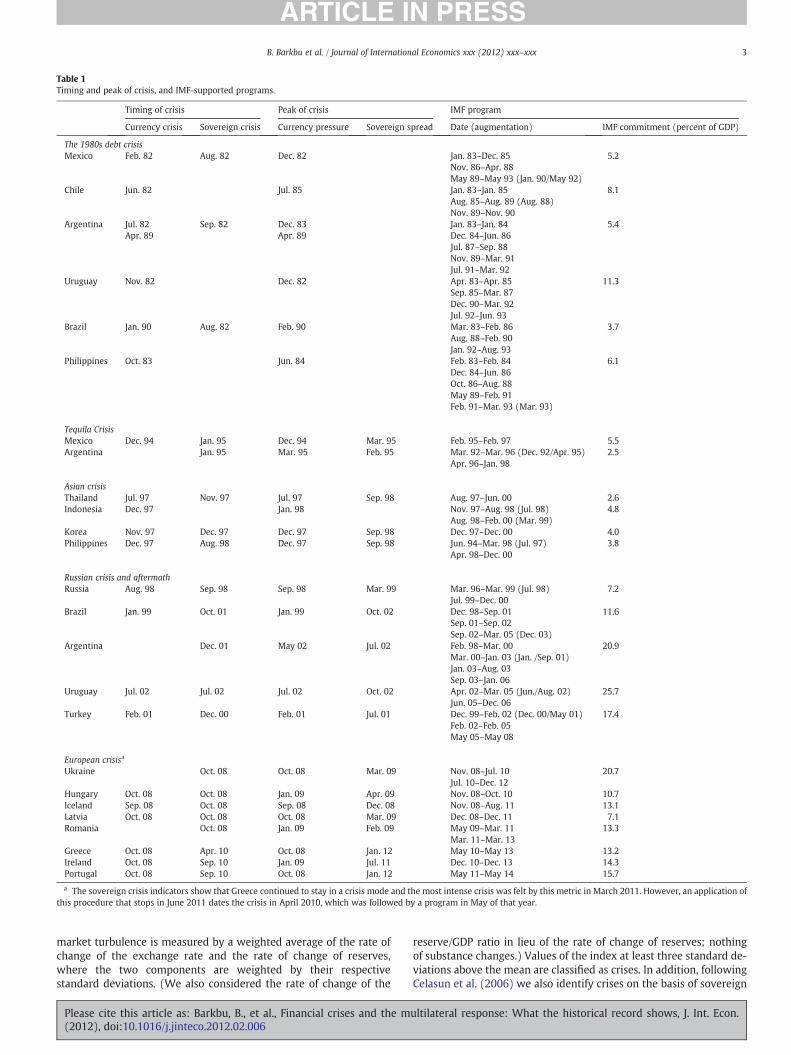
We distinguish five clusters of crises: the Latin American debt cri-sis of the 1980s; the Tequila Crisis of the mid-1990s; the Asian finan-cial crisis of 1997–8; the Russian crisis of 1998 and the emergingmarket crises that occurred in its wake; and the crisis in Europethat erupted in the wake of the subprime mortgage debacle in theUnited States. Among the countries hit by the 1980s debt crisis, welook at Mexico, Chile, Argentina, Uruguay, Brazil and the Philippines.In the case of the Tequila we consider not just Mexico but also Argen-tina. In the case of Asia we include Thailand, Indonesia, South Koreaand the Philippines, all of which had IMF-supported programs. Inthe case of what we refer to as the Russian crisis we consider notjust Russia but also other countries that experienced sharp increasesin currency volatility and sovereign spreads in the months andyears following Russia's default: Argentina, Brazil, Uruguay and Tur-key. In the case of the post-subprime crisis we consider not justGreece, Ireland and Portugal but also Ukraine, Iceland, Hungary, Lat-via and Romania; we consider more than just members of the euroarea, in other words. We consider only countries that ultimatelywere in an IMF-supported program. Presumably, no program is alsoa multilateral response.3 In general, however, the more severe a crisis,the greater is the likelihood of a program.4
We identify crises using data on currency market turbulence andsovereign spreads. Following Eichengreen et al. (1995), currency
sodes we do study, and, as such, did not require official financing and none were forcedto restructure their debts.
4 Any taxonomy of crises is controversial. A case in point is our grouping the Russiancrisis with subsequent crises in Latin America and Turkey. While this is defensible onchronological grounds, it may be not as defensible analytically, as the Russian crisis isoften seen as sui generis. Fortunately, most distinctions we highlight in this sectioncarry over when we drop Russia from our fourth cluster.
ultilateral response: What the historical record shows, J. Int. Econ.
a The sovereign crisis indicators show that Greece continued to stay in a crisis mode and the most intense crisis was felt by this metric in March 2011. However, an application ofthis procedure that stops in June 2011 dates the crisis in April 2010, which was followed by a program in May of that year.
3B. Barkbu et al. / Journal of International Economics xxx (2012) xxx–xxx
market turbulence is measured by a weighted average of the rate ofchange of the exchange rate and the rate of change of reserves,where the two components are weighted by their respectivestandard deviations. (We also considered the rate of change of the
Please cite this article as: Barkbu, B., et al., Financial crises and the m(2012), doi:10.1016/j.jinteco.2012.02.006
reserve/GDP ratio in lieu of the rate of change of reserves; nothingof substance changes.) Values of the index at least three standard de-viations above the mean are classified as crises. In addition, followingCelasun et al. (2006) we also identify crises on the basis of sovereign
ultilateral response: What the historical record shows, J. Int. Econ.
1980s debt crisisTequila crisisAsian crisisRussian crisis European crisis
Source: World Economic Outlook.
Real GDP growth (annual, in percent)
0
20
40
60
80
160
180
t-3 t-2 t-1 t t+1 t+2 t+3
1980s debt crisisTequila crisisAsian crisisRussian crisis European crisis
Source: International Financial Statistics.
CPI inflation(annual, in percent)
Fig. 2. Growth and inflation, unweighted averages by episode.
4 B. Barkbu et al. / Journal of International Economics xxx (2012) xxx–xxx
spreads. Periods when spreads are at least one standard deviationabove the mean are identified as crises.5
Table 1 shows the resulting crisis dates, the timing of the first IMFintervention, the number of IMF-supported programs, and the cumu-lative IMF financial commitment. Several observations stand out. Forexample, the debt crisis of the 1980s displays an especially large in-crease in exchange market pressure, reflecting high rates of inflationin the crisis countries. Sovereign spreads, on the other hand, rosemore modestly in that episode, in part because much of the debt inquestion was borrowing from commercial bank syndicates.
Risk premia on sovereign bonds came to the fore in the TequilaCrisis, when Mexican spreads rose by 1500 basis points. Mexico's cri-sis was resolved with a single program substantially larger than thoseof the 1980s. In contrast, private sector imbalances were the proxi-mate source of the Asian crisis, with sovereign spreads rising onlywith worries that governments would be forced to socialize the lossesof banks and large corporations.
Exchange market pressure then rose again in the Russian crisis.Some countries obtained multiple IMF-supported programs, raisingcumulative average program financing size above the levels reachedin prior crises.6
In four episodes (the 1980s, the Tequila, Asia, and Europe), GDPgrowth was generally high two to three years before the crisis.Growth then showed signs of decelerating in the run-up to the crisisin the 1980s, Tequila and Asian cases (Fig. 2, left panel). In the Russiancase the problem was not that growth was decelerating but that itwas low. Either way, it would appear that weakening growth due toaccumulated macroeconomic imbalances is a precursor to crises. Eu-rope stands out in that there was no indication of falling growthuntil the crisis struck.
In the 1980s and Russian debt crises, inflation accelerated duringthe run-up (Fig. 2, right panel). In the subsequent crises, inflationwas less obviously a problem — though, as Europe reminds us, prob-lems of international competitiveness can also arise in other ways.
The behavior of public debts and deficits also differs across epi-sodes (Fig. 3). Consistent with the contrasting behavior of inflationnoted above, lax public finances played a major role in Latin Americain the late 1970s and early 1980s and in the countries experiencing
5 Crises of sovereign spreads for Mexico, Argentina and Brazil are based on Edwards(1986) and Folkerts-Landau (1985). No sovereign spreads data are available for Chile,Uruguay, and the Philippines.
6 In the case of the three euro zone economies, of course, the index of exchange mar-ket pressure has limited significance, since they are small parts of the euro area eco-nomically and their difficulties have thus had only limited impact on the euroexchange rate. But sovereign bond spreads are high by any standard for Greece andare high everywhere, especially by the prior standards of the countries themselves.
Please cite this article as: Barkbu, B., et al., Financial crises and the m(2012), doi:10.1016/j.jinteco.2012.02.006
difficulties following Russia's default. But the same was not true inthe Tequila or Asian crises. To be sure, Mexico in 1994 had publicspending hidden in the accounts of its development bank, andgovernments of the Asian crisis countries had significant implicit lia-bilities to banks and industrial conglomerates that did not show up ingovernments' published accounts. But as a comparative statement thegeneralization remains valid: public sector deficits were more of aproblem in the run-up to the 1980s and Russian debt crises, while pri-vate sector deficits were more of a problem in the run-up to the Te-quila and Asian crises.
Generalizing about Europe's public finances is more difficult. Withthe exception of Greece, the state of the public finances did not obvious-ly signal a looming crisis. Pre-crisis assessments showed low structuraldeficits because potential growth rates were deemed high and hencethe estimated cyclical component of the deficit was not large. The dra-matic deterioration of budget balances following the onset of the crisisthen led to significant reassessment of the pre-crisis state of public fi-nances. Potential growth rates during the pre-crisis periodwere reviseddownward. Key revenue sources – notably those related to real-estatetransactions – were acknowledged to have been temporary. Withbenefit of hindsight it is now clear that consumption booms andhousing bubbles contributed to the appearance of healthy public fi-nances while hiding sizeable structural deficits. Together with failureto provision for implicit liabilities to the banking system, this meantthat the strength of European budgets prior to 2008 was overstated.In addition, the general government deficit is also greatly affected bythe 2010 budget deficit in Ireland, which due to banking sector out-lays reached 32% of GDP. Fig. 3, lower left panel shows the euro areaaverage correcting for the Irish bank support cost. This said, thepublic finances of the non-euro area crisis economies were betterthan those of their euro-area counterparts.
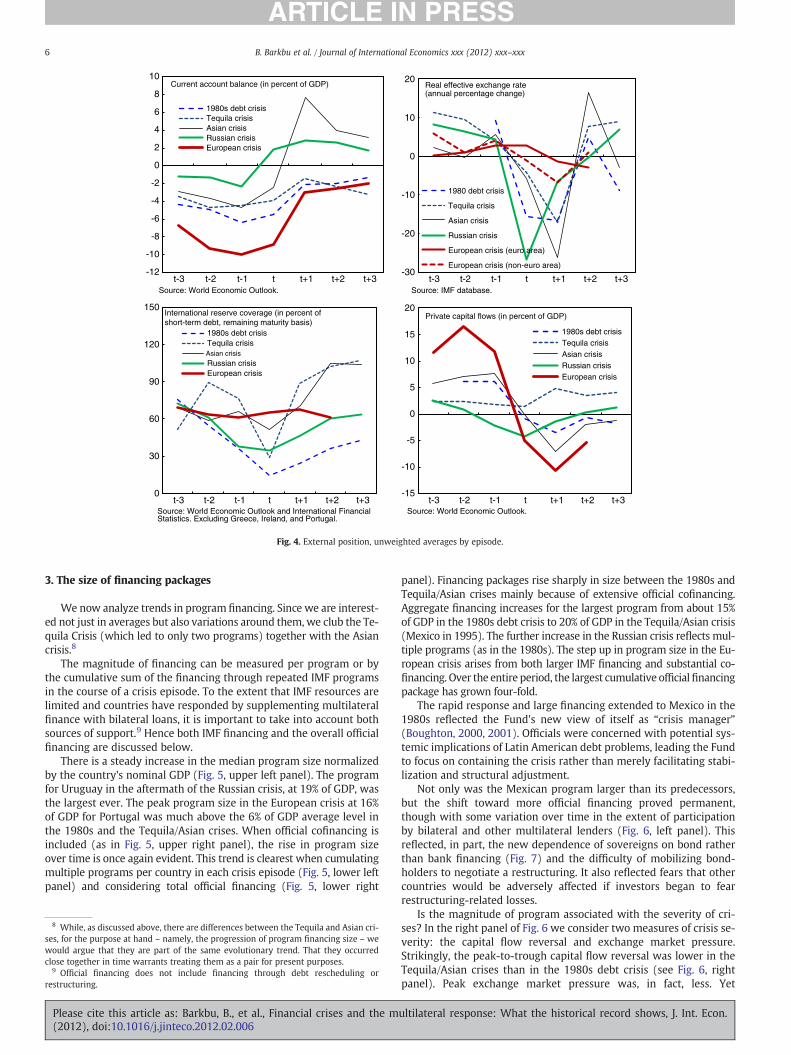
Current account deficits were unusually large in the run-up toEurope's crisis, reflecting external borrowing by the sovereign inGreece but also by banks and, more generally, by the private sectorin Spain, Portugal and Ireland. But sizeable external deficits werealso present in most of the other episodes (Fig. 4). Note also the ten-dency for current accounts to strengthen immediately before the cri-sis. This presumably reflects the declining availability of privateexternal finance and capital flight as problems begin to become evi-dent. There is also a tendency for real exchange rates to appreciateprior to crises and to collapse subsequently. Correspondingly, re-serves as a share of short-term debt decline in the run-up and recoverafterwards.
External imbalances were largest in the run-up to the recent Euro-pean crisis. The presumption that monetary integration guaranteedstability and catch-up growth led to massive amounts of borrowing
ultilateral response: What the historical record shows, J. Int. Econ.
7 Banks in the problem countries thus funded their loans not just by taking depositsfrom residents but in addition by borrowing on the interbank wholesale money mar-ket, both from banks in other European countries and from banks outside Europe(see Ahearne et al., 2009).
-14
-12
-10
-8
-6
-4
-2
0
2
4
t-3 t-2 t-1 t t+1 t+2 t+3
1980s debt crisisTequila crisisAsian crisisRussian crisis European crisis
Source: World Economic Outlook.
General government balance (in percent of GDP)
0
20
40
60
80
100
120
140
t-3 t-2 t-1 t t+1 t+2 t+3
1980s debt crisisTequila crisisAsian crisisRussian crisis European crisis
Source: World Economic Outlook and IMF staff.
General government debt (in percent of GDP)
-20
-15
-10
-5
0
t-3 t-2 t-1 t t+1 t+2 t+3
Euro area countries
Euro area countries (excl. Irish bank support)
Non-euro area countries
Source: World Economic Outlook.
General government balance (in percent of GDP) in the European crisis
0
20
40
60
80
100
120
140
t-3 t-2 t-1 t t+1 t+2 t+3
Euro area countries
Non -euro area countries
Source: World Economic Outlook.
General government debt (in percent of GDP) in the European crisis
Fig. 3. Public finances, unweighted averages by episode.
5B. Barkbu et al. / Journal of International Economics xxx (2012) xxx–xxx
and lending within Europe. As in other crises, external imbalances al-ready began narrowing before the crisis, as problems became evidentand the availability of private external finance declined. Yet, even inthe year before the crisis, the average current account deficit in Euro-pean crisis countries was 10% of GDP, matched by equivalent privatecapital inflows. In contrast, the extent of real exchange rate appreciationwas no greater than prior to previous crises.
The larger the capital inflow prior to the crisis, the larger in generalwas the subsequent capital-flow reversal. European crisis countriesenjoyed the largest pre-crisis inflows, they similarly experienced thelargest reversal. Importantly, however, the accompanying decline inthe real exchange rate during this crisis was significantly smaller andmore gradual than in the other crises. Similarly, the fall in reserve ratioswas relatively limited.
These comparisons point to important respects in which Europe'scrisis is different. Pre-crisis inflation was relatively low, reflecting thedisciplines of the single currency in Greece, Ireland and Portugal andof the peg in Latvia. The real exchange rate had gradually becomeovervalued but to a much lesser extent than may have been expectedfrom the magnitude of foreign capital inflows. Government budgetswere closer to balance than in earlier crises, Greece notwithstanding.These observations are not unrelated: the appearance of monetaryand fiscal stability was what allowed the crisis countries to importcapital in the amounts they did.
Foreign capital inflows into European economies facilitated thebuildup of a very high degree of leverage. From around 2002, creditto both households and nonfinancial corporations grew significantlyfaster in Ireland, Greece, Portugal, and emerging European marketsthan in Germany and the other countries of the euro-area “core.”The private sector borrowed from the banks, which in turn borrowed
Please cite this article as: Barkbu, B., et al., Financial crises and the m(2012), doi:10.1016/j.jinteco.2012.02.006
from banks elsewhere in Europe.7 For Latvia and Romania, official EUfunds following accession in 2004 contributed further to inflows. De-spite rapid wage increases, household debt-to-income ratios rose in2002–07 by more than five times in Latvia, by 270% in Hungary, by180% in Ireland, and by 130% in Portugal. Housing prices rose dramati-cally in Greece, Ireland, Iceland, and Latvia. Equity prices continued torise right up to the eve of the crisis, in contrast to the situation in Asiasome ten years before, when they started falling well before the crisis.
The kind of fast recovery that followed the Asian crisis does notappear to be imminent in Europe. The European crisis economies re-quire a precipitous fall in domestic demand to achieve the necessarydeleveraging. Without the option of exchange rate depreciation, thisadjustment must rely largely on internal devaluation.
Internal devaluation is not easy; the rate of real depreciation follow-ing the crisis has been limited, as noted above. In the current episode,then, less post-crisis adjustment has taken the formof prices as opposedto quantities. The greater difficulty of engineering a real depreciationhasmeant that it has beenmore difficult to substitute external for inter-nal demand. The implication is that absent growth and with continueddeflationary tendencies, public debt ratios are difficult to bring down. Inthis sense, the European crisis already resembles the more protracted1980s and Russian crises. That is to say, the current crop of post-crisisrecessions has been unusually severe by historical standards, and it isfar from clear at the time of writing that they have run their course.
ultilateral response: What the historical record shows, J. Int. Econ.
1980s debt crisisTequila crisisAsian crisisRussian crisis European crisis
Source: World Economic Outlook.
Current account balance (in percent of GDP)
-30
-20
-10
0
10
20
t-3 t-2 t-1 t t+1 t+2 t+3
1980 debt crisis
Tequila crisis
Asian crisis
Russian crisis
European crisis (euro area)
European crisis (non-euro area)
Source: IMF database.
Real effective exchange rate(annual percentage change)
0
30
60
90
120
150
t-3 t-2 t-1 t t+1 t+2 t+3
1980s debt crisisTequila crisisAsian crisis
Russian crisis European crisis
Source: World Economic Outlook and International Financial Statistics. Excluding Greece, Ireland, and Portugal.
International reserve coverage (in percent of short-term debt, remaining maturity basis)
-15
-10
-5
0
5
10
15
20
t-3 t-2 t-1 t t+1 t+2 t+3
1980s debt crisisTequila crisisAsian crisisRussian crisis European crisis
Source: World Economic Outlook.
Private capital flows (in percent of GDP)
Fig. 4. External position, unweighted averages by episode.
6 B. Barkbu et al. / Journal of International Economics xxx (2012) xxx–xxx
3. The size of financing packages
We now analyze trends in program financing. Since we are interest-ed not just in averages but also variations around them, we club the Te-quila Crisis (which led to only two programs) together with the Asiancrisis.8
The magnitude of financing can be measured per program or bythe cumulative sum of the financing through repeated IMF programsin the course of a crisis episode. To the extent that IMF resources arelimited and countries have responded by supplementing multilateralfinance with bilateral loans, it is important to take into account bothsources of support.9 Hence both IMF financing and the overall officialfinancing are discussed below.
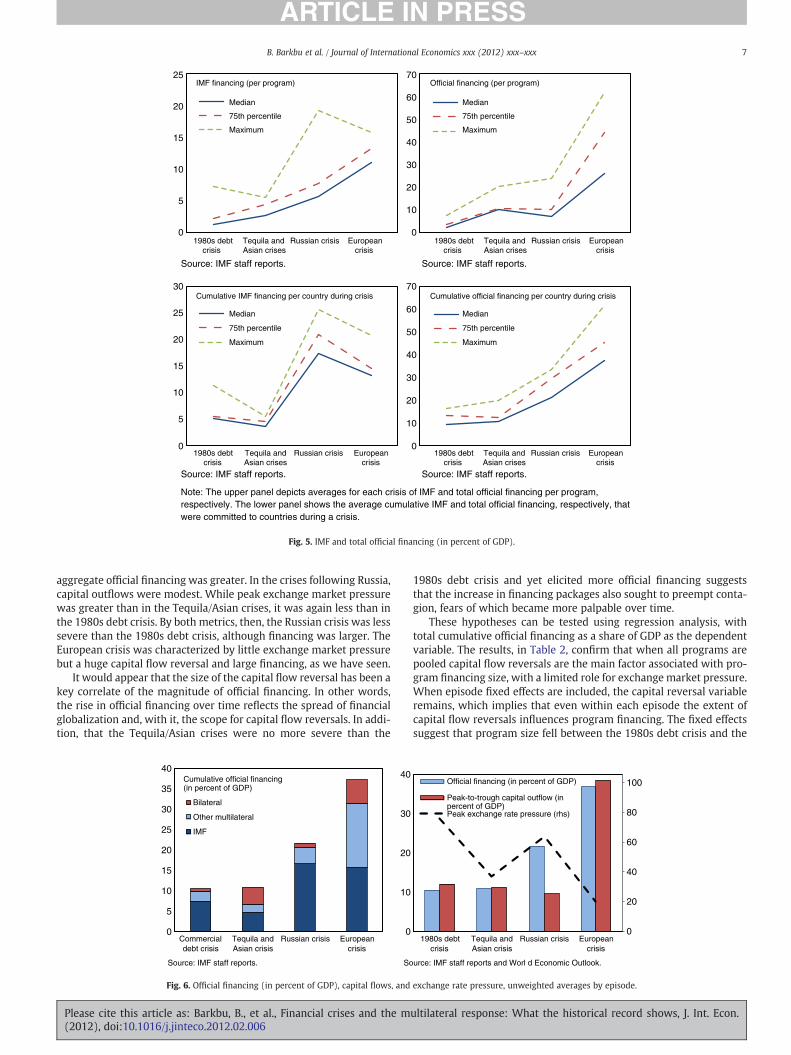
There is a steady increase in the median program size normalizedby the country's nominal GDP (Fig. 5, upper left panel). The programfor Uruguay in the aftermath of the Russian crisis, at 19% of GDP, wasthe largest ever. The peak program size in the European crisis at 16%of GDP for Portugal was much above the 6% of GDP average level inthe 1980s and the Tequila/Asian crises. When official cofinancing isincluded (as in Fig. 5, upper right panel), the rise in program sizeover time is once again evident. This trend is clearest when cumulatingmultiple programs per country in each crisis episode (Fig. 5, lower leftpanel) and considering total official financing (Fig. 5, lower right
8 While, as discussed above, there are differences between the Tequila and Asian cri-ses, for the purpose at hand – namely, the progression of program financing size – wewould argue that they are part of the same evolutionary trend. That they occurredclose together in time warrants treating them as a pair for present purposes.
9 Official financing does not include financing through debt rescheduling orrestructuring.
Please cite this article as: Barkbu, B., et al., Financial crises and the m(2012), doi:10.1016/j.jinteco.2012.02.006
panel). Financing packages rise sharply in size between the 1980s andTequila/Asian crises mainly because of extensive official cofinancing.Aggregate financing increases for the largest program from about 15%of GDP in the 1980s debt crisis to 20% of GDP in the Tequila/Asian crisis(Mexico in 1995). The further increase in the Russian crisis reflects mul-tiple programs (as in the 1980s). The step up in program size in the Eu-ropean crisis arises from both larger IMF financing and substantial co-financing. Over the entire period, the largest cumulative officialfinancingpackage has grown four-fold.
The rapid response and large financing extended to Mexico in the1980s reflected the Fund's new view of itself as “crisis manager”(Boughton, 2000, 2001). Officials were concerned with potential sys-temic implications of Latin American debt problems, leading the Fundto focus on containing the crisis rather than merely facilitating stabi-lization and structural adjustment.
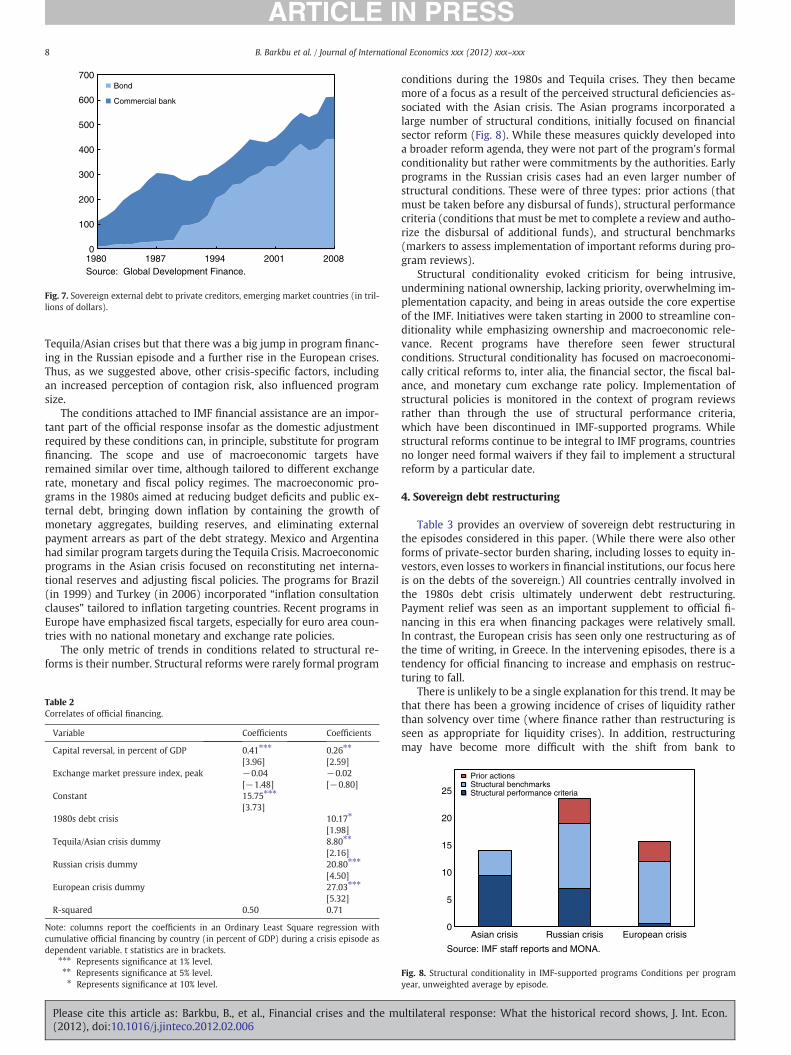
Not only was the Mexican program larger than its predecessors,but the shift toward more official financing proved permanent,though with some variation over time in the extent of participationby bilateral and other multilateral lenders (Fig. 6, left panel). Thisreflected, in part, the new dependence of sovereigns on bond ratherthan bank financing (Fig. 7) and the difficulty of mobilizing bond-holders to negotiate a restructuring. It also reflected fears that othercountries would be adversely affected if investors began to fearrestructuring-related losses.
Is the magnitude of program associated with the severity of cri-ses? In the right panel of Fig. 6 we consider two measures of crisis se-verity: the capital flow reversal and exchange market pressure.Strikingly, the peak-to-trough capital flow reversal was lower in theTequila/Asian crises than in the 1980s debt crisis (see Fig. 6, rightpanel). Peak exchange market pressure was, in fact, less. Yet
ultilateral response: What the historical record shows, J. Int. Econ.
Note: The upper panel depicts averages for each crisis of IMF and total official financing per program, respectively. The lower panel shows the average cumulative IMF and total official financing, respectively, that were committed to countries during a crisis.
0
5
10
15
20
25
1980s debt crisis
Tequila and Asian crises
Russian crisis European crisis
Median
75th percentile
Maximum
Source: IMF staff reports.
IMF financing (per program)
0
10
20
30
40
50
60
70
1980s debt crisis
Tequila and Asian crises
Russian crisis European crisis
Median
75th percentile
Maximum
Source: IMF staff reports.
Official financing (per program)
0
5
10
15
20
25
30
1980s debt crisis
Tequila and Asian crises
Russian crisis European crisis
Median
75th percentile
Maximum
Source: IMF staff reports.
Cumulative IMF financing per country during crisis
0
10
20
30
40
50
60
70
1980s debt crisis
Tequila and Asian crises
Russian crisis European crisis
Median
75th percentile
Maximum
Source: IMF staff reports.
Cumulative official financing per country during crisis
Fig. 5. IMF and total official financing (in percent of GDP).
7B. Barkbu et al. / Journal of International Economics xxx (2012) xxx–xxx
aggregate official financing was greater. In the crises following Russia,capital outflows were modest. While peak exchange market pressurewas greater than in the Tequila/Asian crises, it was again less than inthe 1980s debt crisis. By both metrics, then, the Russian crisis was lesssevere than the 1980s debt crisis, although financing was larger. TheEuropean crisis was characterized by little exchange market pressurebut a huge capital flow reversal and large financing, as we have seen.
It would appear that the size of the capital flow reversal has been akey correlate of the magnitude of official financing. In other words,the rise in official financing over time reflects the spread of financialglobalization and, with it, the scope for capital flow reversals. In addi-tion, that the Tequila/Asian crises were no more severe than the
0
5
10
15
20
25
30
35
40
Commercial debt crisis
Tequila and Asian crisis
Russian crisis European crisis
Bilateral
Other multilateral
IMF
Source: IMF staff reports.
Cumulative official financing (in percent of GDP)
0
10
20
30
40
So
Fig. 6. Official financing (in percent of GDP), capital flows, and
Please cite this article as: Barkbu, B., et al., Financial crises and the m(2012), doi:10.1016/j.jinteco.2012.02.006
1980s debt crisis and yet elicited more official financing suggeststhat the increase in financing packages also sought to preempt conta-gion, fears of which became more palpable over time.
These hypotheses can be tested using regression analysis, withtotal cumulative official financing as a share of GDP as the dependentvariable. The results, in Table 2, confirm that when all programs arepooled capital flow reversals are the main factor associated with pro-gram financing size, with a limited role for exchange market pressure.When episode fixed effects are included, the capital reversal variableremains, which implies that even within each episode the extent ofcapital flow reversals influences program financing. The fixed effectssuggest that program size fell between the 1980s debt crisis and the
0
20
40
60
80
100
1980s debt crisis
Tequila and Asian crisis
Russian crisis European crisis
Official financing (in percent of GDP)
Peak-to-trough capital outflow (inpercent of GDP)Peak exchange rate pressure (rhs)
urce: IMF staff reports and Worl d Economic Outlook.
exchange rate pressure, unweighted averages by episode.
ultilateral response: What the historical record shows, J. Int. Econ.
Fig. 7. Sovereign external debt to private creditors, emerging market countries (in tril-lions of dollars).
8 B. Barkbu et al. / Journal of International Economics xxx (2012) xxx–xxx
Tequila/Asian crises but that there was a big jump in program financ-ing in the Russian episode and a further rise in the European crises.Thus, as we suggested above, other crisis-specific factors, includingan increased perception of contagion risk, also influenced programsize.
The conditions attached to IMF financial assistance are an impor-tant part of the official response insofar as the domestic adjustmentrequired by these conditions can, in principle, substitute for programfinancing. The scope and use of macroeconomic targets haveremained similar over time, although tailored to different exchangerate, monetary and fiscal policy regimes. The macroeconomic pro-grams in the 1980s aimed at reducing budget deficits and public ex-ternal debt, bringing down inflation by containing the growth ofmonetary aggregates, building reserves, and eliminating externalpayment arrears as part of the debt strategy. Mexico and Argentinahad similar program targets during the Tequila Crisis. Macroeconomicprograms in the Asian crisis focused on reconstituting net interna-tional reserves and adjusting fiscal policies. The programs for Brazil(in 1999) and Turkey (in 2006) incorporated “inflation consultationclauses” tailored to inflation targeting countries. Recent programs inEurope have emphasized fiscal targets, especially for euro area coun-tries with no national monetary and exchange rate policies.
The only metric of trends in conditions related to structural re-forms is their number. Structural reforms were rarely formal program
Table 2Correlates of official financing.
Variable Coefficients Coefficients
Capital reversal, in percent of GDP 0.41⁎⁎⁎
[3.96]0.26⁎⁎
[2.59]Exchange market pressure index, peak −0.04
[−1.48]−0.02[−0.80]
Constant 15.75⁎⁎⁎
[3.73]1980s debt crisis 10.17⁎
[1.98]Tequila/Asian crisis dummy 8.80⁎⁎
[2.16]Russian crisis dummy 20.80⁎⁎⁎
[4.50]European crisis dummy 27.03⁎⁎⁎
[5.32]R-squared 0.50 0.71
Note: columns report the coefficients in an Ordinary Least Square regression withcumulative official financing by country (in percent of GDP) during a crisis episode asdependent variable. t statistics are in brackets.
⁎⁎⁎ Represents significance at 1% level.⁎⁎ Represents significance at 5% level.⁎ Represents significance at 10% level.
Please cite this article as: Barkbu, B., et al., Financial crises and the m(2012), doi:10.1016/j.jinteco.2012.02.006
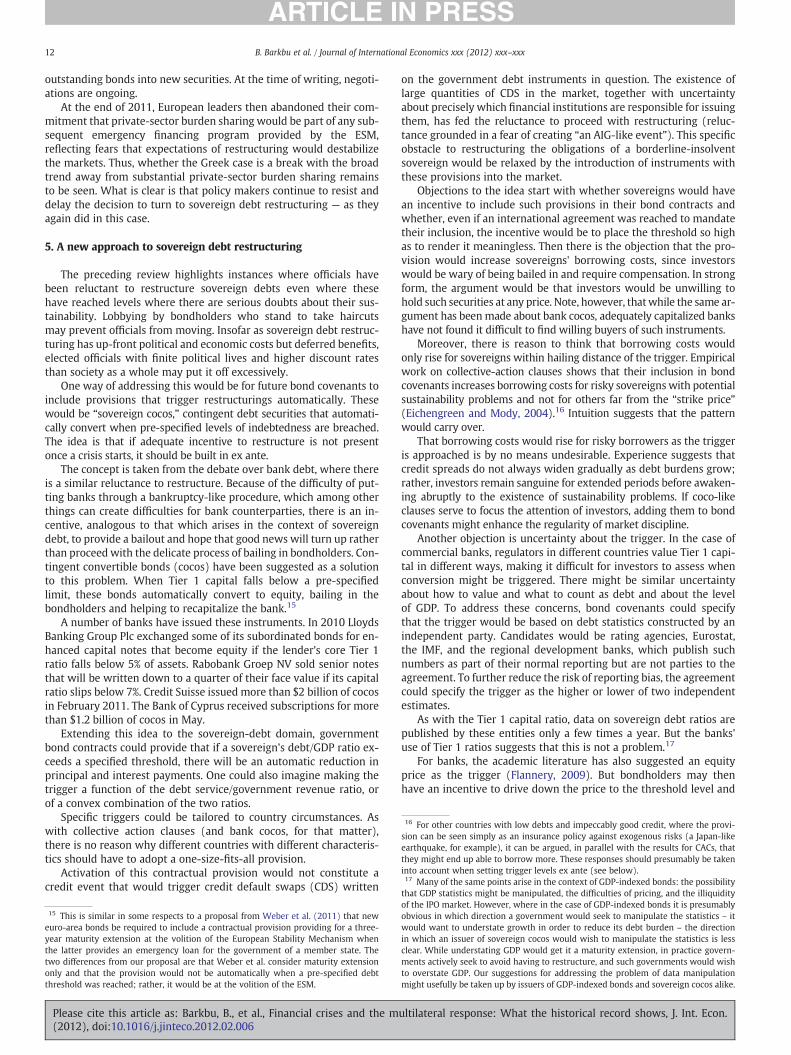
conditions during the 1980s and Tequila crises. They then becamemore of a focus as a result of the perceived structural deficiencies as-sociated with the Asian crisis. The Asian programs incorporated alarge number of structural conditions, initially focused on financialsector reform (Fig. 8). While these measures quickly developed intoa broader reform agenda, they were not part of the program's formalconditionality but rather were commitments by the authorities. Earlyprograms in the Russian crisis cases had an even larger number ofstructural conditions. These were of three types: prior actions (thatmust be taken before any disbursal of funds), structural performancecriteria (conditions that must be met to complete a review and autho-rize the disbursal of additional funds), and structural benchmarks(markers to assess implementation of important reforms during pro-gram reviews).
Structural conditionality evoked criticism for being intrusive,undermining national ownership, lacking priority, overwhelming im-plementation capacity, and being in areas outside the core expertiseof the IMF. Initiatives were taken starting in 2000 to streamline con-ditionality while emphasizing ownership and macroeconomic rele-vance. Recent programs have therefore seen fewer structuralconditions. Structural conditionality has focused on macroeconomi-cally critical reforms to, inter alia, the financial sector, the fiscal bal-ance, and monetary cum exchange rate policy. Implementation ofstructural policies is monitored in the context of program reviewsrather than through the use of structural performance criteria,which have been discontinued in IMF-supported programs. Whilestructural reforms continue to be integral to IMF programs, countriesno longer need formal waivers if they fail to implement a structuralreform by a particular date.
4. Sovereign debt restructuring
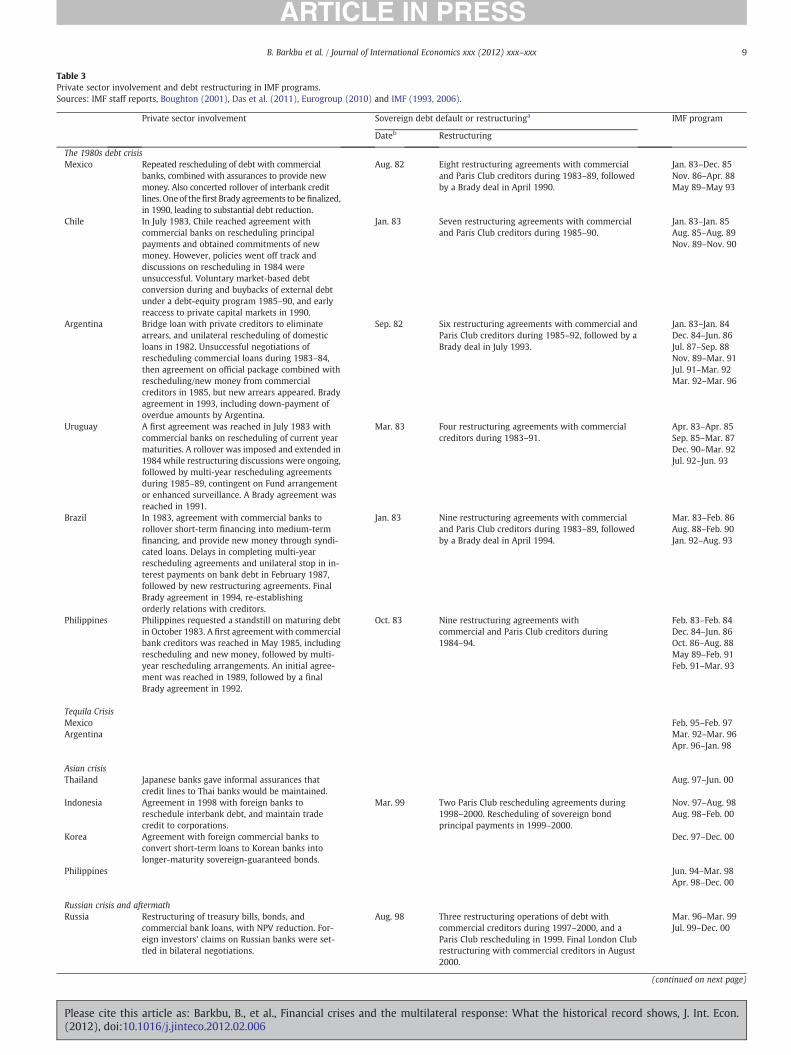
Table 3 provides an overview of sovereign debt restructuring inthe episodes considered in this paper. (While there were also otherforms of private-sector burden sharing, including losses to equity in-vestors, even losses to workers in financial institutions, our focus hereis on the debts of the sovereign.) All countries centrally involved inthe 1980s debt crisis ultimately underwent debt restructuring.Payment relief was seen as an important supplement to official fi-nancing in this era when financing packages were relatively small.In contrast, the European crisis has seen only one restructuring as ofthe time of writing, in Greece. In the intervening episodes, there is atendency for official financing to increase and emphasis on restruc-turing to fall.
There is unlikely to be a single explanation for this trend. It may bethat there has been a growing incidence of crises of liquidity ratherthan solvency over time (where finance rather than restructuring isseen as appropriate for liquidity crises). In addition, restructuringmay have become more difficult with the shift from bank to
Table 3Private sector involvement and debt restructuring in IMF programs.Sources: IMF staff reports, Boughton (2001), Das et al. (2011), Eurogroup (2010) and IMF (1993, 2006).
Private sector involvement Sovereign debt default or restructuringa IMF program
Dateb Restructuring
The 1980s debt crisisMexico Repeated rescheduling of debt with commercial
banks, combined with assurances to provide newmoney. Also concerted rollover of interbank creditlines. Oneof thefirst Brady agreements to befinalized,in 1990, leading to substantial debt reduction.
Aug. 82 Eight restructuring agreements with commercialand Paris Club creditors during 1983–89, followedby a Brady deal in April 1990.
Jan. 83–Dec. 85Nov. 86–Apr. 88May 89–May 93
Chile In July 1983, Chile reached agreement withcommercial banks on rescheduling principalpayments and obtained commitments of newmoney. However, policies went off track anddiscussions on rescheduling in 1984 wereunsuccessful. Voluntary market-based debtconversion during and buybacks of external debtunder a debt-equity program 1985–90, and earlyreaccess to private capital markets in 1990.
Jan. 83 Seven restructuring agreements with commercialand Paris Club creditors during 1985–90.
Jan. 83–Jan. 85Aug. 85–Aug. 89Nov. 89–Nov. 90
Argentina Bridge loan with private creditors to eliminatearrears, and unilateral rescheduling of domesticloans in 1982. Unsuccessful negotiations ofrescheduling commercial loans during 1983–84,then agreement on official package combined withrescheduling/new money from commercialcreditors in 1985, but new arrears appeared. Bradyagreement in 1993, including down-payment ofoverdue amounts by Argentina.
Sep. 82 Six restructuring agreements with commercial andParis Club creditors during 1985–92, followed by aBrady deal in July 1993.
Uruguay A first agreement was reached in July 1983 withcommercial banks on rescheduling of current yearmaturities. A rollover was imposed and extended in1984 while restructuring discussions were ongoing,followed by multi-year rescheduling agreementsduring 1985–89, contingent on Fund arrangementor enhanced surveillance. A Brady agreement wasreached in 1991.
Mar. 83 Four restructuring agreements with commercialcreditors during 1983–91.
Brazil In 1983, agreement with commercial banks torollover short-term financing into medium-termfinancing, and provide new money through syndi-cated loans. Delays in completing multi-yearrescheduling agreements and unilateral stop in in-terest payments on bank debt in February 1987,followed by new restructuring agreements. FinalBrady agreement in 1994, re-establishingorderly relations with creditors.
Jan. 83 Nine restructuring agreements with commercialand Paris Club creditors during 1983–89, followedby a Brady deal in April 1994.
Mar. 83–Feb. 86Aug. 88–Feb. 90Jan. 92–Aug. 93
Philippines Philippines requested a standstill on maturing debtin October 1983. A first agreement with commercialbank creditors was reached in May 1985, includingrescheduling and new money, followed by multi-year rescheduling arrangements. An initial agree-ment was reached in 1989, followed by a finalBrady agreement in 1992.
Oct. 83 Nine restructuring agreements withcommercial and Paris Club creditors during1984–94.
Tequila CrisisMexico Feb. 95–Feb. 97Argentina Mar. 92–Mar. 96
Apr. 96–Jan. 98
Asian crisisThailand Japanese banks gave informal assurances that
credit lines to Thai banks would be maintained.Aug. 97–Jun. 00
Indonesia Agreement in 1998 with foreign banks toreschedule interbank debt, and maintain tradecredit to corporations.
Mar. 99 Two Paris Club rescheduling agreements during1998–2000. Rescheduling of sovereign bondprincipal payments in 1999–2000.
Nov. 97–Aug. 98Aug. 98–Feb. 00
Korea Agreement with foreign commercial banks toconvert short-term loans to Korean banks intolonger-maturity sovereign-guaranteed bonds.
Dec. 97–Dec. 00
Philippines Jun. 94–Mar. 98Apr. 98–Dec. 00
Russian crisis and aftermathRussia Restructuring of treasury bills, bonds, and
commercial bank loans, with NPV reduction. For-eign investors' claims on Russian banks were set-tled in bilateral negotiations.
Aug. 98 Three restructuring operations of debt withcommercial creditors during 1997–2000, and aParis Club rescheduling in 1999. Final London Clubrestructuring with commercial creditors in August2000.
Mar. 96–Mar. 99Jul. 99–Dec. 00
(continued on next page)
9B. Barkbu et al. / Journal of International Economics xxx (2012) xxx–xxx
Please cite this article as: Barkbu, B., et al., Financial crises and the multilateral response: What the historical record shows, J. Int. Econ.(2012), doi:10.1016/j.jinteco.2012.02.006
10 Chile relied on voluntary market-based debt conversion during 1985–89 and cashbuy-backs of external debt during 1988–89, and in September 1990, is reported to bethe first Latin American country to obtain a voluntary unsecured bank loan since 1982.
Table 3 (continued)
Private sector involvement Sovereign debt default or restructuringa IMF program
Dateb Restructuring
Brazil Monitoring of foreign banks' credit lines to banksoperating in Brazil and indications of commitmentsto maintain or rebuild exposures (1999).Joint statement of long-term commitment and in-tention to maintain exposure to banks operating inBrazil at meetings with leading banks in 2002.
Dec. 98–Sep. 01Sep. 01–Sep. 02Sep. 02–Mar. 05
Argentina The June 2001 megaswap increased the debt stockmarginally, but the Phase 1 restructuring inNovember implied an NPV reduction. The 2005global debt exchange led to a large NPV reduction.Repeated intervention in bank balance sheet led tolosses for banks' creditors.
Nov. 01 Two rounds of debt treatment in 2001, prior todefault. In April 2005, a global bond exchange wasoffered. Rescheduling of official bilateral debt hasnot been completed.
Uruguay Sovereign debt exchange with NPV reduction in2003. Creditors of commercial banks also haircut.
May 03 A single global bond exchange in May 2003. Apr. 02–Mar. 05Jun. 05–Dec. 06
Turkey General commitment in 2000 by foreigncommercial banks to maintain exposure to Turkishbanks, monitored weekly.Voluntary domestic debt swap to lengthenmaturities in June 2001.Voluntary agreement in 2002 with foreign banks tomaintain exposure to Turkish banks andcompanies.
Dec. 99–Feb. 02Feb. 02–Feb. 05May 05–May 08
European crisisUkraine Nov. 08–Nov. 10
Jul. 10–Dec. 12Hungary Foreign banks agreed to maintain exposure to their
subsidiaries in Hungary.Nov. 08–Oct. 10
Iceland Losses imposed/agreed with creditors of failedIcelandic banks.
Nov. 08–Aug. 11
Latvia Foreign banks agreed to maintain exposure to theirsubsidiaries in Latvia.
Dec. 08–Dec. 11
Romania Foreign banks agreed to maintain exposure to theirsubsidiaries in Romania.
May. 09–May. 11
Greece An initial framework for PSI was agreed at the July2011 EU summit, based on a proposal by the IIF.However, concerns were raised that the targeted21% NPV reduction was too generous to creditors.In October, EU leaders agreed on an enhanced offi-cial support package, based on more substantial PSI,targeting a face value haircut of 50%. Greece's debtrestructuring discussions with creditors have notbeen completed as of Jan. 2012.
May. 10–May. 13
Ireland Haircuts on subordinated debt of government-guaranteed Irish banks.
Dec. 10–Dec. 13
Portugal May 11–May 14
a Includes operations on sovereign bonds, commercial and official loans.b The default date is defined as the month in which the government misses its first payment beyond the grace period or there is a public announcement to restructure a sovereign
debt instrument. Prior to 1995, the information refers to default or the initiation of debt restructuring negotiations based on IMF staff reports. From 1995 onward, the classificationof sovereign default by credit rating agencies is applied, using the default month provided by at least two of the agencies, see Fitch (2011), Moody's (2008) and Standard and Poor's(2010).
10 B. Barkbu et al. / Journal of International Economics xxx (2012) xxx–xxx
securitized finance. Finally, officials may have grown increasinglyconcerned over time about contagion — that restructuring by onecountry might create expectations of restructuring by others.
4.1. The 1980s debt crisis
In 1982–83, crisis countries re-negotiated debts to their commer-cial bank creditors as a precondition for Fund financing, although theresulting settlements were limited to a mix of new financing andrescheduling of principal. When it became clear that this was notenough, governments and their creditors shifted in 1984 to negotiat-ing multi-year rescheduling arrangements, although with little netpresent value reduction so as not to do too much damage to bank bal-ance sheets. When it became apparent once again that this would notbe enough to jump-start growth and restore creditworthiness, theBaker Plan was introduced in 1985, combining structural reforms witha putative commitment by the creditors to provide new financing.
Please cite this article as: Barkbu, B., et al., Financial crises and the m(2012), doi:10.1016/j.jinteco.2012.02.006
But neither renewed growth nor significant new financingmaterial-ized. Brazil responded in 1987 with a unilateral debt moratorium,mak-ing it clear that the commercial banks would have to take more losses.In 1987–8,Mexico, Argentina, Brazil, Uruguay and the Philippines nego-tiated new debt restructuring agreements, exchanging debt for exitbonds with lower face value and buying back debt at depressed marketprices.10 1989 saw the advent of the Brady Plan, which combined signifi-cant NPV reduction with collateralization of principal using U.S. Trea-sury zero-coupon bonds and reserves placed in an escrow account topay interest payments. This created a template according to which thedebts of a range of problem countries were then restructured.
ultilateral response: What the historical record shows, J. Int. Econ.
13 In Pakistan, the restructuring of sovereign debt to private creditors took place as arequirement under the comparability of treatment clause for the January 1999 ParisClub rescheduling. Pakistan received later concessional terms from the Paris Club, sub-stantially reducing the debt burden, but the impact of the private debt restructuringwas limited, as it covered debt of only 1% of GDP.14 Outside the European crisis, there are two recent precedents of debt exchanges
11B. Barkbu et al. / Journal of International Economics xxx (2012) xxx–xxx
The IMF played an important role in the Brady deals. IMF financingwas set aside for the debt reduction operations of the debtor coun-tries. There was also a commitment to augment existing programsonce the Brady deals became effective. The IMF's policy of not toleratingsovereign arrears was modified to help bring banks to the negotiatingtable. Previously, the banks knew that official credit would not be avail-able until a strategy for dealingwith arrears was agreed. This effectivelygave them a veto over IMF arrangements. In 1989 the Fund thereforemodified its arrears policy to permit Fund financing to lend into sover-eign arrears to private external creditors if two conditions were met.First, prompt IMF support is considered essential for the successful im-plementation of the adjustment program. Second, the member countryis pursuing appropriate policies and making a good faith effort to reachan agreementwith its creditors. The new policywould then tolerate ac-cumulation of arrears to commercial banks pending the negotiation of avoluntary market restructuring agreement.
Ultimately, then, the 1980s debt crisis led private and official for-eign creditors to extend substantial debt reduction. IMF policy wasimportant for bringing the banks to the bargaining table, while thefact that by the late 1980s they had already booked losses inclinedthem to accept a debt exchange with a net present value reduction.
4.2. The Tequila and Asian crises
In a departure from the previous approach combining officialfinanc-ing with NPV reduction, the Mexican crisis was met with unprecedent-ed official financing but no NPV reduction. Official financing wasprovided to support amortization of short-term sovereign obligations(tesobonos) and to help the commercial banks meet their external ob-ligations. The tesobonos were widely held and lacked well-definedlegal and operational rules for restructuring. Given the scope for themto roll off as they matured, it was considered impossible to coercivelyretain credit lines from foreign commercial banks, since doing sowould imply differential treatment of bondholders and banks.
There was no renegotiation of sovereign debt to private creditorsin the Asian crisis.11 Commitments were obtained from internationalbanks to maintain their credit lines to the private sector, but foreigncreditors did not incur significant NPV losses. One explanation offeredfor the limited extent of private sector participation was that most ofthese cases were crises of liquidity rather than solvency; financingpackages were appropriate for dealing with problems of a temporarynature.12
4.3. The Russian crisis and its aftermath
Since macroeconomic imbalances were greater in the Russian cri-sis and its aftermath, resolving them required more time, multipleprograms, and greater recourse to debt restructuring. While creditorsincurred NPV losses, the IMF again maintained an arms-length pos-ture toward restructuring negotiations.
An exceptional case was Uruguay, which combined an unprece-dented level of financing with a voluntary debt exchange. The Uru-guay program started out large (at 6% of GDP) and then wasaugmented twice in June–August 2002 amidst deposit outflows andreserve losses, ultimately reaching 19% of GDP, an enormous numberby IMF standards. While the program did not call on Uruguay to re-structure, it referred to daunting challenges to debt sustainability, dif-ficulties in meeting debt service obligations, and the need for dialogwith market participants. The Fund left the design of the exchange
11 Indonesia rescheduled debt with Paris Club creditors during 1998–2000. Anothersmall rescheduling of Indonesian government bonds occurred in 2000 during a succes-sor IMF program.12 Another significant difference from previous crises was that much of the Asian cri-sis countries' debt to foreign creditors was owed by banks and non-financial corpora-tions rather than sovereigns. There were thus many instances of bank and corporatedebt restructurings in the Asian crisis cases.
Please cite this article as: Barkbu, B., et al., Financial crises and the m(2012), doi:10.1016/j.jinteco.2012.02.006
to the authorities and their advisers while providing assurances thatfinancing gaps would be addressed. The resulting deal extended theaverage maturity of virtually all market debt by about five yearswhile maintaining the low interest rates contracted when Uruguayhad enjoyed investment grade ratings. A high participation (93%)led to a successful debt exchange, which helped reduce short-termfinancing needs while reducing the debt burden by about a relativelymodest 5% of GDP.
One explanation for why Uruguay was able to integrate debtrestructuring into its crisis resolution plans is that there was notmuch concern about contagion from Uruguay, reflecting the country'ssmall size. Another is that the actual extent of the restructuring, interms of NPV reduction, was small. In this sense, and given the enor-mity of its official financing package, Uruguay is not a particular nota-ble exception to the general trend toward finance relative torestructuring.
Another restructuring case in this period was Ukraine. Ukrainewas pulled into the crisis partly by problems in neighboring Russia,which reduced market access at a time of large sovereign debt roll-overs. Following three rounds of selective restructuring of sovereigndebt to private creditors in 1998 and 1999, Ukraine launched a com-prehensive debt exchange offer in February 2000. In total, debt in theamount of 13% of GDP was restructured.13 Again, NPV reduction rela-tive to GDP was not large, and fears of contagion were limited giventhe small size of the debt and the economy.
4.4. Europe14
Both private (bank and non-financial corporate) and public (sover-eign) debts figure in the European crisis. At the time of writing, onlyin Iceland have foreign bank creditors had to accept haircuts on theirbonds. Foreign parent banks have committed to rolling over their inter-bank credit lines and maintaining the capital of their subsidiaries inEastern European countries such as Hungary, Latvia, and Romaniathrough the European Bank Coordination Initiative (formerly the Vien-na Initiative).
In the summer of 2011, the European Union agreed that financialassistance for the Greek government should be combined withprivate-sector involvement in the form of a commitment by foreignbanks to roll over a portion of their holdings of Greek sovereigndebt as it matured. More generally, it endorsed the idea that debtrestructuring involving NPV reductions would be a part of any emer-gency financing program undertaken by their soon-to-be created Eu-ropean Stability Mechanism (ESM). In July an agreement was reachedbetween the European Union, the IMF, and the Institute of Interna-tional Finance (representing banks holding Greek debt) on a menu-based approach to restructuring the Greek sovereign's debt. Theagreement envisaged a nominal 21% reduction in the net presentvalue of the bonds, as noted above, to be achieved by the exchangeof 90% of the government's outstanding bonds into three new securi-ties. This agreement was then superseded in October by another thatforesaw a 50% NPV reduction in Greek sovereign debt in privatehands, again to be achieved through the voluntary exchange of
within Fund programs. In Jamaica, the February 2010 debt exchange on domestic debt(including foreign-currency-denominated debt) was a prior action for the approval ofthe standby arrangement. A large amount of IMF financing was provided upfront to fi-nance a fund for financial institutions holding the government debt. In Seychelles, theDecember 2008 program was based on a comprehensive restructuring of sovereigndebt to private and official creditors. But these programs are relatively small by today'sstandards (300 and 200% of quota, respectively) and the countries in question are notsystemically important.
ultilateral response: What the historical record shows, J. Int. Econ.
16 For other countries with low debts and impeccably good credit, where the provi-sion can be seen simply as an insurance policy against exogenous risks (a Japan-likeearthquake, for example), it can be argued, in parallel with the results for CACs, thatthey might end up able to borrow more. These responses should presumably be takeninto account when setting trigger levels ex ante (see below).17 Many of the same points arise in the context of GDP-indexed bonds: the possibilitythat GDP statistics might be manipulated, the difficulties of pricing, and the illiquidity
12 B. Barkbu et al. / Journal of International Economics xxx (2012) xxx–xxx
outstanding bonds into new securities. At the time of writing, negoti-ations are ongoing.
At the end of 2011, European leaders then abandoned their com-mitment that private-sector burden sharing would be part of any sub-sequent emergency financing program provided by the ESM,reflecting fears that expectations of restructuring would destabilizethe markets. Thus, whether the Greek case is a break with the broadtrend away from substantial private-sector burden sharing remainsto be seen. What is clear is that policy makers continue to resist anddelay the decision to turn to sovereign debt restructuring — as theyagain did in this case.
5. A new approach to sovereign debt restructuring
The preceding review highlights instances where officials havebeen reluctant to restructure sovereign debts even where thesehave reached levels where there are serious doubts about their sus-tainability. Lobbying by bondholders who stand to take haircutsmay prevent officials from moving. Insofar as sovereign debt restruc-turing has up-front political and economic costs but deferred benefits,elected officials with finite political lives and higher discount ratesthan society as a whole may put it off excessively.
One way of addressing this would be for future bond covenants toinclude provisions that trigger restructurings automatically. Thesewould be “sovereign cocos,” contingent debt securities that automati-cally convert when pre-specified levels of indebtedness are breached.The idea is that if adequate incentive to restructure is not presentonce a crisis starts, it should be built in ex ante.
The concept is taken from the debate over bank debt, where thereis a similar reluctance to restructure. Because of the difficulty of put-ting banks through a bankruptcy-like procedure, which among otherthings can create difficulties for bank counterparties, there is an in-centive, analogous to that which arises in the context of sovereigndebt, to provide a bailout and hope that good news will turn up ratherthan proceed with the delicate process of bailing in bondholders. Con-tingent convertible bonds (cocos) have been suggested as a solutionto this problem. When Tier 1 capital falls below a pre-specifiedlimit, these bonds automatically convert to equity, bailing in thebondholders and helping to recapitalize the bank.15
A number of banks have issued these instruments. In 2010 LloydsBanking Group Plc exchanged some of its subordinated bonds for en-hanced capital notes that become equity if the lender's core Tier 1ratio falls below 5% of assets. Rabobank Groep NV sold senior notesthat will be written down to a quarter of their face value if its capitalratio slips below 7%. Credit Suisse issued more than $2 billion of cocosin February 2011. The Bank of Cyprus received subscriptions for morethan $1.2 billion of cocos in May.
Extending this idea to the sovereign-debt domain, governmentbond contracts could provide that if a sovereign's debt/GDP ratio ex-ceeds a specified threshold, there will be an automatic reduction inprincipal and interest payments. One could also imagine making thetrigger a function of the debt service/government revenue ratio, orof a convex combination of the two ratios.
Specific triggers could be tailored to country circumstances. Aswith collective action clauses (and bank cocos, for that matter),there is no reason why different countries with different characteris-tics should have to adopt a one-size-fits-all provision.
Activation of this contractual provision would not constitute acredit event that would trigger credit default swaps (CDS) written
15 This is similar in some respects to a proposal from Weber et al. (2011) that neweuro-area bonds be required to include a contractual provision providing for a three-year maturity extension at the volition of the European Stability Mechanism whenthe latter provides an emergency loan for the government of a member state. Thetwo differences from our proposal are that Weber et al. consider maturity extensiononly and that the provision would not be automatically when a pre-specified debtthreshold was reached; rather, it would be at the volition of the ESM.
Please cite this article as: Barkbu, B., et al., Financial crises and the m(2012), doi:10.1016/j.jinteco.2012.02.006
on the government debt instruments in question. The existence oflarge quantities of CDS in the market, together with uncertaintyabout precisely which financial institutions are responsible for issuingthem, has fed the reluctance to proceed with restructuring (reluc-tance grounded in a fear of creating “an AIG-like event”). This specificobstacle to restructuring the obligations of a borderline-insolventsovereign would be relaxed by the introduction of instruments withthese provisions into the market.
Objections to the idea start with whether sovereigns would havean incentive to include such provisions in their bond contracts andwhether, even if an international agreement was reached to mandatetheir inclusion, the incentive would be to place the threshold so highas to render it meaningless. Then there is the objection that the pro-vision would increase sovereigns' borrowing costs, since investorswould be wary of being bailed in and require compensation. In strongform, the argument would be that investors would be unwilling tohold such securities at any price. Note, however, thatwhile the same ar-gument has beenmade about bank cocos, adequately capitalized bankshave not found it difficult to find willing buyers of such instruments.
Moreover, there is reason to think that borrowing costs wouldonly rise for sovereigns within hailing distance of the trigger. Empiricalwork on collective-action clauses shows that their inclusion in bondcovenants increases borrowing costs for risky sovereigns with potentialsustainability problems and not for others far from the “strike price”(Eichengreen and Mody, 2004).16 Intuition suggests that the patternwould carry over.
That borrowing costs would rise for risky borrowers as the triggeris approached is by no means undesirable. Experience suggests thatcredit spreads do not always widen gradually as debt burdens grow;rather, investors remain sanguine for extended periods before awaken-ing abruptly to the existence of sustainability problems. If coco-likeclauses serve to focus the attention of investors, adding them to bondcovenants might enhance the regularity of market discipline.
Another objection is uncertainty about the trigger. In the case ofcommercial banks, regulators in different countries value Tier 1 capi-tal in different ways, making it difficult for investors to assess whenconversion might be triggered. There might be similar uncertaintyabout how to value and what to count as debt and about the levelof GDP. To address these concerns, bond covenants could specifythat the trigger would be based on debt statistics constructed by anindependent party. Candidates would be rating agencies, Eurostat,the IMF, and the regional development banks, which publish suchnumbers as part of their normal reporting but are not parties to theagreement. To further reduce the risk of reporting bias, the agreementcould specify the trigger as the higher or lower of two independentestimates.
As with the Tier 1 capital ratio, data on sovereign debt ratios arepublished by these entities only a few times a year. But the banks'use of Tier 1 ratios suggests that this is not a problem.17
For banks, the academic literature has also suggested an equityprice as the trigger (Flannery, 2009). But bondholders may thenhave an incentive to drive down the price to the threshold level and
of the IPO market. However, where in the case of GDP-indexed bonds it is presumablyobvious in which direction a government would seek to manipulate the statistics – itwould want to understate growth in order to reduce its debt burden – the directionin which an issuer of sovereign cocos would wish to manipulate the statistics is lessclear. While understating GDP would get it a maturity extension, in practice govern-ments actively seek to avoid having to restructure, and such governments would wishto overstate GDP. Our suggestions for addressing the problem of data manipulationmight usefully be taken up by issuers of GDP-indexed bonds and sovereign cocos alike.
ultilateral response: What the historical record shows, J. Int. Econ.
13B. Barkbu et al. / Journal of International Economics xxx (2012) xxx–xxx
thereby gain preemptive access to the bank's stock at a “cheap” price(Sundaresan and Wang, 2010). Because of this possibility, there maybe multiple equilibria in the stock price (Pennacchi et al., 2010). Forsovereign cocos, the corresponding trigger would be the sovereignbond spread over a proxy for the risk-free rate. The spread is then ameasure of the risk of default, and the restructuring trigger could bea value of the spread above which a mandatory restructuring occurs.Concerns about manipulation would arise also in this case. Authori-ties could “talk up” the spread by irresponsible statements, especiallyas it nears the threshold. Equally, large investors might seek to drivedown the price of debt. Again, the risk would arise closer to thethreshold where gains from such strategies are realistic. One solutionto this problemmight be for the contract to specify a “cooling off” pe-riod, by requiring the spread to persist above the threshold for somemonths before the trigger event is established.
A further objection is that triggering a government's sovereigncocos might prevent it from issuing new bonds with similar provi-sions to fund itself. Assuming that the government had been runninglarge deficits, it would now be forced to dramatically compress publicspending, precipitating a recession. But this problem of market accessin the immediate aftermath of a restructuring holds for all restructur-ings, to a greater or lesser extent, whether the restructuring is auto-matic or discretionary. Limited amounts of official finance may thusbe called for to help bridge the gap.
Then there is the danger of contagion. There could be negativespillovers to institutional investors at home and abroad that holdthe government bonds in question. There could be negative spill-overs, both via the banking system and confidence channels, tobond markets in other countries.
But is there reason to think that the risks of contagion will begreater than under current contractual arrangements? Working inthe other direction is the argument that if a predictable process ofdebt restructuring is in place, the risk of contagion will be less sinceall parties will be forewarned of its imminence and have time to pre-pare. Even in instances of sharp changes in market sentiment, trigger-ing default and restructuring, the market would have a well-definedprobabilistic basis for anticipating the event.
A key issue would be setting the conversion trigger. The triggerneeds to be placed high enough that it is unlikely to be reached asthe result of a garden-variety recession but low enough to be brea-ched when serious issues of debt sustainability arise. It is unlikelythat the same debt-to-GDP ratio will be appropriate for differentcountries with different growth rates, real interest rates, andrevenue-raising capacities. In other words, attempts to incorporateworkable provisions of this sort into sovereign bond covenantswould confront policy makers with all the same analytical problemsof standard debt sustainability exercises — which is not to say thatthey should be relieved of trying to solve them.
Moreover, there is no reason why the trigger could not be set atdifferent levels in different countries. The Tier 1 capital thresholdfor bank cocos is set at different levels (see above). Thresholds forbondholder participation in collective action clauses differ acrosscountries (Eichengreen and Mody, 2004; Gulati and Gelpern, 2009).The same could be true for sovereign cocos. Similarly, the specifieddegree of restructuring could differ across countries — from maturityextension to outright write downs.
As in the case of collective action clauses, there is likely to be a first-mover problem. There would be fears by potential first movers of send-ing adverse signals about their creditworthiness. The first mover wouldpay a novelty and liquidity premium. This creates an argument forcountries to move together through coordinated multilateral action.
6. Conclusion
Our review of the modern history of financial crises highlights thediversity of experience — to paraphrase Anna Karenina, every
Please cite this article as: Barkbu, B., et al., Financial crises and the m(2012), doi:10.1016/j.jinteco.2012.02.006
unhappy crisis is unhappy in its own way. But it has also revealedcommon trends. The magnitude of financial reversals has tended togrow, mirroring the progress of financial liberalization and thegrowth of international capital flows. One consequence is that the fi-nancial requirements of international intervention have increased.
An explanation for this last trend is the absence of viable alterna-tives. Private lenders have an interest in holding out for full payment,whether directly from the sovereign or indirectly through resourcesprovided by international financial institutions. National officialshave an interest in pushing into the future a difficult and politicallyembarrassing restructuring. Multilaterals find it hard to go againstthe wishes of those national officials and, being risk averse, fearrestructuring as one of those “unknown unknowns.” Recognizingthat restructuring is difficult, private investors have an incentive tolend at rates that are, in retrospect, too low. Larger capital inflows giv-ing way to larger capital flow reversals implies the need for more of-ficial financing to limit the damage.
We have therefore explored the idea of automating the restructur-ing decision as a way of countering this bias. We discuss the possibilityof adding to future government bond issues so-called sovereign cocos,contractual provisions that automatically lengthenmaturities or reduceinterest and amortization payments when a pre-specified debt/GDPratio is reached. Automating the process preserves the integrity of thecontract, which avoids the uncertainties involved in triggering CDS. Itis predictable, and it can be priced.
Adding sovereign cocos to future bond issues will require solvingdifficult technical issues. It will also require solving coordinationproblems — getting governments to move together. But, equally, notaddressing the occurrence of ever-larger crises due to ever larger in-flows and subsequent large outflows of underpriced internationalcapital is a story that cannot end well.
References
Ahearne, Brian, Birgit Schmitz and Juergen vonHagen (2009), “Current Account Imbalancesand Financial Integration in the EuroArea”, unpublishedmanuscript, Bruegel andUni-versity of Bonn.
Bordo, Michael, Eichengreen, Barry, Kingebiel, Daniela, Martinez-Peria, Maria Soledad,2001. Is the crisis problem growing more severe? Economic Policy 16, 53–82.
Boughton, James M., 2000. From Suez to Tequila: the IMF as crisis manager. The Eco-nomic Journal 110, 273–291.
Boughton, James M., 2001. Silent Revolution, the International Monetary Fund,1979–89. IMF, Washington, D.C.. (July).
Celasun, Oya, Debrun, Xavier, Ostry, Jonathan, 2006. Primary surplus behavior and risksto financial sustainability in emerging market countries: a ‘fan-chart’ approach. In:Mody, Ashoka, Rebucci, Alessandro (Eds.), IMF Supported Programs: Recent StaffResearch. Washington, D.C., IMF, pp. 401–425.
Das, Udaibir, Michael Papioannou and Christoph Trebesch (2011), “Sovereign DebtRestructurings: A Survey and New Database”, unpublished manuscript, Interna-tional Monetary Fund.
Edwards, Sebastian, 1986. The pricing of bonds and bank loans in international mar-kets. European Economic Review 30 (1986), 565–589.
Eichengreen, Barry, Mody, Ashoka, 2004. Do collective action clauses raise borrowingcosts? The Economic Journal 114, 247–264.
Eichengreen, Barry, Rose, Andrew, Wyplosz, Charles, 1995. Exchange market mayhem:the antecedents and aftermath of speculative attacks. Economic Policy 21,249–312.
Eurogroup, 2010. Statement by the Eurogroup. Eurogroup, Brussels. (28 November).Fitch, 2011. Fitch Ratings Sovereign 2010 Transition and Default Study. Fitch, New
York.Flannery, Mark, 2009. Market value triggers will work for contingent capital invest-
ments. Working Paper. University of Florida.Folkerts-Landau, David, 1985. The changing role of international bank lending in develop-
ment finance. International Monetary Fund Staff Papers, 32, pp. 317–363.Gulati, Mitu, Gelpern, Anna, 2009. Innovation after the revolution: foreign sovereign
bond contracts since 2003. Capital Markets Law Journal 4, 85–103.International Monetary Fund, 1993. Restructuring of Commercial Bank Debt by Devel-
oping Countries: Lessons from Recent Experience. IMF, Washington, D.C.International Monetary Fund, 2006. Cross-Country Experience with Restructuring of
Sovereign Debt and Restoring Debt Sustainability. IMF, Washington, D.C.Moody's, 2008. Sovereign Default and Recovery Rates, 1983–2007. Moody's, New York.Pennacchi, George, Vermaelen, Theo, Wolff, Christian C.P., 2010. Contingent capital: the
case for COERCs. Faculty and Research Working Paper. INSEAD.
ultilateral response: What the historical record shows, J. Int. Econ.
14 B. Barkbu et al. / Journal of International Economics xxx (2012) xxx–xxx
Roubini, Nouriel, Setser, Brad, 2004. Bailouts or Bail-ins? Responding to Financial Crisesin Emerging Markets. Institute for International Economics, Washington, D.C.
Standard & Poor's, 2010. Sovereign Defaults and Rating Transition Data, 2009 Update.Standard & Poor's, New York.
Sundaresan, Suresh, Wang, Zhenya, 2010. Design of contingent capital with a stockprice trigger for mandatory conversion. Working Paper. Columbia University.
Please cite this article as: Barkbu, B., et al., Financial crises and the m(2012), doi:10.1016/j.jinteco.2012.02.006
Weber, Axel, Ulbricht, Jens, Wendorff, Karsen, 2011. Finanzmarktstabilität sichern,Investorenverantwortung stärken, Steuerzahler schonen Ein Vorschlag zurStärkung des Europäischen Stabilitätsmechanismus durch diegeeignete Aus-gestaltung künftiger Anleihekonditionen. Frankfurter Allgemeine Zeitung (3March).
ultilateral response: What the historical record shows, J. Int. Econ.