Volume 1 No. 5, September 2011 ISSN-2223-4985
International Journal of Information and Communication Technology Research
©2010-11 IJICT Journal. All rights reserved
http://www.esjournals.org
177
Predicting Software Build Failure Using Source Code Metrics
Andy M. Connor, Jacqui Finlay Software Engineering Research Lab,
Auckland University of Technology, Auckland, New Zealand
ABSTRACT
In this paper, we describe the extraction of source code metrics from the Jazz repository and the application of data mining techniques to
identify the most useful of those metrics for predicting the success or failure of an attempt to construct a working instance of the
software product. We present results from a study using the J48 classification method used in conjunction with a number of attribute
selection strategies applied to a set of source code metrics calculated from the code base at the beginning of a build cycle. The results
indicate that only a relatively small number of the available software metrics that we considered have any significance for predicting the
outcome of a build. These significant metrics are discussed and implication of the results discussed, particularly the relative difficulty of
being able to predict failed build attempts. The results also indicate that there is some scope for predicting the outcomes of an attempt to
construct a working instance of the software product by analysing the characteristics of the source code to be changed. This provides the
opportunity for software project managers to estimate the risk exposure of the planned changes in the build prior to commencing the
coding activities.
Keywords: Data Mining, Jazz, Software Metrics, Software Repositories
I. INTRODUCTION
Software development projects involve the use of
a wide range of tools to produce a software artifact.
Software repositories such as source control systems and
bug tracking databases have become a focus for emergent
research as being a source of information regarding the
performance and management of software development
projects. The mining of such repositories is becoming
increasingly common with a view to gaining a deeper
understanding of the development process and building
better prediction and recommendation systems. The Jazz
development environment has been recognized as offering
both opportunities and challenges in this area [1]. Jazz
integrates the software archive and bug database by
linking bug reports and source code changes with each
other through the concept of work items. Whilst this
provides much potential in gaining valuable insights into
the development process of software projects, such
potential is yet to be fully realised.
In this paper we describe an extension of
previous work [2] to continue to attempt the extraction of
rich data from the Jazz dataset by utilizing source code
metrics as a means of directly measuring the impact of
code issues on build success. In particular, in this paper we
attempt to make more useful predictions by changing the
code base on which the prediction classifier is built.
Previous work [2] utilised code that was submitted to the
repository immediately prior to the build taking place
where as in this work we utilise code that is extracted from
the repository at the beginning of the build cycle. The
ability to predict potential outcomes at the beginning of
the build cycle provides the development team with a
greater ability to manage the risk inherent in the build.
In the next section we provide a brief overview of
related work. Section 3 discusses the nature of the Jazz
data repository and metrics that we utilized to mine the
repository. In section 4, we discuss our approach to
mining the software repository in Jazz, while our results
are presented in section 5. Finally, we conclude our paper
with a discussion of the limitations of the current work and
a plan for addressing these issues in future work.
II. BACKGROUND & RELATED WORK
According to Herzig & Zeller [1], Jazz offers not
only huge opportunities for software repository mining but
also a number of challenges. One of the opportunities is
that Jazz provides a more detailed dataset in which all
artifacts are linked to each other. To date, much of the
work that utilizes Jazz as a repository has focused on the
convenience provided by linking artifacts such as bug
reports to specification items along with the team
communication history. Researchers have focused on
areas such as whether there is an association between team
communication and build failure [3] or whether it is
possible to identify relationships among requirements,
people and software defects [4]. Other work [5] has
focused purely on the collaborative nature of software
development. To date, most of the work involving the Jazz
dataset has focused on aspects other than analysis of the
source code contained in the repository.
Research that focuses on the analysis of metrics
derived from source code analysis to predict software
defects has generally shown that there is no single code or
churn metric capable of predicting failures [6, 7, 8],
though evidence suggests that a combination can be used
effectively [9]. In previous work [2] source code analysis
has been conducted on the Jazz project data to perform an
in-depth analysis of the repository to gain insight into the
usefulness of software product metrics in predicting
software build failure. Whilst some successes have been
achieved in determining the relationship between build
outcomes and source code [2] there is still a pressing need
to provide additional clarity to what is a complex problem
domain.
Buse and Zimmerman [10] suggest that whilst
software projects can be rated by a range of metrics that
Volume 1 No. 5, September 2011 ISSN-2223-4985
International Journal of Information and Communication Technology Research
©2010-11 IJICT Journal. All rights reserved
http://www.esjournals.org
178
describe the complexity, maintainability, readability,
failure propensity and many other important aspects of
software development process health, it still continues to
be risky and unpredictable. In their paradigm of software
analytics, Buse and Zimmerman suggest that metrics
themselves need to be utilised to gain insights and as such
it is necessary to distinguish questions of information
which some tools already provide (e.g., how many bugs
are in the bug database?) from questions of insight which
provide managers with an understanding of a project's
dynamics (e.g., will the project be delayed?). They
continue by suggesting that the primary goal of software
analytics is to help managers move beyond information
and toward insight, though this requires knowledge of the
domain coupled with the ability to identify patterns
involving multiple indicators.
The Jazz data has the potential to provide
sufficiently rich information to support these goals. In our
work to date [2] we have analysed the software product
metrics available through Jazz and shown that there is
scope to classify a set of software changes by the source
code metrics and predict the likely outcomes of the build
immediately prior to compilation and testing. This
prediction is based on calculation of metrics related to the
source code that has been changed throughout the build
cycle and has been finalised for inclusion. Our previous
work [2] showed that some metrics derived from such
code can be used to classify build outcome, however the
usefulness of such a prediction is limited in terms of the
timeliness of the information presented to the project
team.
This current paper therefore presents an attempt
to transform the timing of a prediction event from the time
the code is committed to the repository immediately prior
to the build to an earlier and more useful time. An early
prediction event provides greater insight into the likely
outcomes of a build and hence can be used in managing
the risk inherent in project’s dynamics and hence this
research supports the goals of the software analytics
paradigm. In this work we utilise the code extracted from
the repository at the beginning of the build cycle which
does not include any changes since the last build. In this
paper we investigate whether a similar set of metrics are
also significant in terms of predicting build outcomes
early.
III. THE JAZZ DATASET
A. Overview of Jazz
IBM Jazz is a fully integrated software
development tool that automatically captures software
development processes and artifacts. The Jazz repository
contains real-time evidence that allows researchers to gain
insights into team collaboration and development activities
within software engineering projects [11]. With Jazz it is
possible to extract the interactions between contributors in
a development project and examine the artifacts produced.
This means that Jazz provides the capability to extract
social network data and relate such data to the software
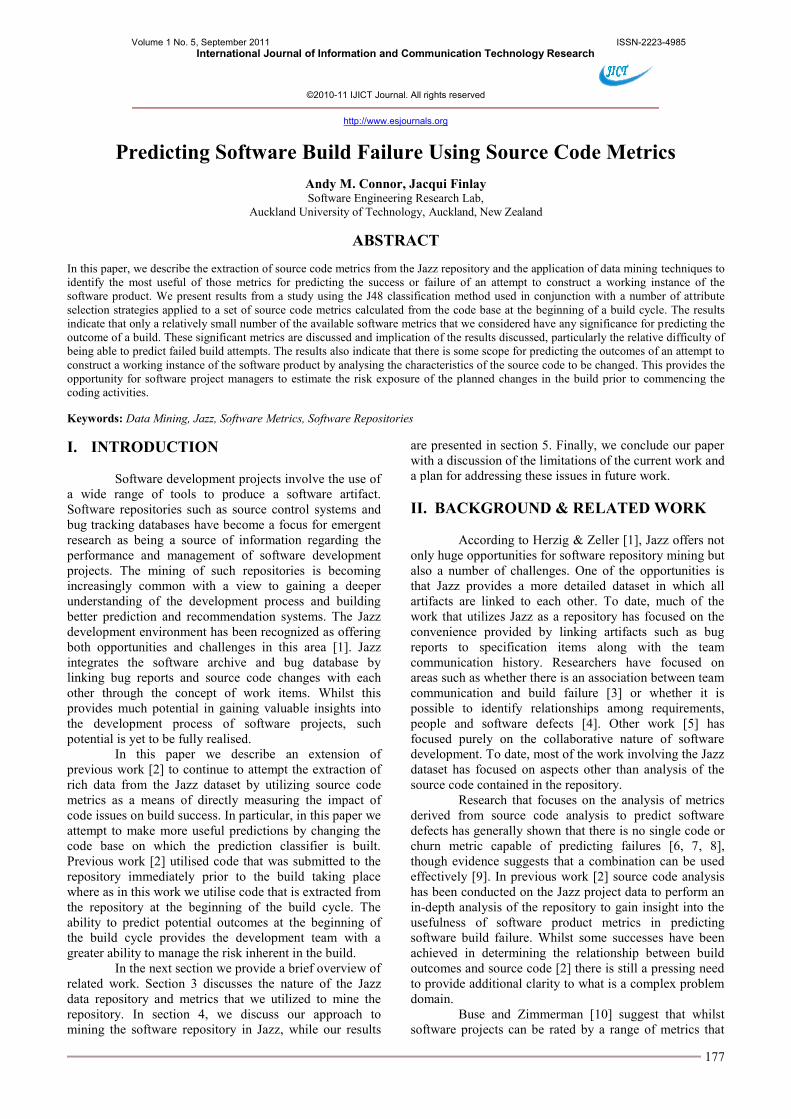
project outcomes. Figure 1 illustrates that through the use
of Jazz it is possible to visualize members, work items and
project team areas.
Figure 1: Jazz Repository: Contributors, Project
Area, Team Areas and Work Items.
The Jazz repository artifacts include work items,
build items, change sets, source code files, authors and
comments. A work item is a description of a unit of work,
which is categorized as a task, enhancement or defect. A
build item is compiled software to form a working unit. A
change set is a collection of code changes in a number of
files. In Jazz a change set is created by one author only
and relates to one work item. A single work item may
contain many change sets. Source code files are included
in change sets and over time can be related to multiple
change sets. Authors are contributors to the Jazz project.
Comments are recorded communication between
contributors of a work item. Comments on work items are
the primary method of information transfer among
developers.
There are limitations for incorporating the Jazz
repository into research. Firstly, the repository is highly
complex and has huge storage requirements for tracking
software artifacts. Another issue is that the repository
contains holes and misleading elements which cannot be
removed or identified easily. This is because the Jazz
environment has been used within the development of
itself; therefore many features provided by Jazz were not
implemented at early stages of the project. We
acknowledge the challenge in dealing with such
inconsistency and are proposing an approach that delves
further down the artifact chain than most previous work
using Jazz. It is our premise that the early software
releases were functional, so whilst the project “meta-data”
may be missing details (such as developer comments) the
source code should represent a stable system that can be
analyzed to gain insight regarding the development
project.
B. Software Metrics
Software metrics have been generated in order to
Volume 1 No. 5, September 2011 ISSN-2223-4985
International Journal of Information and Communication Technology Research
©2010-11 IJICT Journal. All rights reserved
http://www.esjournals.org
179
deal with the sparseness of the data. Metric values can be
derived from extracting development code from software
repositories. Such metrics are commonly used within
model-based project management methods. Software
metrics are used to measure the complexity, quality and
effort of a software development project [12]. The Jazz
database contains over 200 relations, containing numerous
cryptic fields that are not clearly documented. Thus data
extraction via SQL queries runs the high risk of retrieving
unreliable or incomplete data. Instead, we used the Jazz
client/server APIs, an approach recommended in a study
by Nguyen, Schröter, and Damian [11]. The Jazz API is
much better document and provides a more reliable means
of extracting data from the repository.
The Jazz repository consists of various types of
software builds. Included in this study were continuous
builds (regular user builds), nightly builds (incorporating
changes from the local site) and integration builds
(integrating components from remote sites). Source code
files were extracted for each available build within the
repository. Subsequently software metrics were generated
by utilizing the IBM Rational Software Analyzer tool. As
a result the following basic, object orientated and Halstead
software metrics were derived from the source code files
for each build. These are shown in Table 1 along with the
classification of the metric, Basic (B), Object Oriented
(OO) or Halstead (H).
Table 1: Available Metrics
ID Metric Type 1 Number of attributes B
2 Average number of attributes per class B
3 Average number of constructors per class B
4 Average number of comments B
5 Average lines of code per method B
6 Average number of methods B
7 Average number of parameters B
8 Number of types per package B
9 Comment/Code Ratio B
10 Number of constructors B
11 Number of import statements B
12 Number of interfaces B
13 Lines of code B
14 Number of comments B
15 Number of methods B
16 Number of parameters B
17 Number of lines B
18 Abstractness OO
19 Afferent coupling OO
20 Efferent coupling OO
21 Instability OO
22 Normalized Distance OO
23 Average block depth OO
24 Weighted methods per class OO
25 Maintainability index OO
26 Cyclomatic complexity OO
27 Lack of cohesion 1 OO
28 Lack of cohesion 2 OO
29 Lack of cohesion 3 OO
30 Number of operands H
31 Number of operators H
32 Number of unique operands H
ID Metric Type 33 Number of unique operators H
34 Number of delivered bugs H
35 Difficulty level H
36 Effort to implement H
37 Time to implement H
38 Program length H
39 Program level H
40 Program vocabulary size H
41 Program volume H
42 Depth of Inheritance H
In addition to software (source code) metrics a
range of metrics that are unique to the Jazz environment
are available, however at present this research only
includes whether the build attempt is successful or
whether it fails. A failed build is in essence one where the
end product does not pass all of the test cases or does not
behave as expected.
IV. EXPERIMENTAL METHOD
This work revolves around the use of
classification methods for the analysis of software metrics.
For this purpose the Weka [13] machine learning
workbench was used. There are various challenges that
arise when adopting data mining approaches. Firstly, real
life data is not always suitable for the mining process
because there can often be noise within the data, missing
data, or even misleading data that can have negative
impacts on the mining and learning process [14]. This
certainly the case with the data utilised in this research
which relates to the development of the Jazz platform by
IBM.
The primary cause of the noisy and inconsistent
data is that the project data that is extracted from Jazz was
gathered during the development of Jazz itself. As a
consequence features that automatically capture project
processes did not exist until later development stages of
Jazz meaning that gaps would often appear at early stages
of the project data set. This has presented us with a unique
challenge in terms of cleaning and preparing the data from
this software development project. Excluded from the data
set were instances that had no work items associated with
a build, build warning results and builds that had missing
values within the derived software metrics.
Software metrics from continuous builds were
used to construct the data set, however in doing so there
were more instances of successful builds than failed
builds. In order to balance the data set failed builds were
injected from nightly and integration builds. This option
was preferred over removing successful builds from the
data set, thus decreasing the possibility of model over-
fitting. In total, 129 builds were included, out of which
there were 51 successful builds and 78 failed builds. This
presents a situation where the number of features is fairly
close to the number of instances available for analysis,
which is not an ideal scenario from a data mining
perspective. One possible solution was to increase the
number of instances by including more builds but more
Volume 1 No. 5, September 2011 ISSN-2223-4985
International Journal of Information and Communication Technology Research
©2010-11 IJICT Journal. All rights reserved
http://www.esjournals.org
180
data was not forthcoming from IBM at the time that the
research was executed. Therefore we have opted to
investigate various strategies for reducing the number of
metrics used to classify the relatively small number of
builds in the dataset.
A. Dataset Representations
In the Jazz dataset a given build consists of a
number of different work items. Each work item contains
a changeset that indicates the actual source code files that
are modified during the implementation of the work item.
Each build has a corresponding before and after state.
Previous work [2] used the after state to extract source
code that included all changes in the build. The after state
was utilised in order to ensure that the source code
snapshot represented the actual software artefact that
either failed or succeeded. In this work, we utilise the
before state in order to determine whether build failure can
be predicted prior to any changes in the source code being
made. In essence, this is an attempt to characterise source
code that is about to be changed in terms of its likelihood
to be modified successfully.
Source code metrics are calculated for each
source code file in the changeset using the IBM Software
Analyser tool. In previous work [2] we conducted a
systematic study into different ways of characterising the
changeset using a single metric value to represent all
source code files in the changeset. This showed that the
most reliable approach was to calculate the value for each
metric for each source code file and then propagate the
maximum determined value up to the build level. This
approach is adopted in the current work.
B. Experiment Descriptions
The goal of our experimentation is to determine
which software metrics give the best indicators of whether
the build will be successful or will fail. Our experiments
systematically filter the available metrics using a variety
of methods to simplify the problem space and determine
the best classification trees. This is necessary as previous
work [2] has determined that the ratio of metrics (42) to
build instances (129) creates a complex classification
scenario.
The methods used to filter the metrics used are
shown in Table 2. These methods include the use of
feature selection approaches in Weka as well as more
heuristic filtering. Each strategy is based on selecting a
relatively small number of the available software metrics
and comparing them to the baseline classification where
no filtering of the metrics is done.
Strategies 2 and 3 utilise two different feature
selection algorithms available in Weka. Previous work has
shown that the use Infogain to produce a ranked list has
produced good results. However, we still investigate the
use of CfsSubset feature selection (combined with Best
First search algorithm) as this approach takes into account
combinations of metrics that are not considered when
using the Infogain algorithm (used with the Ranker search
algorithm).
Table 2: Metric Filtering Strategies
ID Strategy 1 No filtering
2 Weka Feature Selection (CfsSubset)
3 Weka Feature Selection (Infogain)
4 Basic metrics
5 Object orientated metrics
6 Halstead metrics
7 Exclude “Average number of...” metrics
8 Weka Feature Selection (CfsSubset: After)
9 Weka Feature Selection (Infogain: After)
10 Frequency Selection (After)
Strategies 4-6 are based on the classification of
metrics as given in Table 1. Strategy 7 is used to remove
metrics that may have biased values due to the technique
used to propagate a single metric value to the whole build.
Strategies 8-10 utilise results from previous work [2]
where a systematic study was conducted using Weka on
the after state of each build.
Using these filtered metrics experiments are
conducted to attempt to classify builds as either successful
or failed using the metrics calculated from source code
extracted from the before state. These experiments are
conducted to attempt to determine whether the outcome of
a build can be predicted from the characteristics of the
source code prior to any changes being made.
V. RESULTS
For each of the experiments we first apply the
metric filter strategy and then use the J48 classification
algorithm to attempt to discover common patterns
amongst the selected metrics. Given the relatively small
size of the data set we utilized 10-fold cross validation in
order to make the best use of the training data. We
acknowledge the relative optimism of cross validation and
will address this in future work when more data becomes
available from the Jazz project.
A. Classification Results: Before State
For each of the strategies outlined in section 4.2,
the selected metrics are shown in Table 3. The metric IDs
correspond to the metrics in Table 1.
Of particular interest are the results of applying
the feature selection algorithms from Weka, as both the
selection strategies are based around finding significant
impact arising in the data. This differs from the more
heuristic based filtering approaches that are based on the
classification of the metrics rather than arising from the
data. A number of the available metrics are selected when
applying both the Infogain and CfsSubst algorithms,
possibly indicating that these are stronger indicators of
build failure. These metrics include ones classified as size
and complexity metrics.
Volume 1 No. 5, September 2011 ISSN-2223-4985
International Journal of Information and Communication Technology Research
©2010-11 IJICT Journal. All rights reserved
http://www.esjournals.org
181
Table 3: Selected Metrics
ID Selected Metrics
1 N/A
2 23, 5, 2, 9, 27, 25, 32, 39
3 17, 9, 27, 23, 25, 2, 40, 32, 22, 39, 33, 29, 16, 14, 5, 26, 8, 1
4 1 - 17
5 18 - 29
6 30 - 42
7 1, 8 - 42
8 2, 8, 9, 11, 14, 23, 27, 28, 33
9 9, 2, 23, 11, 33, 32, 14, 40, 28, 27, 1, 16, 8, 29, 42
10 1, 8, 9, 10, 11, 14, 16, 23, 27, 28, 30, 32, 33, 35, 37
Table 3 shows the accuracy of the classification
for each dataset with the features selected using the each
metric selection strategy. The overall accuracy is given in
each case along with the number of correctly (and
incorrectly) classified builds. The bracketed values refer to
the number falsely predicted to be either failures (in the
case of the “Failed Builds” column) or successes (in the
case of the “Successful Builds”) column.
Table 4: Classification Results
ID Accuracy # Failed Builds
Correct (Incorrect)
# Successful Builds
Correct (Incorrect) 1 67.4419 % 22 (29) 65 (13)
2 72.8682 % 25 (26) 69 (9)
3 68.9922 % 22 (29) 67 (11)
4 67.4419 % 16 (35) 71 (7)
5 75.9690 % 34 (17) 64 (14)
6 71.3178 % 25 (26) 67 (11)
7 67.4419 % 23 (28) 64 (14)
8 82.1705 % 36 (15) 70 (8)
9 79.845 % 38 (13) 65 (13)
10 84.4961 % 40 (11) 69 (9)
These classification results support the
conclusions of our previous work [2] particularly that the
prediction of failed builds is generally more challenging
than the classification of successful builds, though some
improvement has been made by using the data relating to
the before state of the build. Of particular interest is that
the highest overall accuracy and the best classification of
failed builds come from using features selected from the
after state.
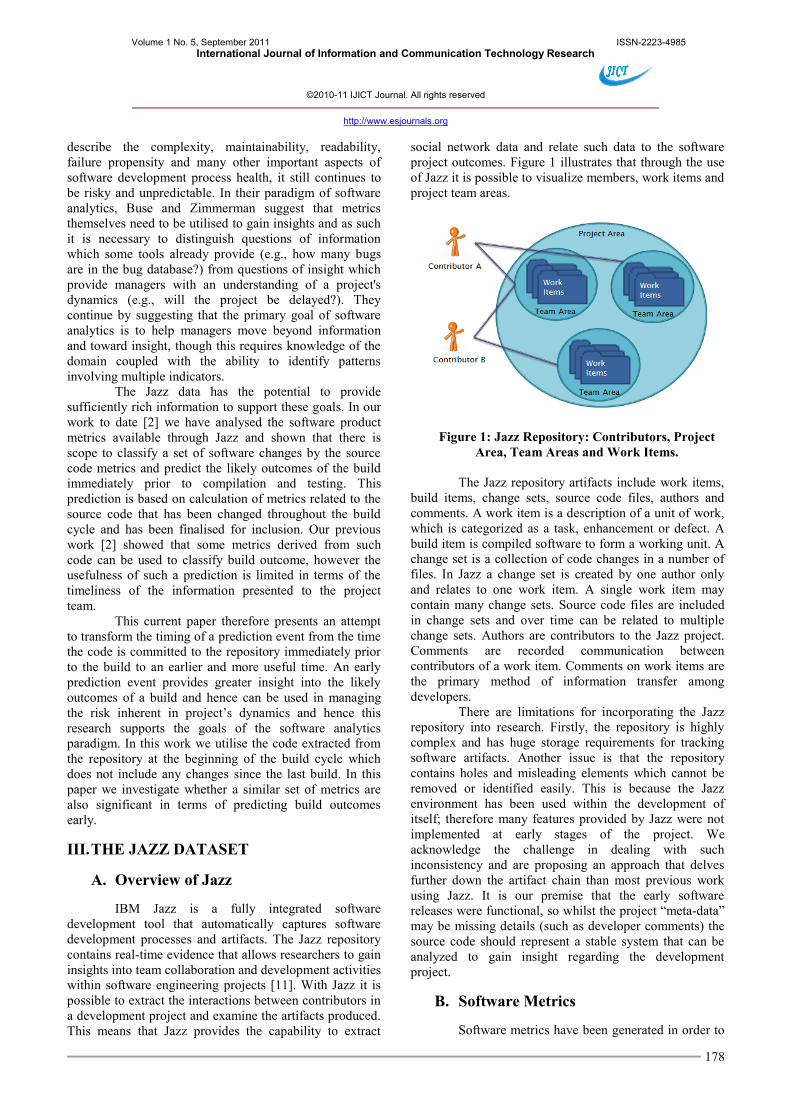
The classifications of particular interest result
from applying strategies 8, 9 and 10 as these offer
predictions comparable or better than those identified in
previous work [2]. Figure 2 shows the classification tree
for strategy 8.
Figure 2: Classification Tree (Strategy 8)
Volume 1 No. 5, September 2011 ISSN-2223-4985
International Journal of Information and Communication Technology Research
©2010-11 IJICT Journal. All rights reserved
http://www.esjournals.org
182
Inspection of the classification tree illustrates that
there is some basis for relating code quality to the
classification tree. For example, a low average block depth
is preferred with some internet sources [15] indicating
that a preferred threshold for Java source code should be
less than 2.8. In the classification tree shown in Figure 2,
an average block depth greater than 3.09 is predominately
associated with failed build except for the number of
attributes per class is small and the number of lines of
code per comment is small. This is reasonable, given that
relatively small classes that are implemented with good
commenting may be more understandable and
maintainable even if it has other less desirable
characteristics.
The other branch of the tree also survives a
simple sanity check, with many nodes displaying
classifications that are intuitive. For example, when the
number of comments is greater than 212 there is a
correlation with successful builds.
However, there is some confusion in the
classification tree arising from the number of comments
metric where ranges of metric values give rise to differing
outcomes, some of which are non-intuitive. This confusion
was also present in previous work [2] using the after state
of the source code. In Section VI of this paper and attempt
is made to manually prune the classification trees to
improve on clarity without reducing the accuracy of the
classification.
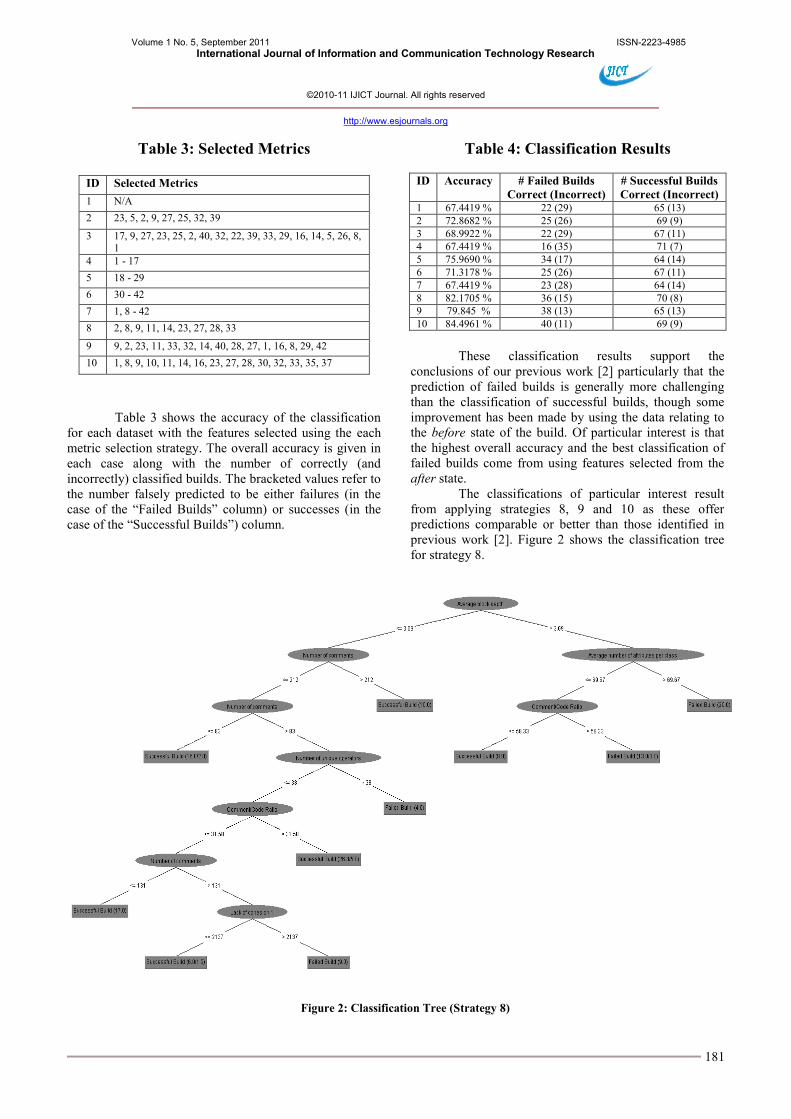
Figure 3 shows the classification tree for strategy 9.
Figure 3: Classification Tree (Strategy 9)
As with the previous classification tree, inspection
indicates that there are some common sense classifications
being made, for example a high number of unique
operands tends to be associated with failure which is
intuitive as a large code base tends to be less
understandable and maintainable than a smaller one.
Whilst the hierarchy of the classification is different from
that shown in Figure 2, the indicative values for the
classification are the same. Whilst there is some confusion
in the classification tree arising from the number of
comments metric, the degree of confusion is less than for
the classification show in Figure 2. In Section VI of this
paper and attempt is made to manually prune the
classification trees to improve on clarity without reducing
the accuracy of the classification.
Figure 4 shows the classification tree for strategy 10.
Volume 1 No. 5, September 2011 ISSN-2223-4985
International Journal of Information and Communication Technology Research
©2010-11 IJICT Journal. All rights reserved
http://www.esjournals.org
183
Figure 4: Classification Tree (Strategy 10)
This classification tree shows some similarity
with those presented in Figure 2 and 3, both in terms of
the structural elements and the metric values used for
classifying success and failure. This classification has not
the highest overall accuracy, but also the highest accuracy
in terms of identifying failed builds. There is still some
confusion in the classification tree related to the number of
comments metric. In the next section, manual pruning
strategies are investigated to improve the clarity of
classification.
VI. MANUAL PRUNING & RE-
CLASSIFICATION
All of the classification trees shown in Section V
have some similarity, both in terms of the metrics used
and the threshold values apparent in the classification. The
results not only improve on previous work [2] but also
show that it is possible to move the prediction event
forward in time to be more useful.
The confusion apparent in the classification trees
relates to the number of comments metric. All of the
classification trees also include the metric comment/code
ratio. Whilst these two metrics are not directly related, as
the total size of code base is not present in the number of
comments metric, they do measure the same
characteristics of the source code. In this section an
attempt at manually pruning the classification trees is
undertaken by removing each metric in turn and seeing the
impact on the classification. Table 5 presents the outcomes
of this activity, where the ID has been appended with an
“a” (removal of number of comments metric) and a “b”
(removal of comment/code ratio metric).
Table 5: Manual Pruning Results
ID Accuracy # Failed Builds
Correct (Incorrect)
# Successful Builds
Correct (Incorrect) 8a 79.0698 % 34 (17) 68 (10)
8b 79.0698 % 29 (22) 73 (5)
9a 78.2946 % 38 (13) 63 (15)
9b 77.5194 % 35 (16) 65 (13)
10a 83.7209 % 40 (11) 68 (10)
10b 77.5194 % 36 (15) 64 (14)
All of the attempts to manually prune the tree by
removing one of the two metrics has resulted either in a
reduction in overall accuracy, a reduction in the ability to
classify failures or both. However, as the goal was to
improve clarity in the classification this should be
expected and the only way to determine the outcomes is to
inspect the classification trees.
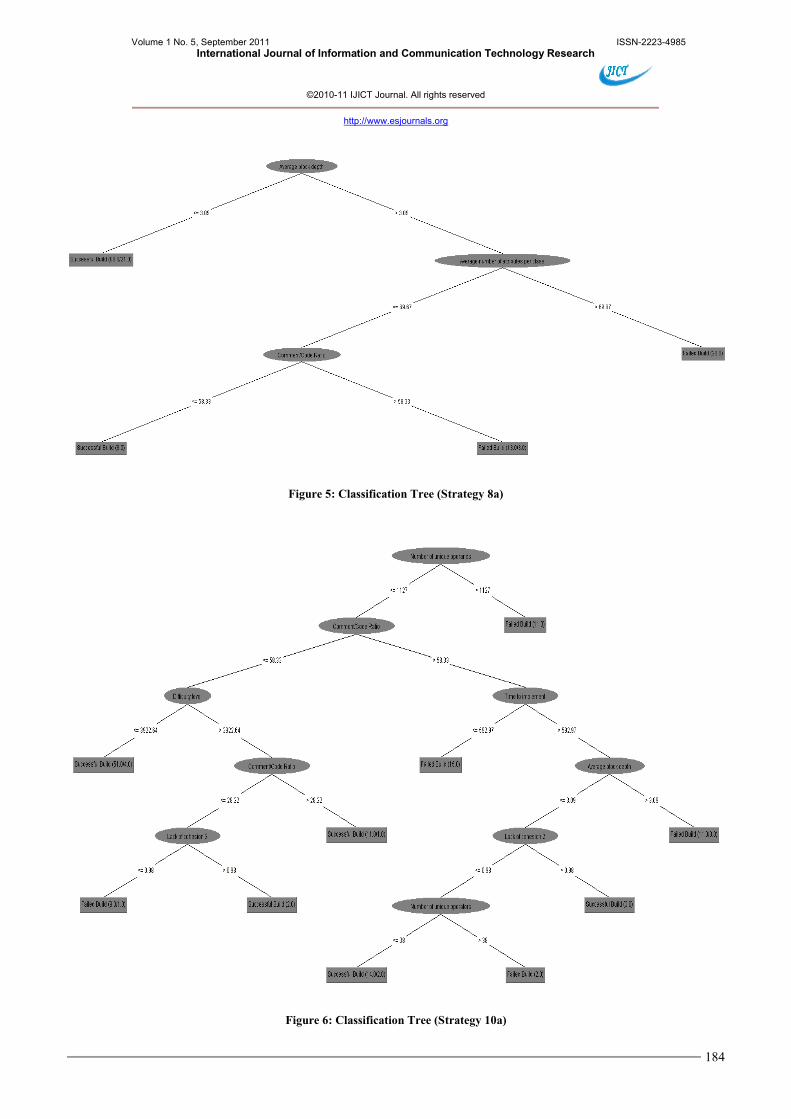
Such inspection has shown that only 8a has
resulted in classification tree with no confusion arising
from metrics appearing multiple times in the same
classification branch. This has come at the cost of a
reduced ability to identify failed builds. Figure 5 shows
the classification tree associated with this manual pruning.
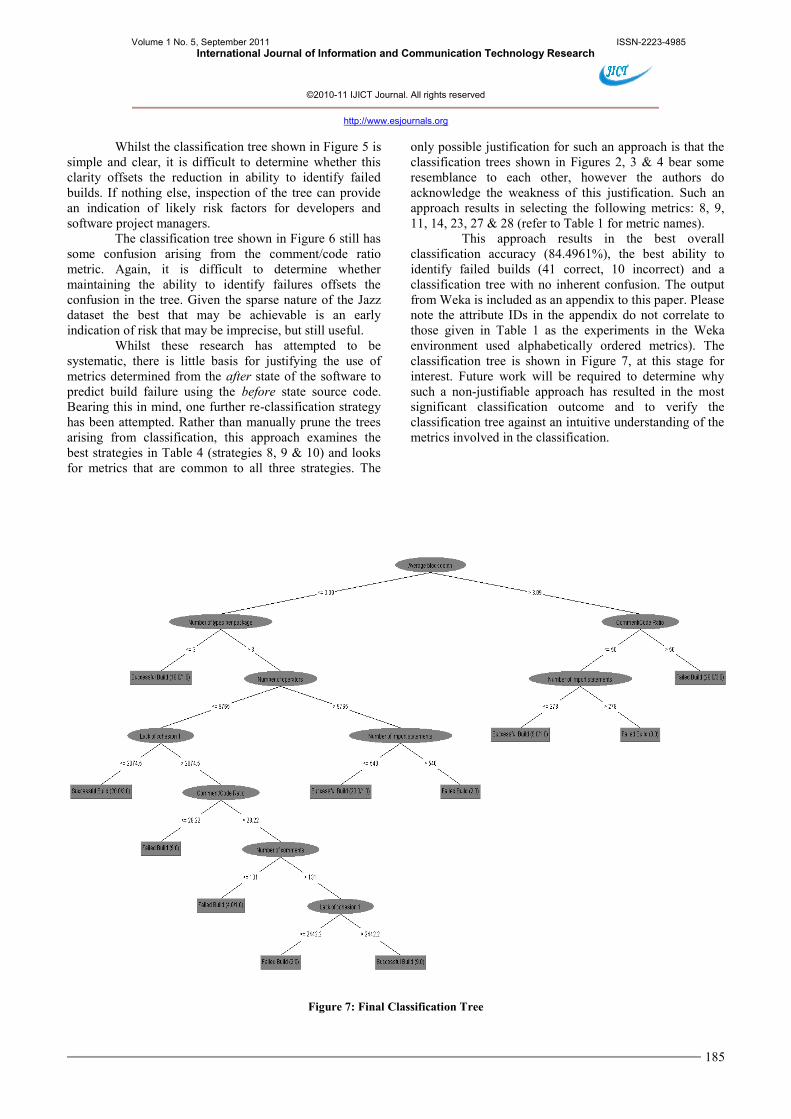
Figure 6 also shows the classification tree for 10a, for
which there is no reduction in the ability to identify
failures.
Volume 1 No. 5, September 2011 ISSN-2223-4985
International Journal of Information and Communication Technology Research
©2010-11 IJICT Journal. All rights reserved
http://www.esjournals.org
184
Figure 5: Classification Tree (Strategy 8a)
Figure 6: Classification Tree (Strategy 10a)
Volume 1 No. 5, September 2011 ISSN-2223-4985
International Journal of Information and Communication Technology Research
©2010-11 IJICT Journal. All rights reserved
http://www.esjournals.org
185
Whilst the classification tree shown in Figure 5 is
simple and clear, it is difficult to determine whether this
clarity offsets the reduction in ability to identify failed
builds. If nothing else, inspection of the tree can provide
an indication of likely risk factors for developers and
software project managers.
The classification tree shown in Figure 6 still has
some confusion arising from the comment/code ratio
metric. Again, it is difficult to determine whether
maintaining the ability to identify failures offsets the
confusion in the tree. Given the sparse nature of the Jazz
dataset the best that may be achievable is an early
indication of risk that may be imprecise, but still useful.
Whilst these research has attempted to be
systematic, there is little basis for justifying the use of
metrics determined from the after state of the software to
predict build failure using the before state source code.
Bearing this in mind, one further re-classification strategy
has been attempted. Rather than manually prune the trees
arising from classification, this approach examines the
best strategies in Table 4 (strategies 8, 9 & 10) and looks
for metrics that are common to all three strategies. The
only possible justification for such an approach is that the
classification trees shown in Figures 2, 3 & 4 bear some
resemblance to each other, however the authors do
acknowledge the weakness of this justification. Such an
approach results in selecting the following metrics: 8, 9,
11, 14, 23, 27 & 28 (refer to Table 1 for metric names).
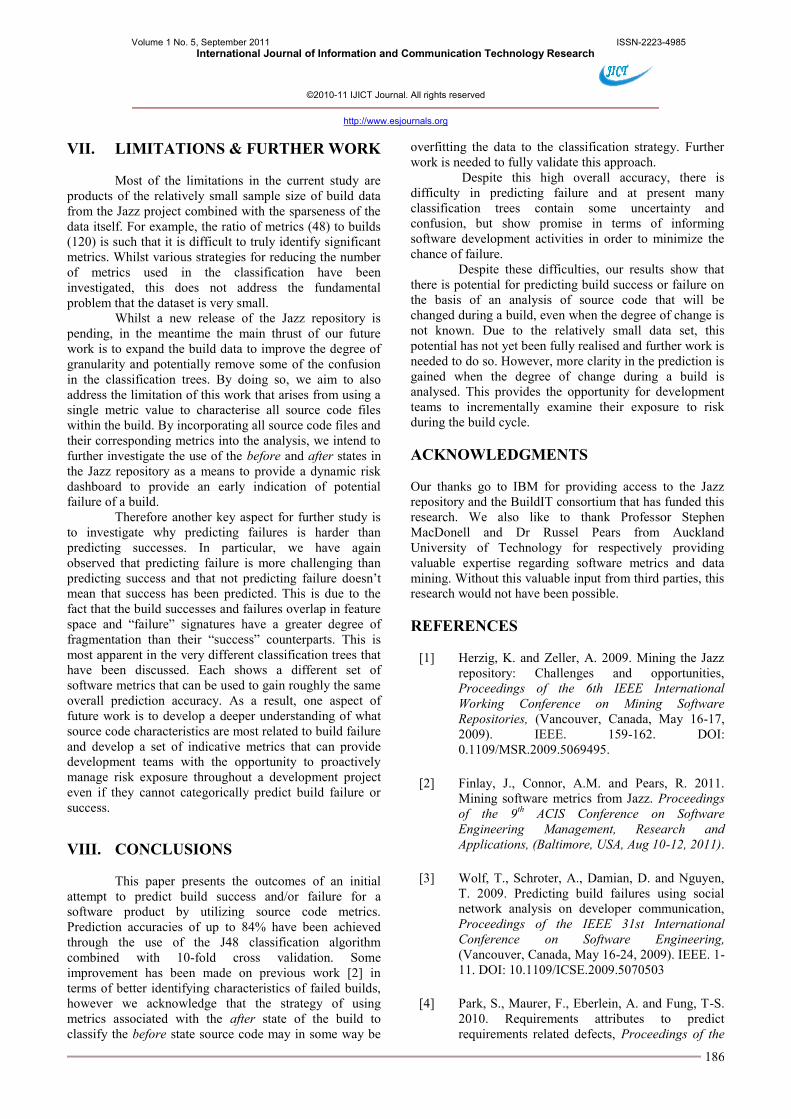
This approach results in the best overall
classification accuracy (84.4961%), the best ability to
identify failed builds (41 correct, 10 incorrect) and a
classification tree with no inherent confusion. The output
from Weka is included as an appendix to this paper. Please
note the attribute IDs in the appendix do not correlate to
those given in Table 1 as the experiments in the Weka
environment used alphabetically ordered metrics). The
classification tree is shown in Figure 7, at this stage for
interest. Future work will be required to determine why
such a non-justifiable approach has resulted in the most
significant classification outcome and to verify the
classification tree against an intuitive understanding of the
metrics involved in the classification.
Figure 7: Final Classification Tree
Volume 1 No. 5, September 2011 ISSN-2223-4985
International Journal of Information and Communication Technology Research
©2010-11 IJICT Journal. All rights reserved
http://www.esjournals.org
186
VII. LIMITATIONS & FURTHER WORK
Most of the limitations in the current study are
products of the relatively small sample size of build data
from the Jazz project combined with the sparseness of the
data itself. For example, the ratio of metrics (48) to builds
(120) is such that it is difficult to truly identify significant
metrics. Whilst various strategies for reducing the number
of metrics used in the classification have been
investigated, this does not address the fundamental
problem that the dataset is very small.
Whilst a new release of the Jazz repository is
pending, in the meantime the main thrust of our future
work is to expand the build data to improve the degree of
granularity and potentially remove some of the confusion
in the classification trees. By doing so, we aim to also
address the limitation of this work that arises from using a
single metric value to characterise all source code files
within the build. By incorporating all source code files and
their corresponding metrics into the analysis, we intend to
further investigate the use of the before and after states in
the Jazz repository as a means to provide a dynamic risk
dashboard to provide an early indication of potential
failure of a build.
Therefore another key aspect for further study is
to investigate why predicting failures is harder than
predicting successes. In particular, we have again
observed that predicting failure is more challenging than
predicting success and that not predicting failure doesn’t
mean that success has been predicted. This is due to the
fact that the build successes and failures overlap in feature
space and “failure” signatures have a greater degree of
fragmentation than their “success” counterparts. This is
most apparent in the very different classification trees that
have been discussed. Each shows a different set of
software metrics that can be used to gain roughly the same
overall prediction accuracy. As a result, one aspect of
future work is to develop a deeper understanding of what
source code characteristics are most related to build failure
and develop a set of indicative metrics that can provide
development teams with the opportunity to proactively
manage risk exposure throughout a development project
even if they cannot categorically predict build failure or
success.
VIII. CONCLUSIONS
This paper presents the outcomes of an initial
attempt to predict build success and/or failure for a
software product by utilizing source code metrics.
Prediction accuracies of up to 84% have been achieved
through the use of the J48 classification algorithm
combined with 10-fold cross validation. Some
improvement has been made on previous work [2] in
terms of better identifying characteristics of failed builds,
however we acknowledge that the strategy of using
metrics associated with the after state of the build to
classify the before state source code may in some way be
overfitting the data to the classification strategy. Further
work is needed to fully validate this approach.
Despite this high overall accuracy, there is
difficulty in predicting failure and at present many
classification trees contain some uncertainty and
confusion, but show promise in terms of informing
software development activities in order to minimize the
chance of failure.
Despite these difficulties, our results show that
there is potential for predicting build success or failure on
the basis of an analysis of source code that will be
changed during a build, even when the degree of change is
not known. Due to the relatively small data set, this
potential has not yet been fully realised and further work is
needed to do so. However, more clarity in the prediction is
gained when the degree of change during a build is
analysed. This provides the opportunity for development
teams to incrementally examine their exposure to risk
during the build cycle.
ACKNOWLEDGMENTS
Our thanks go to IBM for providing access to the Jazz
repository and the BuildIT consortium that has funded this
research. We also like to thank Professor Stephen
MacDonell and Dr Russel Pears from Auckland
University of Technology for respectively providing
valuable expertise regarding software metrics and data
mining. Without this valuable input from third parties, this
research would not have been possible.
REFERENCES
[1] Herzig, K. and Zeller, A. 2009. Mining the Jazz
repository: Challenges and opportunities,
Proceedings of the 6th IEEE International
Working Conference on Mining Software
Repositories, (Vancouver, Canada, May 16-17,
2009). IEEE. 159-162. DOI:
0.1109/MSR.2009.5069495.
[2] Finlay, J., Connor, A.M. and Pears, R. 2011.
Mining software metrics from Jazz. Proceedings
of the 9th ACIS Conference on Software
Engineering Management, Research and
Applications, (Baltimore, USA, Aug 10-12, 2011).
[3] Wolf, T., Schroter, A., Damian, D. and Nguyen,
T. 2009. Predicting build failures using social
network analysis on developer communication,
Proceedings of the IEEE 31st International
Conference on Software Engineering,
(Vancouver, Canada, May 16-24, 2009). IEEE. 1-
11. DOI: 10.1109/ICSE.2009.5070503
[4] Park, S., Maurer, F., Eberlein, A. and Fung, T-S.
2010. Requirements attributes to predict
requirements related defects, Proceedings of the
Volume 1 No. 5, September 2011 ISSN-2223-4985
International Journal of Information and Communication Technology Research
©2010-11 IJICT Journal. All rights reserved
http://www.esjournals.org
187
20th Annual International Conference on
Computer Science and Software Engineering,
(Markham, Canada, Nov 1-2, 2010), ACM, 42-
56. DOI=10.1145/1923947.1923953
[5] Nguyen, T., Wolf, T. and Damian, D. 2008.
Global Software Development and Delay: Does
Distance Still Matter? Proceedings of the IEEE
International Conference on Global Software
Engineering, (Bangalore, India, August 17-20,
2008). IEEE. 45-54.DOI:
10.1109/ICGSE.2008.39
[6] Nagappan, N., Ball, T. and Zeller, A. 2006.
Mining metrics to predict component failures.
Proceedings of the 28th International Conference
on Software Engineering, (Shanghai, China, May
20-28, 2006). IEEE. 452–461.
[7] Basili, V. R., Briand,L. C. and Melo, W. L. 1996.
A validation of object-oriented design metrics as
quality indicators. IEEE Transactions on
Software Engineering, 22(10), 751–761.
[8] Denaro, G., Morasca, S. and Pezz`e, M. 2002.
Deriving models ofsoftware fault-proneness.
Proceedings of the 14th International Conference
on Software Engineering and Knowledge
Engineering, (Ischia, Italy, July 15-19, 2002).
ACM. 361–368.
[9] Mockus, A. and Weiss, D. M. 2000. Predicting
risk of software changes. Bell Labs Technical
Journal, 5(2), 169–180.
[10] Buse, R. P. L. and Zimmermann, T. 2010.
Analytics for Software Development.
Proceedings of the FSE/SDP Workshop on the
Future of Software Engineering Research, (Santa
Fe, New Mexico, USA, Nov 7-8, 2010).ACM,
77-80. DOI=10.1145/1882362.1882379.
[11] Nguyen, T., Schröter, A., and Damian, D. 2008.
Mining Jazz: An experience report. Proceedings
of the Infrastructure for Research in
Collaborative Software Engineering Conference.
Retrieved 24/1/2011 from
http://home.segal.uvic.ca/~pubs/pdf/112/2008-
iReCoSE.pdf
[12] Manduchi,G. and Taliercio, C. 2002. Measuring
software evolution at a nuclear fusion experiment
site: a test case for the applicability of OO and
reuse metrics in software characterization,
Information and Software Technology, 44(10),
593-600.DOI: 10.1016/S0950-5849(02)00079-4
[13] Hall, M., Frank, E. Holmes, G.,Pfahringer, B.,
Reutemann, P. and Witten, I. H. 2009. The
WEKA Data Mining Software: An Update;
SIGKDD Explorations, 11(1), 10-18.
DOI=10.1145/1656274.1656278
[14] Chau, D., Pandit, S., and Faloutsos, C. (2006).
Detecting Fraudulent Personalities in Networks
of Online Auctioneers. Knowledge Discovery in
Databases 4213, 103-114, DOI:
10.1007/11871637_14.
[15] Wanner, J.F. (2000). Source Monitor: Expose
Your Code. Dr Dobbs Journal, March 2000.
Retrieved 28/7/2011 from
http://drdobbs.com/cpp/184404041
APPENDIX
=== Run information ===
Scheme:weka.classifiers.trees.J48 -C 0.25 -M 2
Relation:Jazz_MAX_Before-weka.filters.unsupervised.attribute.Remove-R2-3,5-10,12-17,20-24,26-27,29-
32,34,36-43
Instances:129
Attributes:9
BuildResult
Average block depth
Comment/Code Ratio
Lack of cohesion 1
Lack of cohesion 2
Number of comments
Number of import statements
Number of operators
Number of types per package
Test mode:10-fold cross-validation
=== Classifier model (full training set) ===
J48 pruned tree
------------------
Volume 1 No. 5, September 2011 ISSN-2223-4985
International Journal of Information and Communication Technology Research
©2010-11 IJICT Journal. All rights reserved
http://www.esjournals.org
188
Average block depth <= 3.09
| Number of types per package <= 3: Successful Build (19.0/1.0)
| Number of types per package > 3
| | Number of operators <= 9765
| | | Lack of cohesion 1 <= 2074.5: Successful Build (20.0/3.0)
| | | Lack of cohesion 1 > 2074.5
| | | | Comment/Code Ratio <= 28.22: Failed Build (9.0)
| | | | Comment/Code Ratio > 28.22
| | | | | Number of comments <= 131: Failed Build (4.0/1.0)
| | | | | Number of comments > 131
| | | | | | Lack of cohesion 1 <= 2442.2: Failed Build (2.0)
| | | | | | Lack of cohesion 1 > 2442.2: Successful Build (9.0)
| | Number of operators > 9765
| | | Number of import statements <= 540: Successful Build (23.0/1.0)
| | | Number of import statements > 540: Failed Build (2.0)
Average block depth > 3.09
| Comment/Code Ratio <= 50
| | Number of import statements <= 278: Successful Build (9.0/1.0)
| | Number of import statements > 278: Failed Build (3.0)
| Comment/Code Ratio > 50: Failed Build (29.0/3.0)
Number of Leaves : 11
Size of the tree : 21
Time taken to build model: 0seconds
=== Stratified cross-validation ===
=== Summary ===
Correctly Classified Instances 109 84.4961 %
Incorrectly Classified Instances 20 15.5039 %
Kappa statistic 0.6757
Mean absolute error 0.217
Root mean squared error 0.3755
Relative absolute error 45.34 %
Root relative squared error 76.7743 %
Total Number of Instances 129
=== Detailed Accuracy By Class ===
TP Rate FP Rate Precision Recall F-Measure ROC Area Class
0.804 0.128 0.804 0.804 0.804 0.837 Failed Build
0.872 0.196 0.872 0.872 0.872 0.837 Successful Build
Weighted Avg. 0.845 0.169 0.845 0.845 0.845 0.837
=== Confusion Matrix ===
a b <-- classified as
41 10 | a = Failed Build
10 68 | b = Successful Build