JOURNAL OF L A T E X CLASS FILES, VOL. XX, NO. XX, MONTH YEAR 1 Emotions and Perceived Productivity of Software Developers at the Workplace Daniela Girardi, Filippo Lanubile, Nicole Novielli, Alexander Serebrenik Abstract—Emotions are known to impact cognitive skills, thus influencing job performance. This is also true for software development, which requires creativity and problem-solving abilities. In this paper, we report the results of a field study involving professional developers from five different companies. We provide empirical evidence that a link exists between emotions and perceived productivity at the workplace. Furthermore, we present a taxonomy of triggers for developers’ positive and negative emotions, based on the qualitative analysis of participants’ self-reported answers collected through daily experience sampling. Finally, we experiment with a minimal set of non-invasive biometric sensors that we use as input for emotion detection. We found that positive emotional valence, neutral arousal, and high dominance are prevalent. We also found a positive correlation between emotional valence and perceived productivity, with a stronger correlation in the afternoon. Both social and individual breaks emerge as useful for restoring a positive mood. Furthermore, we found that a minimum set of non-invasive biometric sensors can be used as a predictor for emotions, provided that training is performed on an individual basis. While promising, our classifier performance is not yet robust enough for practical usage. Further data collection is required to strengthen the classifier, by also implementing individual fine-tuning of emotion models. Index Terms—Emotion awareness, emotion detection, biometric sensors, empirical software engineering, human factors ✦ 1 I NTRODUCTION Affective states such as personality traits, attitudes, moods, and emotions play a crucial role on people’s everyday performance at work, especially for activities that require creativity and problem-solving skills [1], as software de- velopment. Programmers experience and express different emotions [2] during their daily work, which may have an impact on job performance. According to Graziotin et al. [3], happy software devel- opers achieve better performance. Conversely, unhappiness brings developers to lose motivation in completing tasks and to leave the company [4]. The relation between positive emotions and self-assessed productivity was also confirmed by recent lab studies [5], [6], which also investigate the triggers for emotions experienced by developers during programming tasks. Being stuck and working under time pressure emerged as the most frequent causes for negative emotions, as well as unexpected technical difficulties and unfulfilled information needs. Along the same line, a recent field study at Microsoft investigated what makes a working day a good day for software developers [7]. The authors found that good workdays increase job satisfaction, which is reported as associated to the perception of contributing value to a project. In this study, we focus on the emotions experienced by software developers at the workplace. Consistently with previous research on developers’ emotions during program- ming tasks [6], [8], [9], we operationalize emotions along continuous dimensions. Following Russel [10], we describe • D. Girardi, F. Lanubile, and N. Novielli are with the University of Bari, Italy. E-mail: [email protected], fi[email protected], [email protected]• A.Serebrenik is with the Eindhoven University of Technology, The Nether- lands. E-mail: [email protected]the emotion stimulus in terms of its (un)pleasantness, rang- ing from low to high valence, and level of activation, ranging from low to high arousal. Furthermore, we include consid- eration of dominance, that is a person’s perception of being in control of a situation. A priori, one might have thought that developers, being human beings, should experience the entire range of emotions at the workplace. However, different professionals have been shown to experience and express different ranges of emotions while at work: e.g., Foster and Sayers [11] reported about physiotherapists not experiencing calmness and serenity, which in our terms would correspond to high valence and low arousal. As such, we formulate our first research question as follows: RQ1 What is the range of developers’ emotions at the workplace? As a second goal, we aim at investigating the relation- ship between self-reported emotions and productivity at the workplace. Previous studies conducted in a laboratory setting [6], [8], [9] report a positive association between emo- tional valence and self-assessed productivity of software developers engaged in a programming task. We seek to con- firm and extend these findings in an in-vivo setting, by also expanding the observation period to the entire workday. As such, we formulate our second research question as follows: RQ2 To what extent are developers’ emotions related to self-assessed productivity during the workday? Being able to identify the most frequent triggers for positive and negative emotions of developers enables in- formed decisions about the organization of work, towards improving the general well-being as well as the productivity of the individuals and the teams [7]. As such, we formulate our third research question:
Transcript
JOURNAL OF LATEX CLASS FILES, VOL. XX, NO. XX, MONTH YEAR 1
Emotions and Perceived Productivity of SoftwareDevelopers at the Workplace
Daniela Girardi, Filippo Lanubile, Nicole Novielli, Alexander Serebrenik
Abstract—Emotions are known to impact cognitive skills, thus influencing job performance. This is also true for software development,which requires creativity and problem-solving abilities. In this paper, we report the results of a field study involving professionaldevelopers from five different companies. We provide empirical evidence that a link exists between emotions and perceived productivityat the workplace. Furthermore, we present a taxonomy of triggers for developers’ positive and negative emotions, based on thequalitative analysis of participants’ self-reported answers collected through daily experience sampling. Finally, we experiment with aminimal set of non-invasive biometric sensors that we use as input for emotion detection. We found that positive emotional valence,neutral arousal, and high dominance are prevalent. We also found a positive correlation between emotional valence and perceivedproductivity, with a stronger correlation in the afternoon. Both social and individual breaks emerge as useful for restoring a positivemood. Furthermore, we found that a minimum set of non-invasive biometric sensors can be used as a predictor for emotions, providedthat training is performed on an individual basis. While promising, our classifier performance is not yet robust enough for practicalusage. Further data collection is required to strengthen the classifier, by also implementing individual fine-tuning of emotion models.
Index Terms—Emotion awareness, emotion detection, biometric sensors, empirical software engineering, human factors
F
1 INTRODUCTION
Affective states such as personality traits, attitudes, moods,and emotions play a crucial role on people’s everydayperformance at work, especially for activities that requirecreativity and problem-solving skills [1], as software de-velopment. Programmers experience and express differentemotions [2] during their daily work, which may have animpact on job performance.
According to Graziotin et al. [3], happy software devel-opers achieve better performance. Conversely, unhappinessbrings developers to lose motivation in completing tasksand to leave the company [4]. The relation between positiveemotions and self-assessed productivity was also confirmedby recent lab studies [5], [6], which also investigate thetriggers for emotions experienced by developers duringprogramming tasks. Being stuck and working under timepressure emerged as the most frequent causes for negativeemotions, as well as unexpected technical difficulties andunfulfilled information needs. Along the same line, a recentfield study at Microsoft investigated what makes a workingday a good day for software developers [7]. The authorsfound that good workdays increase job satisfaction, whichis reported as associated to the perception of contributingvalue to a project.
In this study, we focus on the emotions experiencedby software developers at the workplace. Consistently withprevious research on developers’ emotions during program-ming tasks [6], [8], [9], we operationalize emotions alongcontinuous dimensions. Following Russel [10], we describe
• A.Serebrenik is with the Eindhoven University of Technology, The Nether-lands. E-mail: [email protected]
the emotion stimulus in terms of its (un)pleasantness, rang-ing from low to high valence, and level of activation, rangingfrom low to high arousal. Furthermore, we include consid-eration of dominance, that is a person’s perception of beingin control of a situation. A priori, one might have thoughtthat developers, being human beings, should experiencethe entire range of emotions at the workplace. However,different professionals have been shown to experience andexpress different ranges of emotions while at work: e.g.,Foster and Sayers [11] reported about physiotherapists notexperiencing calmness and serenity, which in our termswould correspond to high valence and low arousal. As such,we formulate our first research question as follows:
RQ1 What is the range of developers’ emotions at theworkplace?
As a second goal, we aim at investigating the relation-ship between self-reported emotions and productivity atthe workplace. Previous studies conducted in a laboratorysetting [6], [8], [9] report a positive association between emo-tional valence and self-assessed productivity of softwaredevelopers engaged in a programming task. We seek to con-firm and extend these findings in an in-vivo setting, by alsoexpanding the observation period to the entire workday. Assuch, we formulate our second research question as follows:
RQ2 To what extent are developers’ emotions related toself-assessed productivity during the workday?
Being able to identify the most frequent triggers forpositive and negative emotions of developers enables in-formed decisions about the organization of work, towardsimproving the general well-being as well as the productivityof the individuals and the teams [7]. As such, we formulateour third research question:
JOURNAL OF LATEX CLASS FILES, VOL. XX, NO. XX, MONTH YEAR 2
RQ3 What are the triggers for developers’ positive andnegative emotions at the workplace?
Finally, we believe that enabling early detection of de-velopers’ emotions while at work might be useful to sup-port their productivity and well-being, e.g. by suggestingjust-in-time corrective actions thus preventing unhappinessand burnout, which might eventually lead to undesiredturnover [12], [13] or by implementing strategies to sup-port emotional awareness [14]. We envision the emergenceof tools supporting the developers’ well-being, leveragingnon-invasive biometric sensors for timely and effective iden-tification of negative emotions. Towards this goal, we aimat assessing the performance of a sensor-based classifierfor emotional valence. As such, we formulate our fourthresearch questions as follows:
RQ4 To what extent we can predict the emotions of soft-ware developers at the workplace using lightweightbiometric sensors?
To address our research questions, we performed a fieldstudy with 21 participants from 5 companies monitored fora minimum of two weeks during their daily activities. Weasked participants to periodically self-report their emotionalstate, the performed activity, and their perceived productiv-ity. Furthermore, we asked them to explain the causes forthe reported emotions.
To answer RQ1 and RQ2, we analyze the range of emo-tions reported and their relation with perceived progressby fitting a linear-mixed model, as in previous work [3],[5], [6]. We collect self-reports about developers’ emotionsusing a 5-point pictorial scale for each emotional dimension.To account for individual differences in self-reporting, westandardize scores before investigating the correlation withproductivity, in line with previous research [5], [6], [8].
To answer our next research question (RQ3), we performa qualitative analysis of the data collected through self-report. Specifically, we execute a coding study aimed atdiscovering the causes of positive and negative emotionsexperienced by software developers at work.
As for sensor-based emotion recognition (RQ4) we usesupervised machine learning to train a classifier for de-velopers’ emotions based on biometric features. We relyon a minimal set of biometrics including the galvanic skinresponse and heart-related measurements, collected using awristband, in line with previous findings that such sensorconfiguration is reliable in a lab environment [6].
The contributions of this work are as follows:
• We develop a taxonomy of emotional triggers relatedto software development at workplace;
• We build and assess a supervised classifier for devel-oper’s emotions at the workplace based on develop-ers’ biometrics collected using non-invasive sensors;
• We confirm and extend previous findings from labstudies by investigating the relation between emo-tions and perceived productivity during workdays;
• We build and distribute a lab package to verify,replicate, and build upon the present study1.
1. Available at: https://github.com/collab-uniba/biometrics
The reminder of the paper is structured as follows. InSection 2 we present the background and related work. InSection 3 the data collection protocol of the field study. Then,we provide empirical answers to our RQs inSections 4, 5,and 6. Finally, we discuss the implications and threats tovalidity in Section 7, and conclude in Section 8.
2 BACKGROUND AND RELATED WORK
2.1 Emotion modelWe ground our study on the categorization of emotions byRussel [15], also known as the Circumplex Model of Affect.The model represents emotions according to valence, i.e. thepleasantness vs. unpleasantness of the emotion stimuli, andarousal, i.e. its level of activation vs. deactivation. Pleasantemotional states, such as happiness, are associated withpositive valence, while unpleasant ones, such as sadness, areassociated with negative valence. Arousal describes the levelof activation of the emotional state ranging from inactiveor low, as in calmness or depression, to active or high, asin excitement or tension. Beyond valence and arousal, andin line with previous studies [3], [16], we measure affectivestates according to a third dimension known as dominance(or control), that is the extent to which an individual feels incontrol of the situation.
2.2 Emotion Awareness in Software DevelopmentWhy are developers (un)happy? Ford and Parnin [17]surveyed 45 software developers to identify the causes offrustration while programming. They provide a list of 11categories, which include issues with program comprehen-sion or poor tooling, personal issues, and fear of failure.Graziotin et al. [18] further contribute to the identification ofcauses for developers’ emotions through a survey involving∼2K developers. Among the top 10 frequent causes ofunhappiness, they include being stuck in problem solving,time pressure, dealing with bad code quality or under-performing colleagues, feeling inadequate or suffering frompersonal issues not related to work, dealing with bad deci-sion making or investing time in mundane repetitive tasks.
Two lab studies leveraged experience sampling to iden-tify the reasons for positive and negative emotions whileprogramming [5], [6]. They found that developers getannoyed by low perceived productivity while they feelhappy when in flow. Other reasons for negative emotionsare related to cognitive difficulties, impossibility to fulfillinformation needs, and code not working [5], [6].
In the current paper, we ground our investigation ofthe triggers for developers’ emotions on the findings of theaforementioned studies. We use their findings to compilean initial list of codes employed in the qualitative analysisof the developers’ answers collected during our study. Weextend the list and organize the results of our qualitativeanalysis in a taxonomy of emotion triggers (see Section 5).
Emotions and Productivity. Findings from recent stud-ies appear to converge towards the claim that ’happy de-velopers solve problems better’ [19]. Graziotin and col-leagues [4] found consequences of happiness and unhappi-ness experienced by software developers. Specifically, theyreport on the impacts of emotions and how they are ben-eficial or detrimental for the developers’ well-being, the
JOURNAL OF LATEX CLASS FILES, VOL. XX, NO. XX, MONTH YEAR 3
software development process, and the quality of artifacts.Wrobel [20] surveyed 56 programmers and found that pos-itive emotions increase developers’ productivity while neg-ative ones decrease it. Graziotin and colleagues conducteda series of studies on the correlation between developers’(un)happiness and their creativity, and analytical problem-solving skills of software developers [19]. In a controlledexperiment, Graziotin et al. [8] empirically assess the cor-relation between developers’ perceived productivity andself-reported valence, arousal, and dominance. They founda correlation between the productivity and both valenceand dominance dimensions. These findings have been con-firmed by Muller and Fritz [5] as well as Girardi et al. [6].
In this study, we reuse and adapt the experience-sampling approach from Muller and Fritz [5] and Girardiet al. [6] to perform an in-vivo study in five software devel-opment companies. By doing so, we aim at overcoming thelimitations posed by the in vitro nature of lab studies.
2.3 Sensor-based Emotion Detection
The link between emotions and physiological feedback iswidely investigated by affective computing research, whichleverages a broad range of biometric measurements aspredictors of emotions. Electroencephalography (EEG) recordselectrical activity of the brain through electrodes placed onthe surface of the scalp. Variation in the EEG spectrumhave been successfully used as a proxy for arousal or alert-ness [21] as well as emotional valence [22], [23] Electrodermalactivity (EDA) is a measure of the electrical activity of theskin due to the variation in human body sweating. EDAvaries consistently with intensity of emotions, with moreevident changes for high arousal and emotional intesity [24].Thus, EDA has been employed to detect excitement, stress,interest, attention, as well as anxiety and frustration [25]Heart-related measurements have been successfully leveragedfor emotion detection [26]. They include heart rate (HR),which is number of contractions of the heart (beats) perminute as well as its variation in the time interval be-tween two consecutive heartbeats, called heart rate vari-ability (HRV). HR can be derived from the blood volumepulse (BVP) obtained by using of a photoplethysmogra-phy sensor. Bradley and Lang found that heart rate slowsdown when people feel negative emotions [24]. Eye-relatedmeasurements have been also used for emotion detection.For example, gaze duration is greater when people lookat emotional pictures compared to neutral ones [27], whilechanges in the pupil dilatation indicate mental effort andaffective responses [28]. Electromyography (EMG) capturesthe electrical activity in tissues, bones and skin due to themuscle contraction. Affective computing studies use facialmuscle contraction, e.g., due to smiling and frowning, as anindicator of emotions [29].
Sensing developers’ emotions. Vrzakova et al. [30]used eye gaze and EDA for classifying developers’ valenceand arousal during code review. They conducted an in-situ experiment with 37 software developers working oncode reviews. The results show that the eye gaze is themost predictive measurement both for valence and arousal(accuracy=85.8% and 76.6%). However, considering the fea-tures of all signals in combination, including EDA, authors
achieve even better results both for valence and arousal(accuracy=90.7% and 83.9%). Muller and Fritz trained asupervised emotion classifier able to distinguish betweenpositive and negative valence with an accuracy of 71% [5].They train a classifier using biometrics from 17 participantsworking on two programming tasks. The model achievesthe best performance using a combination of EEG, EDA,HR, and eye-tracking metrics. Girardi et al. ran an empiricalstudy aimed at identifying the minimal set of non-invasivebiometric sensors for emotion recognition during program-ming tasks [6]. They trained two supervised classifiers forvalence and arousal using as a gold standard the emotionsself-reported by 23 participants during a Java programmingtask. They identified a minimum set of sensors—EDA, BVP,and HR measured using the Empatica E4 wristband—thatcan be used in an experimental protocol for detecting emo-tions during software development tasks. Specifically, usingthe wristband only they achieve an accuracy for valence(.71) and arousal (.65) comparable to the one obtained usingthe full sensors settings (i.e., wristband + EEG helmet). Assuch, in the present study, we use the Empatica wristbandonly for measuring both EDA and heart-related biometrics.
3 STUDY DESIGN
3.1 Pilot study
The study design [31] was consolidated through a pilotstudy. Three professional developers working for a softwaredevelopment SME in Bari, Italy, were asked to wear the Em-patica wristband for one week, during which they reportedtheir emotions and activity using the pop-up application.After the pilot was concluded, we engaged with them inindividual follow-up interviews, asking for their feedbackabout the study. The developers confirmed that reportingemotions once per hour through the pop-up was not an-noying and that the Empatica wristband was comfortable towear. In addition, they gave us two suggestions: i) adding“Just arrived” to the list of activities for filling the pop-up at the beginning of the day, when developers has notstarted any activity yet and ii) recommending to the futureparticipants to insert the pop-up application in the startupfolder of their own PC, in order to not forget to start it.
3.2 Companies and Participants
Five Dutch software development companies participatedin the study: one startup (1 founder and 2 employees), twoSMEs (between 20 and 200 employees), and two large com-panies (> 20.000 employees). The companies participatingin our study develop software for a wide range of ap-plications, including software for food-sorting technology,integrated circuits and semiconductor-based products, toolsand data-driven products to support healthcare systems,manufacturing systems, and cyber-security applications, aswell as a broad range of IT products also for domesticand personal use. All teams, whatever the company, followan Agile software development method according to theprinciples behind the Agile Manifesto [32], which involvesan iterative and incremental software process style to en-courage fast reaction to changes and frequent communi-cation. Among the agile principles there is the need for
JOURNAL OF LATEX CLASS FILES, VOL. XX, NO. XX, MONTH YEAR 4
running retrospective meetings, in which the team discussesproblems, identify (un)effective solutions, and report indi-vidual feelings to improve self-organization. Retrospectivemeetings are conducted at the end of each iteration, whichcan be 2-4 week long. The term ‘iteration’ is also known as‘sprint’, which has been popularized by Scrum2, the mostpopular Agile method.
We recruited participants among professional softwaredevelopers, on a voluntary basis. In order to recruit partic-ipants, the first author (hereinafter experimenter) organizeddedicated meetings (one for each company) to explain thepurpose of the study, the participants’ role, the protocolof the experiment, and the possible risks and benefits inparticipating. Overall, 21 developers participated in thestudy (18 men, 3 women), with an average age of 33 years(± 7.2, ranging from 23 to 50). Participants reported anaverage experience in software development of 8 years (±6.2, ranging from 1 to 25).
3.3 InstrumentationEmpatica E4. The Empatica E4 wristband3 is equipped withan EDA sensor and a BVP sensor, where the latter is used toderive HR and HRV. Following the Empatica guidelines,4
we excluded HRV because it is considered unreliable inpresence of body movement as in our study. In fact, ourparticipants wear the wristband for the entire day, includingbreaks, in which it is not uncommon for them, based onwhat they report, to take a walk. EDA and BVP are recordedwith a sample frequency of 4Hz and 64Hz respectively.
Self-report of Emotions and Productivity. We use ex-perience sampling [33] to collect developers’ emotions andperceived productivity during working days. This choice isconsistent with the methodology adopted by lab studieson emotions and productivity conducted by Muller andFritz [5] and Girardi et al. [6]. We developed a pop-up5
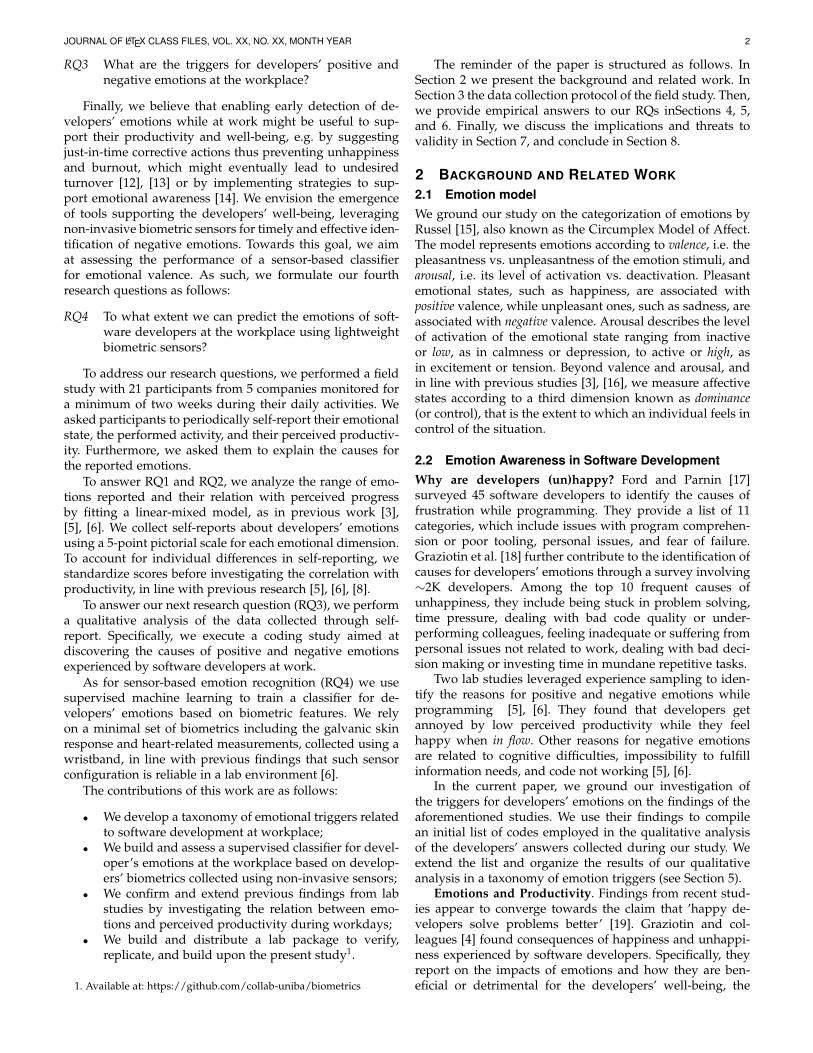
to self-report the valence, the arousal and the dominancescores using the Self-Assessment Manikin (SAM), in linewith recommendation by Graziotin et al. [34]. SAM is anassessment technique for reliable self-report of emotions interms of valence, arousal, and dominance. In their empir-ical study on measuring emotions, Bradley and Lang [35]demonstrated that the SAM approach is effective in mea-suring a person’s affective reaction to a wide variety ofstimuli in many contexts. SAM implements a non-verbalpictorial assessment technique consisting of 5 figures foreach emotional dimension (see Figure 1). We use a 5-pointpictorial scale for each emotional dimension, as this scaleis easily understood and widely used in studies aiming atcollecting affective states [3], [29].
In addition to the emotions, we ask participants to reportthe activity in which they were involved at the momentof the interruption and their perceived productivity. As foractivity, we provide a drop-down list, based on previouswork by Meyer et al. [7] including: coding, bug fixing, testing,design, meeting, email, helping, networking, learning, adminis-trative task, documentation, just arrived, other. We also include
Fig. 1. The pop-up window to elicit perceived emotion and productivity
the ‘just arrived’ label that was added as a result of thepilot study (see Section 3.1), to be used at the beginningof the workday, upon arrival at the office. For perceivedproductivity, we use a 5-point Likert scale (from Very low toVery high), in line with previous studies [3], [6], [36]. Finally,we ask the participants to motivate the ratings provided, i.e.to explain the causes for the reported emotions.
3.4 Study set-up
The day before starting the experiment, the experimentermet the developers involved in the study. During thismeeting, the experimenter demonstrated how to wear thewristband in order to get the proper acquisition of biometricsignals. Then, she illustrated how to download and installboth the pop-up application and the tool, called E4 manager,for transferring data from the wristband to the participants’computer. Next she explained how to use the SAM scales forself-reporting valence, arousal, and dominance. A printedimage of the Circumplex Model of Affect was also providedto help participants in correctly rating their emotions. Then,the experimenter answered the participants’ questions andthen they signed the informed consent form. Finally, aprivate Dropbox folder was created for each participant, toallow them sharing data with the experimenter.
3.5 Experimental Protocol
The day after the set-up is completed, the experiment canstart. For each participant, we observe and collect data fortwo or three weeks, based on the agile iteration length at thecompany, thus covering all key technical activities. Everyday, the participants follow the steps reported in Figure 2.
Upon arrival at the office, participants wear the EmpaticaE4 and run the pop-up application. By default the pop-up appears on the participant’s monitor once per hour.We define this interval inspired by the study design ofMeyer et al. [37], who studied the developers’ productivity
JOURNAL OF LATEX CLASS FILES, VOL. XX, NO. XX, MONTH YEAR 5
Fig. 2. The developer’s working day during the study
using an analogous pop-up. Specifically, they report that 60minutes was a good balance between the intrusiveness andthe necessity of collecting as much data as possible, as alsoemerged during our pilot study. When the developers donot want to be interrupted, they can postpone answeringthe pop-up by specifying the delay in minutes. To reduceintrusiveness of the pop-up we follow the recommendationsof Meyer et al. [37] and allow the participants to dismissthe pop-up for the entire day. Conversely, the participantscan invoke the pop-up manually, when experiencing strongemotions that believe are important to be reported.
At the end of the day, the participants export the pop-up data as a .csv file, containing one row for every self-reported episode with the corresponding timestamp. Then,they download the data from the wristband using the E4manager application. Finally, all data are added to thefolder shared with the experimenter. At the end of thefirst week, the experimenter reviews the data obtained tocheck for consistency and completeness. Should additionalinformation be required, she contacts the participants viae-mail. At the end of the study, the experimenter visitsthe company to collect the wristbands. Before providingthe wristbands to the new participants, personal data areremoved from the Empatica E4 devices. During the finalmeeting, the experimenter also provides a company-leveloverview of the emotions experienced by the participantsincluding information about the main emotion triggers.
The study protocol has been approved by the ethi-cal review board of Eindhoven University of Technology.6
The main ethical concerns of the study were related tocollection of personal data such as names and biometricmeasurements. To address privacy concerns, we enableddata sharing through Dropbox Business as it is compliantto the European General Data Protection Regulation policy.By doing so, we were able to solve privacy issues in terms ofprotection against unauthorised data access. This was alsomade explicit in the ethical review board application as wellas in the consent form signed by the participants.
4 SELF-REPORTED EMOTIONS AND CORRELA-TION WITH PRODUCTIVITY
4.1 Dataset
Each participant reported emotions either for two or threeweeks, depending on the duration of the agile iteration.Overall we have self-report data for 192 days out of 240overall days of the study. The missing days are mainlydue to participants not being at work, either for vacation,or health/personal issues (31 days). Among these, one of
6. Approval number: 2019ECMCS02.
Fig. 3. Developers’ valence, arousal, dominance, productivity at work.
the participants was always off on Thursday (3 days overallover three weeks dedicated to the study). For three partici-pants working at the same company we are missing the lastday only (3 days overall), which might be due to internalreasons. Finally, we have 5 missing days for which theparticipants did not provide any explanation. Overall, wemiss data for 42 days (17.5% of the total days of the study).
On average, participants filled the pop-up 5.4 times perday (sd = ± 1.24). Overall, we collected 1255 self-reports. Forthe purpose of this analysis we excluded the cases where theparticipant reported to be ”just arrived”, which identifiesthe first self-report made by the developers as soon as theyarrive at the workplace. As such, information about self-perceived productivity is not available for these instances.Thus, we consider these instances as not relevant for thestudy of the correlation between self-reported emotions andproductivity. After this step, 1098 self-reports remained, ofwhich 404 collected during before 12PM (morning) and 694after 12PM (afternoon).
4.2 Developers’ Emotion at the Workplace (RQ1)The boxplot in Figure 3 shows the SAM scores the devel-opers reported during the study. We observe that the entirerange of emotions is covered by the scores reported, in linewith findings of the lab experiment by Girardi et al. [6]. Forboth valence and dominance the average self-report scoreis 4, indicating that developers mostly experience pleasantemotions and feel in-control of the situation. For arousal,developers report on average a neutral state (SAM score =3) and the distribution is well balanced between low (SAMscore = 1) and high arousal (SAM score = 5) arousal. Forproductivity, developers report the whole range of valuesfrom very low (score = 1) to very high (score = 5), withan overall tendency to report average (score = 3) to aboveaverage productivity (score = 4), as previously observed inthe lab study by Muller and Fritz [5].
The observed range of valence scores is in line with find-ings by Graziotin et al. [18], reporting that a Github develop-ers prevalently self-report positive emotions, thus depictingthemselves as moderately happy population. Analogously,Muller and Fritz observed that the professional developersinvolved in their lab study reported the full range of valencevalues, with an average score corresponding to slightlypositive valence [5]. In both studies, the participants holdan experience of about 7-8 years, which is comparable tothe one of the developers involved in our field study. Con-versely, Girardi et al. [6] mostly observed students reportingnegative emotions and high arousal while coding, whichcan be explained by the students being less experienced andfeeling less confident in solving the assigned programmingtask compared to professional software developers.
JOURNAL OF LATEX CLASS FILES, VOL. XX, NO. XX, MONTH YEAR 6
A possible interpretation of our results can be providedin the light of previous findings by Mantyla et al. [16], pre-senting empirical evidence that novice developers are moreinclined to negative valence and high arousal. Furthermore,experience has been reported as negatively correlated witheffort—i.e., more experienced developers need less effort tocomplete a task [12], [38]. In line with this interpretation,the lower level of experience of the students in the previouslab study by Girardi et al. [6] is reflected in the fact thatthey mostly reported being stuck. Conversely, we observeda more balanced distribution, slightly skewed in favor ofpositive self-assessed productivity (see Fig. 3), in line withMuller and Fritz [5] reporting a more balanced distributionof progress with the majority of participants feeling in flow.As a further confirmation of this interpretation, we observean average dominance score of 4 (see Fig. 3), indicating agood self-assessed confidence by the participants.
Takeaway message for RQ1 - Developers report a widerange of emotions at the workplace. We observe aprevalence of positive valence, neutral arousal, andhigh dominance, indicating they mostly experiencepleasant emotions and feel in control of the situation.
4.3 Emotions and Productivity (RQ2)
We study the correlation between self-reported emotionsand productivity by fitting a linear mixed model, whichis robust in case of repeated measurements and longitu-dinal data [39]. To create the model, we used the lme4R package.7 Consistently with the approach adopted inthe former studies [5], [8], we consider productivity asthe dependent variable and valence, arousal, dominance asfixed effects. Given our study design, we cannot excludethat the perceived productivity can be impacted by time, e.g.due to fatigue [17]. Therefore, time and its interaction withthe emotional dimensions are also included in the modelas fixed effects. Specifically, we model time as the part ofthe day (morning or afternoon) during which participantsanswered the pop-up. This choice is justified by findingsof psychology research by Stone et al. [40], investigatingdiurnal rhythms of emotions during working days. They re-port a strong bimodal pattern for both positive and negativeemotions, with differences in emotion peaks before and afterlunchtime. In our study, we model as morning/afternoonthe self reports made before/after 12PM, corresponding tolunch break in the Netherlands.
To account for individual differences in self-reportingemotions due to a personal perception of the SAM scale,we use Z-scores to standardize the raw scores, as alreadydone in previous work [5], [6], [8]. Finally, to account fordifferences due to personal (e.g., personality) or environ-mental (e.g., company) factors, we also include participantsand companies as random effects.
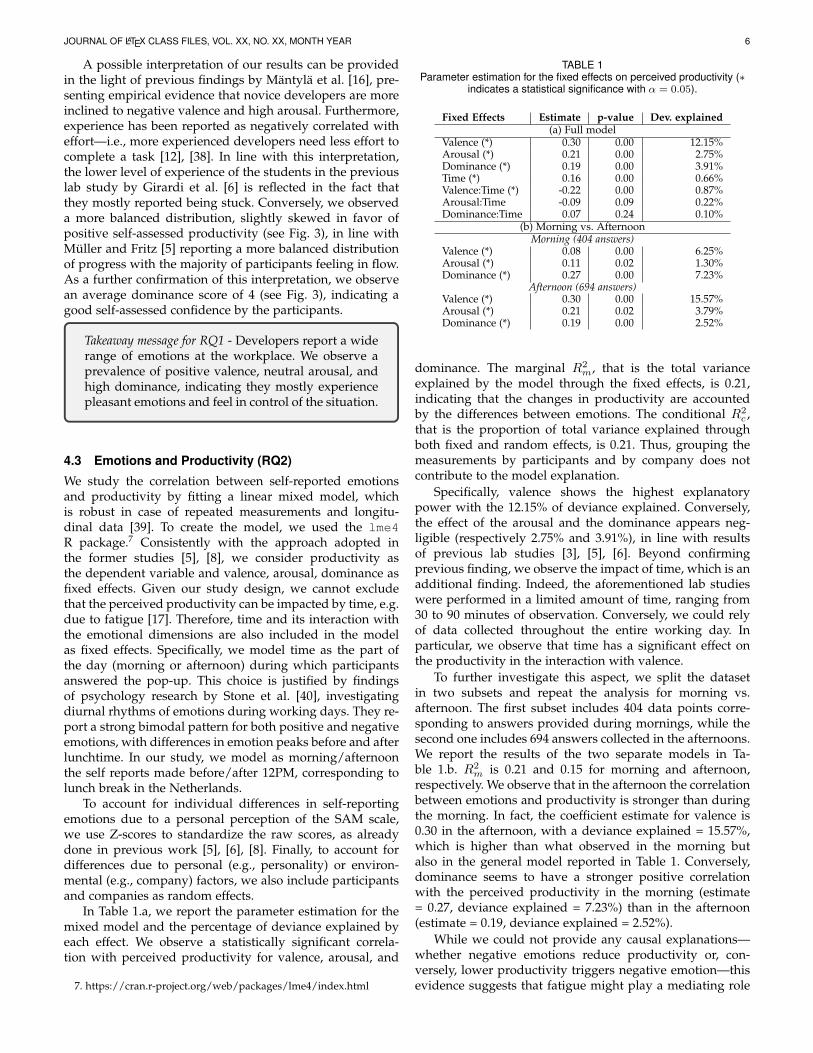
In Table 1.a, we report the parameter estimation for themixed model and the percentage of deviance explained byeach effect. We observe a statistically significant correla-tion with perceived productivity for valence, arousal, and
dominance. The marginal R2m, that is the total variance
explained by the model through the fixed effects, is 0.21,indicating that the changes in productivity are accountedby the differences between emotions. The conditional R2
c ,that is the proportion of total variance explained throughboth fixed and random effects, is 0.21. Thus, grouping themeasurements by participants and by company does notcontribute to the model explanation.
Specifically, valence shows the highest explanatorypower with the 12.15% of deviance explained. Conversely,the effect of the arousal and the dominance appears neg-ligible (respectively 2.75% and 3.91%), in line with resultsof previous lab studies [3], [5], [6]. Beyond confirmingprevious finding, we observe the impact of time, which is anadditional finding. Indeed, the aforementioned lab studieswere performed in a limited amount of time, ranging from30 to 90 minutes of observation. Conversely, we could relyof data collected throughout the entire working day. Inparticular, we observe that time has a significant effect onthe productivity in the interaction with valence.
To further investigate this aspect, we split the datasetin two subsets and repeat the analysis for morning vs.afternoon. The first subset includes 404 data points corre-sponding to answers provided during mornings, while thesecond one includes 694 answers collected in the afternoons.We report the results of the two separate models in Ta-ble 1.b. R2
m is 0.21 and 0.15 for morning and afternoon,respectively. We observe that in the afternoon the correlationbetween emotions and productivity is stronger than duringthe morning. In fact, the coefficient estimate for valence is0.30 in the afternoon, with a deviance explained = 15.57%,which is higher than what observed in the morning butalso in the general model reported in Table 1. Conversely,dominance seems to have a stronger positive correlationwith the perceived productivity in the morning (estimate= 0.27, deviance explained = 7.23%) than in the afternoon(estimate = 0.19, deviance explained = 2.52%).
While we could not provide any causal explanations—whether negative emotions reduce productivity or, con-versely, lower productivity triggers negative emotion—thisevidence suggests that fatigue might play a mediating role
JOURNAL OF LATEX CLASS FILES, VOL. XX, NO. XX, MONTH YEAR 7
in the relationship between negative emotions and per-ceived productivity, assuming that developers become moretired towards the end of the working day (i.e., in the after-noon). This suggestion is consistent with previous resultsreporting fatigue as a cause for negative emotions [17]. Wecan also interpret this results in light of previous findingsby Sarkar and Parnin [41]: the authors found that fatigueharmed developers’ productivity as well as the quality oftheir work, creativity, and motivation. Previous evidence inpsychology [42] corroborates this interpretation, indicatingthat mental fatigue following cognitive tasks impairs emo-tion regulation. This would explain the stronger correlationbetween valence and productivity in the afternoon, suggest-ing that developers might be more successful in restoringtheir positive mood in the morning, when they are less tired.
Takeaway message for RQ2 - Valence is positively cor-related with perceived productivity, with strongercorrelation in the afternoon. Conversely, the cor-relation between dominance and productivity isstronger in the morning. This could be due to fa-tigue, which is known to impair emotion regulation.
5 TAXONOMY OF EMOTION TRIGGERS
5.1 Methodology
We manually analyzed the developers’ answers to the open-ended question about the causes for the self-reported emo-tions. We performed qualitative data analysis in a semi-exploratory mode, by adopting the answer as annotationunit. Overall, we collected 350 answers describing the rea-sons for emotion scores. We decided to manually code allanswers received, including those with neutral valence, toaccount for possible inconsistencies between the answersand the self-reported valence scores.
During the first coding iteration, two authors analysed100 responses, randomly extracted from the full set of 350answers. They used a closed coding approach [43], startingfrom a list of 48 codes derived from previous studies in-vestigating the causes for positive and negative emotions ofsoftware developers [5], [6], [17], [18]. For example, Mullerand Fritz identify feeling-in flow and being stuck as triggersfor positive and negative emotions, respectively [5], whileFord and Parnin [17] found that fatigue is one of the triggersfor frustration. Hence, we include feeling-in flow, being stuckand fatigue in the initial list, together with 45 others derivedfrom the aforementioned studies. The two authors labeledeach answer using codes from the initial list, thus creatinga preliminary taxonomy. They could also assign to eachanswer more than one code, if needed. Furthermore, theycould add new codes when they failed to find the mostappropriate one in the list. Upon completion of the individ-ual coding round, the entire team discussed the results tosolve disagreements and reconcile the newly added codes.As result of this iteration, 11 new codes were added to theinitial list, thus resulting in 59 codes overall.
We re-coded the initial 100 answers according to the finalset of 59 codes and repeated the annotation on the remaining250 answers. During this second round, a third author was
involved in the coding such that each answer was coded bytwo people. We reached saturation after this second round,as only one code was added to denote answers describingemotion triggers related to the study itself (i.e., Meta, seeTable 2). Once again, the entire dataset of 350 answers wasre-coded to incorporate the new code.
After this coding round, we removed from the datasetthe 68 answers for which a neutral emotion score wasprovided, in line with our goal of identifying a taxonomyof triggers for positive and negative developers’ emotionsat the workplace (RQ3). For the same reason, we filter outfurther answers. Specifically, we removed the 7 answersreferring to meta topics, as they do not provide any usefulinformation regarding the developers’ activity in relationto their workday. Furthermore, we discarded 43 answerswhere the participants did not answer the question butrather provided a generic description of the activity per-formed rather than an explanation of the trigger for theself-reported emotion. Overall, this cleaning step resultedin a final dataset of 232 answers, of which 157 (68%) and 75(32%) are associated with positive and negative emotions,respectively. 9 answers received two codes, thus resultingin 241 codes overall. We used this dataset to finalize thetaxonomy. First, we included the code used for the 232 an-swers describing the triggers for either positive or negativeemotions. Then, we grouped them to capture relationshipsand themes by applying axial coding [44]. This was donethrough two further iterations consisting in plenary meet-ings involving all the authors.
5.2 Results (RQ3)
The taxonomy of emotion triggers in shown in Table 2. Sixthemes emerge: self refers to the developers themselves,developer-task relation describes the link between the devel-oper and the task, artifacts and instrumentation include prop-erties of tools and source code as triggers for emotions, socialrefers to peers and collaborators, work management refersto issues with artifacts, design, and implementation of thetask. Non-work time is also included to cluster individual andsocial breaks. Overall, we identified 18 triggers for positiveemotions and 19—for negative emotions. In addition, welooked into data to verify what are the triggers reportedfor extremely negative (valence score = 1) and extremelypositive (valence score = 5) emotions. In commenting Ta-ble 2, we report these observations as well, where relevant.Furthermore, we offer a comparison with previous work oncauses for developers’ emotions [5], [6], [17], [18] we buildupon in defining our initial set of codes.
Self. The most frequent trigger for emotions refers tothe self dimension (11 codes, 95 occurrences overall). Theparticipants reported feeling in-flow as the main cause forpositive emotions, that is a distraction-free state while writ-ing code or performing coding-related activities (“Organiz-ing my workflow a little better than usual. Feel optimistic aboutgetting a lot of work done on this feature today.”). Analogously,being able to conclude assignments (task completed) relatesto a sense of accomplishment associated with positive emo-tional valence (“Finished coding the today’s task”). Conversely,being stuck is a cause for negative emotions (“Getting veryannoyed by an annoying bug I can’t solve.”), thus confirming
JOURNAL OF LATEX CLASS FILES, VOL. XX, NO. XX, MONTH YEAR 8
TABLE 2Triggers for positive and negative emotions at workplace identified after coding. Code occurrences in the corpus are reported in parentheses.
ProductivityFeeling in-flow (37)Start working (1)Task completed (11)
Being stuck (8)
Perception of self Feeling confident (4) Feeling inadequate (3)Mental state Fatigue (10)Personal issues Personal positive facts (6) Personal problems (11)
Self11 codes (95)
Motivation Boost of motivation (4) Lack of motivation (1)Novelty of the task Thrilled by new challenges (3) Mundane or repetitive task (2)Code Comprehension Understanding relevant code (2) Problems in Mapping Behavior to Cause (11)Solution design Clear solution design (7) Complexity (2)
Developer-task relation7 codes (28)
Learning Learning curve (1)Code quality Working code with no errors (15) Poor code (4)Tooling Adequate tooling (2) Poor tooling (8)Artifacts and instrumentation
Decision making Bad decision making (3)Customers Helping customers (1) Problems with customers (4)
Work management7 codes (26)
Time management Time pressure (6)Non-work time2 codes (34) Break Individual break (25)
Social break (9)
the positive association between emotional valence and self-perceived productivity we report in Section 4 and alsoobserved in previous lab studies by Muller and Fritz [5] andGirardi et al [6]. Being stuck in problem solving is reportedas a major cause for negative emotions by Graziotin andcolleagues based on a large-scale qualitative survey amongdevelopers [18].
In line with previous findings [18], we found that thedevelopers’ mental state and personal issues also impacttheir emotional state at the workplace. Fatigue is reportedas a trigger for negativity (“very tired from yesterday... doubleshift to finish stuffs”), as well as personal issues (“Not feelingparticularly healthy in my mind, but it doesn’t seem to get intothe way of work right now.”). The developers’ perception ofself also triggers emotions. The solution to a programmingtask being perceived as easy or known (feeling confident)triggers positive emotions (“I feel that I am close to solve theproblem!! Feel excited!!”). Conversely, feeling inadequate leadsto negative emotions (“Past and present failures on my mind.Feeling down.”). Perception of self as inadequate or under-qualified with respect to a given task was already reportedas a cause for unhappiness by Graziotin et al. [18]. Similarly,Ford and Parnin mention the fear of failure as a trigger forfrustration [17]. Fatigue and personal issues not related towork were also reported by these two studies among thecauses for developers’ negative feelings.
Developer-task relation. This dimension includes codesthat link the developer with the task. Having difficulties insource code comprehension, i.e. wondering why the codedoes not produce the expected behavior, which part of codeis causing a problem or not having a clear understanding ofthe code and its functioning (Problems in mapping behavior tocause) are reported as triggers for frustration and other nega-tive emotions (“Digging up old reproduction data for tickets thatwere implemented more than half a year ago. While circumstancesfor only being able to test this now were outside our control, this
is still annoying.”). Conversely, being able to identify andunderstand relevant code is associated with positive emotions(“I’ve found a starting point almost immediately. I have a goodfeeling that I’ll make significant progress very soon.”), as wellas having a clear solution design, i.e. a knowing what to donext and how to reach the solution (“I am having a plan how Iwould like to implement the given task in the algorithm. ThereforeI now what I need to do and in which order.”), which confirmevidence from previous lab studies [5], [6].
The codes included in this dimension have been broadlydiscussed by previous research [5], [6], [17], [18]. As for codecomprehension, unexplained broken code and unexpectedoutput are reported as causes for negative emotions byGraziotin et al. [18] and Girardi et al. respectively [6]. Anal-ogously, Muller and Fritz observe a decrease of emotionalvalence when developers experience difficulties in under-standing how parts of the code or API work. Conversely, apositive shift valence is observed when developers are ableto localize relevant code [5], which we also confirm.
As for the novelty of the task, we observe that dealingwith mundane or repetitive tasks is associated with negativeemotions. This was already reported among the top tencauses for developers’ unhappiness [18]. On the oppositeside of the valence spectrum, we observe that dealing withnew tasks can be a cause for positive emotions, with devel-opers feeling thrilled by new challenges. This is in line withprevious findings by Girardi et al. [6].
Finally, Ford and Parnin also report developers beingfrustrated when adjusting to a new project or environment,which relates to the Learning curve code included in ourtaxonomy [17].
Artifacts and instrumentation. Poor quality artifactsand inadequate instrumentation cause negative emotions(5 codes, 33 occurrences), with the most popular triggerbeing poor tooling, i.e., limited, inadequate, or buggy tools,programming languages, IDEs, or hardware: “The computer
JOURNAL OF LATEX CLASS FILES, VOL. XX, NO. XX, MONTH YEAR 9
froze during my work”. Negative affects also occur whendealing with poor code that needs to be reused or changed(“A bit frustrated because of the illogical current structure of thecode”). In particular, two out of four occurrences indicatingpoor code as a trigger for emotions is associated with strongnegative emotions. Conversely, working code with no errorsis associated with positive valence (“It looks like my changeis working!”). In particular, in seven out of 15 occurrencesreporting working code as a trigger for positive emotions,the self report is associated with strong positive valence.
These findings are in line with Graziotin et al. reportingbad code quality and coding practice among the most fre-quent causes for negative affect of developers [18]. Develop-ers involved in their survey mostly complained about badcode written by colleagues and only a few times reportedbeing annoyed by poor code written by themselves.
Developers also complain about poor tooling (“The com-puter froze during my work”). This confirms previous evidencethat issues in the technical infrastructure trigger developers’unhappiness [18]. Finally, unavailable or insufficient docu-mentation was reported by two developers as a cause fornegative emotion, in line with previous work [6], [17].
Social. Collaborating with others to solve a developmenttask either to receive (collaborative problem solving) or providesupport (helping peers) is associated with positive emotions,in line with previous findings [6] (“Reviewed and had con-structive discussion over where to take a feature”). In particular,four out of eight of occurrences reporting helping peers astrigger for positive emotions is associated with strong posi-tive valence. Two participants reported being annoyed whenhelping peers (“Helping an outsourced guy in his development,but he is just asking every little think to me. Really annoying”)and by the fact that nobody is available for help or peers aredescribed as incompetent (peers not helping, i.e. ”some walkingaround to find the correct people was involved”). This concurswith under-performing colleagues being among the top tentriggers for developers’ unhappiness [18] and incompetentpeers—among the triggers for developers’ frustration [17].
Work management. Effective work management ap-pears to positively impact developers’ feelings, and viceversa. Developers report being happy when they investtheir time in productive activities, as in constructive meet-ings (“Review went well, though ran into one more problem.”).Conversely, long or unconstructive meetings are perceivedas a waste of time and trigger negative emotions (“Justhad a terrible meeting!”). Analogously, time pressure due tointerruptions, approaching deadlines, or limited amount oftime for completing tasks, causes sadness and stress (“Abit sad for not having enough time to finish my work!”). Inparticular, for three out of six occurrences reporting timepressure, the self report is associated with strong negativeemotions (as in “very tired from yesterday... double shift tofinish stuffs”). Negative emotions are also triggered by amanager’ or colleague’s (bad decision making), either becausethey are uninformed decisions or because task complexitywas underestimated (“Some decisions in management are beingchallenged, leading to arguments.”). Both, time pressure andbad decision making were previously reported as responsi-ble for developers negative feelings [17], [18].
Non-work time is related to individual or social breaksduring the working hours, e.g., for lunch or regaining focus
and taking a rest. More than 40% of reportings associatebreak with an extremely positive emotion.
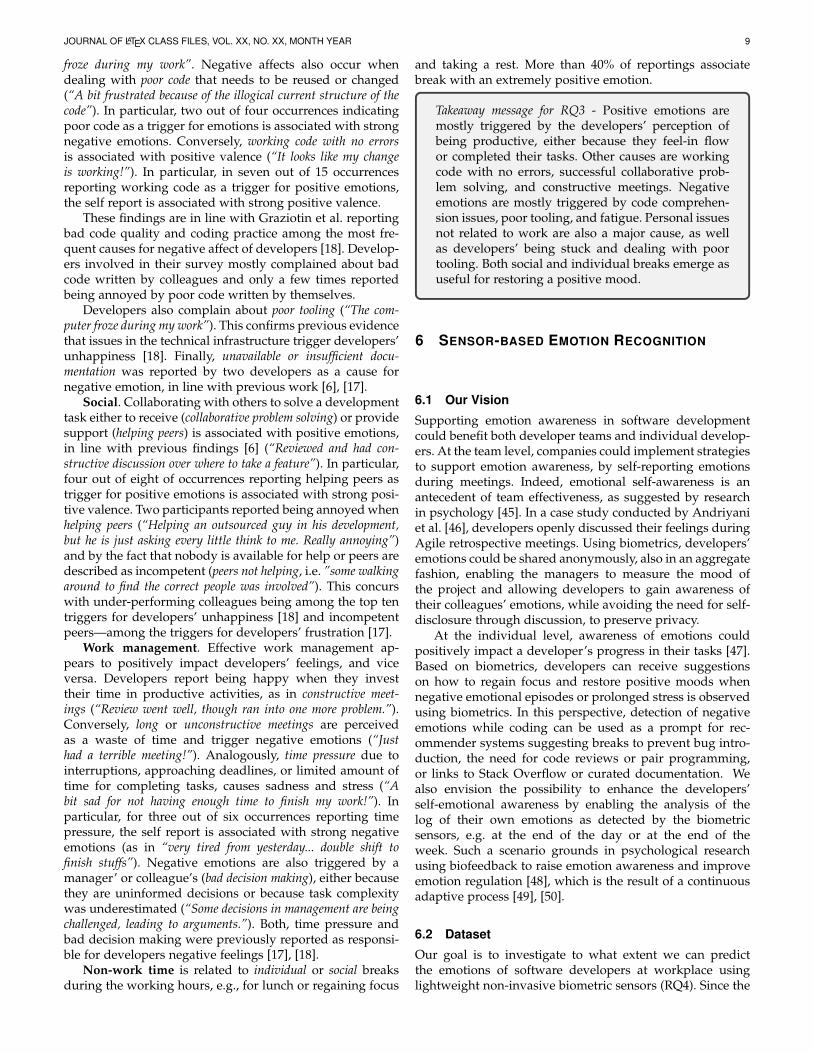
Takeaway message for RQ3 - Positive emotions aremostly triggered by the developers’ perception ofbeing productive, either because they feel-in flowor completed their tasks. Other causes are workingcode with no errors, successful collaborative prob-lem solving, and constructive meetings. Negativeemotions are mostly triggered by code comprehen-sion issues, poor tooling, and fatigue. Personal issuesnot related to work are also a major cause, as wellas developers’ being stuck and dealing with poortooling. Both social and individual breaks emerge asuseful for restoring a positive mood.
6 SENSOR-BASED EMOTION RECOGNITION
6.1 Our Vision
Supporting emotion awareness in software developmentcould benefit both developer teams and individual develop-ers. At the team level, companies could implement strategiesto support emotion awareness, by self-reporting emotionsduring meetings. Indeed, emotional self-awareness is anantecedent of team effectiveness, as suggested by researchin psychology [45]. In a case study conducted by Andriyaniet al. [46], developers openly discussed their feelings duringAgile retrospective meetings. Using biometrics, developers’emotions could be shared anonymously, also in an aggregatefashion, enabling the managers to measure the mood ofthe project and allowing developers to gain awareness oftheir colleagues’ emotions, while avoiding the need for self-disclosure through discussion, to preserve privacy.
At the individual level, awareness of emotions couldpositively impact a developer’s progress in their tasks [47].Based on biometrics, developers can receive suggestionson how to regain focus and restore positive moods whennegative emotional episodes or prolonged stress is observedusing biometrics. In this perspective, detection of negativeemotions while coding can be used as a prompt for rec-ommender systems suggesting breaks to prevent bug intro-duction, the need for code reviews or pair programming,or links to Stack Overflow or curated documentation. Wealso envision the possibility to enhance the developers’self-emotional awareness by enabling the analysis of thelog of their own emotions as detected by the biometricsensors, e.g. at the end of the day or at the end of theweek. Such a scenario grounds in psychological researchusing biofeedback to raise emotion awareness and improveemotion regulation [48], which is the result of a continuousadaptive process [49], [50].
6.2 Dataset
Our goal is to investigate to what extent we can predictthe emotions of software developers at workplace usinglightweight non-invasive biometric sensors (RQ4). Since the
JOURNAL OF LATEX CLASS FILES, VOL. XX, NO. XX, MONTH YEAR 10
results of our regression analysis show a strong positive cor-relation between valence and perceived productivity of pro-fessional software developers at the workplace (see RQ2 inSection 4), we focus on the recognition of emotional valenceusing biometrics. We observe that developers mostly re-port positive valence, neutral arousal, and high dominancescores, i.e., a positive emotional state appears to be the usualcondition of professional developers at the workplace. Thus,early detection of non-positive emotional episodes mightenable just-in-time corrective actions in order to restorepositive affect and productivity. As such, we design ourmachine learning study around the task of distinguishingbetween positive vs. non-positive emotions.
We build our dataset using the self-reported scores forvalence as our ground truth. Specifically, we map the va-lence scores provided to the SAM questionnaires duringthe study to a binary rating of either positive (score > 3)or non-positive (score ≤ 3). 8 Among 21 study participants,19 have shared with us the biometric data. Two participantsdid not wear the Empatica wristband during the experimentbecause the software for downloading the data was notsupported on their operating system. From the self-reportdata points provided by the 19 participants, we excludeddata points for which the biometrics were missing. Thishappened either because the participants forgot to turn onthe device or because the wristband lost the signal dueto the lack of contact between the sensors and the skin.Unfortunately, the device is not designed to send an alertto the user when the signal is missing. As a result, ourdataset is composed of 759 self-reports with biometrics, ofwhich 58% are labeled as positive and 42% as non-positive.To balance our dataset, we apply SMOTE [51] using theSmoteClassif function of the R UBL package.
6.3 Preprocessing and Features extraction
The biometric signals are recorded during the entire exper-imental session for all the participants. However, we onlyconsider the signals recorded in proximity of the stimulus ofinterest—i.e., the signals collected in the 10 seconds beforethe participants provide the self-report about emotionalvalence using the pop-up. The choice of the interval isinspired by previous work on sensor-based classification ofemotions [5], [6], [52]. In addition to considering a 10-secondinterval, we investigate a larger time frame because Zugeret al. [53] found that a 3-minute interval might be optimalfor extracting heart-related features. For the purpose of themachine learning study, we create two different versions ofthe datasets by considering features extracted in the twodifferent time windows (i.e., 10” or 3’). In 10 out of 759responses, the data were not available for the three minutesbefore the interruption (for example, when the participantswitched-on the wristband only one or two minutes beforethe self-report). The final distribution of the labels for va-lence is reported in Table 3.
To synchronize the measurement of the biometric sig-nals with the self-reported emotions, we: (i) save the
8. We also experimented with the normalized scores, consistentlywith the approach adopted for the correlation analysis reported inSection 4, obtaining a performance comparable to the one reported inTable 5.
TABLE 3Gold Standard in the two time windows for feature extraction.
timestamp in which the participant fills the pop-up(t_self-report), (ii) calculate the timestamp for rele-vant time interval for each interruption—i.e., 10 seconds(or 3 minutes, depending on the setting) before the self-report (t_start), (iii) select each signal sample recordedbetween t_start and t_self-report.
To account for differences in the biometrics betweenindividuals, we normalize the raw signals following theapproach previously used in [54], [55], which accountsfor baseline fluctuations between days: Snorm
i = (Si −µ)/(max−min). Then, we perform signal-specific prepro-cessing by following consolidated approaches. Specifically,we extract the tonic and phasic EDA components using thecvxEDA algorithm [56]. As for heart-related metrics, wefilter the BVP signal using a band-pass filter, following theapproach used by Canento et al. [26].
After signal pre-processing, we extract the features pre-sented in Table 4, which we use to train our classifiers.We select features based on previous studies using thesame signals [5], [6], [52], [57]. Some of these features arebased on differences between the signals collected duringthe experiment and the signals collected while participantswatched a neutral video (baseline). Since in our setting itwas not possible to show participants videos, we consideras baseline the signals collected over the entire experiment,as done by Jacques et al [55].
TABLE 4Machine learning features grouped by physiological signal.
Signal FeaturesEDA - tonic: mean, phasic: AUC, min, max, mean, sum peaks amplitudes
BVP - min, max, sum peaks amplitudes- mean peak amplitude (diff. between baseline and task)
HR - mean, sd. deviation (diff. between baseline and task)
6.4 Machine learningWe experimented with four machine learning classifiers,i.e., Support Vector Machine (SVM), k-nearest neighbor(knn), Decision Trees (J48) and Random Forest (rf), sincethey resulted the best performing algorithms in previousstudies using biometrics for emotion detection in softwaredevelopment [5], [6], [30], [55]. In line with the previous labstudy by Girardi et al. [6], we evaluate the classifiers in thehold-out and leave-one-subject-out (LOSO) settings.
In the Hold-out setting, we split the gold standard intotrain (90%) and test (10%) sets, in line with consolidatedpractice in affective computing [55] and using the strati-fied sampling strategy implemented in the R caret pack-age [58]. We perform hyper-parameters optimization [59]using leave-one-out cross validation, as recommended forsmall training sets [60], such as ours. We evaluate the bestmodel resulting from hyper-parameter optimization on thehold-out test set, to assess its performance on unseen data.We repeat this entire process 10 times to further increasethe validity of the results. We evaluate the overall perfor-mance of the classifier by computing the mean of precision,
JOURNAL OF LATEX CLASS FILES, VOL. XX, NO. XX, MONTH YEAR 11
recall, F-measure, and accuracy over the different runs. Thissetting is directly comparable to the one implemented byMuller and Fritz [5], which includes data from the samesubject in both training and test sets. Furthermore, it isdirectly comparable with the hold-out setting implementedby Girardi et al. [6], with the only notable difference that inboth previous studies the task was to classify negative vs.positive emotions.
In the LOSO setting, we assess the classifiers perfor-mance on data obtained from unseen developers. We repeatthe evaluation on a test set 19 times, i.e., the number ofsubjects in our dataset. At each iteration, we train the modelon all the observations from the 18 participants, and we testthe performance on the remaining one.
6.5 Classification Performance (RQ4)
In Table 5, we report the classifier with the best F1-measure,together with its precision, recall, and accuracy, for thetwo time windows considered. Furthermore, we providethe average over the performance of the ten runs for thebest setting, together with standard deviation. We comparethe classifier performance with the baseline classifier alwayspredicting the majority class (in our case the positive class).In Table 6 we report the performance by class.
In the hold-out setting, the valence classifier outperformsthe performance of the baseline. The choice of the time win-dow considered for the feature extraction (10 seconds vs. 3minutes) has a negligible effect on the average performance.As for the best performance, the classifier is substantiallymore precise than the baseline (+.38 and +31 for the 10-second and 3-minute settings, respectively). The improve-ment is smaller for Recall (+.17 and +10) with values rangingfrom .60 (3’ setting) to .67 (10” setting). Overall, there isan improvement in F1 of +.30 and +23 for the 10-secondand the 3-minute settings, respectively. As for the averageperformance, we observe lower precision, recall, and F1. Thevalence classifier is substantially more precise than the base-line (+.27 and +25 for the 10-second and 3-minute settings,respectively). The improvement is smaller for Recall (+.06and +04). Nevertheless, there is an improvement in F1 of+.18 and +17 for the 10-second and the 3-minute settings,respectively. This is comparable to the average performanceobserved in our lab study using Empatica E4 only [6],where we observed substantially higher precision (.70) butcomparable recall (.59), and F1 (.59).
Looking at Table 6 we observe that the major cause oferror is due to misclassification of non-positive cases. Whilepositive cases are recognized with good precision (.71) andrecall = (.75), the non-positive cases tend to be misclassifiedas positive, as demonstrated by the lower recall (.58). Suchdifference in performance between the two classes might bedue to a bias towards the majority class (i.e., positive), in spiteof the use of SMOTE to balance the training set. Anotherpossible explanation is that clustering neutral and negativevalence in the non-positive class might introduce noise inthe training. A better performance could be achieved byremoving under-represented or irrelevant polarity classes,as done in the field study by Jaques et al. [55]. Specifically,they focus on classifying happy vs. unhappy days, afterremoving the 40% of instances of the dataset for which
the participants reported average (i.e., neutral) emotionalscores and report an overall accuracy of 64% using Empaticaonly. While beneficial in terms of noise reduction for themachine learning, such filtering would not be feasible in anatural setting, as the just-in-time emotion detection at theworkplace scenario that we envision as our long-term goal.
The best LOSO setting results are comparable to theones reported in the hold-out settings. However, we confirmthe drop in performance, compared to the hold-out setting,already observed in the lab study by Girardi et al. [6], withthe average of the LOSO setting. This is due to the variabilityfor the individual performance on each participant test set,suggested by the higher standard deviation compared to thehold-out setting. Indeed, the accuracy among the 19 subjectsvaries from 0.29 (worst-performing model) to 0.79 (best-performing model). Differently from the hold-out setting, inthe LOSO condition we observe better performance whenextracting features in the 3-minute window before the selfreport, with peaks of precision, recall, and F1 up to .75,.86 and .75, respectively, for the best-performing model.Consistently with what observed for the hold-out setting,we report a better performance for the positive class (seeTable 6). Again, we report comparable performance withrespect to our lab study (Prec = .45, Rec = .61, F1 = .50) [6].
Overall, our results confirm that non-invasive sensorscan be used for valence classification, as already ob-served [5], [6]. Specifically, we use the minimum set ofsensors—GSR, BVP, and HR measured using the Empat-ica E4 wristband—that can be used in an experimentalprotocol for detecting emotions during daily activities ofsoftware developers at the workplace. Using machine learn-ing, we are able to distinguish between positive and non-positive valence. However, differences of physiology cansignificantly impact the performance, thus confirming theneed for individual, dedicated training of emotion classifi-cation models. Of course, better performance could also beachieved by relying on other high-definition sensors. It isthe case, for example, of Nogueira et al. [61] achieving upto .91 of accuracy for valence using facial EMG electrodes.Analogously, Vrzakova et al. [30] recently reported achieve-ing F1 = .79 for valence recognition during code reviewusing the Shimmer GSR+9 mounting GSR sensors on fingerstrap-rings. However, these studies rely on either invasivesensors, as in the case of facial electrodes used by Nogueiraand colleagues, or sensors that might be perceived as lesscomfortable to wear, as the Shimmer GSR ring sensors thatcould impair typing and other developers’ movements.
Takeaway message for RQ4 - Biometrics can be used aspredictor for emotions at workplace. The observedvariability of performance between participants sug-gests that emotion recognition might be enhanced bytraining emotion classification models on an individ-ual basis.
9. www.shimmersensing.com
JOURNAL OF LATEX CLASS FILES, VOL. XX, NO. XX, MONTH YEAR 12
TABLE 5Best valence classifiers performance. Improvement over the baseline reported in parenthesis. For comparison, we also report the classifier
performance for the positive vs. negative valence classification as observed in our previous lab study [6]
Average of runs for best settingPositive 63 67 65 58 Positive 60 65 57 50Non-positive 48 45 46 58 Non-positive 45 40 37 50
7 DISCUSSION
7.1 Implications
Emotion as a proxy for productivity and job satisfaction. Our cor-relation study provides evidence that a relationship existsbetween emotional valence and self-perceived productivity(see Section 4), thus confirming previous findings in litera-ture [3], [5], [6]. The results of our correlation analysis arecorroborated by the findings of our coding study, leadingto the definition of a taxonomy of emotion triggers at theworkplace (see Section 5). In fact, most of the emotiontriggers are associated to productivity, with the feeling ofbeing in-flow and the ability to complete the daily tasksamong the top causes for positive emotions. Conversely,being stuck is associated to negative feelings. Furthermore,we found that the perception of effective use of time (e.g.,constructive meetings) and the ability to complete theirtasks are among the most frequently reported triggers for(un)happiness. Overall, our results suggest that emotionsmight act as a proxy for productivity, towards bridgingautomated measures and self-report for productivity as-sessment [62]. For example, positive emotions can indicatethat a developer is in flow and should not be disturbed orthat he/she was able to successfully accomplish the dailytasks. Similarly, the identification of negative emotions canindicate a developer requiring support because is stuck orhas problems in comprehending code. In this view, ourtaxonomy of emotion triggers might guide and inspire tothe definition of ad hoc interventions to enhance their pro-ductivity and thus supporting their well-being.
By specifically focusing on triggers for developers’ emo-tions at work, we are able to complement previous results oftwo large-scale survey studies at Microsoft investigating thedevelopers’ satisfaction and well-being. In the first study,Storey et al. [63] develop a theory revolving around the
bidirectional relationship between job satisfaction and theperceived productivity. They identify the social and techni-cal factors, challenges, and contextual aspects, all playing arole in this relationship. In the second study, Meyer et al. [7]report that the perceiving work as important and valuableis a key to developers’ satisfaction. The authors proposea conceptual framework for good working days based onthree main factors including value creation, efficient use oftime and considerations of affective states. The results ofour study fits in the frame of such previous findings andcomplement them by providing specific insights on the roleplayed by emotions in the developers’ well-being and onhow emotions correlate with perceived productivity.
Collaboration and organization of work. In our taxonomy,we observe how work management and social factors playa role in triggering emotions at work. Developers mostlyreported being happy when engaging in fruitful interac-tions with peers, e.g., during collaborative problem solving,while helping peers, or when participating in constructivemeetings. This is in line with recent findings [63] reportingcollaborative team culture among the top factors for jobsatisfaction. Surprisingly, we also observed a minority ofdevelopers being annoyed by helping peers, which can be aconsequence of introverted personalities who find difficultto help others. In this view, personality assessment couldbe used as a tool informing effective team composition, asenvisioned by previous research on personality in softwaredevelopment teams [64].
The role of fatigue. The results of our time-wise correla-tion analysis (see Section 4) suggest that fatigue may bea mediating factor in the relationship between emotionsand self-assessed productivity. In addition, developers re-ported fatigue among the most frequent causes for negativeemotions. Conversely, breaks are used to restore positivemood (see Section 5). Fatigue has been already reported as acause for negative emotions by software developers [17] andshould be taken into due consideration as it might impaircognitive abilities and performance [41], thus lowering codequality. We advocate in favor of follow-up research, alsoleveraging biometrics, towards early-detection of symptomsof fatigue and stress, in order to enable just-in-time im-plementation of strategies for restoring positive mood andregain focus during the workday.
Sensor-based emotion recognition at workplace. This studyrepresents the first attempt to assess the performance of
JOURNAL OF LATEX CLASS FILES, VOL. XX, NO. XX, MONTH YEAR 13
a supervised machine learning classifier for developers’emotion at work, by leveraging developers’ biofeedbackcollected during the entire working day and across thedifferent activities, beyond programming. Previous studieseither focused on specific tasks, such as code review [30],or attempt to classify emotions during development tasksin a lab setting [5], [6]. While promising, our classifierperformance is still not robust enough for practical usage.Further data collection is required to ensure the reliabilityof our approach, also leveraging individual training ofemotion models for each participant. Yet, we believe ourfindings pave the way to follow-up studies to empoweremotion awareness in software development by using sen-sor technology. We believe the machine learning protocol wedesigned and used for collection of biofeedback and self-reported emotions and productivity can stimulate futurein-vivo research, towards reaching the maturity requiredfor the deployment and adoption of sensor-based emotionclassifiers. In our vision, sensor-based emotion recognitioncould be integrated in context-aware approaches that lever-ages multiple sources of information to prompt just-in-timesuggestions for developers. For example, Kaur et al. [65]propose an approach for modeling opportune moments fortransitions and breaks based on affect- and task-related data.They build models to predict whether a worker shouldcontinue their task, move to a new task, or take a break.Zuger et al. [53] also report computer interaction data areeffective in predicting interruptibility while at work. Beyondemotion recognition, observing developers at the workplacealso opens opportunities to build classifiers for identificationof bad days (i.e., when mostly negative emotions are iden-tified) or negative working conditions of developers (i.e.,when negative affect is observed over a long period of time).
The importance of emotion awareness at team level. At teamlevel, companies are recently implementing strategies tosupport emotion awareness [14], [66]. For example, duringagile retrospective meetings, developers could self-reporttheir emotions on a whiteboard and leverage them as start-ing point for the discussion. By doing so, the team canbetter identify what are the activities and events relatingto positive and negative emotions. Recently, Andriyani etal. [46] conducted a case study by interviewing softwarepractitioners from different agile teams about retrospectivemeetings. They found that beyond discussing problemsand strategies adopted to address them, developers alsodiscuss their positive and negative feelings about events anddifficulties encountered. Along the same line, we believe ourtaxonomy could guide self-report towards the inclusion ofemotional feedback in agile meetings. In the long run, weenvision the adoption of biometrics-based emotion recog-nition to support and enhance retrospective meetings byincluding emotional information collected day-to-day.
Instrumentation. Among the most frequent cause of neg-ative emotion, our participants reported being annoyedby poor tooling, such as non-working or not adequatehardware or software infrastructure, or buggy source codethey have to modify. At the time of writing, we conjecturethis problem might be further amplified by the workingcondition of many software developers that are forced towork from home due to the Covid-19 pandemic [67], [68].
7.2 Threats to validityThreats to external validity relate to the generalizability ofthe results, which recently emerged as an open challenge ofsoftware engineering research [69]. We managed to involvea fairly diverse pool of five companies ranging from startupto large international companies. However, we are awarethat we need to be cautious in claiming generalizability ofour findings as our sample might not be representative ofthe software industry as a whole. Furthermore, the pool ofparticipants is imbalanced with respect to gender distribu-tion. Further replications should involve more women andnon-binary participants to account for potential differencesin the emotional reaction.
As for the biometrics study, the validity of our conclusionsground on the robustness of the generalized linear modeland machine learning models. We mitigated such threat byrunning and comparing several algorithms, applying hyper-parameters tuning, and evaluating the approach in twodifferent settings —i.e., Hold-out and LOSO. Nevertheless,the results we report here are limited by the sample size andthe imbalance of data used for training.
Our study suffers from threats to construct validity—i.e., the reliability of our measures in capturing emotionsand progress, mainly due to the in situ nature of the datacollection protocol. In this study, we employed low-cost,lightweight sensors that are comfortable to wear at work.This might have lowered the quality of data collected bythe sensors with respect to those collected in a controlledsetting as in previous lab studies. To mitigate this threat, weperformed a careful quality assessment of the collected datato compensate the impossibility to supervise the experimentin person at the company. Specifically, one of the authorsperformed a daily check of the correctness of the data sharedby participants, by synchronizing their reports via Dropbox.Furthermore, we performed data quality assurance and didnot consider participants who misinterpreted the conceptof valence, arousal, and dominance—e.g., who reportedalways the same score also during the experiment.
Threats to internal validity concern confounding factorsthat can influence the results. Using the self-report pop-up involved interrupting developers during the task, whichcan have interfered with their work, thus eliciting negativeemotions. We mitigate this threat by interrupting the devel-opers every hour, in line with the suggestion received by thedevelopers participating in our pilot study. Furthermore, thedevelopers could always skip the self-report if they did notwant their activity to be interrupted. Finally, as regards theimpact of time as it emerged from the analysis of correlationbetween self-reported emotions and productivity, we areaware that individual differences in participants’ circadianrhythms could have played a role. As such, we cannotexclude that we would have observed differences betweenpeople due to their circadian rhythms and different levelsof alertness in the morning vs. afternoon. Unfortunately wecould not control for this factor, which we believe would beworth investigating in follow-up studies.
8 CONCLUSION
Emotions are known to play an important role in problemsolving as well as to influence job performance. In this paper
JOURNAL OF LATEX CLASS FILES, VOL. XX, NO. XX, MONTH YEAR 14
we report the findings of a longitudinal study of emotionsexperienced by software developers at their workplace.Twenty-one software developers from five companies havebeen observed during two or three weeks, depending onthe duration of the agile iteration. Emotion data have beencollected by means of self-reporting and biometric sensing.Participants reported their emotions in terms of valence,arousal, and dominance, as well as their perceived pro-ductivity during the workday. Developers mostly reportedpositive valence, neutral arousal, and high dominance, in-dicating they mainly experience pleasant emotions and feelin control of the situation while at work. The analysis ofthe correlation between emotions and productivity demon-strates a significant association between positive valenceand self-assessed productivity, which becomes stronger inthe afternoon, probably due to the effect of fatigue.
Other than assessing their emotions, developers wererequired to explain the causes for the emotional scores theyprovided. We coded these open answers and obtained ataxonomy of the emotion triggers at the workplace. Theresults of the coding study demonstrate how positive emo-tions are mostly caused by developers’ feeling productive orbeing able to successfully collaborate with peers. Problemsin code comprehension, poor tooling, fatigue, as well aspersonal issues not related to work, are reported as triggersfor negative feelings.
Results of both our qualitative and quantitative analysissuggest that emotions might act as a proxy for productivity,in line with findings from previous studies on developers’emotions. We believe taxonomy of emotion triggers candrive enhancement interventions of developers’ productiv-ity by guiding and informing consideration of affect andits causes into daily practice, e.g. through integration ofemotional feedback in retrospective meetings or in planningactivities to improve organization of work.
In the long run, we envision the use of biometricsfor emotion recognition to support and enhance emotionawareness both at an individual and the team level. Towardsthis long-term goal, we experimented with a minimum setof non-invasive biometric sensors can be used as predictorfor emotions. Results are encouraging, yet not applicablein everyday practice. Further studies are required to col-lect additional data and improve classification performance,also leveraging training on an individual basis. Both theapproaches adopted in the present study, i.e. the experiencesampling and biometrics, can be used to achieve a sharedgoal, that is to support developers’ emotional awareness,thus enhancing their well-being and productivity. In thenext future, we envision studies based on biometrics thatcan lead to a refined version of the taxonomy of emotiontriggers we present in this paper, e.g. by asking peopleto self-report triggers for positive and negative emotionsaccording to biometrics. Conversely, the taxonomy can beused in combination with biometrics, by leveraging triggersas one of the predictors in a classifier.
REFERENCES
[1] T. M. Amabile, S. G. Barsade, J. S. Mueller, and B. M. Staw, “Affectand creativity at work,” Administrative Science Quarterly, vol. 50,no. 3, pp. 367–403, 2005.
[2] A. Murgia, P. Tourani, B. Adams, and M. Ortu, “Do developersfeel emotions? an exploratory analysis of emotions in softwareartifacts,” in MSR, 2014, pp. 262–271.
[3] D. Graziotin, X. Wang, and P. Abrahamsson, “Are happy de-velopers more productive? - the correlation of affective statesof software developers and their self-assessed productivity,” inPROFES, 2013, pp. 50–64.
[4] D. Graziotin, F. Fagerholm, X. Wang, and P. Abrahamsson, “Whathappens when software developers are (un)happy,” Journal ofSystems and Software, vol. 140, pp. 32–47, 2018.
[5] S. C. Muller and T. Fritz, “Stuck and frustrated or in flow andhappy: Sensing developers’ emotions and progress,” in ICSE, 2015,pp. 688–699.
[6] D. Girardi, N. Novielli, D. Fucci, and F. Lanubile, “Recognizingdevelopers’ emotions while programming,” in ICSE, 2020, p.666–677.
[7] A. Meyer, E. T. Barr, C. Bird, and T. Zimmermann, “Today was agood day: The daily life of software developers,” IEEE Transactionson Software Engineering, pp. 1–1, 2019.
[8] D. Graziotin, X. Wang, and P. Abrahamsson, “Do feelings matter?on the correlation of affects and the self-assessed productivity insoftware engineering,” J. of Software: Evol. and Proc., vol. 27, no. 7,pp. 467–487, 2015.
[9] S. C. Muller and T. Fritz, “Using (bio)metrics to predict code qual-ity online,” in Proc.of the 38th Int’l Conf. on Software Engineering,ICSE 2016, Austin, TX, USA, May 14-22, 2016, 2016, pp. 452–463.
[10] J. Russell, “A circumplex model of affect,” Journal of Personality andSocial Psychology, vol. 39, pp. 1161–1178, 1980.
[11] C. Foster and J. Sayers, “Exploring physiotherapists emotion workin private practice,” New Zealand Journal of Physiotherapy, vol. 40,pp. 17–23, 01 2012.
[12] M. Mantyla, K. Petersen, T. O. A. Lehtinen, and C. Lassenius,“Time pressure: A controlled experiment of test case developmentand requirements review,” in ICSE, 2014, pp. 83–94.
[13] D. Graziotin, X. Wang, and P. Abrahamsson, “Software developers,moods, emotions, and performance,” IEEE Software, vol. 31, no. 4,pp. 24–27, 2014.
[14] E. Marcos, R. Hens, T. Puebla, and J. M. Vara, “Applying emotionalteam coaching to software development,” IEEE Software, pp. 1–8,2020.
[15] J. Russell, “Culture and the categorization of emotions,” Psycho-logical Bulletin, vol. 110 (3), pp. 426–450, 1991.
[16] M. Mantyla, B. Adams, G. Destefanis, D. Graziotin, and M. Ortu,“Mining valence, arousal, and dominance: possibilities for detect-ing burnout and productivity?” in MSR, 2016, pp. 247–258.
[17] D. Ford and C. Parnin, “Exploring causes of frustration for soft-ware developers,” in CHASE, 2015, pp. 115–116.
[18] D. Graziotin, F. Fagerholm, X. Wang, and P. Abrahamsson, “On theunhappiness of software developers,” in EASE ’17. New York,NY, USA: ACM, 2017, p. 324–333.
[19] D. Graziotin, X. Wang, and P. Abrahamsson, “Happy softwaredevelopers solve problems better: psychological measurements inempirical software engineering,” PeerJ, 2014.
[20] M. R. Wrobel, “Emotions in the software development process,”in HSI, 2013, pp. 518–523.
[21] A. E. Kramer, Physiological Metrics of Mental Workload: A Review ofRecent Progress, D. T. I. Center, Ed., 06 1990.
[22] B. Reuderink, C. Muhl, and M. Poel, “Valence, arousal and dom-inance in the eeg during game play,” Int. J. of Autonomous andAdaptive Communic. Syst., vol. 6, no. 1, pp. 45–62, 2013.
[23] M. Soleymani, S. Asghari-Esfeden, Y. Fu, and M. Pantic, “Analysisof EEG signals and facial expressions for continuous emotiondetection,” IEEE Trans. Aff. Comp., vol. 7, no. 1, pp. 17–28, 2016.
[24] M. M. Bradley and P. J. Lang, “Measuring emotion: Behavior,feeling, and physiology,” in Cognitive Neuroscience of Emotion, ser.Series in Affective Science, R. D. Lane and L. Nadel, Eds. OxfordUniversity Press, 2000, ch. 11, pp. 242–276.
[25] W. Burleson and R. W. Picard, “Affective agents: Sustaining moti-vation to learn through failure and state of ”stuck”,” in Social andEmotional Intelligence in Learning Environments Workshop, 8 2004.
[26] F. Canento, A. Fred, H. Silva, H. Gamboa, and A. Lourenco, “Mul-timodal biosignal sensor data handling for emotion recognition,”in SENSORS. IEEE, 2011, pp. 647–650.
[27] E. Carniglia, M. Caputi, V. Manfredi, D. Zambarbieri, and E. Pessa,“The influence of emotional picture thematic content on ex-ploratory eye movements,” J. Eye Mov. Res., vol. 4, pp. 1–9, 2012.
JOURNAL OF LATEX CLASS FILES, VOL. XX, NO. XX, MONTH YEAR 15
[28] K. Muldner, R. Christopherson, R. Atkinson, and W. Burleson,“Investigating the utility of eye-tracking information on affect andreasoning for user modeling,” in UMAP 2009, 2009, pp. 138–149.
[29] S. Koelstra, C. Muhl, M. Soleymani, J. Lee, A. Yazdani, T. Ebrahimi,T. Pun, A. Nijholt, and I. Patras, “DEAP: A database for emotionanalysis using physiological signals,” IEEE Trans. on Affective Com-puting, vol. 3, no. 1, pp. 18–31, 2012.
[30] H. Vrzakova, A. Begel, L. Mehtatalo, and R. Bednarik, “Affectrecognition in code review: An in-situ biometric study of re-viewer’s affect,” J. Syst. Softw., vol. 159, 2020.
[31] D. Girardi, F. Lanubile, N. Novielli, L. Quaranta, and A. Sere-brenik, “Towards recognizing the emotions of developers usingbiometrics: The design of a field study,” in SEmotion Workshop,2019, pp. 13–16.
[32] J. Highsmith and M. Fowler, “The agile manifesto,” SoftwareDevelopment Magazine, vol. 9, no. 8, pp. 29–30, 2001.
[33] R. Larson and M. Csikszentmihalyi, The Experience Sampling.Springer Netherlands, 2014, pp. 21–34.
[34] D. Graziotin, X. Wang, and P. Abrahamsson, “Understanding theaffect of developers: Theoretical background and guidelines forpsychoempirical software engineering,” in SSE Workshop. NewYork, NY, USA: ACM, 2015, p. 25–32.
[35] M. M. Bradley and P. J. Lang, “Measuring emotion: The self-assessment manikin and the semantic differential,” J. of Behav.Therapy & Experim. Psych., vol. 25, no. 1, pp. 49–59, 1994.
[36] S. C. Muller and T. Fritz, “Using (bio)metrics to predict codequality online,” in ICSE 2016. ACM, 2016, pp. 452–463.
[37] A. N. Meyer, G. C. Murphy, T. Zimmermann, and T. Fritz, “Designrecommendations for self-monitoring in the workplace: Studies insoftware development,” Proc. ACM HCI, vol. 1, Dec. 2017.
[38] M. Kuutila, M. Mantyla, U. Farooq, and M. Claes, “Time pressurein software engineering: A systematic review,” Inf. Softw. Tech., vol.121, 2020.
[39] R. Gueorguieva and J. H. Krystal, “Move over anova: progressin analyzing repeated-measures data and its reflection in paperspublished in the archives of general psychiatry.” Archives of generalpsychiatry, vol. 61, no. 3, pp. 310–317, 2004.
[40] A. Stone, J. Schwartz, D. Schkade, N. Schwarz, A. Krueger, andD. Kahneman, “A population approach to the study of emotion:diurnal rhythms of a working day examined with the day recon-struction method.” Emotion, vol. 6 1, pp. 139–49, 2006.
[41] S. Sarkar and C. Parnin, “Characterizing and predicting mentalfatigue during programming tasks,” in SEmotion, 2017, pp. 32–37.
[42] C. Grillon, D. Quispe-Escudero, A. Mathur, and M. Ernst, “Mentalfatigue impairs emotion regulation,” Emotion, vol. 15, no. 3, pp.383–389, 2015.
[43] T. Zimmermann, “Card-sorting: From text to themes,” in Per-spectives on Data Science for Software Engineering, T. Menzies,L. Williams, and T. Zimmermann, Eds. Morgan Kaufmann, 2016,pp. 137–141.
[44] P. Martin and B. Turner, “Grounded theory and organizationalresearch,” J. Appl. Behav. Sci., vol. 22, no. 2, pp. 141–157, 1986.
[45] P. Jordan and N. Ashkanasy, Emotional Intelligence, Emotional Self-Awareness, and Team Effectiveness. Lawrence Erlbaum AssociatesPublishers, 2006, pp. 145–163.
[46] Y. Andriyani, R. Hoda, and R. Amor, “Reflection in agile retro-spectives,” in Agile Processes in Software Engineering and ExtremeProgramming, H. Baumeister, H. Lichter, and M. Riebisch, Eds.Cham: Springer International Publishing, 2017, pp. 3–19.
[47] A. Fountaine and B. Sharif, “Emotional awareness in softwaredevelopment: Theory and measurement,” in 2017 IEEE/ACM 2ndInt’l Workshop on Emotion Awareness in Software Engineering (SEmo-tion), 2017, pp. 28–31.
[48] C. Repetto, A. Gaggioli, F. Pallavicini, P. Cipresso, S. Raspelli, andG. Riva, “Virtual reality and mobile phones in the treatment ofgeneralized anxiety disorders: A phase-2 clinical trial,” Personaland Ubiquitous Computing, vol. 17, pp. 253–260, 02 2013.
[49] H. Stegge and M. Terwogt, Awareness and Regulation of Emotion inTypical and Atypical Development. The Guilford Press, 2006, pp.269–286.
[50] J. Lambie and A. Marcel, “Consciousness and the varieties of emo-tion experience: A theoretical framework,” Psychological Review,vol. 109, no. 2, pp. 219–259, 2002.
[51] N. V. Chawla, K. Bowyer, L. Hall, and W. Kegelmeyer, “Smote:Synthetic minority over-sampling technique,” J. Artif. Intell. Res.(JAIR), vol. 16, pp. 321–357, 06 2002.
[52] D. Girardi, F. Lanubile, and N. Novielli, “Emotion detection usingnoninvasive low cost sensors,” in ACII 2017, 2017, pp. 125–130.
[53] M. Zuger, S. C. Muller, A. N. Meyer, and T. Fritz, “Sensinginterruptibility in the office: A field study on the use of biometricand computer interaction sensors,” in Proc.of the 2018 CHI Conf. onHuman Factors in Computing Systems, (CHI 2018), 2018, p. 591.
[54] J. Healey and R. Picard, “Digital processing of affective signals,”in ICASSP ’98, vol. 6, 1998, pp. 3749–3752 vol.6.
[55] N. Jaques, S. Taylor, A. Azaria, A. Ghandeharioun, A. Sano,and R. Picard, “Predicting students’ happiness from physiology,phone, mobility, and behavioral data,” in ACII 2015, vol. 2015, 092015, pp. 222–228.
[56] A. Greco, G. Valenza, A. Lanata, E. P. Scilingo, and L. Citi,“cvxEDA: A Convex Optimization Approach to ElectrodermalActivity Processing,” IEEE Trans. on Biom. Eng., vol. 63, no. 4, pp.797–804, 2016.
[57] D. Fucci, D. Girardi, N. Novielli, L. Quaranta, and F. Lanubile,“A replication study on code comprehension and expertise usinglightweight biometric sensors,” in ICPC 2019, 2019, pp. 311–322.
[58] M. Kuhn, “The caret package,” http://topepo.github.io/caret/index.html, 2009.
[59] C. Tantithamthavorn, S. McIntosh, A. E. Hassan, and K. Mat-sumoto, “The impact of automated parameter optimization ondefect prediction models,” IEEE Trans. on Softw. Eng., vol. 45, no. 7,pp. 683–711, 2019.
[60] S. Raschka, “Model evaluation, model selection, and algorithmselection in machine learning,” CoRR, vol. abs/1811.12808, 2018.
[61] P. A. Nogueira, R. A. Rodrigues, E. C. Oliveira, and L. E. Nacke, “Ahybrid approach at emotional state detection: Merging theoreticalmodels of emotion with data-driven statistical classifiers,” in IAT2013. IEEE, 2013, pp. 253–260.
[62] M. Beller, V. Orgovan, S. Buja, and T. Zimmermann, “Mind thegap: On the relationship between automatically measured andself-reported productivity,” 2020.
[63] M. Storey, T. Zimmermann, C. Bird, J. Czerwonka, B. Murphy, andE. Kalliamvakou, “Towards a theory of software developer jobsatisfaction and perceived productivity,” IEEE Trans. Softw. Eng.,pp. 1–1, 2019.
[64] F. Calefato, G. Iaffaldano, F. Lanubile, and B. Vasilescu, “On de-velopers’ personality in large-scale distributed projects: The caseof the apache ecosystem,” in ICGSE ’18. ACM, 2018, p. 92–101.
[65] H. Kaur, A. C. Williams, D. McDuff, M. Czerwinski, J. Teevan,and S. T. Iqbal, “Optimizing for happiness and productivity:Modeling opportune moments for transitions and breaks at work,”in Proceedings of the 2020 CHI Conference on Human Factors inComputing Systems, ser. CHI ’20. New York, NY, USA: Associationfor Computing Machinery, 2020, p. 1–15.
[66] N. Novielli and A. Serebrenik, “Sentiment and emotion in softwareengineering,” IEEE Software, vol. 36, no. 5, pp. 6–23, Sep. 2019.
[67] P. Ralph, S. Baltes, G. Adisaputri, R. Torkar, V. Kovalenko, M. Kali-nowski, N. Novielli, S. Yoo, X. Devroey, X. Tan, and et al., “Pan-demic programming,” Empirical Software Engineering, vol. 25, no. 6,2020.
[68] C. Miller, P. Rodeghero, M.-A. Storey, D. Ford Robinson,and T. Zimmermann, “’how was your weekend?’ softwaredevelopment teams working from home during covid-19,” in ICSE2021, 2021. [Online]. Available: https://arxiv.org/abs/2101.05877
[69] S. Baltes and P. Ralph, “Sampling in software engineeringresearch: A critical review and guidelines,” 2021. [Online].Available: https://arxiv.org/abs/2002.07764
ACKNOWLEDGMENTS
This work was partially supported by the Italian Ministryof University and Research under grant PRIN 2017 ”EM-PATHY: EMpowering People in deAling with internet ofTHings ecosYstems” (project H94I19000280001). We wouldlike to thank Apuliasoft for participating in the pilot study,and the companies and the developers who participatedin the field study. We thank Giuseppe Antonio Nanna andArcangelo Saracino for their support in developing the pop-up application.
JOURNAL OF LATEX CLASS FILES, VOL. XX, NO. XX, MONTH YEAR 16
Daniela Girardi received a PhD in ComputerScience in 2021 from the University of Bari. Italy.During her PhD, she focused on investigatingthe use of biometrics for automatic recognitionof developers’ emotions.
Filippo Lanubile is a Full Professor of computerscience at the University of Bari, Italy, where heleads the Collaborative Development ResearchGroup. He is also the CEO and co-founder ofthe academic spin-off company PeoplewareAI.His research interests include: human factors insoftware engineering, collaborative software de-velopment, and software engineering for AI/MLsystems. He has won two awards from IBM andone from Microsoft Research. He is the Chair ofthe IEEE Software Advisory Board.
Nicole Novielli is an Assistant Professor at theUniversity of Bari, Italy. Her research interests lieat the intersection of software engineering andaffective computing with a specific focus on min-ing emotions and opinions from developers com-munication traces and sensor-based recognitionof developers cognitive and affective states.
Alexander Serebrenik is a Full Professor ofSocial Software Engineering at Eindhoven Uni-versity of Technology, The Netherlands. His re-search goal is to facilitate evolution of softwareby taking into account social aspects of softwaredevelopment. He has co-authored a book Evolv-ing Software Systems (Springer Verlag, 2014)and circa 200 scientific papers and articles. Hehas won several distinguished paper and distin-guished review awards.