Journal of Mechanical Engineering Vol SI 3 (2), 49-62, 2017
___________________
ISSN 1823- 5514, eISSN 2550-164X Received for review: 2016-09-02
© 2017 Faculty of Mechanical Engineering, Accepted for publication: 2017-03-03
Universiti Teknologi MARA (UiTM), Malaysia. Published: 2017-07-01
The Correlation Between Tool Wear and Vibration Signals from
Piezoelectric in End Milling of AISI P20+NI
Nurul Hidayah Md Tahir 1
Muhammad Rizal 2
Wan Nuha Wan Mansor1
Jaharah A. Ghani 1
Mohd Zaki Nuawi 1
Che Hassan Che Haron 1
1Department of Mechanical and Material Engineering,
Faculty of Engineering and Built Environment,
Universiti Kebangsaan Malaysia,
43600 Bangi, Selangor, Malaysia
2Department of Mechanical Engineering,
Faculty of Engineering, Syiah Kuala University (UNSYIAH),
23111 Darussalam, Banda Aceh, Indonesia
ABSTRACT
This paper presents, the relationship between the flank wear of a carbide
cutting tool and the vibration signal under various cutting conditions during
the end milling of AISI P20. AISI P20 steels are typically used for making
plastic injection mold, die extrusion, blow molding and various other
components. The tests were conducted under various combinations of the
cutting speed (200 and 300 m/min) and feed rate (0.1 and 0.2 mm/tooth),
whilst the depth of cut is kept constant at 1 mm. The vibrations due to the
flank wear were measured using piezoelectric sensors embedded within an
integrated rotating dynamometer. The amplitude of the vibrations increased
with increasing flank wear. The experimental results showed that the
amplitude of the vibration signals increased due to the progression of the
flank wear as well as with an increase as the cutting speed..
Keywords: Rotating Dynamometer, Piezoelectric, Vibration Signal, Milling
Process
M. T. N. Hifayah et. al.
50
Introduction
Machining process is commonly considered as secondary process in
manufacturing operations and widely used in the manufacturing industry in
the world. According to Yu [1], more than 70% of machining processes are
used in the manufacturing industry in the world. Machining process, also
known as metal cutting mechanics involves the interaction between the
surface of the tool and work piece [2]. The aim of a machining process is to
achieve very good quality of the work piece which includes surface finish
and specific geometrical dimensions between tolerances. The condition of the
cutting tool is an important factor in metal cutting operations as this can
result in much higher costs due to waste components, damage to the machine
tool, and unscheduled downtime [3]. In the machining process, there are
several phenomena occur during the cutting process and can be measured
such as cutting force, vibration, acoustic emission, torque, surface finish,
sound etc.
Generally, Tool Condition Monitoring (TCM) can be classified into
two major categories; direct and indirect methods [4, 5]. The direct methods
of wear prediction, such as visual inspection based on surface textures, are
not cost effective and reliable as tool wear monitoring systems. The indirect
methods involve the generation of a data acquisition signal during the
machining process, which is then analysed to estimate the tool wear. Some
researchers [6]-[8] have studied the effects of tool wear on the cutting forces,
vibrations, surface roughness and dimensional accuracy. Among the process
variables, vibration has received a wide popularity in TCM and it supplies the
best information about tool condition due to the fast data collection and
interpretation ability [9]. Vibration monitoring is mainly used to detect tool
condition, surface roughness, dimensional deviations and chatters in cutting
operations. The vibrations are produced by cyclic variations in the dynamic
components of the cutting forces [10]. According to the [11], the vibration
amplitude caused by interaction of a new tool and work piece is small
compared to the worn tool.
Yu aimed to find the correlation vibration signals to the tool wear in a
metal turning operation [12]. From the results obtained, they suggested that
the vibration signals features in time domain were sensitive more to cutting
condition, whereas frequency-based features correlated well with the tool
wear. They concluded that the vibration signals were effective for use in
cutting tool-wear monitoring and wear qualification. Orhan et. al investigated
the relationship between the vibration signal and tool wear during the end
milling process of AISI D3 cold work tool steel [10]. Time and frequency
domain analysis was performed to describe the vibration signal during the
test. They concluded that the vibration amplitude increased with the
increasing tool wear.
The Correlation Between Tool Wear And Vibration Signals From Piezoelectric
51
A.K. Ghani et. al presented a study of tool tool life, surface finish and
vibration, while turning nodular cast iron using ceramic tool [7]. The tests
have been done under various combinations of speed, feed and depth of cut to
verify the change in surface finish of the workpiece due to increasing the
flank wear. The vibration was measured using two accelerometers attached to
the tool holder. They concluded that surface finish of the work part is not
influenced by the progression of the flank wear with under different cutting
conditions. They also observed that, as the speed and at low depth of cut
increased, the vibration amplitudeduring cutting decreases it remains almost
constant with the increase of flank wear.
Kalvoda et. al conducted a series of experiments to detect tool wear
and tool damage during the milling process [13]. The experiments were
carried out by taking a three-axis vibration signal on the x, y and z axis.
Vibration signals observed through three accelerometers (CROSSBOW)
mounted on the spindle. As the results, the best performance of vibration
amplitudes was recorded in the x-axis and z-axis, while the y-axis was less
sensitive to TCM.
Piezoelectric sensors have been proved to be a versatile tool in the
measurement of signals in machining processes and it is widely used for
research and development in the industries. Piezoelectric sensors utilized the
piezoelectric effect to measure pressure, acceleration, pressure, force and
vibration. Piezoelectric effects occurred when stress is applied to a material
and it creates a strain or deformation in the material. In a piezoelectric
material, piezoelectric sensor is in a state of mechanical stress and this strain
will generate a voltage, which is called as a direct piezoelectric. In another
word, piezoelectric effects are the effect in which energy is converted to
electrical charge and also in mechanical design and the effects are reversible.
With the raw signals generated from sensors, the flank wear width, VB can be
determined.
This paper investigated the correlation between flank wear and
vibration signals using a wireless telemetry system based on inductive
coupling as the data transmitter for the end milling of an AISI P20 steel
cutting tool using a coated with tungsten carbide. AISI P20 steels are
typically used for making plastic injection mold, die extrusion, blow molding
and various other components [14]. The steel is supplied in hardness range of
about 32–36 HRC [15]. The quenched and tempered mediurn carbon CrMo
(P20) steel has been widely used for plastic dies because of its machinability
and excellent polishing property [15]. The transducer element used in the
integrated rotating dynamometer was based on a cross beam type of
piezoelectric sensor. It is capable of measuring three components of vibration
signals in the direction of cutting force which is in direction of main cutting
force (Vc), thrust force (Vt) and perpendicular cutting force (VcN). The
advantage of this rotating dynamometer is its flexibility as it can be
M. T. N. Hifayah et. al.
52
assembled with a variety of cutting tool sizes and geometries and it also
could be used as the tool condition monitoring systems, optimisations,
machine tool design and also dynamics of the cutting process. This paper
describes the application of the piezoelectric embedded within an integrated
rotating dynamometer for monitoring online cutting tool wear by measuring
the vibration signals. The vibration signals were then analysed using a new
statistical-based method called the Integrated Kurtosis- based Algorithm for
Z-filter Technique (I-Kaz), pioneered by [16].
Experimental Set Up
In this study, the milling process was conducted in dry cutting conditions
using a Spinner VC450 CNC machine. This experiment was carried out for
the end milling of an AISI P20 steel cutting tool using a coated with tungsten
carbide. The cutting conditions are shown in Table 1. The piezoelectric are
arranged for detecting the vibrations in three channels simultaneously. Three
pieces of piezoelectric sensors were mounted onto the transducer elements,
where the maximum values of strain and stress were obtained to achieve the
maximum sensitivity and repeatability of the piezoelectric sensors. ANSYS
was used to perform the static analysis of the force sensing element that was
subjected to three directions of forces. The transducer element was integrated
into the rotating dynamometer based on inductive coupling for the detection
the tool wear. When the external forces were applied to the transducer
elements, the changes in stress and strain occurred on the surface of the
material. The piezoelectric converted the stress into voltage, indicating the
vibration signals from the force that was exerted.
Table 1: Cutting condition parameters
No. of
Exp.
Cutting
speed, Vc
(m/min)
Feed Rate,
fz
(mm/tooth)
Axial Depth
of Cut, ae
(mm)
Radial
Depth of
Cut, ap (mm)
1 200 0.1 0.4 1
2 200 0.2 0.4 1
3 300 0.1 0.4 1
4 300 0.2 0.4 1
During the milling operation, the insert was periodically removed
from the tool holder, and the widths of the flank wear were measured using a
microscope. The flank wear data were recorded from the first cutting pass
until the flank wear reached 0.3 mm according to the standard recommended
value in defining a tool life end-point criterion based on ISO 3685-1993. The
vibration signals were collected at a sampling rate of 5 kHz using a wireless
The Correlation Between Tool Wear And Vibration Signals From Piezoelectric
53
telemetry system, and then analysed by the computer using signal analysis
based on the I-kaz 3D method, as described by [16].
The experimental set up is shown in Figure 1. The advantage of I-kaz
method is the characteristic of signals can be obtained in time and frequency
domain and its sensitive to amplitude and frequency changes. Raw signal
decomposition makes the frequency range is divided into three fractions are
decomposed into three different axis raw signal of axis x, y and z. Time
domain signal is split into three frequency range of as showed in Table 2.
Based from the decomposition of the signals, the coefficient of I-kaz 3D is
obtained by using Equation 1 [16]:
𝑍3∞ =
1
𝑁√𝐾𝐼𝑠𝐼
4 + 𝐾𝐼𝐼𝑠𝐼𝐼4 + 𝐾𝐼𝐼𝐼𝑠𝐼𝐼𝐼
4 (1)
Where;
N = number of data
KI, KII and KIII = kurtosis for channel I, II and III
SI, SII and SIII = standard deviation for channel I, II and III
Table 2: Time domain in three frequency ranges
Axis Frequency Range Value
x low frequency range (LF) 0 - 0.25 fmax.
y high frequency range (HF) 0.25 fmax -0.5 fmax
z very high frequency range (VF) 0.5 fmax
Figure 1: Rotating dynamometer with inductive wireless system
AISI P20+Ni
Rotating
Dynamometer
Inductive
system
M. T. N. Hifayah et. al.
54
Results And Discussion
Vibration Analysis Figure 2 shows the plot of dynamic vibration signals in time domain. The gap
between the peaks where the tool is not cut or does not touch the workpiece.
In time domain results, it is apparent from the graphs that the vibration
signals in the direction of main cutting force, Vc is higher, while the
vibration signals in the direction of thrust force, Vt is lower than Vc and VcN.
This is caused by the contact zone of the tool on the direction of thrust and
perpendicular cutting forces are small due to the end milling process [19].
The amplitude of the vibration signals increase with an increase in the flank
wear, VB until the criterion of VB = 0.3 mm was reached, see Figure 3. From
this figure, it can be seen that the tool wear causes increasing the vibration
amplitudes for all the three vibration components. This is possibly due to the
larger frictional forces on the flank surface when the tool is worn [20].
Besides that, among the three vibration components (Vc, Vt and VcN), the
magnitude of Vc component is very dominant for TCM, which gradually
decreases for the components of Vt and VcN, and therefore have a minimal
response to the change of tool wear.
Figure 2: Plots of vibration signals in time domain
The effects of tool wear can be seen clearly seen when the signals are
plotted in the frequency domain. According to [10] the vibration generated
during the cutting process is caused by the interaction that occurs between the
tool and the workpiece which has frequency characteristics of the cutting tool
simultaneously, which is 1x, 2x, 3x, and etc. Under the normal cutting
conditions, the dominant frequency component is around the frequency of
cutting tool (Tool Passing Frequency - TPF). TPF can also be determined by
using Equation (2):
One cycle
The Correlation Between Tool Wear And Vibration Signals From Piezoelectric
55
𝑇𝑃𝐹 =𝑛 𝑋 𝑁𝑇
60 (Hz) (2)
Where;
n = spindle rotating speed (rpm)
NT = teeth number of cutting tool
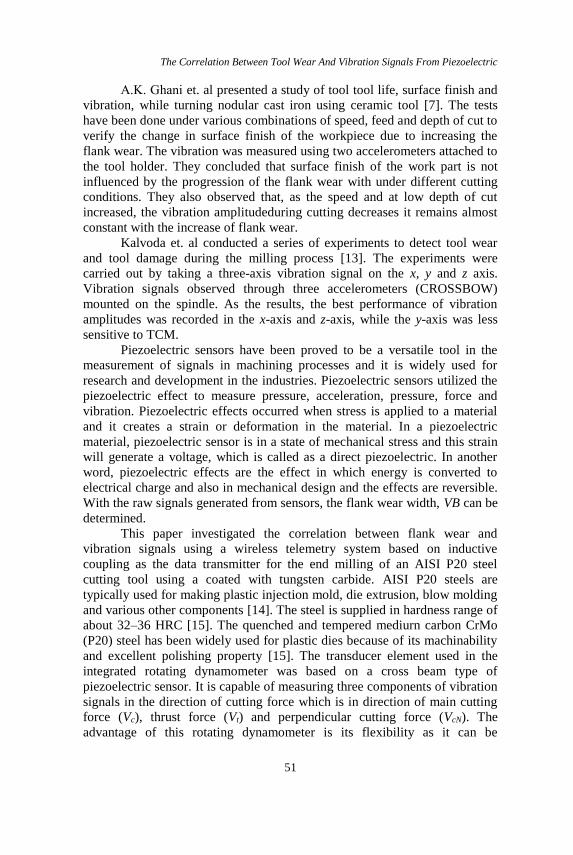
Figure 3: Variation of vibration amplitude with flank wear, VB
Figure 5 shows analysis of cutting tool vibration in the frequency
domain. From the spectrum plot, the tool passing frequency is around 39.8
Hz. As shown in Figure 5(a), is clear that the frequency of the first cutting
tool (1TPF) generated is 26.2 Hz (Vc = 200 m / min). At 300 m/min, the tool
passing frequency is also increases to 39.4 Hz, see Figure 5(b). This results
are almost similar to the frequency obtained if calculated by using Equation
(2).
The resultant vibrations measured for the experiments are shown in
Table 2. Generally, as the cutting speed and feed rate increased, the
amplitude of the vibration signals increased as well. Table 2 also shown the
lowest values of resultant vibration is obtained at 200 m/min cutting speed
(a) Set 1 : Vc = 200 m/min (b) Set 2 : Vc = 200 m/min
(c) Set 3 : Vc = 300 m/min (d) Set 4 : Vc = 300 m/min
0
0.02
0.04
0.06
0.08
0 0.1 0.2 0.3 0.4
Vib
rati
on
Am
plit
ud
e (V
)
Flank Wear , VB (mm)
VcN Vt Vc
0
0.05
0.1
0 0.1 0.2 0.3 0.4
Vib
rati
on
Am
plit
ud
e (V
)Flank Wear, VB (mm)
VcN Vt Vc
0
0.05
0.1
0.15
0 0.1 0.2 0.3 0.4Vib
rati
on
Am
plit
ud
e (V
)
Flank Wear, VB (mm)
VcN Vt Vc
0
0.05
0.1
0.15
0 0.2 0.4Vib
rati
on
Am
plit
ud
e (V
)
Flank Wear, VB (mm)
VcN Vt Vc
M. T. N. Hifayah et. al.
56
and 0.1 mm/tooth of feed rate. As the cutting speed increase from 200 m/min
to 300 m/min at a constant feed rate of 0.2 mm/tooth, resultant vibration
increase by 18%. In addition, by increasing the feed rate, it also affected the
amplitude of the vibrations when the cutting speed and depth of cut were kept
constant. As shown in Table 2 that as the feed rate is increased from 0.1
mm/tooth to 0.2 mm/tooth at the constant speed of 200 m/min, the resultant
vibration also increased by 70% due to the progression of the flank wear at a
constant depth of cut. The main reason of this occurrence was due to the
increase of chip thickness produced during the cutting operation that
consequently resulted in the increase of the tool-chip contact area and cutting
forces [21].
(a) Vc = 200 m/min
(b) Vc = 300 m/min
Figure 4: Plots of vibration signals in frequency domain
Table 2: Results of vibrations from experiments
No.
of
Exp.
Cutting
speed, Vc
(m/min)
Feed Rate, fz
(mm/tooth)
Axial Depth
of Cut, ae
(mm)
Resultant
Vibration,
Vr (V)
1 200 0.1 0.4 0.033
2 200 0.2 0.4 0.056
3 300 0.1 0.4 0.039
4 300 0.2 0.4 0.058
1TPF = 26.5
1TPF = 39.8
Frequency (Hz)
Frequency (Hz)
The Correlation Between Tool Wear And Vibration Signals From Piezoelectric
57
The effect of cutting speed (Vc) and feed rate (fz) on resultant vibration
(VR) is shown in Figure 4. As shown in Figure 4, low resultant vibration are
obtained on the low interaction of cutting speed and feed rate, while the high
resultant vibration are obtained on the high interaction of cutting speed and
feed rate. From Figure 4, the resultant vibration was increased because of
increasing of cutting speed and chip cross-section with feed rate. The
increasing of resultant vibration is due to the increase in cutting temperature
in the shear zone that consequently results in the reduction of the yield
strength of the workpiece material, chip thickness and tool-chip contact
length [22]. In such graphs, it can be appreciated that the resultant vibration
increases with the simultaneous increase of cutting speed and feed rate while
the depth of the cut was kept constant.
Figure 5: Effect of cutting parameters on resultant vibration
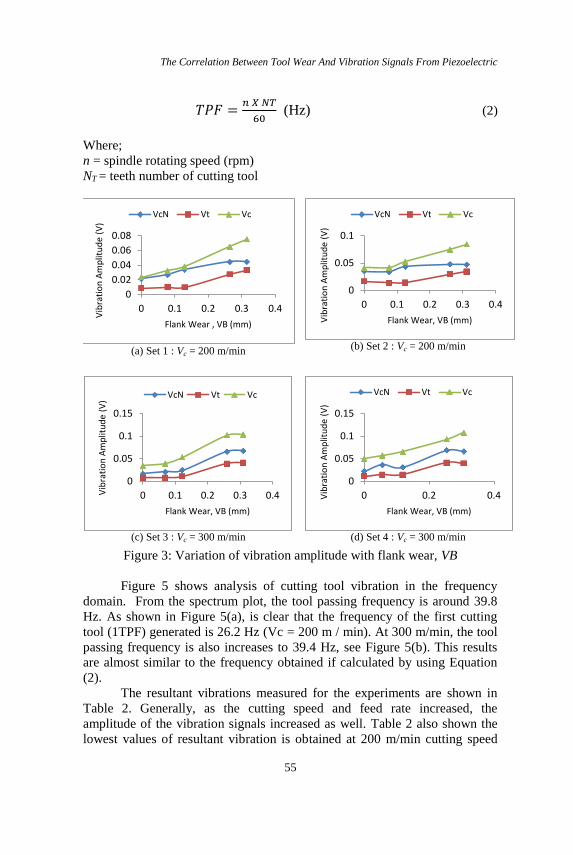
The amplitude of vibration for Vc against flank wear are presented in
Figure 6 – 7 for different cutting speed and feed rate, respectively. Figure 6
shows the trend of amplitude of vibration for Vc against flank wear when the
cutting speed was manipulated (200 m/min and 300 m/min) at the constant
feed rate of 0.1 mm/tooth and depth of cut 0.4 mm. The amplitude of
vibration increases with the increasing of speed at a constant feed rate and
depth of cut. It's due to the increasing of cip size produced during the cutting
process. Therefore, a higher forces required to produce a larger cip size. As
the speed increases from 200 to 300 m/min, the amplitude of vibration
increases at constant feed rate and depth of cut. While Figure 7 shows the
results of the vibration amplitude at two different feed rates of 0.1 and 0.2
mm/tooth and at a constant cutting speed of 200 m/min and axial depth of cut
of 0.4 mm. At a higher feed rate (0.2 mm/tooth), the amplitude of vibration
was found to be slightly larger than at feed rate of 0.1 mm/tooth due to the
progression of flank wear.
M. T. N. Hifayah et. al.
58
Figure 6: The amplitude of vibration for different cutting speed
Figure 7: The amplitude of vibration for different feed rate
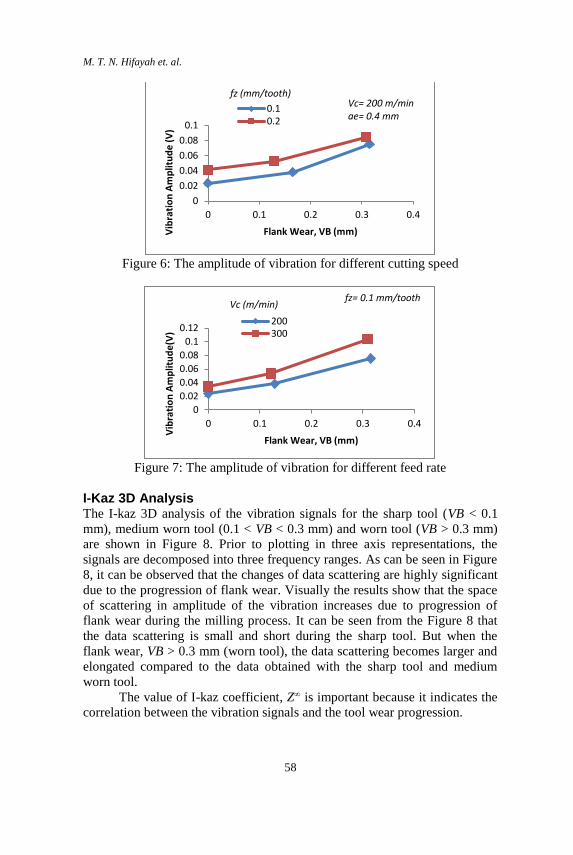
I-Kaz 3D Analysis The I-kaz 3D analysis of the vibration signals for the sharp tool (VB < 0.1
mm), medium worn tool (0.1 < VB < 0.3 mm) and worn tool (VB > 0.3 mm)
are shown in Figure 8. Prior to plotting in three axis representations, the
signals are decomposed into three frequency ranges. As can be seen in Figure
8, it can be observed that the changes of data scattering are highly significant
due to the progression of flank wear. Visually the results show that the space
of scattering in amplitude of the vibration increases due to progression of
flank wear during the milling process. It can be seen from the Figure 8 that
the data scattering is small and short during the sharp tool. But when the
flank wear, VB > 0.3 mm (worn tool), the data scattering becomes larger and
elongated compared to the data obtained with the sharp tool and medium
worn tool.
The value of I-kaz coefficient, Z∞ is important because it indicates the
correlation between the vibration signals and the tool wear progression.
0
0.02
0.04
0.06
0.08
0.1
0 0.1 0.2 0.3 0.4
Vib
rati
on
Am
plit
ud
e (
V)
Flank Wear, VB (mm)
0.10.2
0
0.02
0.04
0.06
0.08
0.1
0.12
0 0.1 0.2 0.3 0.4
Vib
rati
on
Am
plit
ud
e(V
)
Flank Wear, VB (mm)
200300
Vc (m/min)fz= 0.1 mm/tooth
fz (mm/tooth) Vc= 200 m/min ae= 0.4 mm
The Correlation Between Tool Wear And Vibration Signals From Piezoelectric
59
i Sharp tool (VB < 0.1
mm)
ii Middle worn tool
(0.1 < VB < 0.3 mm)
iii Worn tool (VB >
0.3 mm)
Set 1 : Vc = 200 m/min
(a)
(b)
(c)
Set 2 : Vc = 200 m/min
(d)
(e)
(f)
Set 3 : Vc = 300 m/min
(i)
(j)
(k)
Set 4 : Vc = 300 m/min
(l)
(m)
(n)
Figure 8: I-kaz 3D display of graphical representations for cutting force
during turning process from the sharp tool until worn tool
M. T. N. Hifayah et. al.
60
The effect of flank wear progression can also be seen by changes of
I-kaz coefficient as shown in Table 3. From Table 3, the value of I-kaz
coefficient increases due to the increasing of flank wear width. The
increasing of the I-kaz coefficient is due to the widening of the contact of
surface area between the work piece and the tool and then caused the
increasing of resistance to the movement of the tool on the work piece
surface area. Therefore, the amplitude of vibration increased and resulted in
bigger value of I-kaz coefficient. This was similar to what had been stated in
previous studies, whereby a larger I-kaz coefficient value indicates a higher
degree of data scattering and vice versa [18].
Table 3: Correlation of tool weal and I-kaz coefficient
No. of
Exp.
Z∞
Sharp tool
(VB < 0.1 mm)
Z∞
Middle worn tool
(0.1 < VB < 0.3 mm)
Z∞
Worn tool
(VB > 0.3 mm)
1 4.21 E -10 4.61E-10 1.95 E -09
2 5.45 E -10 1.24E-09 5.51 E -09
3 2.47 E -10 4.62E-10 1.75 E -09
4 2.68 E -09 3.23E-09 1.14 E -08
The correlation between I-kaz coefficient and tool wear progression
is also shown in Figure 9. It can be seen that the increasing in flank wear
value causes the I-kaz coefficient values to increase. Besides that, the value
of I-kaz coefficient become higher and the graph curves move upward from
sharp tool until tool is worn for all sets of experiments. Furthermore, the
value of I-kaz coefficient became higher with an increase in the cutting speed
or feed rate at a constant depth of cut.
Figure 9: Graph of I-kaz coefficient, Z∞ against flank wear width
0
2E-08
0 0.1 0.2 0.3 0.4
I-K
az C
oef
fici
ent
Flank Wear Width (VB)
S1 = 200 m/min, 0.1 mm/tooth
S2 = 200 m/min, 0.2 mm/tooth
S3 = 300 m/min, 0.1 mm/tooth
The Correlation Between Tool Wear And Vibration Signals From Piezoelectric
61
Conclusion
From the experimental results, following conclusions can be drawn:
1. The magnitude of vibration is very dominant in the direction of Vc than
that in the Vt and VcN direction for TCM.
2. The vibration amplitude during cutting process increases as the cutting
speed and feed rate increase with the progression of tool wear.
3. The value of I-kaz coefficient increases due to the increasing of flank
wear width.
4. A wireless system using embedded sensors within the rotating tool in the
milling process can efficiently detect changes of the tool wear.
Acknowledgement
The authors would like to thank the Government of Malaysia and Universiti
Kebangsaan Malaysia for their financial support under Grants 03-01-02-
SF0843.
References [1] G. Yu, “Tool Wear Monitoring in Turning Operations using Ultrasonic
Wave and Artifical Neural Network , Milwaukee: The University of
Wisconsin” (2002)
[2] N. Singh, “System Approach to Computer- Integrated Design and
Manufacturing. New York: John Willey & sons” (1996).
[3] D. E. Dimla, “Sensor signals for tool-wear monitoring in metal cutting
operations - a review of methods”, International Journal of Machine
Tools and Manufacture, 40: 1073-1098 (2002)
[4] F. Ismail, M.A. Elbestawi, R. Du, K. Urbasik, “Generation of milled
surfaces including tool dynamic and wear”, Journal of Engineering for
Industry, 115: 245–252 (1993).
[5] S. K. Choudhury, and S. Rath, “In-process tool wear estimation in
milling using cutting force model”, Journal Material Process
Technology. 99: 113-119 (2000)
[6] K.A. Risbood, U.S. Dixit, and A.D. Sahasrabudhe, “Prediction of
surface roughness and dimensional deviation by measuring cutting
forces and vibrations in turning process”, Journal of Material Process
Technology 132: 203–14 (2003)
[7] A.K. Ghani, I.A. Choudhury, and Husni, “Study of tool life, surface
roughness and vibration in machining nodular cast iron with ceramic
tool”, Journal Material Process Technology 127: 17–22 (2002).
[8] E. A. Jantunen, “Summary of methods applied to tool condition
monitoring in drilling”, International Journal of Machining Tool
M. T. N. Hifayah et. al.
62
Manufacturing 42: 997–1010 (2002)
[9] S. Ebersbach and Z. Peng, “Expert system development for vibration
analysis in machine condition monitoring”, Expert Syst. With
Applicat. 34:291–9 (2008).
[10] S.Orhan, E. R. AO, N. Camuscu and E. Aslan,. “Tool wear evaluation
by vibration analysis during eng milling of AISI D3 cold work tool
steel with 35 HRC hardness”, NDT&E International 40 (2): 121-126
(2007).
[11] M. S. Bhuiyan, I. A. Choudhury, and Y. Nukman, “Tool Condition
Monitoring using Acoustic Emission and Vibration Signature in
Turning III”, 2–6 (2012).
[12] D. E. Dimla, “The correlation of vibration signal features to cutting
tool wear in a metal turning operation”, Int. J. Adv. Manuf. Tech.,
19(10):705–13 (2000)
[13] T. Kalvoda, and Y. R. Hwang, “A cutter tool monitoring in machining
process using Hilbert”, Huang Transform. International Journal of
Machine Tool & Manufacture 50: 495 – 501 (2010).
[14] A. E. Hossein, K. A., K. Kadirgama, M. Hamdi and K. Y. Benyounis,
Prediction of cutting force in end milling operation of modified AISI
P20 tool steel. Journal of Materials Processing Technology 182 (1-3):
241 – 247 (2007).
[15] Gupta, Anil, H. Singh, and A. Aggarwal. "Taguchi-fuzzy multi output
optimization (MOO) in high speed CNC turning of AISI P-20 tool
steel."Expert Systems with Applications 38.6 (2011): 6822-6828.
[16] D. Liu, G. Wang, X. Liu, and D. Zhao, “Effect of cooling rates and
compressive deformation of Austenite on Bainitic transformation and
microstructure for plastic die AISI P20 steel”, ISIJ International, 38
(5): 482 – 488 (1998).
[17] M. Z. Nuawi, M. J. M. Nor, N. Jamaludin, S. Abdullah, F. Lamin, and
C. K. E. Nizwan, “Development of integrated kurtosis-based algorithm
for z-filter technique”, Journal of applied sciences. 8(8): 1541-1547
(2008).
[18] B. Kaya, C. Oysu and H. M. Ertunc, "Force-torque based on-line tool
wear estimation system for CNC milling of Inconel 718 using neural
networks.” Advances in Engineering Software 42: 76 – 84 (2011).
[19] C. Scheffer, H. Kratz, P.S. Heyns and F. Klocke, “Development of a
tool wear monitoring system for hard turning”, International Journal
Machining and Tool Manufacture. 43 (10): 973-985 (2003).
[20] M. Gunay, A. Kacal, and Y. Turgut, “Optimization of Machining
Parameters in milling of Ti-6Al-4V Alloy using Taguchi Method”, e-
Journal of New world Science Academy, 6(1): 428 – 440 (2011).
[21] E. M. Trent and P. K. Wright, Metal Cutting, 4th ed., Butterworth-
Heinemann, Boston. Chapter 4: 57-80 (2000).