Substitution Rate Variation Among Sites in Hypervariable Region 1 of Human Mitochondrial DNA
John Wakeley
Department of Integrative Biology, University of California, Berkeley, CA 94720, USA
Received: 12 July 1992 / Revised: 26 February 1993 / Accepted: 16 April 1993
Abstract. More than an order of magnitude differ- ence in substitution rate exists among sites within hypervariable region 1 of the control region of hu- man mitochondrial DNA. A two-rate Poisson mix- ture and a negative binomial distribution are used to describe the distribution of the inferred number of changes per nucleotide site in this region. When three data sets are pooled, however, the two-rate model cannot explain the data. The negative bino- mial distribution always fits, suggesting that substi- tution rates are approximately gamma distributed among sites. Simulations presented here provide support for the use of a biased, yet commonly em- ployed, method of examining rate variation. The use of parsimony in the method to infer the number of changes at each site introduces systematic errors into the analysis. These errors preclude an unbiased quantification of variation in substitution rate but make the method conservative overall. The method can be used to distinguish sites with highly elevated rates, and 29 such sites are identified in hypervari- able region 1. Variation does not appear to be clus- tered within this region. Simulations show that bi- ases in rates of substitution among nucleotides and non-uniform base composition can mimic the ef- fects of variation in rate among sites. However, these factors contribute little to the levels of rate variation observed in hypervariable region 1.
Key words: Rate variation - - Hypervariable re- gion 1 - - Human mitochondrial DNA - - Gamma distribution - - Parsimony method
Introduction
Since Benzer's (1961) demonstration of mutational "hot spots" in T4 phage, workers have recognized that variation in substitution rate exists among sites in molecular sequences. It now appears that such rate variation is quite common, and there is cur- rently a growing effort to study its effects. Besides being of interest in its own right, knowledge of rate variation will help refine our methods of phyloge- netic inference, molecular clock analyses, and stud- ies of molecular structure and function. This paper presents an analysis of substitution rate variation among sites in hypervariable region 1 of the control region of human mitochondrial DNA. The results show that substantial variation in rate does exist, that this variation is well described by a gamma distributed-rates model, that sites with elevated rates can be identified, and that variation does not appear to be clustered in this region. Further, sim- ulations provide support for the use of a parsimony method commonly employed in studies of rate vari- ation.
Evolutionary Studies of Rate Variation
Evolutionary studies of rate variation began soon after the phenomenon of the molecular clock was first reported (Zuckerkandl and Pauling 1965). If all sites in a sequence change according to the same rate, the number of substitutions per site in the his- tory of a sample of sequences should follow a Pois-
614
son distribution. Using pairwise comparisons among hemoglobin and cytochrome c sequences, King and Jukes (1969) found that the number of amino acid substitutions inferred to have occurred at each site could be fit by a Poisson distribution only if a number of invariable sites were excluded. Fitch and Margoliash (1967), employing a tree- based method to count changes, estimated the num- ber of unmutable and hypermutable positions in ey- tochrome c by excluding sites until a minimum chi- square fit to a Poisson distribution was achieved.
Fitch and Markowitz (1970) and Markowitz (1970) employed more sophist icated statistical methods to fit a one-rate model, a one-rate-plus- invar iab le-s i tes model , and a two-ra te -p lus- invariable-sites model to the inferred number of nu- cleotide substitutions per codon in the evolution of cytochrome c and fibrinopeptide A among 29 di- verse species. They reported that the best fit to the data from cytochrome c and fibrinopeptide A was achieved by the two-rate-plus-invariable-si tes model. Later, Fitch (1976) compiled the distribution of the number of nucleotide changes per codon in cytochrome c sequences from more than 50 species. He found that the two-rate-plus-invariable-sites model was insufficient to explain the observed data, indicating that there are at least four classes of rate variability among sites in that molecule. Other au- thors have employed a variety of these discrete rate-class models (e.g., Jukes and Holmquist 1972; Aquadro et al. 1984; Hasegawa et al. 1985; Kuni- sawa et al. 1987; Palumbi 1989).
Each site in a molecular sequence probably has a uniquely determined substitution rate resulting from the specific structural and functional con- straints of the molecule of which it is a part (Dick- erson 1971; Golding and Glickman 1986; Holmquist and Pearl 1980; Kimura 1979). For some molecules, models with a fixed small number of rate classes might be appropriate (Foster et al. 1982). For oth- ers, models incorporating continuously distributed rates are better. In 1971, Uzzell and Corbin intro- duced a gamma distributed-rates model and showed that it fit as well as the variable-rate models of Fitch and Markowitz (1970) when applied to the same data. When rates are gamma distributed across sites, the number of substitutions in the history of a sample of sequences should follow a negative bino- mial distribution. Uzzell and Corbin (1971) em- ployed a minimum chi-square procedure identical to the one used by Fitch and Margoliash (1967) to ex- clude numbers of invariable sites from the analysis.
The gamma distributed-rates model has been em- ployed by several other workers without the addi- tion of invariant sites. Holmquist et al. (1983) showed that a negative binomial distribution fit nicely the number of nucleotide changes inferred
per codon in et hemoglobin, [3 hemoglobin, myoglo- bin, the et crystalline A chain, and cytochrome c, whereas the Poisson failed miserably. Golding (1983) fit a negative binomial distribution to a vari- ety of data from different organisms, including num- bers of spontaneous mutants in the rII region of T4 phage and the lacI gene of Escherichia coli, of nu- cleotide changes per codon in cytochrome c and myoglobin, of nucleotide substitutions per site in human mtDNA and b globin, and of base substitu- tions per restriction site in human mtDNA. Larson and Wilson (1989) used the negative binomial to de- scribe the number of nucleotide changes per site in ribosomal RNA in salamanders. Kocher and Wilson (1991) recently fit a negative binomial to the in- ferred number of changes per site in the entire con- trol region of human mtDNA.
Mitochondrial DNA Sequences
For the present work, I have fit a two-rate model and a gamma distributed-rates model to the distri- bution of the inferred number of changes per site in three sets of sequences from hypervariable region 1 of the control region of human mtDNA. The human mitochondrial genome is a 16,569-bp circular mole- cule encoding 22 transfers RNAs, 13 proteins, and two ribosomal RNAs. In humans, mitochondria ap- pear to be maternally inherited and their evolution- ary genetics conform well to a haploid model with no recombination (Wilson et al. 1985). Olivo et al. (1983) suggested that recombination or gene con- version may occur in the displacement loop (D loop) region, but this exception has not been dem- onstrated conclusively. Less than 10% of the mito- chondrial genome is noncoding and about 90% of this noncoding DNA is found in the control region. The control region spans 1,122 bp between the pro- line and phenylalanine transfer RNA sequences. It contains the origin of heavy-strand replication (Anderson et al. 1981), the origins of both heavy- and light-strand transcription (Cantatore and At- tardi 1980), promoters for both heavy- and light- strand transcription (Chang and Clayton 1984; Hix- son and Clayton 1985), two transcription-factor binding sites (Fisher et al. 1987), three conserved sequence blocks associated with the initiation of replication, and the D-loop strand-termination- associated sequences (Walberg and Clayton 1981; Brown et al. 1986; Foran et al. 1988).
Brown et al. (1979) estimated that mtDNA evolves at a rate which is five to 10 times that of single-copy nuclear DNA. Control region se- quences appear to diverge about 10 times faster than the mitochondrial genome as a whole (Green- berg et al. 1983). Variation is nonrandomly distrib-
615
uted over the control region; two hypervariable seg- ments of roughly 350 bp each flank a central conserved sequence (Walberg and Clayton 1981; Aquadro and Greenberg 1983). Also, hypervariable region 1, which falls between tRNApro and the con- served middle segment, displays about twice as much variability as hypervariable region 2 (Vigilant 1990). Although it is rapidly evolving and noncod- ing, the control region appears to be subject to an intricate system of constraints to variation, presum- ably as a consequence of the many functions it sup- ports. Saccone et al. (1985), Brown et al. (1986), Mignotte et al. (1987), and Saccone et al. (1991) all report conservation of proposed structure and func- tion even when diversity across taxa makes se- quences hard to align. These studies imply a com- plex pattern of substitution rate variation across sites in this region. In the absence of detailed knowledge of these forces, the two-rate model and the gamma distributed-rates model may provide useful quantifications of the differences in rate among sites.
Compared to the control region as whole, hyper- variable region 1 may appear relatively homoge- neous in substitution rate. However, levels of rate variation among sites specifically within this region have not been adequately investigated. As men- tioned above, Golding (1983) and Kocher and Wil- son (1991) used the gamma distribution to describe variation in substitution rate among sites in the whole mitochondrial genome and the entire control region, respectively. Hasegawa et al. (1985) intro- duced a one-rate-plus-invariable-sites model in a molecular clock analysis of sequences from the two proteins and three tRNAs in hominoid mtDNA that was later used by Hasegawa and Horai (1991) to analyze human control region sequences. This pa- per presents an analysis of substitution rate varia- tion in hypervariable region 1 using the data re- ported by DiRienzo and Wilson (1991), Horai and Hayasaka (1990), and Vigilant (1990). The data sets are analyzed first separately and then combined into one large data set.
detecting variation in substitution rates have not yet been ex- plored. The simulation results presented below outline the ef- fects of these systematic errors.
Independently derived trees are not generally available for within-species data. The trees relating the human mtDNA se- quences examined here were reconstructed using the neighbor- joining method of Saitou and Nei (1987). The use of recon- structed trees for within-species data is valid only if the sequences are nonrecombining. Otherwise different portions of the sequence have different historical relationships (Hudson 1983a; Hein 1990). It is important to note that this entire analysis depends on all the sites in the sequence sharing a common his- tory. Fitch's (1971) algorithm was used to infer the minimum number of changes at each site in the history of a sample of sequences for any particular tree. This paper examines the ef- fects of using this parsimony method of reconstructing states to make inferences about rate variation. Questions about the accu- racy of reconstructed trees are not addressed here.
Once the number of changes per site was obtained, a statistic which I call f, described by Tiago de Oliveira (1965), provides a test for non-uniformity of rate:
s, ~ - m, b(Mn) = 1 - 2 V r ~ - 3Mn (1)
where n is the sample size, S 2 is the sample variance, and Mn is the sample mean. The asymptotic distribution of f is normal (mean = 0, variance = 1), so significant positive values lead to the rejection of the null hypothesis of a single rate at all sites in favor of the alternative hypothesis that more than one rate exists. In the results presented here, the null hypothesis was rejected if f w a s greater than 2.326 (1% significance level). The value o f f is a more informative and appropriate measure of deviations from rate uniformity than the lack of fit of the Poisson distribution.
If rate uniformity could be rejected, I then fit a two-rate Pois- son mixture and a negative binomial distribution to the data. Two methods of moments procedures suggested by Cohen (1965) and Johnson and Kotz (1969, Method 2 p. 131) were used to estimate the parameters of these distributions. These were tested against a number of different estimation procedures and performed as well or better than the others. Chi-square values indicate the goodness of fit tests of these distributions to the observed data. Here, a model fit the data if its chi-square value was not signif- icant at the 1% level. In the analysis of the mtDNA sequence data and in the simulations described below, I considered the following three models of substitution rate variation among sites.
One-Rate Model. Let X be the number of changes per site in the history of the sequences and let T be the total length, in generations, of that history. If all sites have the same per- generation substitution rate, ~x, the number of changes per site, follows a Poisson distribution with parameter txT.
Methods
All the studies of substitution rate variation discussed above share an underlying methodology. Given a tree relating the se- quences, a parsimony reconstruction of states at the internal nodes of the tree is used to infer the number of changes at each site. These numbers are then treated as data, usually being fit by various statistical distributions. Numerous workers have em- ployed versions of this method and, presumably, will continue to do so. However, the method is biased because a parsimony re- construction of states gives the minimum number of changes required at a site. The magnitude of this bias and how it might affect the usefulness of the parsimony method as a means of
Two-Rate Model. Here, a fraction, 8, of the sites are in one rate class (fast) and the remaining 1 - g are in another (slow). Fast sites have a per-generation substitution rate of ix 1 and slow sites have a per-generation substitution rate of ix 2, where ~x I > ix 2. The distribution of X given that a site is fast is Poisson(ha) and the distribution of X given a site is slow is Poisson(h2), where h~ = ~IT and hz = p,2 T . The marginal distribution of X is a mixture of two Poisson distributions:
~. lke-~ ' t ~.2ke - ~'2 P ( X = k ) = ~ + ( 1 - ~ ) k! , k = O , 1,2 . . . . .
(2)
Gamma Distributed Rates Model. In this model, each site, i,
616
has a per-generation substitution rate, I~, which is drawn from a gamma distribution with parameters a and ®. That is,
~ i a - I e - g ' i / o
f ( P ~ i ) - - F ( a ) O a , 0 <~ ~i < ~ . (3)
If T is again the total length of the history of the sequences, the number of changes at site i will follow a Poisson distribution with parameter p~iT. Then, the distribution of the number of changes per site follows a negative binomial distribution:
(4)
k = 0, 1, 2 . . . . where P = OT. Under both of these variable-rate models, it is possible to
distinguish sites that evolve rapidly from sites that evolve slowly. When there are two rate classes, a site is identified as fast if the probability that it is actually a slow site, given the number of changes it has undergone, is lower than some critical value, say 0.01. When rates are gamma distributed among sites, a cutoff value for the rate at a site can be chosen and sites whose rates are greater than that value can be designated "fast ." This value will correspond to a cutoff point for the number of changes at a site such that sites with numbers of changes above this cutoff are identified as fast.
Coalescent Simulations. To provide an idea of how the bias in the parsimony method of counting state changes affects our ability to detect and quantify variation in substitution rate, I simulated sets of sequence data and applied the method to them. The simulations presented here follow a process known as the "coalescent" (Hudson 1983b; Tajima 1983). The coalescent is a convenient way to simulate samples of sequences taken from a large, random mating population of constant effective size. It is assumed that the sequences are not subject to selection and do not undergo recombination. Under the coalescent, genealogies of sequences are random bifurcating, rooted topologies. The dis- tribution of the time, in generations, between two successive nodes in a coalescent tree is approximately exponential with parameter i(i - 1)/(2N) where N is the effective population size and i is the number of lineages present in that interval. The coalescent process is an appropriate model for within-species data in the absence of other information about the population from which the samples were taken.
For each replicate, a coalescent tree of 100 sequences was generated. This is about the average number of sequences in the mtDNA data sets analyzed below. A random sequence 300 bp in length was then assigned to an interior node of the tree. Se- quences evolved along the branches of the tree according to one of the three models of rate variation described above. Changes among nucleotides at each site followed a Jukes-Cantor one- parameter substitution matrix (Jukes and Cantor 1969). The method of assessing rate variation described above was then applied to the simulated data set. Since the parameters of the models are known and because the actual changes in the se- quences are recorded, we can compare the results of the analysis to our expectations of them.
For each of the three models of rate variation among sites, I considered four cases of absolute substitution rate. These were chosen so that levels of variation in the simulated data sets would cover the range of variation observed in the three mtDNA data sets. Table 1 lists the 12 resulting sets of simulation parameters. Case A represents the lowest overall substitution rate and case D the highest. For each case A, B, C, and D, the mean substitution rate is exactly the same for all three models. Further, when there
Table 1. Simulation parameters: values of 0i = 2Nui are as- signed to each site, as described in the text and according to the parameters below, where N is the effective population size and u i is the per generation substitution rate at site i (N assumed to be equal to 105 )
a 0.0310 0.0855 0.1317 0.1714 O 1.0467 1 . 1 4 0 2 1 . 2 3 3 7 1.3271
is variation among sites, for each case A, B, C, and D the vari- ances in substitution rate among sites are identical in the two- rate model and the gamma distributed-rates model. To get some idea of the variation in the estimated parameters, I performed 100 replicates for each of the 12 sets of input parameters in Ta- ble 1.
Simulation Results
In t h e f i g u r e s b e l o w , " a c t u a l " r e f e r s to t h e k n o w n
v a l u e o f p a r a m e t e r s a n d " i n f e r r e d " r e f e r s to t h e
v a l u e o b t a i n e d w h e n t h e p a r s i m o n y m e t h o d w a s ap -
p l i ed to s i m u l a t e d da ta . E r r o r b a r s r e p r e s e n t o n e
s t a n d a r d d e v i a t i o n o f t h e e s t i m a t e s o v e r 100 rep l i -
c a t e s .
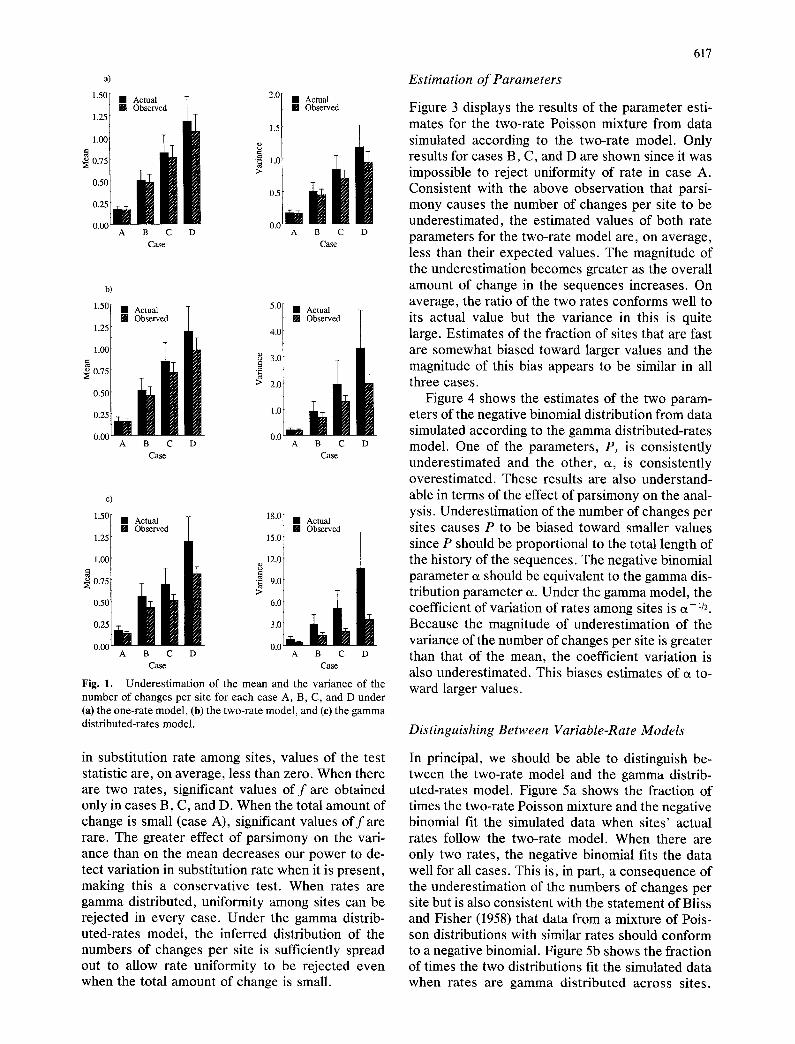
The Number o f Changes Per Site
A s e x p e c t e d , a p a r s i m o n y r e c o n s t r u c t i o n o f s t a t e s
u n d e r e s t i m a t e s t h e n u m b e r o f c h a n g e s p e r s i te in
t h e h i s t o r y o f a s a m p l e o f s e q u e n c e s . T h i s e f f e c t is
m i n o r f o r s i t e s t ha t h a v e e x p e r i e n c e d f e w c h a n g e s
b u t c a n b e q u i t e s i g n i f i c a n t f o r s i t e s t h a t h a v e
c h a n g e d m a n y t i m e s . G i v e n t h e s h a p e o f t h e d i s t r i -
b u t i o n s c o n s i d e r e d h e r e ( m o d e = 0), th i s c a u s e s
b o t h t h e m e a n n u m b e r a n d t h e v a r i a n c e t o b e
s m a l l e r f o r t h e i n f e r r e d d i s t r i b u t i o n t h a n f o r t h e ac -
t ua l d i s t r i b u t i o n . S i m u l a t i o n s v e r i f y t h a t b o t h t h e
m e a n a n d t h e v a r i a n c e a r e u n d e r e s t i m a t e d in e v e r y
c a s e f o r e v e r y m o d e l (F ig . 1). N o t e t h a t t h e m a g n i -
t u d e o f u n d e r e s t i m a t i o n is g r e a t e r f o r t h e v a r i a n c e
t h a n it is f o r t h e m e a n .
Test for Non-uniformity
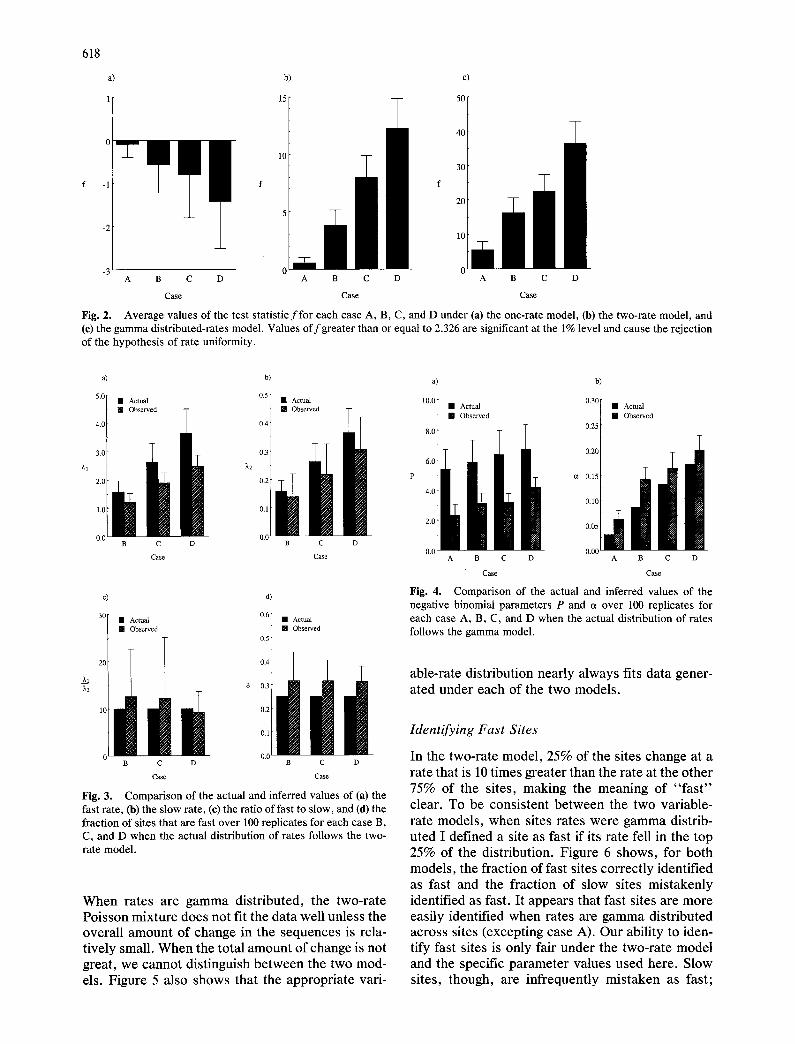
F i g u r e 2 s h o w s t h e a v e r a g e v a l u e s o f t h e t e s t s ta-
t i s t i c f f o r e a c h o f t h e f o u r c a s e s o f a b s o l u t e subs t i -
t u t i o n r a t e u n d e r t h e o n e - r a t e , t w o - r a t e , a n d g a m m a
d i s t r i b u t e d - r a t e s m o d e l s . W h e n t h e r e is no v a r i a t i o n
617
a)
1.50[ • Actual 7 2.0 • Actual 1"25 f [] Observed ~ [] Observed
1 . 5
0.75 >
0"50 d ~ 0.5 0.25
0.00 0.0 A B C D A B C D Case Case
b) 15°I'Actuax [] Observed • Actual y
1.25 4.00 ~ 3.0 i
> 2.0 0.50
0.25 1.
0.0 0 0 0 ~ A B C D A B C D Case Case
c)
1.50 • Actual T 18.0 [ [] Observed |
1.25[ m 15.0
~ l'OOf L 12.0 o75 T m i 9.° 0.50 6.0
0.25 3.0
0.00 0.0 A B C D Case
A B C D Case
Fig. 1. Underestimation of the mean and the variance of the number of changes per site for each case A, B, C, and D under (a) the one-rate model, (b) the two-rate model, and (e) the gamma distributed-rates model.
Estimation of Parameters
Figure 3 displays the results of the parameter esti- mates for the two-rate Poisson mixture from data simulated according to the two-rate model. Only results for cases B, C, and D are shown since it was impossible to reject uniformity of rate in case A. Consistent with the above observation that parsi- mony causes the number of changes per site to be underestimated, the estimated values of both rate parameters for the two-rate model are, on average, less than their expected values. The magnitude of the underestimation becomes greater as the overall amount of change in the sequences increases. On average, the ratio of the two rates conforms well to its actual value but the variance in this is quite large. Estimates of the fraction of sites that are fast are somewhat biased toward larger values and the magnitude of this bias appears to be similar in all three cases.
Figure 4 shows the estimates of the two param- eters of the negative binomial distribution from data simulated according to the gamma distributed-rates model. One of the parameters, P, is consistently underestimated and the other, a, is consistently overestimated. These results are also understand- able in terms of the effect of parsimony on the anal- ysis. Underestimation of the number of changes per sites causes P to be biased toward smaller values since P should be proportional to the total length of the history of the sequences. The negative binomial parameter a should be equivalent to the gamma dis- tribution parameter a. Under the gamma model, the coefficient of variation of rates among sites is e~- 1/2. Because the magnitude of underestimation of the variance of the number of changes per site is greater than that of the mean, the coefficient variation is also underestimated. This biases estimates of a to- ward larger values.
Distinguishing Between Variable-Rate Models
in substitution rate among sites, values of the test statistic are, on average, less than zero. When there are two rates, significant values o f f are obtained only in cases B, C, and D. When the total amount of change is small (case A), significant values o f f are rare. The greater effect of parsimony on the vari- ance than on the mean decreases our power to de- tect variation in substitution rate when it is present, making this a conservative test. When rates are gamma distributed, uniformity among sites can be rejected in every case. Under the gamma distrib- uted-rates model, the inferred distribution of the numbers of changes per site is sufficiently spread out to allow rate uniformity to be rejected even when the total amount of change is small.
In principal, we should be able to distinguish be- tween the two-rate model and the gamma distrib- uted-rates model. Figure 5a shows the fraction of times the two-rate Poisson mixture and the negative binomial fit the simulated data when sites' actual rates follow the two-rate model. When there are only two rates, the negative binomial fits the data well for all cases. This is, in part, a consequence of the underestimation of the numbers of changes per site but is also consistent with the statement of Bliss and Fisher (1958) that data from a mixture of Pois- son distributions with similar rates should conform to a negative binomial. Figure 5b shows the fraction of times the two distributions fit the simulated data when rates are gamma distributed across sites.
618
b)
15
10
f
5
c)
5° I
40
30
f
20
-3 L 0 0 A B C D A B C D A B C D
Case Case Case
Fig. 2. Average values of the test statisticffor each case A, B, C, and D under (a) the one-rate model, (h) the two-rate model, and (e) the gamma distributed-rates model. Values of f greater than or equal to 2.326 are significant at the 1% level and cause the rejection of the hypothesis of rate uniformity.
a) b) a) b)
5.0[ • Actual 0.5 • Actual I = ob 0 od T / " Obso ed T '001 . Ac,u 0.30[ . Ac,o
[ [] Observed ] [] Observed 4.0 0.4 0.25 t
8.0
t 30 03 0201 T J ?,1 ?,2 6.0
2.0 0.2 P et 0.15[ ~ , ~
4.0 0.10
ooo o 2.0 0.05
• 0.0
0.0 0.00 Case Case
c) d)
[,_ 06[ 30 Actual • Actual Observed • Observed
0.5
?,2 ~i 0.3
10 0.2
0.1
0 0.0 B C D B C D
Case Case
Fig. 3. Comparison of the actual and inferred values of (a) the fast rate, (h) the slow rate, (c) the ratio of fast to slow, and (d) the fraction of sites that are fast over 100 replicates for each case B, C, and D when the actual distribution of rates follows the two- rate model.
W h e n ra tes are g a m m a dis t r ibuted, the two- ra te Po i s son mix ture does not fit the da ta well unless the overal l a m o u n t o f change in the sequences is rela- t ively small. W h e n the total a m o u n t o f change is no t great , we canno t dis t inguish be t we e n the two mod- els. F igure 5 also shows that the appropr ia te vari-
A B C D A B C D
Case Case
Fig. 4. Comparison of the actual and inferred values of the negative binomial parameters P and c~ over 100 replicates for each case A, B, C, and D when the actual distribution of rates follows the gamma model.
able-rate dis tr ibut ion near ly a lways fits da ta gener- a ted under each o f the two models .
Identifying Fast Sites
In the two-ra te model , 25% o f the sites change at a ra te that is 10 t imes grea ter than the rate at the o ther 75% o f the sites, making the mean ing o f " f a s t " clear. To be cons is ten t be tween the two variable- rate models , w h e n sites ra tes were g a m m a distrib- u ted I def ined a site as fast if its ra te fell in the top 25% of the distr ibution. Figure 6 shows , for bo th models , the f rac t ion o f fast sites co r rec t ly identif ied as fast and the f rac t ion o f slow sites mis taken ly identified as fast. I t appears that fast sites are more easily identified w h e n rates are g a m m a dis t r ibuted across sites (except ing case A). Our ability to iden- tify fast sites is only fair unde r the two-ra te mode l and the specific pa r ame te r values used here. S low sites, though , are in f requent ly mi s t aken as fast ;
a b
1.5l • Poisson mixture 1.5
l [] Negative Binomial
1.0 r - ' ~ l e l ~k. I 1.0
0.5 0.5
0.0 0.0
Case
Fig. 5. The fraction of times that the two-rate Poisson mixture and the negative binomial distribution fit data simulated under (a) the two-rate model and (b) the gamma distributed-rates model. A model is considered to fit the data if its chi-square value is not significant at the 1% level.
619
a) b)
• Poisson mixture r /
[] Negative Binomial ~ • Fast Correct ] • Fast Correct [] Slow Mistaken ] [] Slow Mistaken
0 0001°° ,, ,!!!i i i 0.25 ~ 0 25
Case 0.00 0.00 B C D A B C D
Case Case
Fig. 6. The proportion of fast sites that are correctly identified as fast and of slow sites mistaken as fast when data are generated under (a) the two-rate model and (b) the gamma distributed-rates model.
nearly all the sites identified as fast do have ele- vated rates. In Fig. 6, for each case, the heights of the two bars represent the relative number of truly fast and slow sites among sites that are identified as being fast. For example, in case C in the two-rate model the proport ion of truly fast sites among sites identified as fast is 0.98.
Rate Variation in Hypervar iable Region I DiRienzo and Wilson (1991), Hora i and Ha-
yasaka (1990), and Vigilant (1990) report 88, 101, and 135 human mtDNA control region sequences, respectively. I will refer to these as data sets 1, 2, and 3, in the order above. These data sets share a 250-bp segment of hypervariable region 1 corre- sponding to sites 16,130-16,379 in the s tandard numbering system of Anderson et al. (1981). Table 2 shows the results of applying the method to each of these data sets separately and combined into one large set of 322 sequences. (The reference sequence is the same in all three data sets.) As expected, the mean number of changes per site obse rved in- creases with the size of the data set. Consistent with the simulation results, values of the test statistic f increase with the overall amount of change in the sequences. All of the values o f f shown are signifi- cant at the 1% level. We can clearly reject the null hypothesis that all sites in hypervariable region 1 change at the same rate.
Table 2 shows the estimates of the parameters of the two-rate Poisson mixture and the negative bino- mial for each of the three data sets and for all data combined. Looking first at the two-rate model, the ratio of the fast rate to the slow rate is approxi- mately 12. About 16% of these sites change accord- ing to the fast rate and 84% according to the slow rate. However , only when the three data sets are analyzed separately can the distribution of the num- ber of changes per site be explained using the two-
rate model. When the data sets are combined, a mixture of two Poisson distributions does not fit the data (X 2 = 60.1, df = 6; P < 0.001). In contrast , the gamma distributed-rates model is always sufficient to explain the observed numbers of changes per site. Estimates of the parameters of the negative binomial distribution suggest that the coefficient of variation in rate among sites is approximately 1.5. Further, the simulation results presented above in- dicate that this is an underest imate of the actual amount of variation. That is, the estimates of ~ in Table 2 are probably too large. Consistent with the simulation results, estimates of P are roughly pro- portional to the overall amounts of change in the data sets.
Table 3 lists the sites identified as being fast in the combined data set. I chose a cutoff point such that sites with rates in the upper 10% of the gamma distribution, with oL equals 0.47, are considered fast. Given that P equals 3.45, this corresponds to a cut- off point for the number of changes at a site of about 4.5. Sites which have undergone f ive or more changes, then, are called fast and the rest are called slow. Twenty-nine sites were identified as fast using this method. The means of the expected number of changes per site for sites below and above the fast/ slow cutoff are 1.0 and 7.4, respectively. In other words, the rate of substitution at fast sites is, on average, 7.4 times the rate of substitution at slow sites. Sites are listed in Table 3 in decreasing order of the number of changes they have exper ienced to give some idea of the variation in rate among these " f a s t " sites.
Lastly, in relating inferences about rate variation to the structural and functional features of hyper- variable region 1, we would like to know whether the variability among sites is clustered along the sequence. To address this, I calculated the coeffi- cient of correlation for the number of changes at
620
Table 2. per site
Estimated parameters for the three mtDNA data sets individually and combined: 2 is the inferred mean number of changes
~ f hi h2 XllX2 ~ a P
Data set 1: 0.464 6.62 1.85 0.16 11.6 0.18 0.44 1.05 Data set 2: 0.624 12.05 3.72 0.34 10.9 0.08 0.60 1.04 Data set 3: 0.844 18.94 3.76 0.31 12.1 0.16 0.45 1.85 All data: 1.640 53.96 7.27 a 0.53 a 13.7 a 0.16 a 0.47 3.45
a When the data sets are combined, the two-rate model no longer fits the data
Table 3. "Fas t" sites identified within hypervariable region 1: position numbers are according to the standard numbering sys- tem of Anderson et al. (1981)
sites separated by different distances. If there is clustering, we would expect there to be a gradual decrease in the value of the correlation coefficient from one for the correlation of a site with itself to zero for the correlation of two sites separated by some number of other sites. Figure 7 shows the result. The correlation coefficient immediately drops to near zero for adjacent sites and then varies around zero for sites separated by greater dis- tances. Standard significance tests of the correla- tion coefficient cannot be applied here since pairs of sites are not independent. However, it appears that there is no clustering of variability in hypervariable region 1.
Substitution Bias and Base Composition The assumptions of Jukes-Cantor substitution
and uniform base composition made in the simula- tions presented above are unrealistic for mtDNA. In the 250-bp segment analyzed here, transitions between pyrimidines (CT) are nearly three times as abundant as transitions between purines (AG), t ransvers ions make up only about 5% of all changes, and the base composition is 0.35:0.09: 0.37:0.19 (A:G:C:T). In addition, the inferred num- bers of G-to-A and T-to-C changes are roughly equivalent to the inferred numbers of A-to-G and C-to-T changes, respectively, so that, per base, G
1.2-
1 . 0 -
.8
r . 5
.2
0.0
- . 2
-2 0 i i , , i i i i i J i
2 4 6 8 10 12 14 16 18 20 22 24
distance
Fig. 7. Graph of the correlation coefficient between the number of changes at sites separated by one, two, etc., base pairs. Dis- tances on the horizontal axis are offset by one: 0 corresponds to the correlation of a site with itself, 1 to the correlation between adjacent sites, 2 to the correlation between sites separated by one base pair, and so on.
and T must change more rapidly than A and C. The possibility exists that the different rates of transi- tion among purines and pyrimidines and elevated G-to-A and T-to-C rates of change account for much of the variation observed in hypervariable re- gion 1. For instance, we might infer significant vari- ation in rate among sites if being a pyrimidine in the ancestral sequence predisposed a site to change many times (transversions being rare). Similarly, if a site in the ancestral sequence was a G and then changed to A in parallel several times, it might be identified as a fast site.
To assess the magnitude of these effects, I did 100 replicates of case C of the one-rate model, but where the base composition mentioned above was maintained, changes between pyrimidines were three times more likely than changes between pu- rines, and the transition bias was 15 to one. The resulting mean value of the test statistic f was 1.37 with a standard deviation of 1.05. Compare this to the results for case C in Fig. 2a; biased substitution among nucleotides and skewed base composition do appear to mimic the effects of variation in sub- stitution rate among sites. We can control for these effects in the analysis of mtDNA sequences by ex- amining separately sites that are inferred to be A,
80 .~ so 60 ~ 60
4O 40
20 20
0 , t , ~ , i 0 1 • i ~ , t , i
1 2 3 4 0 . 2 . 4 . 6 . 8
) v l ~2
11 80 E= 80 6 0 o 6 0
r.,.)
4 0 4 0
2 20
3 ~ ; ; 0 . . . . . . 0 1 2 3
l O 0
80
6o 40
20
0 0
mo ] 801 6o
40
20
0 , 0
J . 1 . 2
, , i , ,
10 20 30
C~ P f
621
Fig . 8. D i s t r i b u t i o n s o f p a r a m e t e r est i -
m a t e s f o r d a t a se t 3 o v e r 100 e q u a l l y p a r -
s i m o n i o u s t r ee s . T r e e s w e r e i n f e r r e d us -
ing P A U P ( S w o f f o r d 1990).
G, C, and T in a hypothetical ancestral sequence and by considering only sites that have remained either purines or pyrimidines during their entire his- tory. Doing this does not affect our conclusions about substitution rate variation in hypervariable region 1. For sites that unambiguously show a C in the inferred ancestral sequence, the value of f is 32.6, the two-rate model s.till does not fit the data, and the estimated value of oL is 0.42. For sites with a T, fequa ls 40.3 and a equals 0.53. Sites that are inferred to be A and G in the ancestral sequence and remain purines across the tree give similar param- eter estimates but the number of changes at these sites is small.
Discussion
The simulations presented here provide support for the use of the parsimony method for examining variation in substitution rate among sites in molec- ular sequences. When it exists and sequences have diverged appreciably, rate variation is easily de- tected using a simple test of homogeneity. The par- simony method does introduce clear and sometimes strong systematic errors, precluding an unbiased as- sessment of variation in rate. However, the direc- tion of these biases always causes inferred levels of variation to be less than actual levels, making the method conservative overall. Although the method remains useful, these errors are unavoidable as long as parsimony remains part of the analysis. The sim- ulations also show that at least some of the hyper- variable sites in a sequence can be identified with confidence. The method is sensitive to deviations from the assumptions used in these simulations. Bi- ased substitution among nucleotides and skewed base composition can mimic the effects of substitu- tion rate variation among sites. Keeping in mind
both its advantages and flaws, we can continue to use the parsimony method until better ones are available.
An important contribution in this regard has been made by Kelly (1991), who recently described a maximum likelihood approach to the analysis of variation in substitution rate among sites in DNA sequences. If the sequences are related by a star phylogeny, her procedure allows for a test of rate uniformity and the calculation of lower bounds for the mean and the variance of rates among sites. Assuming a distributional form for the rates, such as the gamma, the parameters of the distribution can be estimated. This approach also accommo- dates biased substitution rate among nucleotides and non-uniform base composition. Because the likelihood calculations are computationally very in- tensive, Kelly restricted many of her analyses to only pairs of species. When the assumption of a star phylogeny can be dropped and when the calcula- tions become more computationally feasible, this approach or one like it will replace biased methods such as the one used here.
Application of the method examined here to se- quences from hypervariable region 1 of the control region of human mtDNA shows that substantial variation in substitution rate exists among sites in that region, that a gamma distributed-rates model can be used to quantify this variation, and that sites with highly elevated rates can be identified. The differences in substitution rate among nucleotides and base compositional biases present in mtDNA do not confound the analysis. The actual distribu- tion of rates among sites makes models that admit only two rates inappropriate. This becomes appar- ent only when a large number of sequences are ex- amined. Our power to reject inappropriate variable- rate models increases with the average number of changes per site. Lastly, variation does not appear to be clustered within hypervariable region 1.
622
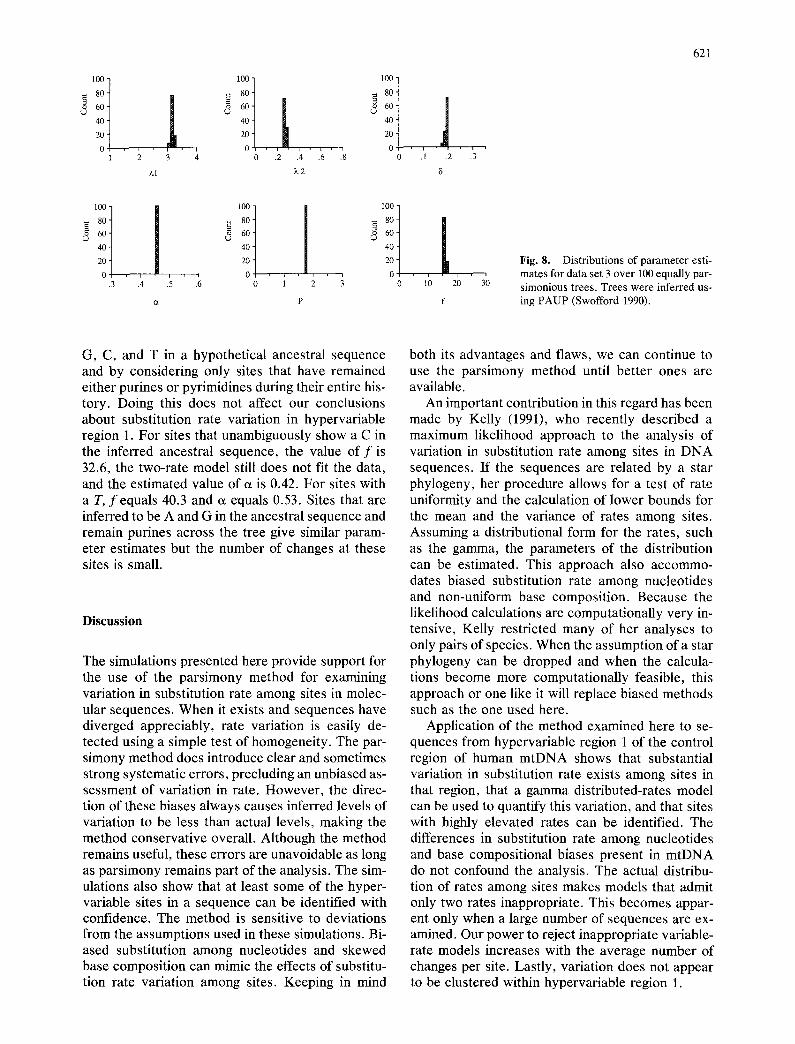
U s i n g v e r s i o n s o f the p r o g r a m P A U P (Swof fo rd 1991), b o t h D i R i e n z o and W i l s o n (1990) and Vigi- l an t e t al . (1991) f o u n d at l e a s t 100 equa l l y p a r s i m o - n i o u s t r e e s fo r t h e d a t a a n a l y z e d h e r e . L a t e r , H e d g e s et al. (1992) r e t r i e v e d 50,000 equa l l y pars i - m o n i o u s t r ee s for the d a t a o f V ig i l an t e t al. (1991). S ince the p r e s e n t s t u d y is t r e e - b a s e d , it is i m p o r t a n t to u n d e r s t a n d h o w the r e su l t s o f the ana lys i s v a r y f rom one m i n i m u m leng th t r ee to ano the r . F i g u r e 8 s h o w s tha t the d i s t r i bu t i ons o f the va r i ous p a r a m e - t e r s i m p o r t a n t to the m e t h o d a re n e a r l y iden t i ca l o v e r 100 equa l l y p a r s i m o n i o u s t r ees . Resu l t s a re s h o w n on ly for d a t a se t 3, bu t the c o n c l u s i o n s a re the s a m e fo r t he o t h e r t w o d a t a se ts . Th is t ree- b a s e d m e t h o d is u s e f u l e v e n t h o u g h w e c a n n o t p l a c e m u c h c o n f i d e n c e in spec i f i c r e c o n s t r u c t e d to- p o l o g i e s . A l s o , the p a r a m e t e r va lue s in F ig . 8 a re v e r y s imi la r to t h o s e in T a b l e 2. O u r c o n c l u s i o n s a b o u t r a t e v a r i a t i o n a r e the s a m e w h e t h e r m a x i m u m p a r s i m o n y o r n e i g h b o r - j o i n i n g is u s e d to infer t r ees .
B e c a u s e o f the i r r a p i d evo lu t i on , s e q u e n c e s f rom h y p e r v a r i a b l e r eg ions 1 and 2 h a v e b e c o m e v e r y p o p u l a r r e c e n t l y for a d d r e s s i n g q u e s t i o n s c o n c e r n - ing g e n e t i c v a r i a t i o n w i t h i n s p e c i e s . W i t h i n hu- m a n s , t h e y h a v e b e e n u s e d to infer a s p e c t s o f his- t o r i ca l b i o g e o g r a p h y ( C a n n e t al. 1987; D i R i e n z o and W i l s o n 1990; Vig i l an t e t al. 1991), to p e r f o r m m o l e c u l a r c l o c k a n a l y s e s o f h u m a n or ig ins (Vigi lan t e t al. 1991; H a s e g a w a and H o r a i 1990), and e v e n to d e t e r m i n e fami l ia l r e l a t i o n s h i p s (Or r ego and K ing 1990). V a r i a t i o n in subs t i t u t i on r a t e a m o n g s i tes , b e s t d e s c r i b e d w i th in h y p e r v a r i a b l e r eg ion 1 b y the g a m m a d i s t r i bu t i on , wil l c e r t a in ly af fec t the r e su l t s o f t h e s e and o t h e r a n a l y s e s . W e c l ea r l y need to de- v e l o p m e t h o d s tha t a r e e i t he r i n d e p e n d e n t o f r a t e v a r i a t i o n o r can a c c o m m o d a t e it na tu ra l ly .
Acknowledgments. Thanks go to Montgomery Slatkin for pro- viding valuable guidance throughout this work, to Mary-Claire King for initially posing the question about hypervariable region 1, to Chuck Ginther for supplying the mtDNA data sets, to Arend Sidow for pointing out the effects of biased substitution, to W. Kelly Thomas for helpful discussion about substitution biases in mtDNA, and to Tina Rouse and Koichiro Tamura for numerous useful comments. This work has been supported by NIH grant GM40282 to M. Slatkin and NIH Post-Graduate Training Program in Genetics grant GM07127 to UC Berkeley.
References
Anderson S, Bankier AT, Barrell BG, Bruijn MHL, Coulsen AR, Drouin J, Eperon IC, Nierlich DP, Roe BA, Sanger F, Schreier PH, Smith AJH, Staden R, Young IG (1981) Se- quence and organization of the human mitochondrial ge- nome. Nature 290:457--465
Aquadro CF, Greenberg BD (1983) Human mitochondrial DNA variation and evolution: analysis of nucleotide sequences from seven individuals. Genetics 108:287-312
Aquadro CF, Kaplan N, Risko KJ (1984) An analysis of the dynamics of mammalian mitochondrial DNA sequence evo- lution. Mol Biol Evol 1:423-434
Bliss CI, Fisher RA (1953) Fitting the negative binomial distri- bution to biological data. Biometrics 9:176-200
Benzer S (1961) On the topography of the genetic fine structure. Genetics 47:403-415
Brown GG, Gadaleta G, Pepe G, Saccone C, Sbis~i E (1986) Structural conservation and variation in the D-loop-contain- ing region of vertebrate mitochondrial DNA. J Mol Biol 192: 503-511
Brown WM, George MM, Wilson AC (1979) Rapid evolution of animal mitochondrial DNA. Proc Natl Acad Sci USA 76: 1967-1971
Cann RC, Stoneking M, Wilson AC (1987) Mitochondrial DNA and human evolution. Nature 325:31-36
Cantatore P, Attardi G (1980) Mapping of nascent light and heavy strand transcripts on the physical map of Hela cell mitochondrial DNA. Nucleic Acids Res 8:2605-2625
Chang DD, Clayton DA (1984) Precise identification of individ- ual promoters for transcription of each strand of human mi- tochondrial DNA. Cell 36:635-643
Cohen AC (1965) Estimation in mixtures of discrete distribu- tions. In: Patil GP (ed) Classical and contagious discrete dis- tributions. Pergamon Press, Oxford, pp 373-378
Dickerson RE (1971) The structure of cytochrome c and the rates of molecular evolution. J Mol Evol 1:26--45
DiRienzo A, Wilson AC (1991) Branching pattern in the evolu- tionary tree for human mitochondrial DNA. Proc Natl Acad Sci USA 88:1597-1601
Fisher RP, Topper JN, Clayton DA (1987) Promoter selection in human mitochondrial DNA involves binding of a transcrip- tion factor to orientation-independent upstream regulatory el- ements. Cell 50:247-258
Fitch WM (1971) Toward defining the course of evolution: min- imum change for a specific tree topology. Syst Zool 20:406- 416
Fitch WM (1976) The molecular evolution of cytochrome c in eukaryotes. J Mol Evol 8:13-40
Fitch WM, Margoliash E (1967) A method for estimating the number of invariant amino acid codon positions in a gene using cytochrome c as a model case. Biochem Genet 1:65-71
Fitch WM, Markowitz E (1970) An improved method for deter- mining codon variability in a gene and its application to the rate of fixation of mutations in evolution. Biochem Genet 4:579-593
Foran DR, Hixson JE, Brown WM (1988) Comparisons of ape and human sequences that regulate mitochondrial DNA tran- scription and D-loop DNA synthesis. Nucleic Acids Res 16: 5841-5861
Foster PL, Eisenstadt E, Cairns J (1982) Random components in mutagenesis. Nature 288:365-367
Golding GB (1983) Estimates of DNA and protein sequence di- vergence: an examination of some assumptions. Mol Biol Evol 1:125-142
Golding GB, Glickman BW (1986) Evidence for local DNA in- fluences on patterns of substitutions in the human a-inter- feron gene family. Can J Genet Cytol 28:483-496
Greenberg BD, Newbold JE, Sugino A (1983) Intraspecific nu- cleotide sequence variability surrounding the origin of repli- cation in human mitochondrial DNA. Gene 21:33-49
Hasegawa M, Kishino H, Yano T (1985) Dating of the human- ape splitting by a molecular clock of mitochondrial DNA. J Mol Evol 22:160-174
Hasegawa M, Horai S (1991) Time of the deepest root for poly- morphism in human mitochondrial DNA. J Mol Evol 32:37- 42
Hedges SB, Kumar S, Tamura K, Stoneking M (1992) Human origins and the analysis of mitochondrial DNA sequences. Science 255:737-739
Hein J (1990) Reconstructing evolution of sequences subject to recombination using parsimony. Mathematical Biosciences 98:185-200
Hixson JE, Clayton A (1985) Initiation of transcription from each of the two human mitochondrial promoters requires unique nucleotides at the transcriptional start sites. Proc Natl Acad Sci USA 82:2660-2664
Holmquist R, Goodman M, Conroy T, Czelusniak J (1983) The spatial distribution of fixed mutations within genes coding for proteins. J Mol Evol 19:437-448
Holmquist R, Pearl D (1980) Theoretical foundations for a quan- titative paleogenetics. Part III: The molecular divergence of nucleic acids and proteins for the case of genetic events of unequal probability. J Mol Evol 16:211-267
Horai S, Hayasaka K (1990) Intra specific nucleotide sequence differences in the major noncoding region of human mito- chondrial DNA. Am J Hum Genet 46:828-842
Hudson R (1983a) Properties of a neutral allele model with in- tragenic recombination. Theor Pop Biol 23:183-201
Hudson R (1983b) Testing the constant-rate neutral model with protein sequence data. Evolution 37:203-217
Johnson NL, Kotz S (1969) Discrete distributions. Houghton Mifflin, Boston
Jukes TH (1969) Evolutionary pattern of specificity regions in light chains of immunoglobulins. Biochem Genet 3:109-117
Jukes TH, Cantor CR (1969) Evolution of protein molecules. In: Munro HR (ed) Mammalian protein metabolism. Academic Press, New York, pp 21-132
Jukes TH, Holmquist R (1972) Estimation of evolutionary changes in certain homologous polypeptide chains. J Mol Biol 64:163-179
Kelly CL (1991) A test of the markov assumption in DNA se- quence evolution and a generalization of the model which allows the positions in the sequence to evolve at unequal rates. PhD thesis, University of Califomia at San Diego
Kimura M (1979) Model of effectively neutral mutations in which selective constraint is incorporated. Proc Natl Acad Sci USA 76:3440-3444
King JL, Jukes TH (1969) Non-darwinian evolution. Science 164:788-798
Kocher TD, Wilson AC (1991) Sequence evolution of mitochon- drial DNA in human and chimpanzees: control region and protein coding region. In: Osawa S, Honjo T (eds) Evolution of life: fossils, molecules and culture. Springer-Verlag, To- kyo, pp 391--413
Kunisawa T, Horimoto K, Otsuka J (1987) Accumulation pattern of amino acid substitutions in protein evolution. J Mol Evol 24:357-365
Larson A, Wilson AC (1989) Patterns of ribosomal RNA evolu- tion in salamanders. Mol Biol Evol 6:131-154
Markowitz E (1970) Estimation and testing goodness-of-fit for
623
some models of codon fixation variability. Biochem Genet 4:595-601
Mignotte B, Dunon-Bluteau D, Reiss C, Mounolou JC (1987) Sequence deduced physical properties in the D-loop region common to five vertebrate mitochondrial DNAs. J Theor Biol 124:57-69
Olivo PD, Van De Walle MJ, Laipis PJ, Hauswirth WW (1983) Nucleotide sequence evidence for rapid genomic shifts in the bovine mitochondrial DNA D-loop. Nature 306:400-402
Orrego C, King MC (1990) Determination of familial relation- ships. In: PCR protocols: A guide to methods and applica- tions. Academic Press, New York, pp 416-426
Palumbi S (1989) Rates of molecular evolution and the fraction of nucleotide positions free to vary. J Mol Evol 29:180-187
Saccone C, Attimonelli M, Sbis~i E (1985) Primary and higher order structural analysis of animal mitochondrial DNA. In: Quagliariello E, Slater EC, Palmieri F, Saccone C, Kronn AM (eds) Achievements and perspective of mitochondrial re- search. Elsevier, Amsterdam, pp 37--47
Saccone C, Pesole G, Sbis~ E (1991) The main regulatory region of mammalian mitochondrial DNA: structure-function model and evolutionary pattern. J Mol Evol 33:83-91
Saitou N, Nei M (1987) The neighbor-joining method: a new method for reconstructing phylogenetic trees. Mol Biol Evol 4:406--425
Swofford D (1990) PAUP (Phylogenetic Analysis Using Parsi- mony, version 3.0L). Illinois Natural History Survey, Cham- paign, IL
Tajima F (1983) Evolutionary relationships of DNA sequences in finite populations. Genetics 105:437-460
Tiago de Oliveira J (1965) Some elementary test for mixtures of discrete distributions. In: Patil GP (ed) Classical and conta- gious discrete distributions. Pergamon Press, Oxford, pp 379-384
Uzzell T, Corbin KW (1971) Fitting discrete probability distri- butions to evolutionary events. Science 172:1089-1096
Vigilant L (1990) Control region sequences from African popu- lations and the evolution of human mitochondrial DNA. PhD thesis, University of California at Berkeley
Vigilant L, Stoneking M, Harpending H, Hawkes K, Wilson AC (1991) African populations and the evolution of human mito- chondrial DNA. Science 253:1503-1507
Walberg MW, Clayton DA (1981) Sequence and properties of the human KB cell and mouse L cell D-loop regions of mitochon- drial DNA. Nucl Acids Res 9:5411-5421
Wilson AC, Cann RL, Carr SM, George M, Gyllensten UB, Helm-Bychowski KM, Higuchi RG, Palumbi SR, Prager EM, Sage RD, Stoneking M (1985) Mitochondrial DNA and two perspectives on evolutionary genetics. Biol J Linn Soc 26: 375-400
Zuckerkandl E, Pauling L (1965) Evolutionary divergence and convergence in proteins. In: Bryson V, Vogel HJ (eds) Evolving genes and proteins. Academic Press, New York, pp 97-166