Prelude to the Special Issue on Systems and Architectures for High-Quality Statistics Production Many survey professionals have become aware of an increasing dependence among statistical methods, statistical practice as implemented in tools and procedures, and information technology (IT). This dependence is reflected in a shift towards standardized processes and tools, integrated systems for production of statistics, statistical moderni- zation programmes, transitions from stove-pipe based to systems-based statistical production, and similar activities. These developments have arisen within statistical organizations and through cross-organizational collaboration. In developing this special issue, we identified two trends – one in methodology and one in IT systems – that were influential in these developments. The methodological trend leads towards a balanced evaluation and treatment of the components of aggregate error associated with a statistical product. The result, sometimes called Total Survey Design or, more generally, Adaptive Total Design (ATD), is also well integrated with the quality perspectives on statistics production. The IT system trend centers on developments in “enterprise architecture,” which very broadly is a formal, structured description of an enterprise 1 . These developments are also influenced by increasing financial pressure experienced by large-scale statistical organizations. Twenty years ago, introducing a special issue of JOS (1993, Vol.9:1) on “Current Research and Policy Issues at Statistical Agencies and Organizations,” the then editor-in- chief Lars Lyberg noted that statistical agencies are undergoing “a perennial flow of the flux and change”, and followed with a list of areas affected by new developments. The list included, among other items, user needs and the external survey environment, development of new programs, interagency harmonization, new technologies, and confidentiality protection. All of these were said to be influenced by increasing pressure for productivity and quality gains. Most of these issues remain with us today in one form or another. Within the context defined by these evergreen topics, there has been substantial progress in both of the abovementioned trends. Embracing the enterprise architecture approach, recent years have seen an active international collaboration regarding the foundations of production of statistics. Common conceptual frameworks, like the Generic Statistical Business Process Model (GSBPM) and Generic Statistical Information Model (GSIM), are the results of such international initiatives. In addition, there is a wide range of q Statistics Sweden 1 The terms that we are using in this introduction are well explicated in the contributions to this special issue, which is the reason we, for brevity, refrain from providing references here. Journal of Official Statistics, Vol. 29, No. 1, 2013, pp. 1–4
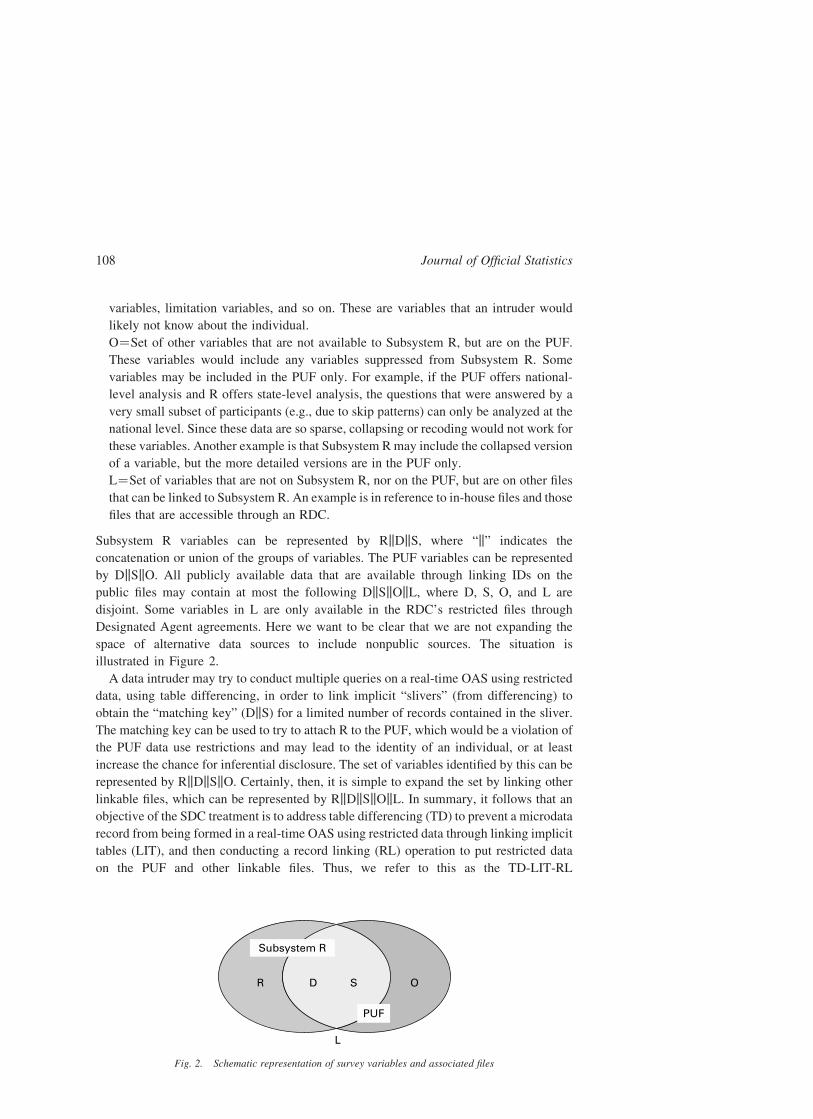
Transcript
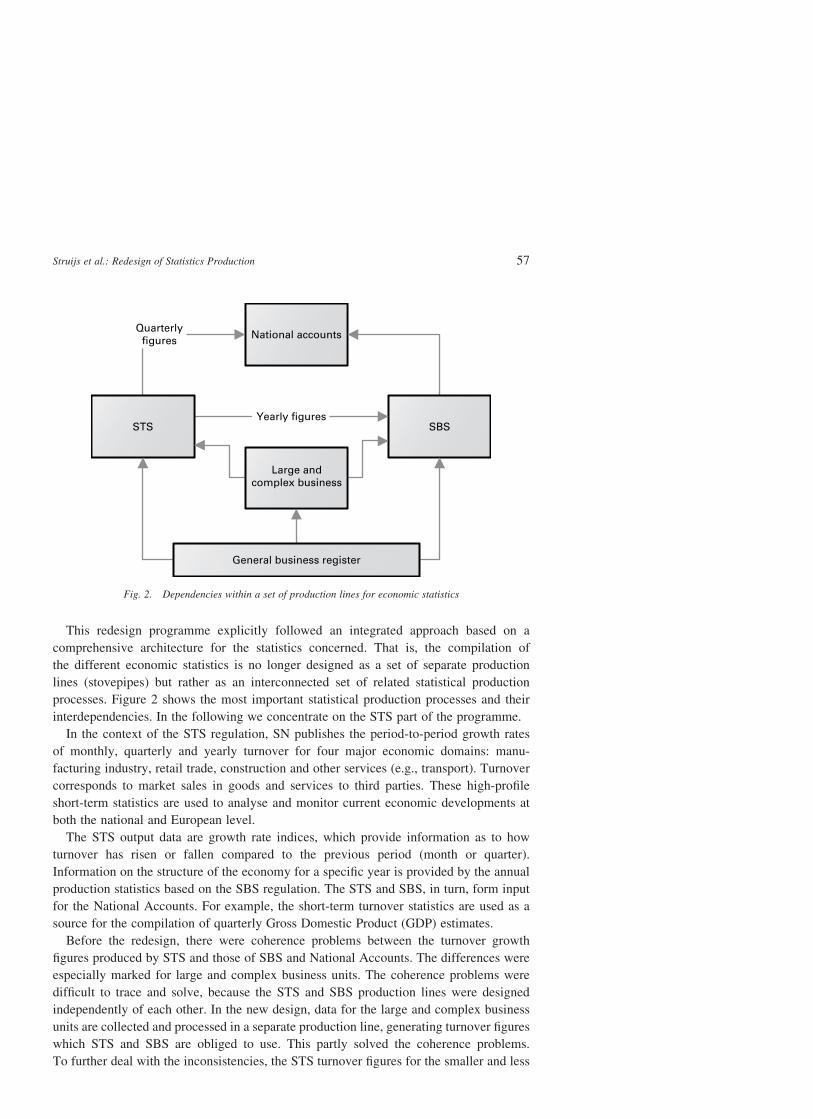
Prelude to the Special Issue on Systems and Architectures forHigh-Quality Statistics Production
Many survey professionals have become aware of an increasing dependence among
statistical methods, statistical practice as implemented in tools and procedures, and
information technology (IT). This dependence is reflected in a shift towards standardized
processes and tools, integrated systems for production of statistics, statistical moderni-
zation programmes, transitions from stove-pipe based to systems-based statistical
production, and similar activities. These developments have arisen within statistical
organizations and through cross-organizational collaboration.
In developing this special issue, we identified two trends – one in methodology and one
in IT systems – that were influential in these developments. The methodological trend
leads towards a balanced evaluation and treatment of the components of aggregate error
associated with a statistical product. The result, sometimes called Total Survey Design or,
more generally, Adaptive Total Design (ATD), is also well integrated with the quality
perspectives on statistics production. The IT system trend centers on developments in
“enterprise architecture,” which very broadly is a formal, structured description of an
enterprise1. These developments are also influenced by increasing financial pressure
experienced by large-scale statistical organizations.
Twenty years ago, introducing a special issue of JOS (1993, Vol.9:1) on “Current
Research and Policy Issues at Statistical Agencies and Organizations,” the then editor-in-
chief Lars Lyberg noted that statistical agencies are undergoing “a perennial flow of the
flux and change”, and followed with a list of areas affected by new developments. The
list included, among other items, user needs and the external survey environment,
development of new programs, interagency harmonization, new technologies, and
confidentiality protection. All of these were said to be influenced by increasing
pressure for productivity and quality gains. Most of these issues remain with us today in
one form or another.
Within the context defined by these evergreen topics, there has been substantial progress
in both of the abovementioned trends. Embracing the enterprise architecture approach,
recent years have seen an active international collaboration regarding the foundations of
production of statistics. Common conceptual frameworks, like the Generic Statistical
Business Process Model (GSBPM) and Generic Statistical Information Model (GSIM), are
the results of such international initiatives. In addition, there is a wide range of
q Statistics Sweden
1 The terms that we are using in this introduction are well explicated in the contributions to this special issue,which is the reason we, for brevity, refrain from providing references here.
Journal of Official Statistics, Vol. 29, No. 1, 2013, pp. 1–4
international cooperation efforts, including a high-level group, a statistical network, a
thriving wiki organised under the UNECE auspices2, and a set of projects that Eurostat is
coordinating among European Union (EU) member states towards implementing an EU
Vision, among other forms of cooperation.
On the methodology side, progress has been slower and international collaborations
have yet to form to the extent that they have in the former area. Nevertheless,
substantial progress has been made within many statistical organisations that view
product quality as an ongoing process of error assessment and reduction. Applying the
ATD paradigm to statistical production systems, improved product quality is achieved
by assessing the error risks associated with multiple error sources and applying error
reduction strategies that mitigate the major risks. The new quality improvement
strategies rely less on indirect indicators of data quality such as response rates and
agreement rates, and more on direct evidence of bias and error variance obtained
through nonsampling error analyses.
Also, from a broader perspective, formalised methodological approaches (based on the
ATD paradigm and generally relying on some architectural features) are important in
ensuring that statistical agencies have robust structures through which to address the
abovementioned “flux and change.” These robust structures can support both development
of additional statistical products that meet stakeholders’ current needs, and improvement
in the balance among quality, cost and risk in statistical production processes.
This special issue of JOS is intended to support current and future developments
regarding systems and architectures for high-quality statistics production in two ways.
First, the special issue presents the “state of the art” in this area. How far have
organizations at the forefront of the initiated changes come, what have they achieved thus
far, what “lessons learned” are they drawing from their experiences, what are they
currently working on, and what issues have they identified for discussion by the wider
community? We hope that answers to these questions will help the reader compare and
contrast the approaches to extract useful insights for their own organisation, or to identify
points of departure for further work.
Second, we hope to enhance and accelerate further integration of methodology and IT
for statistical production systems. For instance, from an ATD perspective, there is an
increasing need for paradata and other forms of process data, administrative data, and
metadata. Allocating costs to detailed system components or to the steps in production of
statistics – which is needed for improvement in the balance of cost vs. quality – appears at
the moment to be an almost impossible task in many organisations. It is our impression
that only advanced IT solutions can help provide these data in a manageable way.
Therefore, enterprise architecture is needed.
However, a formal system that describes the production of statistics is somewhat
distinct from a system for production of consumer goods or services. Thus, we assume
there will be some important differences in enterprise architecture for statistical production,
relative to the architecture developed for other commercial or governmental work.
2www1.unece.org/stat/platform/display/msis/
Journal of Official Statistics2
Development of the GSBPM and GSIM are important steps in the exploration of these
differences, and related insights have been presented at symposia organized independently
by Statistics Sweden (“Modernisation of Statistics Production” in 2009) and Statistics
Canada (the International Methodology Symposium 2011: “Strategies for Standardization
of Methods and Tools – How to Get There?”). We hope that the content of this special
issue will make additional contribution in this area.
Pursuing the two abovementioned goals, in May 2011 we initiated work on a JOS
special issue on systems and architectures for high-quality statistics production. The
call for main papers resulted in nine abstract submissions, of which five resulted in
articles included in this special issue. Our foremost aim with the articles is to provide a
solid review and synthesis of the current state of knowledge and practice. We were
fortunate to be able to work with representatives from two of the intended contexts, official
statistics and private sector, while we regret we were not able to include any academic
contributions.
To broaden the perspectives of the articles, and to expand consideration of
methodological issues, we invited prominent survey methodologists and other experts
to provide formal comments on the articles. The aim with the discussions is to facilitate
creation of a broad agenda that identifies several areas in methodological research that
will be crucial to subsequent development of systems and standardization that are
consistent with rigorous, high-quality methodology. These constitute the second part of
this special issue.
Departing from the usual format for a journal with articles followed by invited
comments, we do not provide rejoinders by the articles’ authors in this issue. The lack of a
“coda” (in the musical sense) in this discussion is intentional in two ways. First, we want to
open the floor to our readers (including the authors and other interested stakeholders) to
submit further papers on the topic, or share their thoughts on the subject through the
Letters to the Editor section. Second, we do not believe it is currently possible to give any
authoritative final judgment on the matter – the lack of a coda hopefully emphasises this
view.
Instead of a coda, the sixth article, by the three guest editors for the special issue – John
Eltinge, Paul Biemer and Anders Holmberg – seeks to place work with statistical
production systems and methodology in a broader context defined by multiple dimensions
of quality, cost, and risk.
This special issue represents the results of the activities outlined above. We hope that it
contributes to the work of building better systems for production of high-quality statistics,
and better integration with the methodological accomplishments. Together, these two
components ought to lead to statistical products that are of high quality and broadly used.
We sincerely thank all the contributors to the special issue for their dedicated and
persistent work towards achieving this goal.
Having received an exceptional contribution by Jack Nealon and Elvera Gleaton, we
were saddened to learn about the illness and subsequent passing away of Jack Nealon in
December 2012. Jack spent his entire 37-year career with the National Agricultural
Statistics Service (NASS), serving as the Director of the Information Technology Division
and the Chief Information Officer for NASS, and at the time of his retirement was the
Senior Project Manager, Office of the Administrator. Jack was known as a great
Prelude 3
communicator who was passionate and had a deep desire to excel. His dedication to
completing the NASS contribution for this special issue despite his failing health was an
inspiration to us all and will long be remembered.
Boris Lorenc Paul P. Biemer
Ingegerd Jansson John L. Eltinge
Anders Holmberg
Journal of Official Statistics4
Consolidation and Standardization of Survey Operations ata Decentralized Federal Statistical Agency
Jack Nealon and Elvera Gleaton1
With tighter federal budgets on the horizon, the National Agricultural Statistics Servicedecided in 2009 to pursue three architectural transformations, primarily to provide savings instaff resource costs by enabling the centralization or regionalization of survey operations. Thetransformational initiatives involved: (1) centralizing and consolidating network servicesfrom 48 locations; (2) standardizing survey metadata and integrating survey data into easilyaccessible databases across all surveys; and (3) consolidating and generalizing surveyapplications for the agency’s diverse survey program. The three architectural transformationswill be described as well as initial efforts to consolidate and standardize survey operationsacross the agency.
The mission of the National Agricultural Statistics Service (NASS) in the U.S. Department
of Agriculture (USDA) is to provide timely, accurate, and useful statistics in service to
U.S. agriculture. Each year, NASS conducts hundreds of surveys and produces over 400
agricultural statistics reports, which are disseminated on a weekly, monthly, quarterly, or
annual basis and cover most aspects of U.S. agriculture. NASS also performs reimbursable
agricultural surveys, primarily for other USDA agencies, which make up approximately
ten percent of the NASS budget. Finally, NASS is responsible for the Census of
Agriculture every five years.
NASS has managed its diverse survey program through a network of 46 Field Offices
and a Headquarters Office in Washington, D.C. and Fairfax, Virginia. A Field Office is
located in Puerto Rico and in every state, except five New England states that are serviced
by a single New England Field Office in New Hampshire. The Field Offices work closely
with the State Departments of Agriculture and land-grant universities2 through
Federal/State cooperative agreements to collect additional agricultural data important
to local economies, such as county data. The Federal/State cooperative agreements
q Statistics Sweden
1 National Agricultural Statistics Service, United States Department of Agriculture (USDA). USDA-NASS, 1400Independence Ave., SW, Washington, DC 20250, U.S.A. Email: [email protected]
2 Starting in 1862, the U.S. Federal Government granted federally-owned land (hence the name “land-grant”) tostates for the development of land-grant universities offering education in agriculture, engineering, and traditionalacademic subjects.
Journal of Official Statistics, Vol. 29, No. 1, 2013, pp. 5–28
minimize duplicate data collection efforts between Federal and State agencies, lighten
the burden on survey respondents, and foster consistency in the production of agricultural
statistics.
Through its 46 Field Offices, NASS uses a local presence to build trust with data
providers and credibility with data users to encourage support and cooperation for NASS
surveys. The 46 Field Offices help increase awareness of the NASS survey program
throughout the country and keep the NASS Headquarters Office informed about local
agricultural issues that can potentially impact surveys. On the other hand, the NASS
decentralized structure makes it an ongoing challenge to ensure survey procedures are
performed consistently across the 46 Field Offices. Field Offices vary in size – from only
one federal employee in Alaska to 32 federal employees in California. Most Field Offices
have historically employed statisticians and statistical assistants to execute several survey
functions for that Field Office, such as list sampling frame maintenance, data collection,
and data review.
Data are collected from farmers and ranchers, livestock feeders, grain elevator
operators, and other agribusinesses, who voluntarily supply the data in a variety of ways
– mail questionnaire returns, web data collection, telephone interviews, face-to-face
interviews, and crop measurements. The National Association of State Departments of
Agriculture (NASDA) has traditionally provided about 3,000 part-time field and
telephone interviewers to collect the survey data for Field Offices. These interviewers,
especially field interviewers, often have knowledge of the local agriculture and are
known in the community, which can be an asset when interviewing sampled farm
operators repeatedly.
The global economic crisis that surfaced during 2008 led to discussions that
many federal budgets would become tighter in the future to address the expanding federal
budget deficit. NASS realized it must operate more efficiently to remain relevant as a
federal statistical agency under the projected tighter budgets. At the beginning of 2009,
NASS Administrator Cynthia Clark made a formal request to all employees asking for
suggestions on ways to be more efficient as an agency. Two main themes were identified
from the input that could make NASS not only more efficient, but also potentially
more effective as an agency: improving the survey processing architecture and the staff
resource utilization.
1.1. Survey Processing Architecture
An inefficient decentralized survey processing architecture had evolved across the 46
Field Offices for several survey functions. For example, each of the 46 Field Offices had to
make updates on their Local Area Network (LAN) whenever a change was made to a
Blaise3 data collection or data editing instrument or to a SAS3 data analysis application, so
the task was performed 46 times rather than potentially only one time. Thousands of Blaise
and SAS data files were created, manipulated, and transferred from application to
application each year when it would have been more efficient to store the data in an easily
accessible, centralized database. The decentralized survey processing architecture led to
3 Blaise is survey software from Statistics Netherlands (www.blaise.com) and SAS is analytical software fromSASw (www.sas.com).
Journal of Official Statistics6
the underutilization of a wealth of survey data located in thousands of disparate and
proprietary data files since analysis could not be readily performed across years, surveys,
and commodities. In addition, the decentralized survey processing architecture limited the
implementation of new survey procedures. As an example, NASS had a goal of developing
customized survey questionnaires for farmers and ranchers to reduce respondent burden,
but this could not be realized due to the poor integration of survey data and metadata that
had evolved from the decentralized processing architecture.
1.2. Staff Resource Utilization
NASS is unique among federal statistical agencies in the U.S. since it has a decentralized
structure for conducting surveys using 46 Field Offices. However, the decentralized
structure contributed significantly to almost two-thirds of the total NASS budget in 2009,
being devoted to salaries and benefits for employees. Could NASS operate more
efficiently by performing survey functions at a central or regional office rather than
separately in 46 Field Offices? As an example, list sampling frame maintenance of the
farm population has historically been performed by one or more employees in each Field
Office for that Field Office. Could many of the list sampling frame maintenance tasks be
performed centrally using fewer statisticians and statistical assistants than used in the Field
Offices? In addition to providing human resource savings, centralization or regionalization
of various survey functions from the 46 Field Offices would also provide the opportunity
for more consistent or standard survey procedures, which potentially could improve the
quality of agricultural surveys.
Unfortunately, NASS was not able to explore ways to perform survey functions in
a central or regional office structure, since the decentralized technology architecture
would not effectively support it. Therefore, NASS identified the following three
foundational and architectural transformations to be addressed with high priority from
2010 through 2013:
(1) Network: Centralize and consolidate network services across the agency to remove
location as a barrier to shifting or combining work across Field Offices.
(2) Metadata and Data: Standardize survey metadata and integrate survey data in easily
accessible databases to streamline survey operations from design through
dissemination.
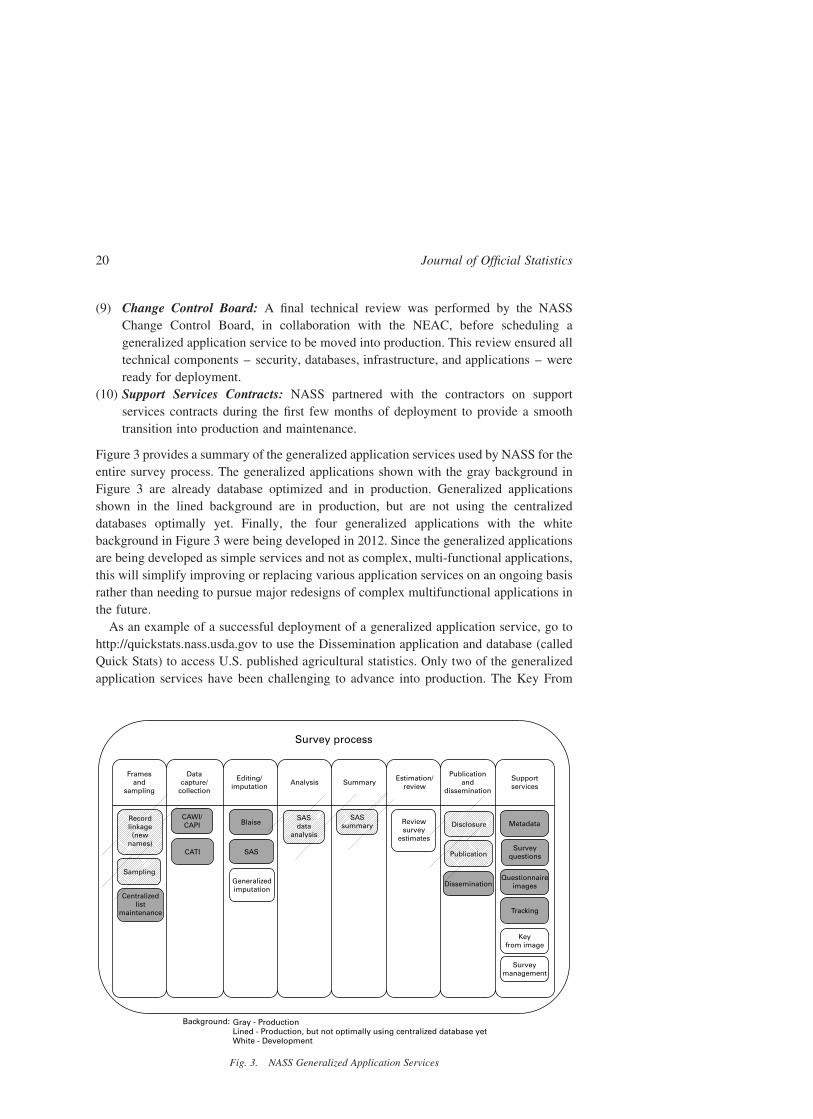
(3) Applications: Consolidate and generalize survey applications and make optimal use
of the enterprise databases so surveys are processed in a standard manner and survey
functions can be performed effectively from any location in the agency.
These three architectural transformations, once implemented, would finally position
NASS not only to use staff resources more efficiently by centralizing or regionalizing
critical survey operations, but also to potentially perform survey functions more
effectively through more standardized survey operations.
In the next three sections, the objectives and benefits, transformational architectures,
and lessons learned will be discussed for the three initiatives. Then, the initial
consolidation and standardization of survey operations at NASS, which were enabled by
these three initiatives, will be described in Section 5.
Nealon and Gleaton: Consolidation and Standardization 7
2. Objectives and Benefits
The overarching objective of the three architectural transformations is to provide NASS
with the ability to centralize and/or regionalize survey operations, primarily to reduce staff
resource expenses. However, there are additional objectives that will now be described for
each of the three transformations that will provide significant benefits to NASS. NASS
used the following four criteria to determine if each transformation eventually met its
objectives: the transformation enabled centralization, integration, standardization, and
flexibility. By satisfying these four criteria for the three transformational initiatives, NASS
believes it will be able to continue to achieve the agency’s mission during times of tighter
budgets by utilizing staff resources more effectively, potentially reducing survey errors,
shortening the time period to complete many surveys, and providing improved data
products to the public.
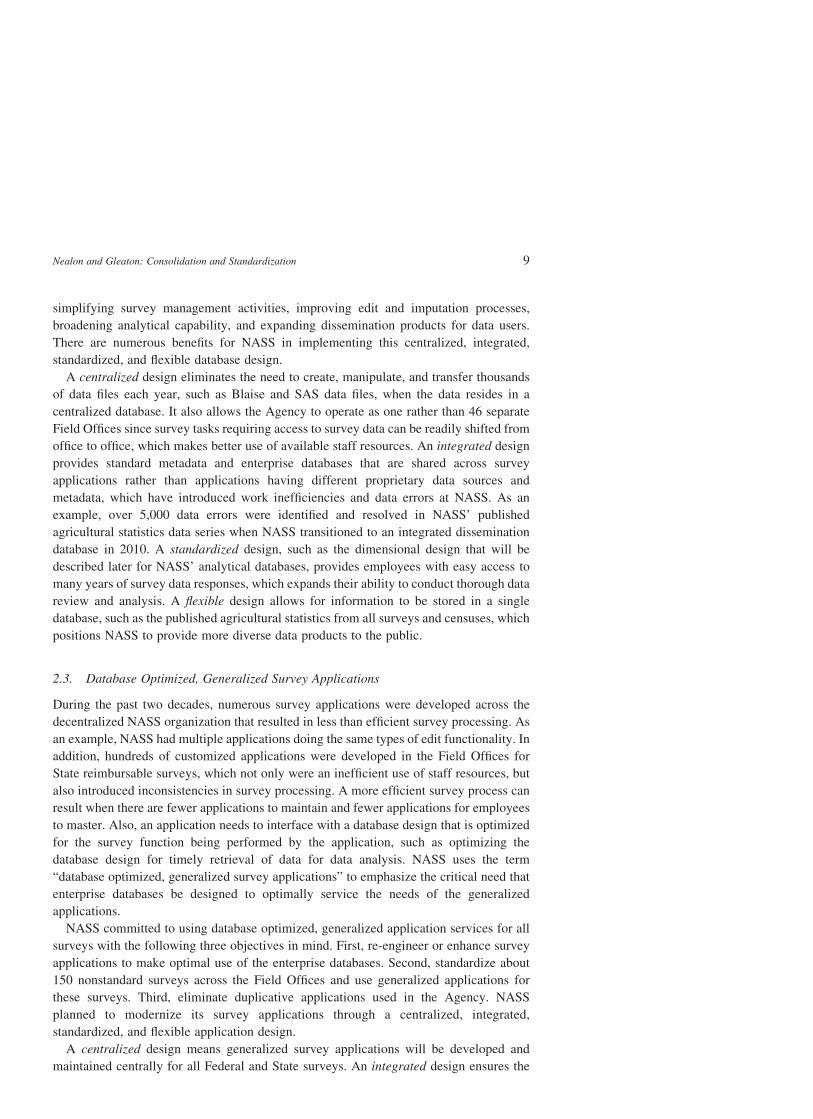
2.1. Network Centralization and Consolidation
NASS realized it had to migrate first from its distributed local area network (LAN)
environment to a centralized environment to remove location as a barrier to conducting
surveys. Therefore, the objective was to consolidate the LANs from 48 locations (46 Field
Offices, Washington, D.C., and Fairfax, Virginia) to only two sites (production and
disaster recovery sites). The goal of the consolidation of the network services was to make
the agency more efficient due to the centralized, integrated, standardized, and flexible
network design.
A centralized design means LAN administration would be performed by fewer
employees from a central location, enabling NASS to reduce the staff resources devoted to
LAN services. Computer and physical security can also be strengthened by greatly
reducing the number of locations containing physical servers and electronic personally
identifiable information. An integrated design allows all employees access to the same
desktop image, making it more efficient to manage desktops centrally. A standardized
design provides the same desktop image to all employees with the same role. As part of
standardizing the server configuration, NASS also standardized directory structures, roles,
and access rights, which is a very important element in the failover and disaster recovery
capability the system provides. A flexible design means the new network architecture
allows employees to access applications and data from anywhere at any time using a web
browser from their desktops, laptops, iPads, or smartphones. This ease of access facilitates
remote access to the network by employees.
2.2. Standardize Survey Metadata and Integrate Survey Data
Even after the network has been centralized and consolidated, the survey metadata would
still not be consistent and the survey data would still not be well integrated. Therefore,
NASS committed to migrating to consistent survey metadata and easily accessible,
centralized databases. There were two main reasons: First, NASS wanted to minimize
work inefficiencies caused by the decentralized data management process. Second, NASS
wanted to provide employees easy access to integrated historical and current survey data to
potentially improve survey operations by enhancing sampling and estimation procedures,
Journal of Official Statistics8
simplifying survey management activities, improving edit and imputation processes,
broadening analytical capability, and expanding dissemination products for data users.
There are numerous benefits for NASS in implementing this centralized, integrated,
standardized, and flexible database design.
A centralized design eliminates the need to create, manipulate, and transfer thousands
of data files each year, such as Blaise and SAS data files, when the data resides in a
centralized database. It also allows the Agency to operate as one rather than 46 separate
Field Offices since survey tasks requiring access to survey data can be readily shifted from
office to office, which makes better use of available staff resources. An integrated design
provides standard metadata and enterprise databases that are shared across survey
applications rather than applications having different proprietary data sources and
metadata, which have introduced work inefficiencies and data errors at NASS. As an
example, over 5,000 data errors were identified and resolved in NASS’ published
agricultural statistics data series when NASS transitioned to an integrated dissemination
database in 2010. A standardized design, such as the dimensional design that will be
described later for NASS’ analytical databases, provides employees with easy access to
many years of survey data responses, which expands their ability to conduct thorough data
review and analysis. A flexible design allows for information to be stored in a single
database, such as the published agricultural statistics from all surveys and censuses, which
positions NASS to provide more diverse data products to the public.
The General Survey System Initiative at RTI International:An Integrated System for the Collection and Management
of Survey Data
Lisa Thalji1, Craig A. Hill2, Susan Mitchell2, R. Suresh2, Howard Speizer2,
and Daniel Pratt2
There is a risk of introducing survey error at every stage of any study involving a survey:design, data collection, processing, and analysis. Effectively managing the survey samplefrom the time of sample selection through the survey lifecycle is essential to producing high-quality data on schedule and within budget. Managing the survey lifecycle using softwaresystems that are not fully integrated can result in error and cost inefficiencies. The developmentof an integrated data collection and management system that supports monitoring of surveyerror has the potential to reduce errors and improve operational efficiencies. This system,referred to as Nirvana, uses a standardized database, protocol, and terminology. It integratescase status and history information acrossmodes of data collection and tracing aswell as sampleand contact information. Nirvana also centralizes questionnaire development, qualitymonitoring, and support for real-time survey management decisions.
Key words: Total survey error; data collection systems; Adaptive Total Design; paradata;survey costs.
1. Introduction
Organizations that collect, process, and analyze survey data must design and implement
systems and protocols that guard against the intrusion of survey error to produce data and
statistics that are of sufficient quality. However, quality is a complex construct. By some
definitions, quality data must be accurate and meet the user’s needs or fitness for use (Juran
and Gryna 1980). Biemer and Lyberg (2003) notes that when there are a variety of uses for
survey data, fitness for use becomes multifaceted. He stipulates that survey data must be
accurate, credible, comparable, useable, relevant, accessible, timely, complete, and
coherent (Biemer 2010). In other work, this Total Survey Quality framework has been
described as having three dimensions: accuracy, timeliness, and accessibility (Biemer and
Lyberg 2003). In this article, we describe RTI International’s (RTI) initiative to build an
integrated survey management system designed to improve the accuracy, timeliness, and
accessibility of the data we produce.
RTI is a nonprofit research organization that primarily conducts research for the U.S.
federal government. As a research contractor, RTI responds to requests for proposals from
q Statistics Sweden
1 RTI International 3040 East Cornwallis Road, Post Office Box 12194, Research Triangle Park, NC27709-2194, U.S.A. Email: [email protected] RTI International, 3040 East Cornwallis Road, Post Office Box 12194, Research Triangle Park, NC27709-2194, U.S.A.
Journal of Official Statistics, Vol. 29, No. 1, 2013, pp. 29–48
U.S. statistical agencies as well as other nonstatistical agencies. Research proposals are
requested in response to policy or program questions (e.g., understanding incidence and
prevalence rates for drug use and abuse) and the scope of research services requested
varies widely. Some agencies request study designs and plans for data collection, data
processing, and statistical analyses; others require only data collection and data processing
proposals. RTI conducts studies using all types of survey modes, subject populations,
and establishments. In all proposals, RTI describes how it will collect the relevant data
and, most importantly, how it plans to ensure the quality of those data given schedule and
budget constraints.
There is potential for introducing survey error at each stage of a survey – from sampling
frame creation to data dissemination (United Nations 1999). Sampling error arises from
observing a sample rather than the whole population, and further errors can be introduced
through deficiencies in the sample frame or sample design. Nonsampling error can be
introduced by questionnaire authors, interviewers, and/or respondents (measurement
error); errors result from bias in the collected data (nonresponse error); and errors can
occur in the coding, editing, and management of collected survey data (processing error).
The accumulation of error across all survey stages is referred to as total survey error
(Biemer and Lyberg 2003). Any error at any stage diminishes the accuracy and precision of
survey estimates.
One common approach to minimizing survey error is to use, for each stage of a survey,
a software-based solution designed to double-check, prevent, or alert survey managers
to the potential for error. In the data collection process, for example, survey software can
automatically disallow entry of out-of-range values, check for (and disallow) entries that
are inconsistent with prior answers, and can keep interviewers from asking questions that
are inappropriate for certain subsets of respondents (such as asking male respondents if
they are pregnant). Another common approach is to use software to collect and analyze
paradata (i.e., data about the data) during the data collection process that allows survey
managers to adjust resources and approaches in near-real time to gain improvements in
survey quality metrics, such as response rates, while balancing time and cost constraints.
Paradata can range from simple summary measures such as response rates to something as
specific as the elapsed time between call attempts.
At RTI, we call the process of using the paradata to make management choices that
improve the quality of the survey data Adaptive Total Design (ATD). Evolving from
the concept of responsive design (Groves and Heeringa 2006), ATD is a framework for
monitoring key statistics that help survey managers decide how best, in real time, to
modify protocols to minimize total survey error and maximize cost efficiency (Hunter et al.
2012). RTI’s ATD system requires access to all of the data collected during survey
administration and complex models for measuring the impact of these protocol changes on
survey estimates.
Before this initiative, RTI built project-specific and independent software, systems, and
protocols designed to prevent and minimize error. This process resulted in separate
software-based systems for managing sampling, data collection, coding, editing, and
data analysis processes. The information contained in these systems was not integrated
(i.e., the systems did not talk to one another) within a given survey or across survey modes.
Journal of Official Statistics30
This lack of integration created the potential for undetected measurement and data
processing error.
In addition, as is the case at many large survey research organizations, many of the
survey management systems were developed for particular projects, which meant that RTI
often had multiple software systems to support the data collection stages of the survey
process. Since these systems were built independently of one another, standardization was
inherently lacking, which also could create the potential for specification error. Finally,
because many of these systems were built some time ago, it was proving increasingly
difficult to generate the kind of near-real time paradata needed to fully use our ATD system.
In the data collection and data processing stage especially, we saw a need to create an
integrated and standard system that ties together all stages of data collection and data
processing by employing a common database structure, protocols and terminology across
studies. Consequently, we developed an RTI-funded initiative, the General Survey System
Initiative (GSSI). The GSSI’s main goals are to improve the quality of the data we produce
through means not achieved heretofore with our custom approach: (1) integration,
(2) standardization, and (3) accessibility to necessary paradata.
The GSSI is governed by a group of senior managers in RTI’s survey and programming
groups. The senior managers are responsible for carrying out various aspects of the
initiative, including technical design, budget and schedule.
2. Process for a New Approach
Our focus on customization had introduced several operational challenges. Although study
staff were able to develop workarounds, concern grew that the lack of standardization and
integration and the misallocation of resources could be causing unintended and undetected
survey error. For example, if the tracing system and computer-assisted telephone
interviewing (CATI) system are not integrated, a separate process is required to share
information about the sample member between the two systems. The time delay to
associate the sample member’s information from two different systems impacts the survey
manager’s abilities to take immediate action and array resources appropriately. It also may
result in some duplicative systems and/or manual operations in an attempt to improve the
timeliness of information and decision making, thereby affecting overall operational
efficiencies and costs. These types of challenges and inefficiencies made it increasingly
difficult to maximize data quality within reasonable costs (i.e., within the budget provided
by the government) as our survey efforts grew more and more complex.
To understand the challenges of working with RTI’s systems, the GSSI steering
committee decided to gather information by surveying RTI project leaders, survey
managers, and programmers. A web survey was developed to (1) inventory all of the
software and related tools used to support surveys; (2) evaluate the efficiency of deploying
these tools; and (3) evaluate the overall usability of software and related tools. These areas
typically contribute 20–30% of the total survey costs. Over the span of several months, the
data were mined for common themes and challenges. The committee methodically
reviewed and discussed these data to ensure a shared understanding of each problem
before proposing solutions. What emerged through these discussions was a clearer
understanding that the root cause of our problems could be attributed to the lack of
Thalji et al.: The General Survey System Initiative 31
standardization, integration of survey systems, and access to survey data and paradata
(Couper 1998).
Another consideration that factored into our discussions was the need to better position
ourselves to address the changes and challenges in the field of survey research. Response
rates have been declining (see, e.g., Curtin et al. 2005; de Heer 1999; Steeh et al. 2001;
Tortora 2004) across all modes of data collection: in-person, telephone, and mail surveys.
To counter this trend, the conduct of multimode surveys has increased as a means of
obtaining higher response rates than those using one mode alone. Often, telephone surveys
are combined with an in-person follow-up. In other instances, in-person surveys are
combined with shorter telephone surveys and/or mail surveys to bolster the response rates.
To continue to provide timely quality data in a fast-changing survey environment, we
needed robust systems that could operate under various conditions and provide the type of
paradata required to efficiently manage survey operations.
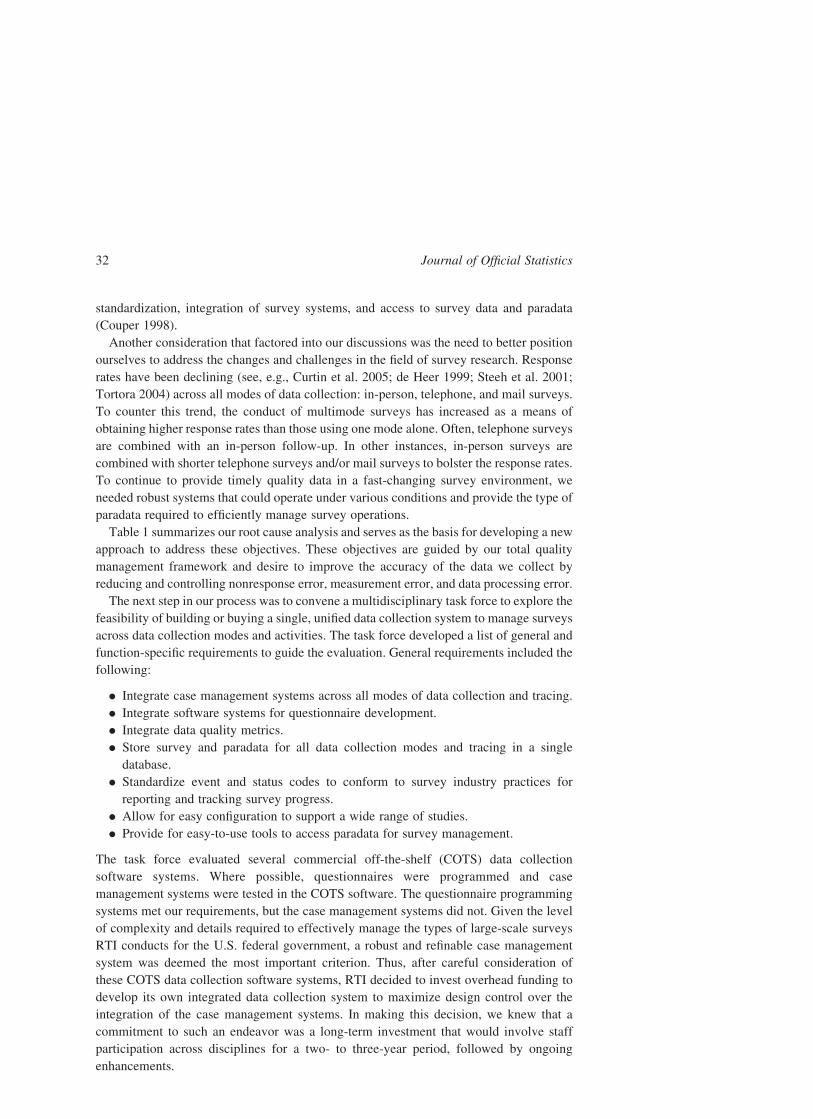
Table 1 summarizes our root cause analysis and serves as the basis for developing a new
approach to address these objectives. These objectives are guided by our total quality
management framework and desire to improve the accuracy of the data we collect by
reducing and controlling nonresponse error, measurement error, and data processing error.
The next step in our process was to convene a multidisciplinary task force to explore the
feasibility of building or buying a single, unified data collection system to manage surveys
across data collection modes and activities. The task force developed a list of general and
function-specific requirements to guide the evaluation. General requirements included the
following:
. Integrate case management systems across all modes of data collection and tracing.
. Integrate software systems for questionnaire development.
. Integrate data quality metrics.
. Store survey and paradata for all data collection modes and tracing in a single
database.
. Standardize event and status codes to conform to survey industry practices for
reporting and tracking survey progress.
. Allow for easy configuration to support a wide range of studies.
. Provide for easy-to-use tools to access paradata for survey management.
The task force evaluated several commercial off-the-shelf (COTS) data collection
software systems. Where possible, questionnaires were programmed and case
management systems were tested in the COTS software. The questionnaire programming
systems met our requirements, but the case management systems did not. Given the level
of complexity and details required to effectively manage the types of large-scale surveys
RTI conducts for the U.S. federal government, a robust and refinable case management
system was deemed the most important criterion. Thus, after careful consideration of
these COTS data collection software systems, RTI decided to invest overhead funding to
develop its own integrated data collection system to maximize design control over the
integration of the case management systems. In making this decision, we knew that a
commitment to such an endeavor was a long-term investment that would involve staff
participation across disciplines for a two- to three-year period, followed by ongoing
enhancements.
Journal of Official Statistics32
Table 1. Objectives for new approach
Objectives Challenges Desired outcomes
Standardization Custom approach causes inefficiencies Eliminate duplicative systemsMaintenance of multiple systems raises costs Improve operational efficienciesDiversity of systems requires additional
training and knowledge transferDecrease learning curve for users and
programmersReduce level-of-effort for system specification,
setup, and supportProvide more flexible staffing optionsLeverage reusable components of the systemIncrease consistency of implementation
Integration Difficulties in identifying next actions forparticular cases result in duplicative work
Reduce elapsed case processing time
Delays in sharing information across systemsreduce efficiency and increase cost
Eliminate case processing steps
Improve sample management information
Eliminate redundant dataReduce reliance on programmer intervention
to move information between systems
Access to data (surveyand paradata)
Lack of real-time access to data increasesdifficulty and cost of survey management
Increase availability of data to survey managers
Changing priorities quickly during datacollection is difficult without access to flexible,dynamic data reporting tools
Improve quality of decisions
Improve timeliness of decisionsDevelop better and more consistent data access and
reporting tools
Thalji
etal.:
TheGenera
lSurvey
System
Initia
tive33
Once this decision was made, the GSSI steering committee convened another task force
whose mission was to develop the ideal structure, flow, and functionality of a unified data
collection system that would meet our objectives of standardization, integration of survey
systems, and access to survey data and paradata. Their initial focus was limited to the data
collection process, thereby addressing the most immediate costs and quality concerns and
challenges of operating in our current environment. On large-scale surveys, data collection
costs can be as high as 50–60% of the total costs of the survey, and can contribute to errors
in the accuracy of the data collected. The design for the unified data collection system
resulted in the development of the Nirvana system.
3. Design and Architecture of Nirvana
The integrated data collection system – Nirvana – is designed around a central database
and repository. Data are stored in the standardized database in a table structure and are
accessible by all of the component systems that support case flow as the sample moves
through different stages of activities. Each project using Nirvana has its own database that
holds all data, including:
. sample data, which includes strata used for sample selection and other characteristics
of the population of interest.
. subject contact data, which includes contact information as well as past activities
specific to each sample member.
. metadata that specifies details about the questionnaire instrument, such as
question text, response options, and other attributes of the questions, as well as the
configuration settings for the stages in the data collection process, and is comparable
to the structural metadata used in Statistical Data and Metadata Exchange (SDMX).
. paradata which includes a wide array of operational and observational data about data
collection, such as cost and production data, record of calls data, information about
the sample frame and sample, data quality measures, interviewer characteristics, and
interviewer observations, and
. survey data regardless of data collection mode.
The Nirvana database has a core SQL schema that holds all of the sample and subject
contact data. All other modules tap these centralized schema tables to provide the
necessary data for contacting sample members by telephone, by mail, or in person. When
new contact information becomes available, these same tables are updated, regardless of
the source of the information; thus, all of the modules receive the updated information
at the same time.
Another key feature of the Nirvana database is that it maintains a single database table
that holds the paradata, such as the history of all of the efforts expended in contacting the
sample member. Thus, whether an invitation is sent via e-mail, telephone, or in-person
visit to the sample member’s home, these activities are recorded in the same table, and that
information is available to all users. This feature ensures that the interviewer, supervisor,
and survey manager are fully aware of all of the efforts made to reach the sample member.
Nirvana uses an administrative database that maintains linkage information in an
encrypted form for all of the project-specific Nirvana databases. The administrative
Journal of Official Statistics34
database also maintains the role and access control for each user for each project. When a
Nirvana application or website is invoked, it queries the administrative database to ensure
that the current user has access to the project in question and automatically connects to the
desired project. This technique makes it easy for survey managers to access their projects
and provides an extra level of data security for the projects. Nirvana design took into
consideration resource allocation, especially developer resources, with the hope of
reducing costs. For example, even though the initial setup of the database might require an
experienced SQL programmer, their involvement will be minimal after the initial database
setup phase. The configuration of the project and other setup work can be done by a
programmer with less experience and hence at lower cost.
The database is set up in such a way that each survey process is defined as a stage; for
example, a lead letter mailing; a telephone, field, or web-based interview; or the tracing or
locating of sample members are each defined as a stage. The current state of each stage is
reflected by the current status code for that stage. For any given case, a specific status code
initializes the stage. The user posts an event to indicate that a specific activity had
occurred, and the system automatically derives the new status based on the posted event,
the prior status, and other indicators. Note that it is possible for a status code in one stage to
trigger the initialization status code in another stage, which is a simple but powerful
technique that is employed to seamlessly link different modes of data collection. The
Nirvana events, status, and stages essentially codify the steps and process in the workflow
of a project and to some extent automatically document the same.
For example, for an in-person study that requires confirming telephone and address
information in an automated fashion as its first step, the survey sample is loaded into
Nirvana tracing stage number 400 with a status code of 1001 to indicate that the tracing
stage has been initialized. When sample cases are sent to tracing (an activity), the status
code within that stage changes to 1101 to indicate that sample cases have been sent to
tracing. The results from tracing are reflected in the status code of that stage. When all pre-
field tracing activities are completed, the sample case moves to the next stage in the survey
process: the lead letter mailing stage. The completion status of pre-field activities triggers
the initialization of the lead letter mailing stage. As letters are mailed on a flow basis, the
status code changes to lead letter mailed. The lead letter mailed status automatically
triggers the initialization of the next stage, field interview, and so on throughout the data
collection process. An advantage of this scheme is that at any time the user can easily
review the history of a sample case and know which activities have been conducted to
date. In addition, the user knows the total number of sample cases ever initiated at each
stage. The above examples illustrate the adaptability of the Nirvana system to changes in
workflow processes required by any survey project. A data collection or monitoring
process can be described as a combination of actions (Nirvana events) and resulting steps
(Nirvana status); this implies that the process can be defined as a Nirvana stage. In addition,
if a sequence of tasks can be automated, a Nirvana module can be developed to standardize
the implementation of those tasks for that project and then the module becomes re-usable
for future projects.
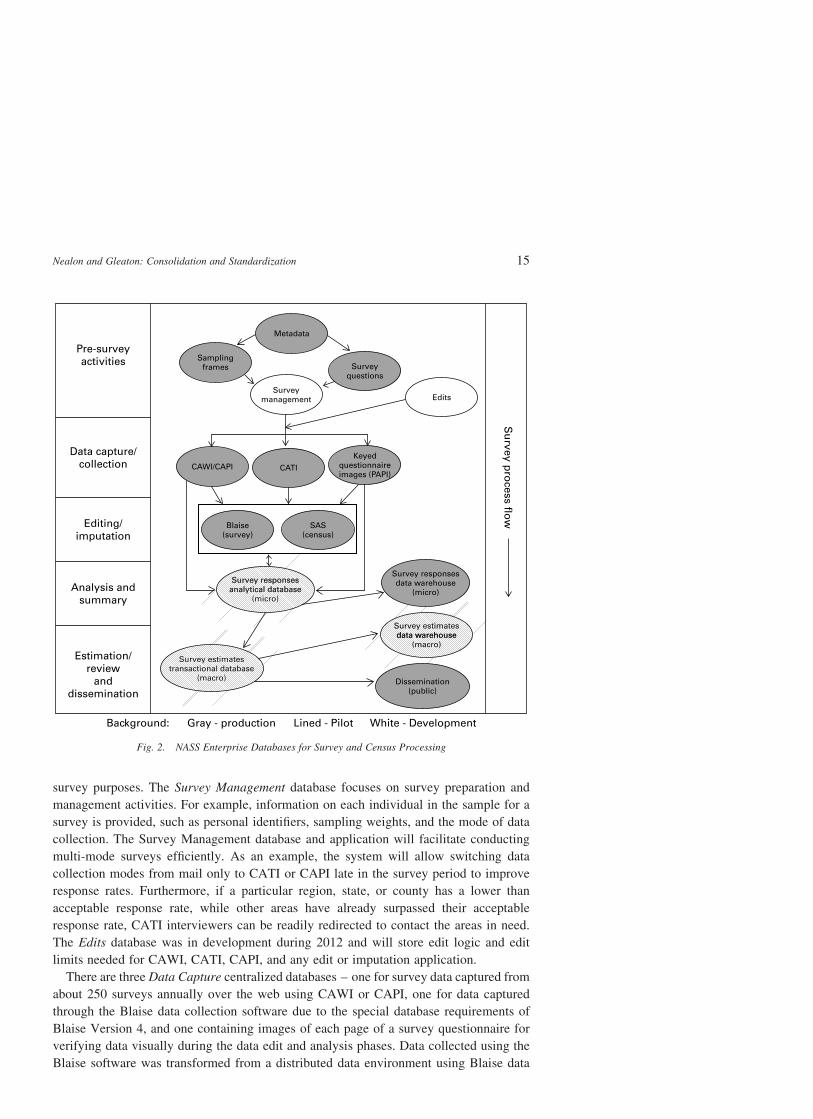
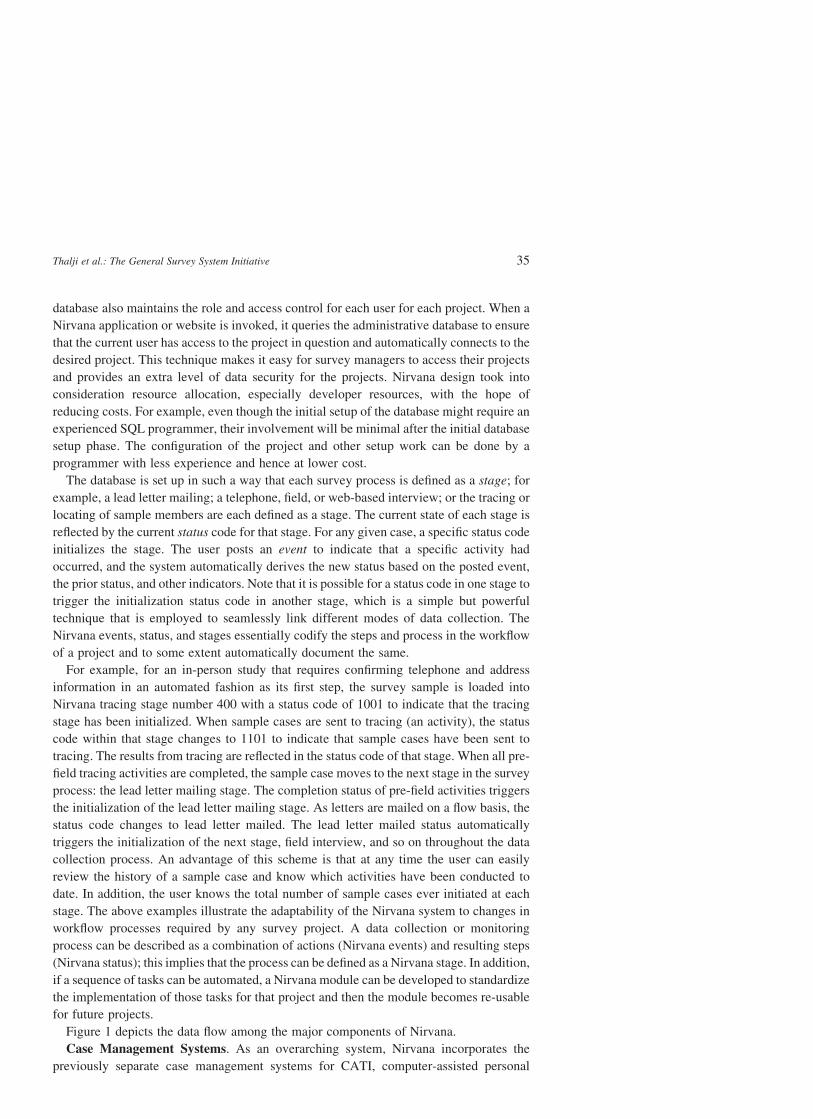
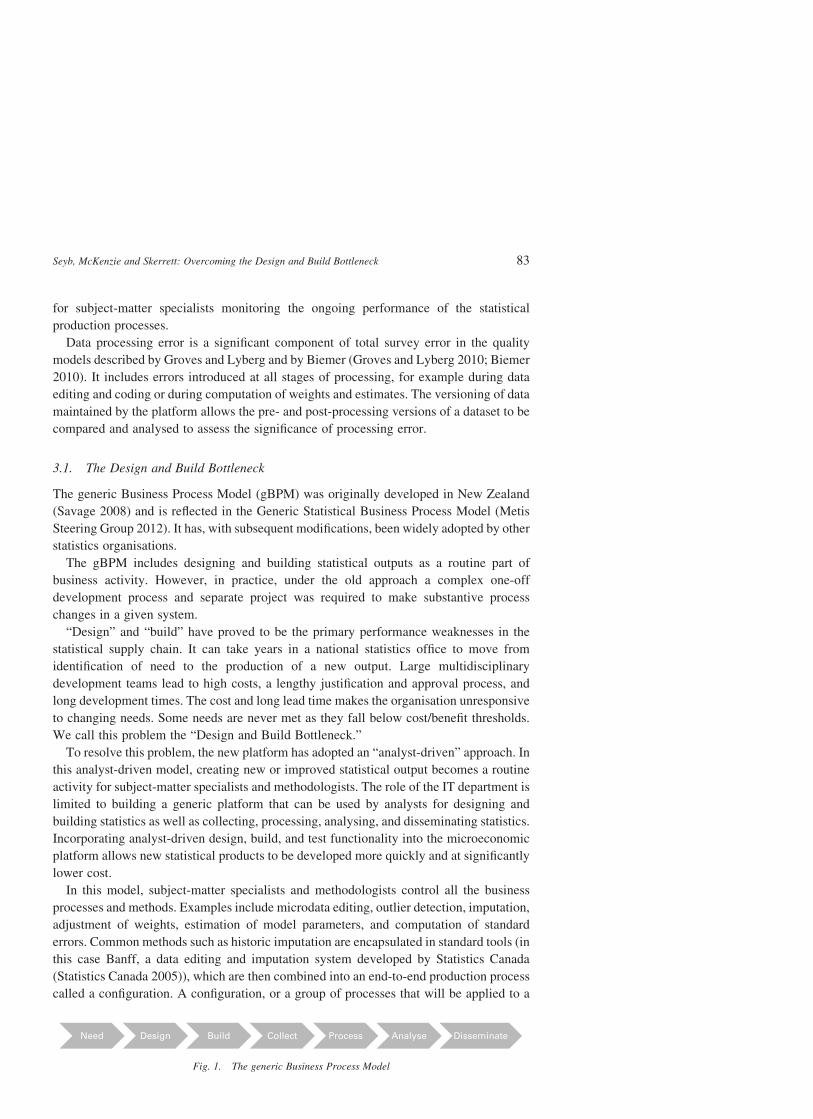
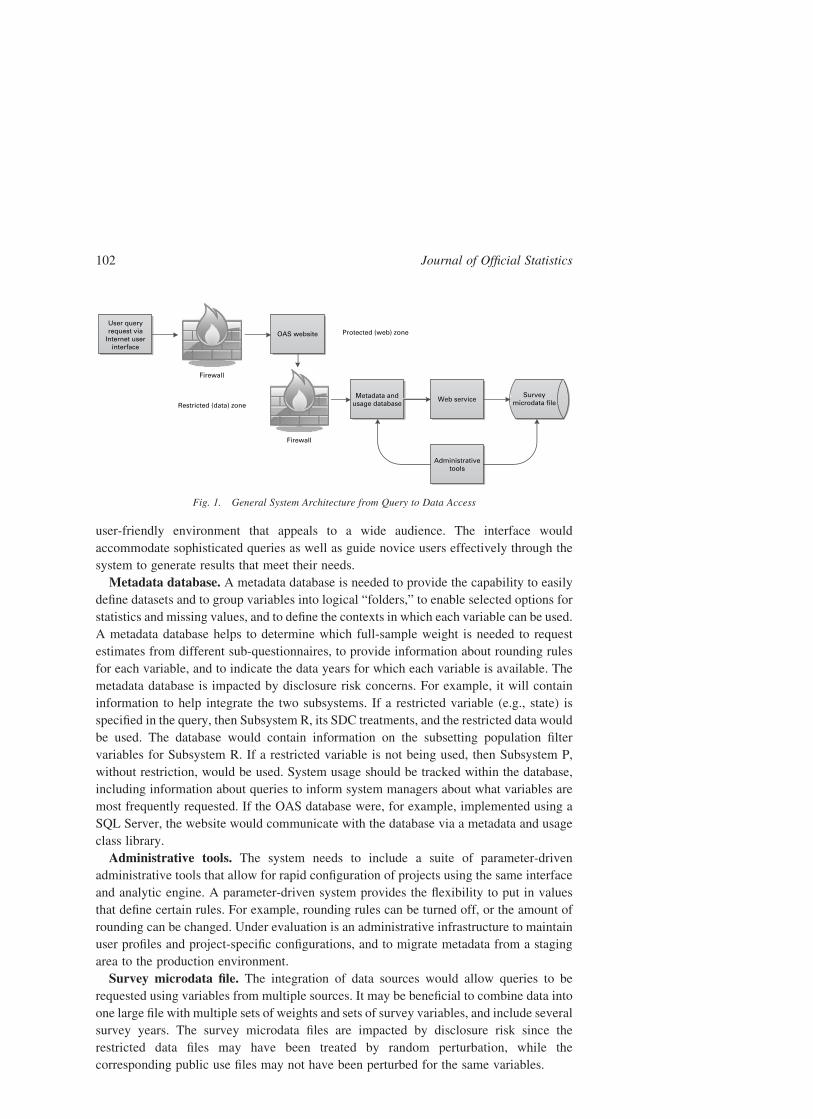
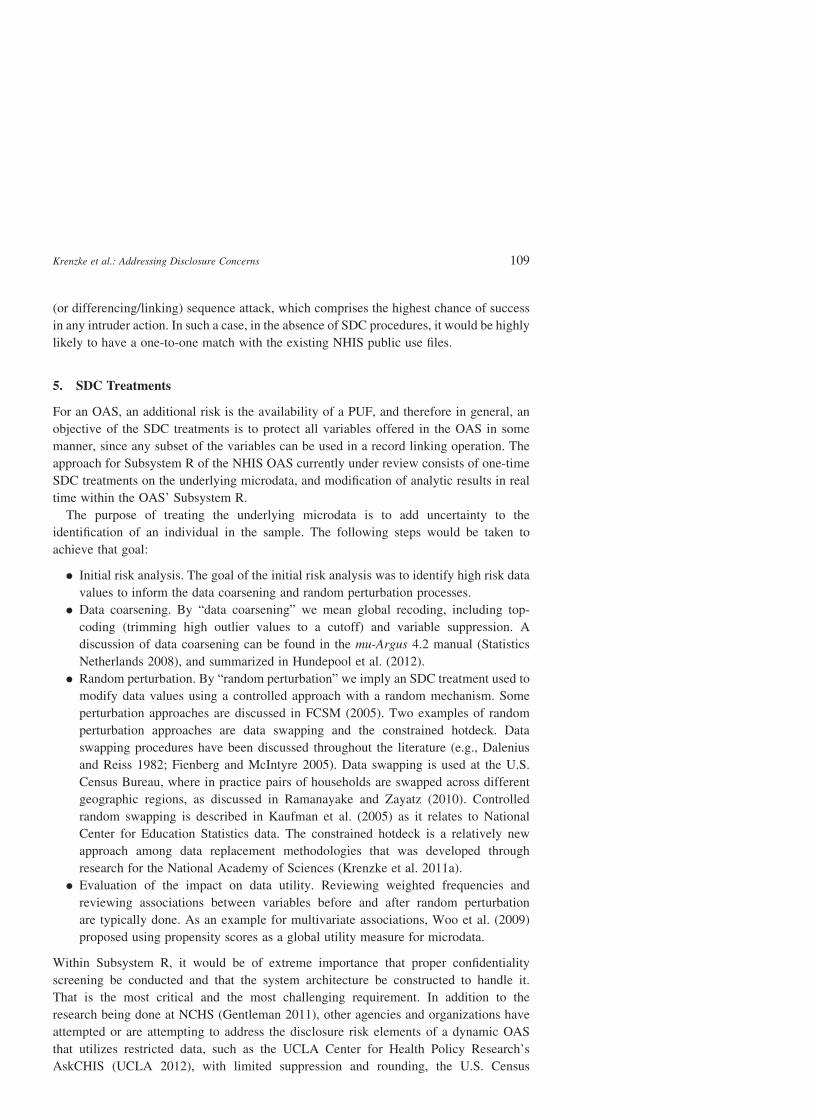
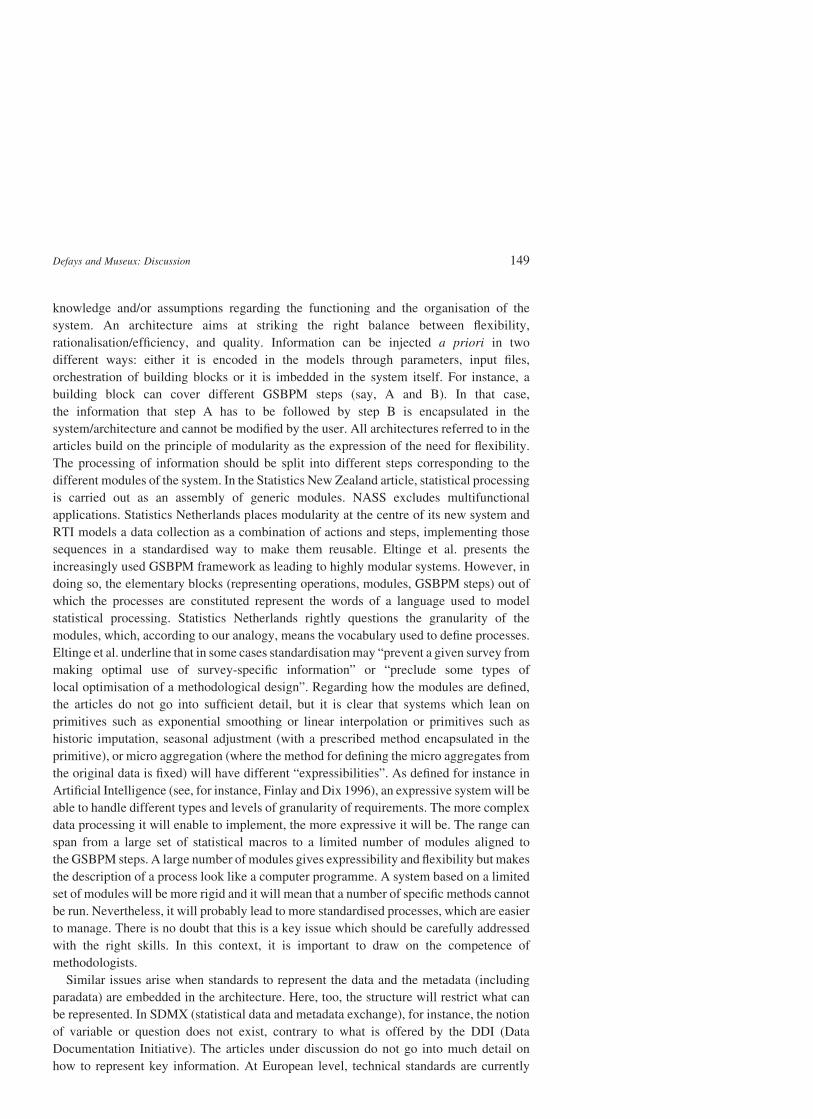
Figure 1 depicts the data flow among the major components of Nirvana.
Case Management Systems. As an overarching system, Nirvana incorporates the
previously separate case management systems for CATI, computer-assisted personal
Thalji et al.: The General Survey System Initiative 35
interviewing (CAPI), and tracing as well as modules that facilitate document mailing and
receipt, e-mail invitations for web-based self-interviewing, biospecimen tracking, and so
on. CATI and CAPI are for managing telephone and field data collection respectively;
tracing is for identifying the best phone number or address for a sample member in a list
survey or for panel maintenance. These case management systems and other modules use
the same underlying tables to access the sample data and to record the paradata on the
status of data collection. In some organizations, these systems use separate databases and
processes that provide status information to a central database or reporting structure, but
with Nirvana, the same database tracks the progress of data collection regardless of the
mode, facilitating a seamless change in data collection mode. The integration of case
management systems reduces programmer labor and minimizes the potential for
processing errors. For example, if a sample member in a mixed-mode survey chooses to
complete the case via the web rather than by CATI, the system will immediately detect
that the survey was completed via the web so that no additional effort is expended in CATI
for that sample member. Programmer involvement is not required to move completed
surveys from one database to another, thereby decreasing the risk of processing errors.
Survey Instruments. The questionnaire development system is used to develop survey
instruments for telephone, field, web, and hard copy paper data collection modes. This
system allows for real time edit and consistency checks. Using the same system to author
the instruments reduces training costs for the specification writers and programmers. This
system provides special interfaces for translation specialists to develop instruments in
other languages, including Spanish and Chinese. The system also facilitates recording of
the questions for audio-computer-assisted self-interviewing instruments as well as mode-
specific variations in question text and/or response options. The metadata for the survey
instruments and survey data are stored in the Nirvana database. This facilitates the
Casemanagement
system
Qualityevaluation
system(QUEST)
Surveyinstrument
Surveydata
analysisfile
Sampledata
Subjectcontact
data
AdaptiveTotal
Design(ATD)
Fig. 1. Nirvana data flow
Journal of Official Statistics36
generation of codebooks to accompany analysis datasets as well as the generation of
reports that can be stratified using key items in the questionnaire data.
Quality Evaluation System (QUEST). This component supports monitoring of
interview quality for telephone or field data collection. QUEST addresses measurement
error through its ability to listen to recorded excerpts of the questionnaire administration
and provide immediate feedback to interviewers. With Nirvana, the QUEST tables are in
the project database, and the results of the review can be easily combined with other
information such as interviewer demographics, their caseload, and item nonresponse to
provide a richer quality control report.
4. GSSI and ATD
Perhaps the most notable outgrowth of the GSSI is the enablement of ATD because this
ties the initiative to the Total Quality Survey Framework that underpins RTI’s approach to
surveys. As described earlier, ATD is a survey management tool that monitors cost,
productivity, and data quality on a real-time basis during data collection. It differs from
electronic reports and quality checks because visual displays (i.e., charts, graphs, and
dashboards) are used to exhibit quantitative information in multiple dimensions, including
over time. ATD provides a snapshot of the progress and quality of a data collection that
reveals deviations from expectations, prior observations, and protocols in a convenient and
accessible way. It is designed to show and compare relationships and changes across data
elements. While there are costs associated with its development and implementation, these
costs can be offset by the reduced risk to data quality, and the ability to ward off problems
that may be expensive to fix (for example, retrieving missing data or replacing interviews
that were fabricated).
ATD is integral to the Total Quality Survey Framework because it exposes survey errors
that are common across studies, as well as specific to a single study design. When survey
errors are identified, survey managers intervene to reallocate resources or address
problems before they become entrenched. For example, survey managers may shift
interviewing resources from one sampling area to another to level response rates, retrain
interviewers to remedy errors in interview administration, introduce changes to the data
collection protocol (such as an alternate mode of data collection or an incentive) to
increase response, or alter CATI programs to correct or prevent measurement or
interviewer errors.
ATD development depended on an integrated system of data collection and
management provided by the GSSI. First, paradata needed to be collected systematically
and stored in a common format to enable adoption across a wide range of surveys; it also
had to be linked to survey data. Data standardization and linkage were essential first steps.
The ATD system was developed from the GSSI to be:
. the monitoring tool for total survey quality.
. the support for data-driven decision making.
. accessible by a wide range of project staff and clients, each with different
informational needs.
. graphical in display but allowing ready access to underlying data and numeric
reports.
Thalji et al.: The General Survey System Initiative 37
. supportive of cross-survey methods research so that metadata could be created and
analyzed to examine patterns across surveys.
. user-friendly and intuitive, giving end users the ability to create custom graphs and
dashboards with minimal programming knowledge.
. accessible on a variety of platforms, including laptops, smartphones, and tablet
computers, and
. affordable.
The ATD system arrays dashboards and charts under five topical headings: (1) production
and cost data, (2) sample status, (3) record of calls data, (4) data quality, and (5) timing.
Information about the interviewers – identification numbers, gender, age, years of
experience, and education – is used to supplement and subset data in these categories,
comparing, for example, the productivity of female interviewers with male interviewers.
Survey managers have the ability to identify and investigate potential problems by
examining related graphs and drilling down to the underlying data itself. Thus it is possible
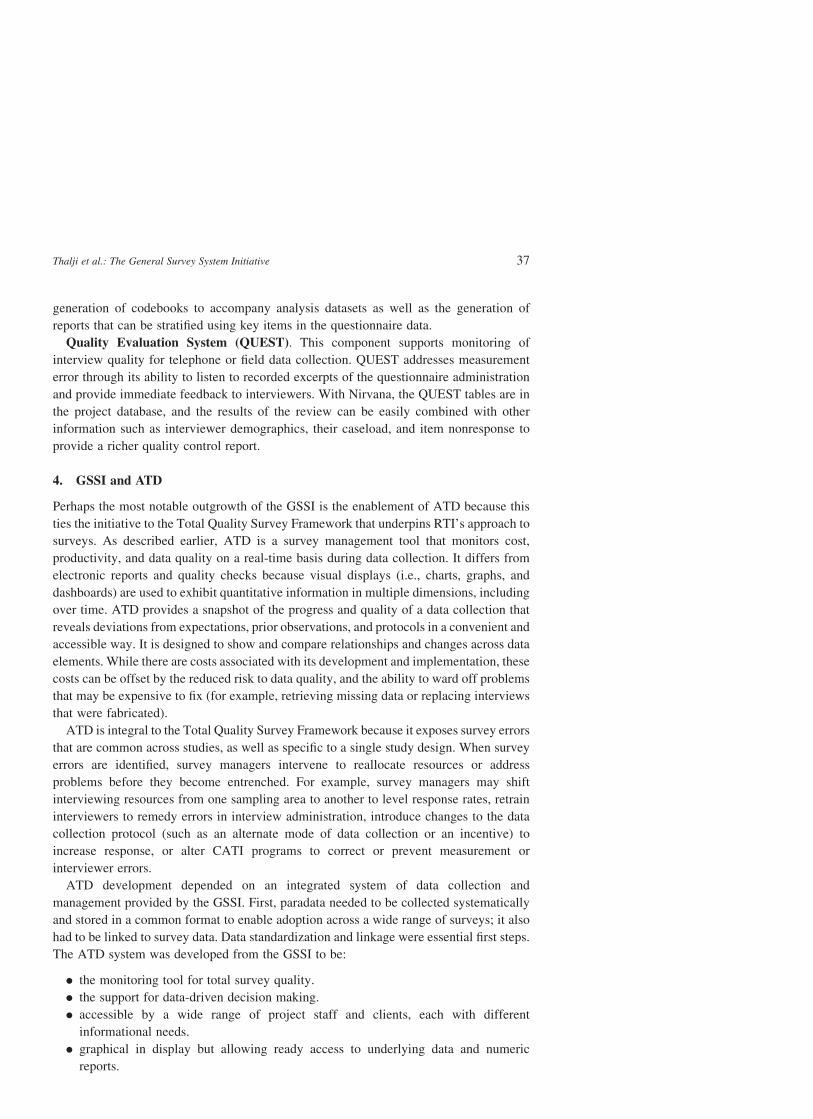
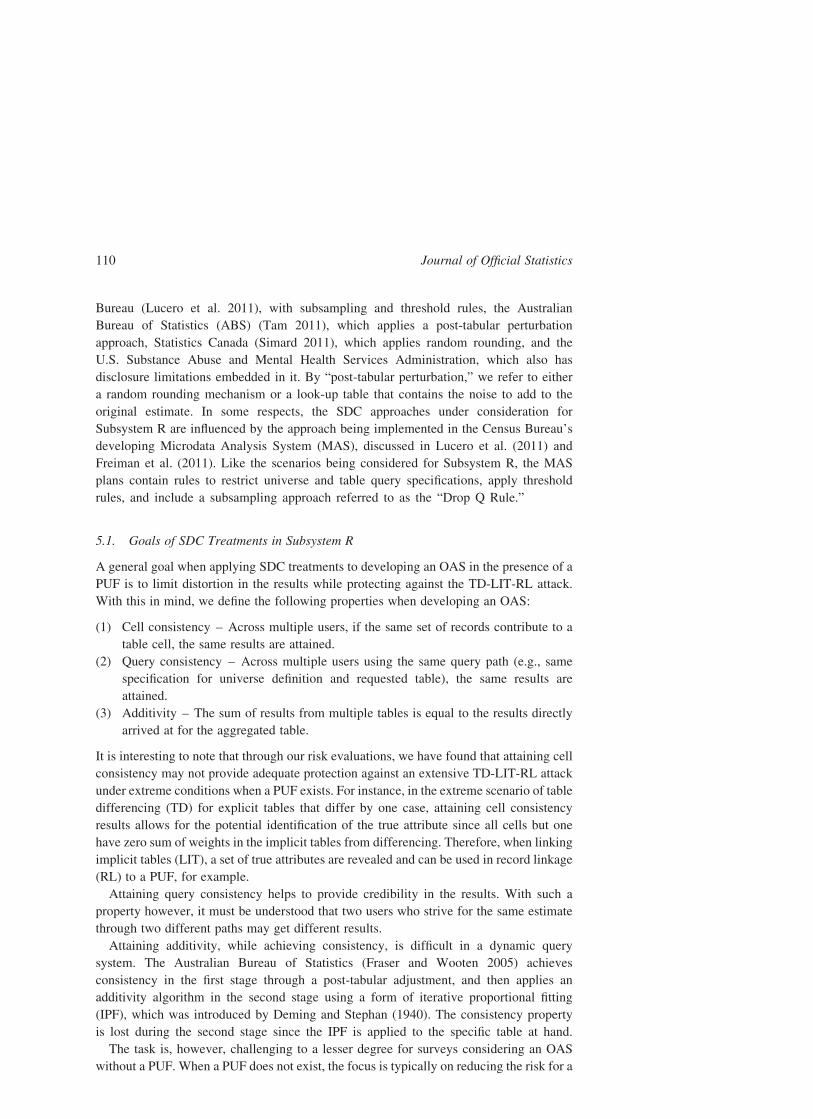
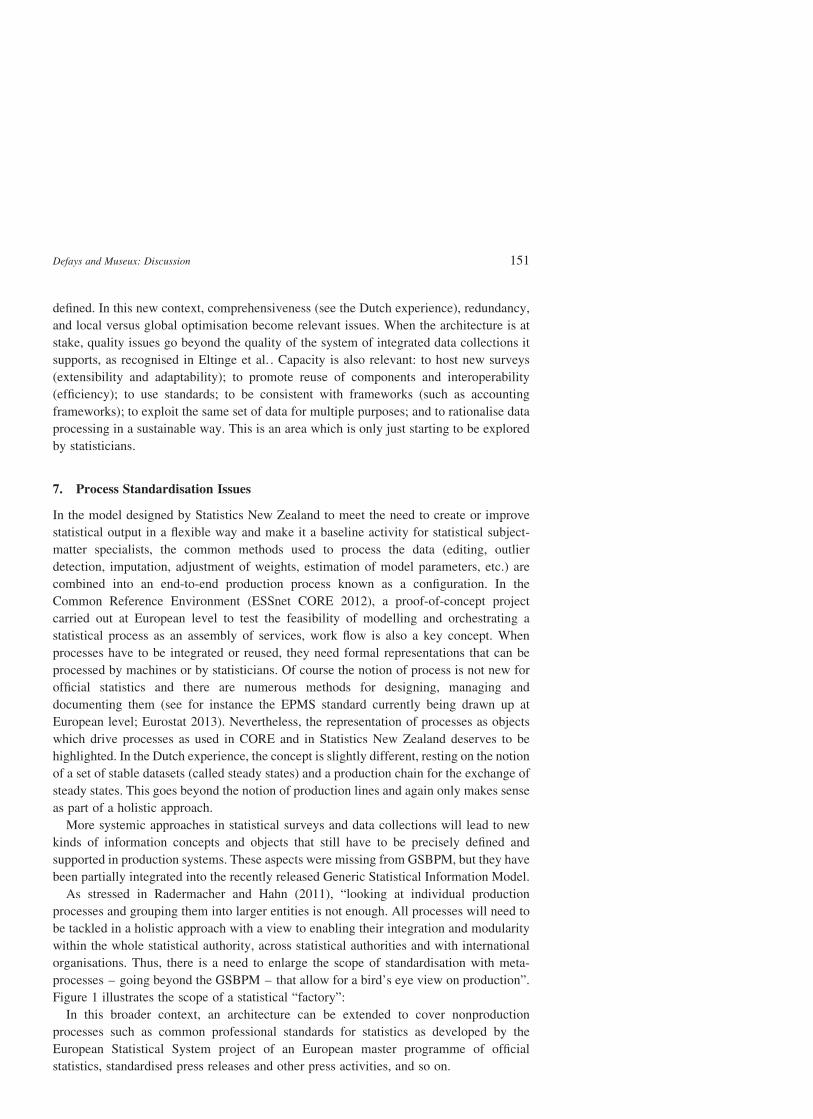
to view survey status and changes in both visual and numeric form. For example, Figure 2
shows the overall mean survey length by day and the interviewers who deviated by more
than 1 standard deviation from the aggregate mean. The chart shows a fairly consistent
length of about 60 minutes with convergence around the mean as the data collection period
lengthens and interviewers gain experience. However, interviewer “Bill” exhibits a pattern
of longer interviews, and interviewer “Cindy” exhibits a pattern of shorter interviews. These
findings merit further investigation. In surveys with sensitive questions, for example, a
longer administration time may mean that the interviewer is dwelling on questions that
make the sample member uncomfortable, potentially leading to an interview break-off or
item refusal. Survey managers have the ability to confirm findings by examining graphs
showing the section timings of sensitive question groupings, as well as the underlying data
showing the number of interviews Bill completed and his tenure as an interviewer. If
the number of completed interviews is small (for example, one per shift) or Bill is
inexperienced, the observed pattern may be anomalous and expected to change over time.
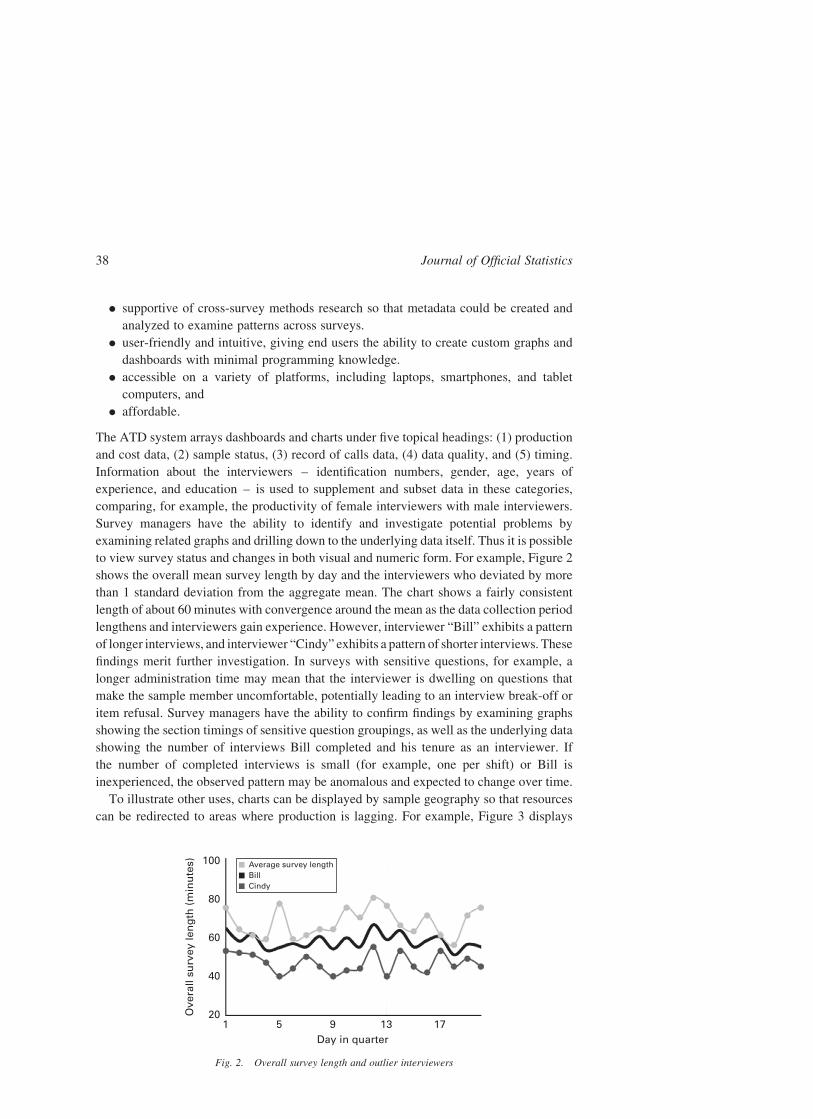
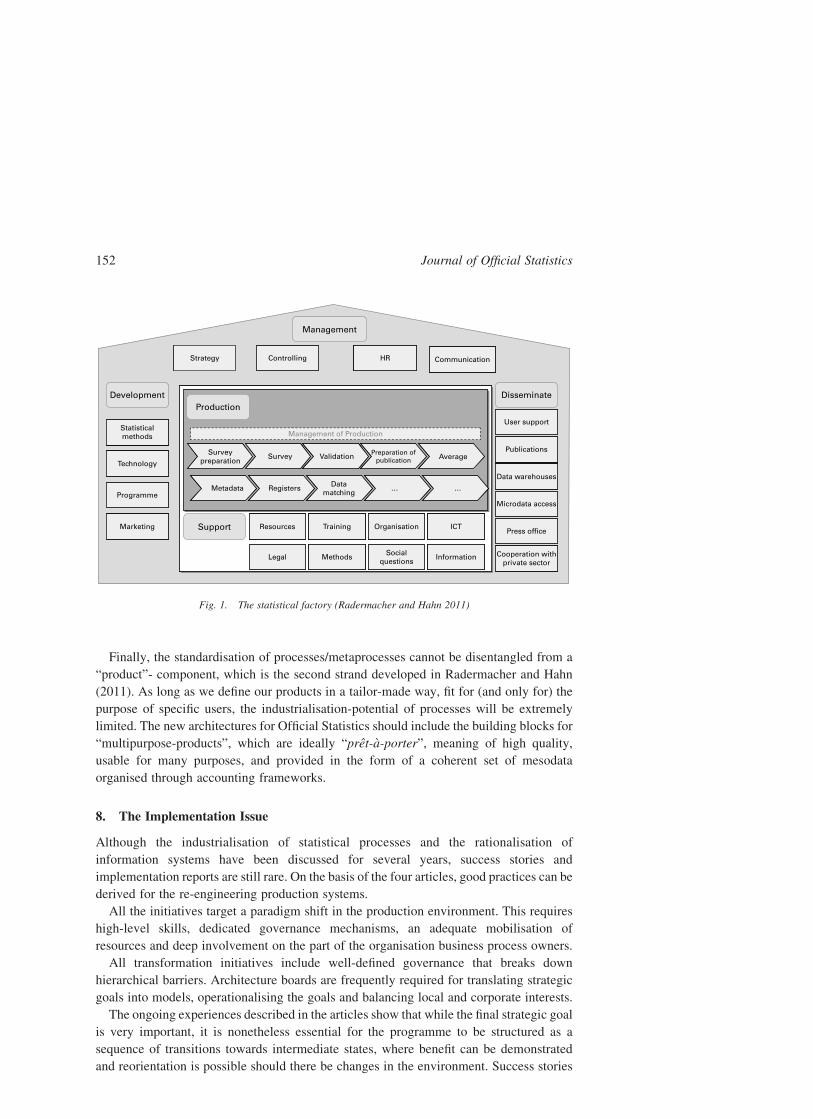
To illustrate other uses, charts can be displayed by sample geography so that resources
can be redirected to areas where production is lagging. For example, Figure 3 displays
100
80
60
40
201 5 9 13 17
Day in quarter
Ove
rall
surv
ey le
ng
th (
min
ute
s) Average survey lengthBillCindy
Fig. 2. Overall survey length and outlier interviewers
Journal of Official Statistics38
a map showing response rates by state for a national field study. Low-responding states can
quickly be identified and investigated. Clusters of low-responding states can also be
observed, indicating potential problems within regions that may be related to staffing or
resources. By moving the cursor over the state, the actual response rate is displayed. As an
enhancement, the percentage point improvement in response from the prior week or month
can also be programmed to display.
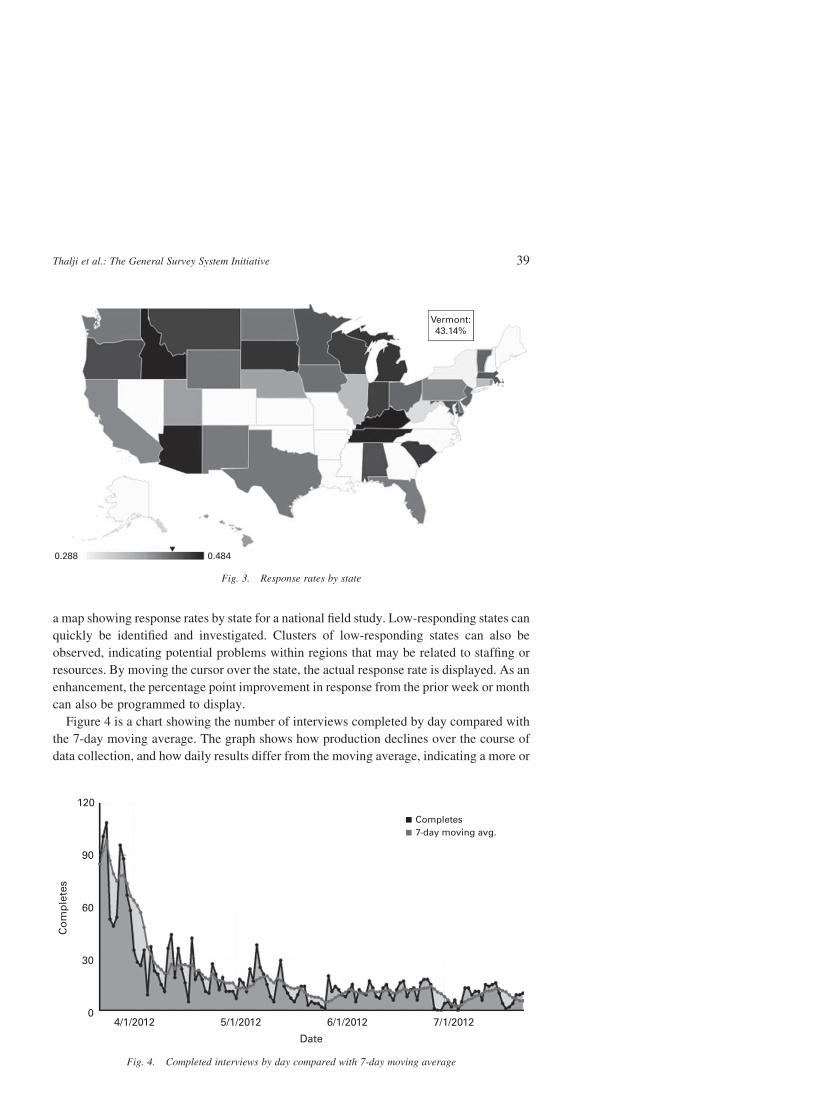
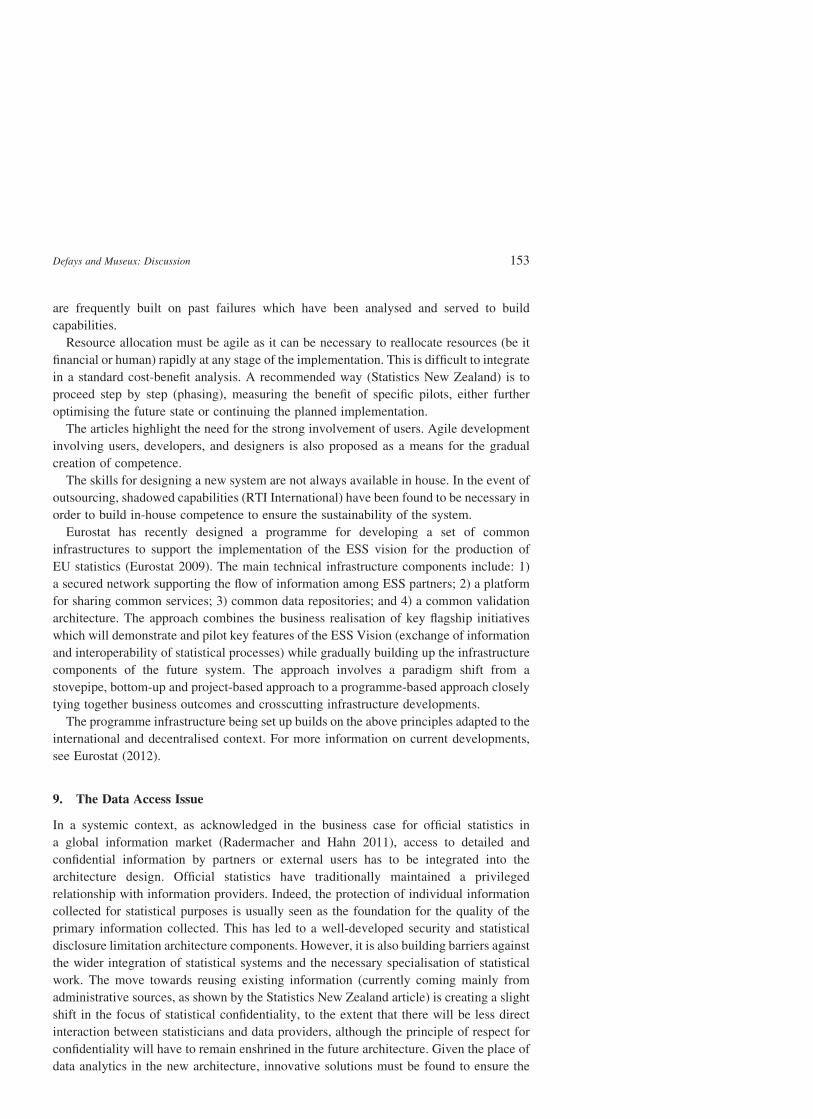
Figure 4 is a chart showing the number of interviews completed by day compared with
the 7-day moving average. The graph shows how production declines over the course of
data collection, and how daily results differ from the moving average, indicating a more or
Vermont:43.14%
0.288 0.484
Fig. 3. Response rates by state
120
90
60
30
0
Co
mp
lete
s
4/1/2012 5/1/2012 6/1/2012 7/1/2012
Date
Completes7-day moving avg.
Fig. 4. Completed interviews by day compared with 7-day moving average
Thalji et al.: The General Survey System Initiative 39
less productive day. Information in this chart can be used to model and predict final
production, and to efficiently plan and staff future rounds of data collection.
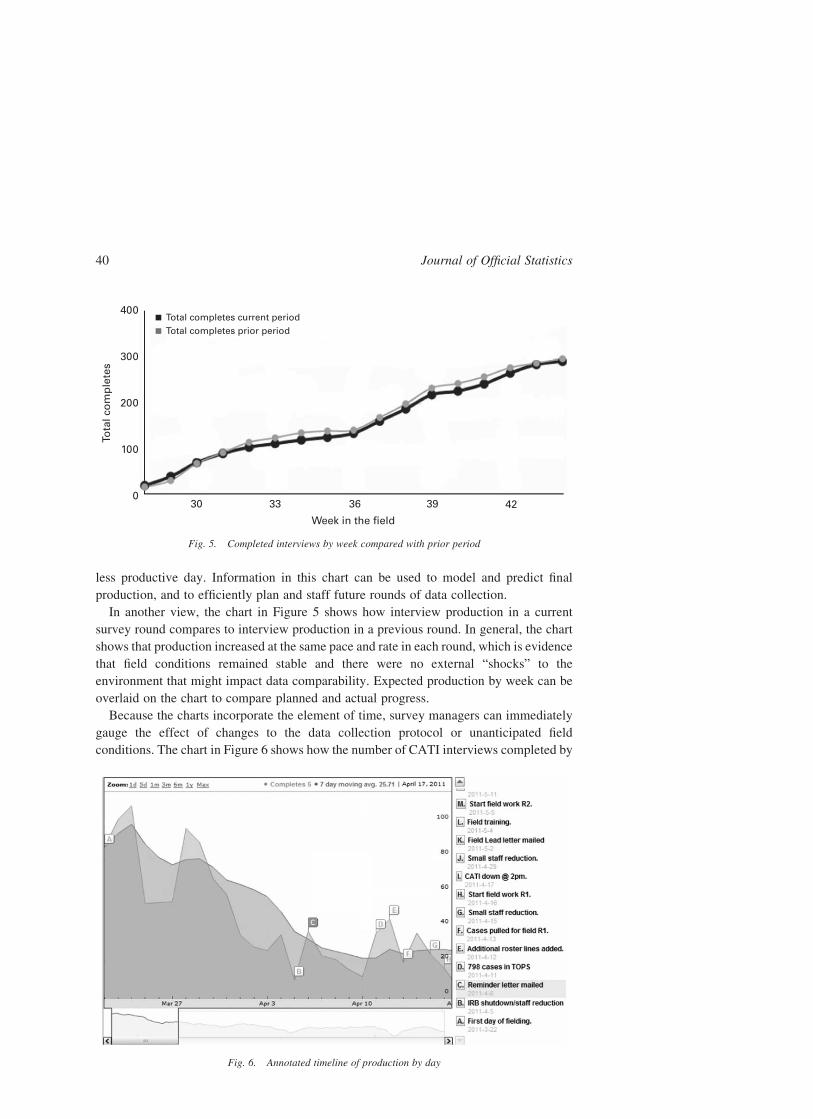
In another view, the chart in Figure 5 shows how interview production in a current
survey round compares to interview production in a previous round. In general, the chart
shows that production increased at the same pace and rate in each round, which is evidence
that field conditions remained stable and there were no external “shocks” to the
environment that might impact data comparability. Expected production by week can be
overlaid on the chart to compare planned and actual progress.
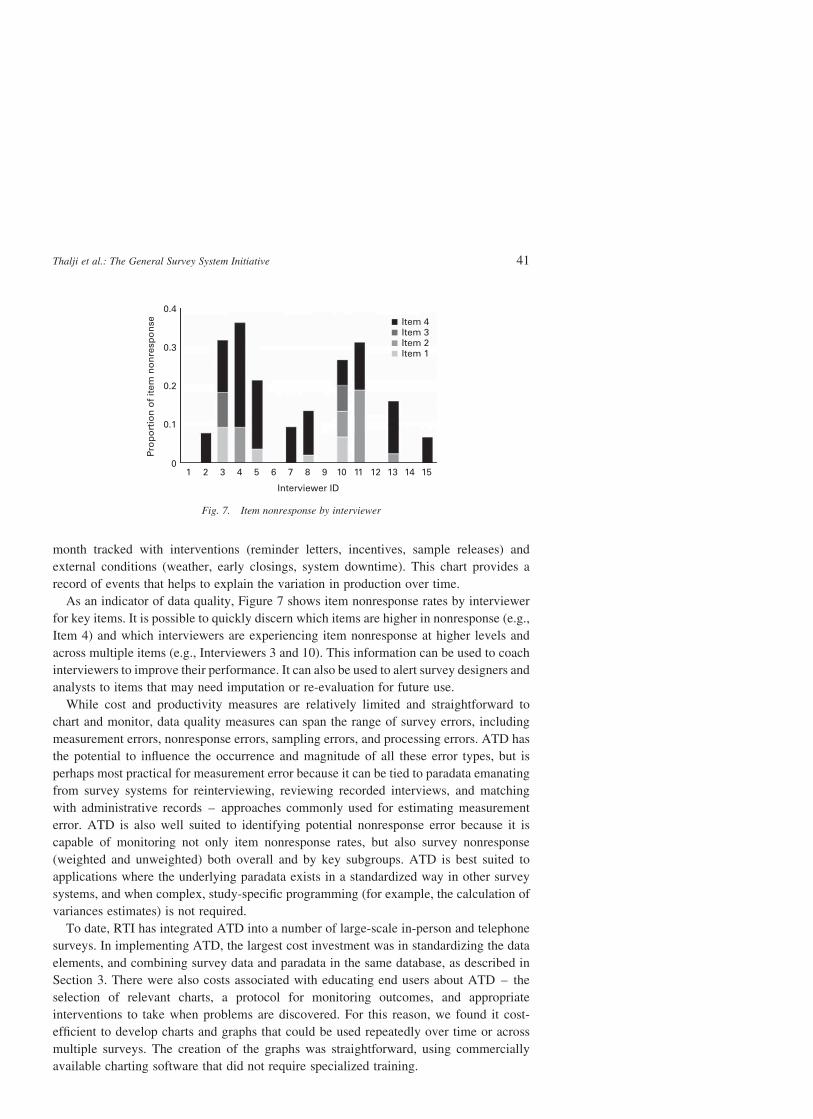
Because the charts incorporate the element of time, survey managers can immediately
gauge the effect of changes to the data collection protocol or unanticipated field
conditions. The chart in Figure 6 shows how the number of CATI interviews completed by
400
300
200
100
030 33 36 39 42
Week in the field
Tota
l co
mp
lete
s
Total completes current periodTotal completes prior period
Fig. 5. Completed interviews by week compared with prior period
Fig. 6. Annotated timeline of production by day
Journal of Official Statistics40
month tracked with interventions (reminder letters, incentives, sample releases) and
external conditions (weather, early closings, system downtime). This chart provides a
record of events that helps to explain the variation in production over time.
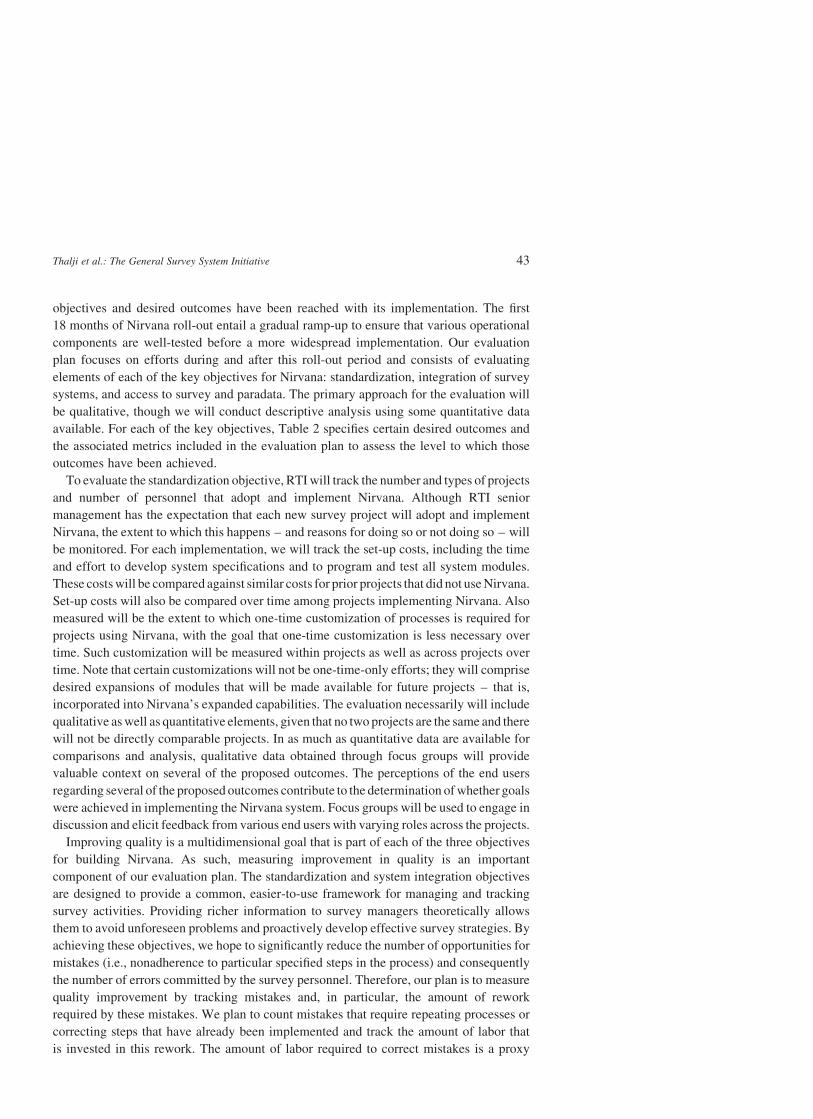
As an indicator of data quality, Figure 7 shows item nonresponse rates by interviewer
for key items. It is possible to quickly discern which items are higher in nonresponse (e.g.,
Item 4) and which interviewers are experiencing item nonresponse at higher levels and
across multiple items (e.g., Interviewers 3 and 10). This information can be used to coach
interviewers to improve their performance. It can also be used to alert survey designers and
analysts to items that may need imputation or re-evaluation for future use.
While cost and productivity measures are relatively limited and straightforward to
chart and monitor, data quality measures can span the range of survey errors, including
measurement errors, nonresponse errors, sampling errors, and processing errors. ATD has
the potential to influence the occurrence and magnitude of all these error types, but is
perhaps most practical for measurement error because it can be tied to paradata emanating
from survey systems for reinterviewing, reviewing recorded interviews, and matching
with administrative records – approaches commonly used for estimating measurement
error. ATD is also well suited to identifying potential nonresponse error because it is
capable of monitoring not only item nonresponse rates, but also survey nonresponse
(weighted and unweighted) both overall and by key subgroups. ATD is best suited to
applications where the underlying paradata exists in a standardized way in other survey
systems, and when complex, study-specific programming (for example, the calculation of
variances estimates) is not required.
To date, RTI has integrated ATD into a number of large-scale in-person and telephone
surveys. In implementing ATD, the largest cost investment was in standardizing the data
elements, and combining survey data and paradata in the same database, as described in
Section 3. There were also costs associated with educating end users about ATD – the
selection of relevant charts, a protocol for monitoring outcomes, and appropriate
interventions to take when problems are discovered. For this reason, we found it cost-
efficient to develop charts and graphs that could be used repeatedly over time or across
multiple surveys. The creation of the graphs was straightforward, using commercially
available charting software that did not require specialized training.
0.4
0.3
0.2
0.1
Pro
po
rtio
n o
f it
em n
on
resp
on
se
10
2 3 4 5 6 7 8 9 10 11 12 13 14 15
Interviewer ID
Item 4Item 3Item 2Item 1
Fig. 7. Item nonresponse by interviewer
Thalji et al.: The General Survey System Initiative 41
5. Implementation and Evaluation of Nirvana
Nirvana has been implemented with a phased approach. A “beta” or pilot version
of Nirvana was implemented in the spring/summer of 2011 in the field test phase of a
repeating cross-sectional education study: the field test of the National Postsecondary
Student Aid Study of 2012 (NPSAS:12) conducted for the National Center for Education
Statistics (NCES). The system was refined during this operational field test and rolled out
on a second project in the summer/fall of 2011: the field test of the Baccalaureate and
Beyond: 2008/12 Longitudinal Study, also conducted for the NCES. The ATD component
was not available for this early evaluation period. Nirvana has been implemented in three
full-scale studies in the first few months of 2012 with two more planned for later in 2012.
NPSAS:12, as a representative example of the projects handled by Nirvana, has multiple
modes of data collection (web, telephone, in-person, paper) with many hierarchically
linked survey participants (postsecondary institutions, students, and parents). The sample
members are selected from school enrollment data and added to the survey on a flow basis.
Survey data are collected over a nine-month period from over 100,000 students and their
families and more than 1,500 postsecondary institutions. Data collection is monitored
across all modes and by multiple subgroups. NPSAS:12 is used as the base year for a
longitudinal study that follows first-time beginning students over time as they continue
their education and work experiences.
The Nirvana system architecture, development environment, and software tools were
finalized in the early stage of the NPSAS:12 field test implementation period. The critical
component of this architecture was the database schema, including the metadata for all of
the database variables. After finalizing the design and the database structure, the team
produced a design document and scheduled a series of discussions with the system
development team to form a common understanding of the technical design. The project
manager established system development and change management protocols and assigned
system modules for development to team members. The GSSI steering committee
approved an implementation schedule with concrete resource requirements.
Although the system design decisions were made early in the implementation process,
the data flow specifications were more difficult to finalize. As described earlier, the
Nirvana system uses a three-tier case status hierarchy (i.e., stage, event, and status) to
define case flow through all survey steps. Developing, standardizing, and mapping the
three-tiered code structure to the American Association for Public Opinion Research codes
was time intensive, but will yield benefits as all projects will report on the same
standardized status codes.
The pilot projects generated a set of user-driven recommendations for enhancements to
Nirvana and its associated data collection processes. The primary system implementation
challenge, as demonstrated in the pilot studies and in later projects, has been to effectively
automate the case flowprotocol. AlthoughNirvana establishes a common case flow protocol,
survey specifications for a particular project invariably require augmentations to the standard
that need to be programmed and tested. As the system is enhanced to support multiple
protocols, less augmentation and adaption is required, and this challenge is mitigated.
Conducting an evaluation of Nirvana is an integral part of our continued development
of the system. An evaluation of the Nirvana system will assess the extent to which the
Journal of Official Statistics42
objectives and desired outcomes have been reached with its implementation. The first
18 months of Nirvana roll-out entail a gradual ramp-up to ensure that various operational
components are well-tested before a more widespread implementation. Our evaluation
plan focuses on efforts during and after this roll-out period and consists of evaluating
elements of each of the key objectives for Nirvana: standardization, integration of survey
systems, and access to survey and paradata. The primary approach for the evaluation will
be qualitative, though we will conduct descriptive analysis using some quantitative data
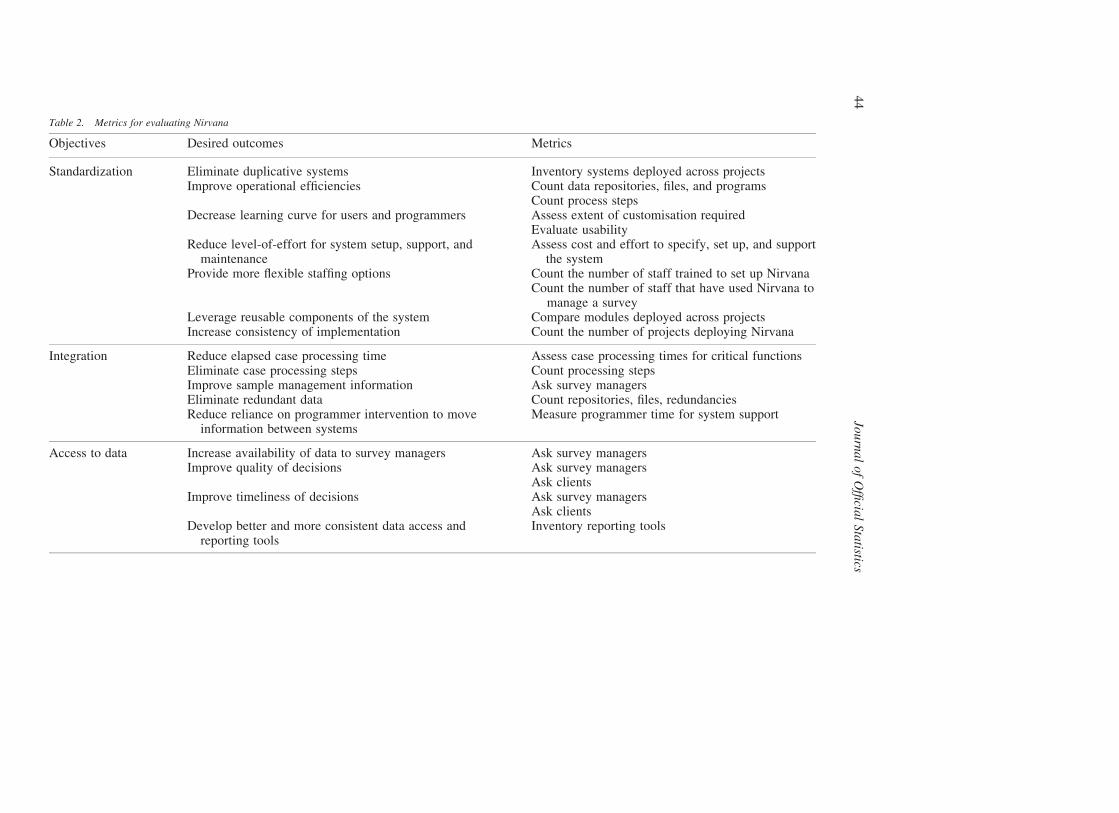
available. For each of the key objectives, Table 2 specifies certain desired outcomes and
the associated metrics included in the evaluation plan to assess the level to which those
outcomes have been achieved.
To evaluate the standardization objective, RTIwill track the number and types of projects
and number of personnel that adopt and implement Nirvana. Although RTI senior
management has the expectation that each new survey project will adopt and implement
Nirvana, the extent to which this happens – and reasons for doing so or not doing so – will
be monitored. For each implementation, we will track the set-up costs, including the time
and effort to develop system specifications and to program and test all system modules.
These costswill be compared against similar costs for prior projects that did not useNirvana.
Set-up costs will also be compared over time among projects implementing Nirvana. Also
measured will be the extent to which one-time customization of processes is required for
projects using Nirvana, with the goal that one-time customization is less necessary over
time. Such customization will be measured within projects as well as across projects over
time. Note that certain customizations will not be one-time-only efforts; they will comprise
desired expansions of modules that will be made available for future projects – that is,
incorporated into Nirvana’s expanded capabilities. The evaluation necessarily will include
qualitative aswell as quantitative elements, given that no two projects are the same and there
will not be directly comparable projects. In as much as quantitative data are available for
comparisons and analysis, qualitative data obtained through focus groups will provide
valuable context on several of the proposed outcomes. The perceptions of the end users
regarding several of the proposed outcomes contribute to the determination ofwhether goals
were achieved in implementing the Nirvana system. Focus groups will be used to engage in
discussion and elicit feedback from various end users with varying roles across the projects.
Improving quality is a multidimensional goal that is part of each of the three objectives
for building Nirvana. As such, measuring improvement in quality is an important
component of our evaluation plan. The standardization and system integration objectives
are designed to provide a common, easier-to-use framework for managing and tracking
survey activities. Providing richer information to survey managers theoretically allows
them to avoid unforeseen problems and proactively develop effective survey strategies. By
achieving these objectives, we hope to significantly reduce the number of opportunities for
mistakes (i.e., nonadherence to particular specified steps in the process) and consequently
the number of errors committed by the survey personnel. Therefore, our plan is to measure
quality improvement by tracking mistakes and, in particular, the amount of rework
required by these mistakes. We plan to count mistakes that require repeating processes or
correcting steps that have already been implemented and track the amount of labor that
is invested in this rework. The amount of labor required to correct mistakes is a proxy
Thalji et al.: The General Survey System Initiative 43
Table 2. Metrics for evaluating Nirvana
Objectives Desired outcomes Metrics
Standardization Eliminate duplicative systems Inventory systems deployed across projectsImprove operational efficiencies Count data repositories, files, and programs
Count process stepsDecrease learning curve for users and programmers Assess extent of customisation required
Evaluate usabilityReduce level-of-effort for system setup, support, and
maintenanceAssess cost and effort to specify, set up, and support
the systemProvide more flexible staffing options Count the number of staff trained to set up Nirvana
Count the number of staff that have used Nirvana tomanage a survey
Leverage reusable components of the system Compare modules deployed across projectsIncrease consistency of implementation Count the number of projects deploying Nirvana
Integration Reduce elapsed case processing time Assess case processing times for critical functionsEliminate case processing steps Count processing stepsImprove sample management information Ask survey managersEliminate redundant data Count repositories, files, redundanciesReduce reliance on programmer intervention to move
information between systemsMeasure programmer time for system support
Access to data Increase availability of data to survey managers Ask survey managersImprove quality of decisions Ask survey managers
Ask clientsImprove timeliness of decisions Ask survey managers
Ask clientsDevelop better and more consistent data access and Inventory reporting tools
reporting tools
JournalofOfficia
lStatistics
44
Listsampling
Listsampling
Example CATI case flowbefore Nirvana
Example CATI case flowwith Nirvana
Link todata
source 1
Controlsystem
Controlsystem
Link tocontact
datasource 1
Link tocontact
datasource 2
Link tocontact
datasource 2
Link tocontact
datasource 1
Load datafor web
instrument
Load datafor web
instrument
Controlsystem
Controlsystem
Controlsystem
CATI
Moveinto CATI Set CATI
parameters
MoveintoCATI
Controlsystem
Tracing= Activity
= Database
= Activity
Nirvana
Nirvana Nirvana
Nirvana Nirvana
NirvanaNirvana
Link to datasource 2
Link todata
source 1
= Database
Moveunlocatedcases totracing
Traceunlocated
cases
Traceunlocated
cases
Movelocatedcases
to CATI
Set timingfor nextaction
Set timingfor nextaction
Studentletter
Studentemail
Studentletter
Studentemail
Link to datasource 2
Controlsystem
Fig. 8. Example process-flow diagrams
Thalji et al.: The General Survey System Initiative 45
measure for the size of the mistake; therefore, with further use of the system we expect to
see a lower mean mistake count and less effort invested to correct mistakes over time.
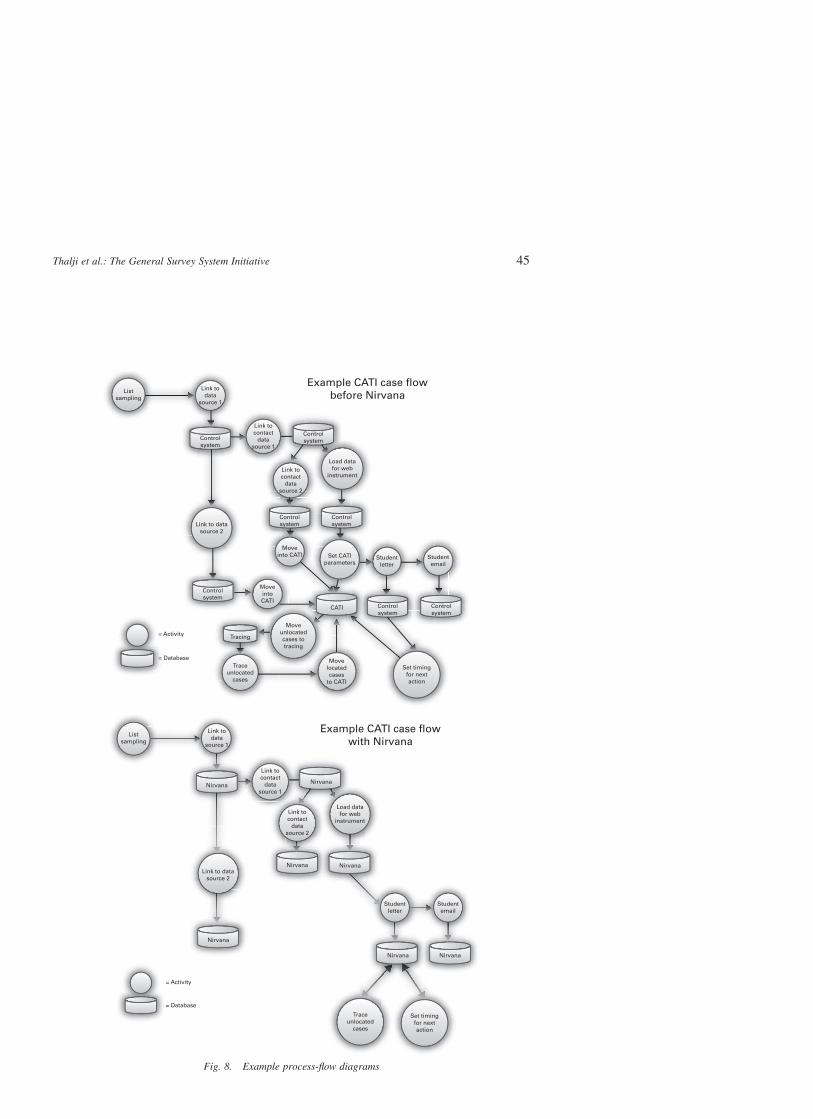
The system integration achieved through Nirvana addresses a number of important
issues: reduction of steps in the process, reduction of the number of opportunities to make
errors, increased efficiency, elimination of redundant data and workaround steps
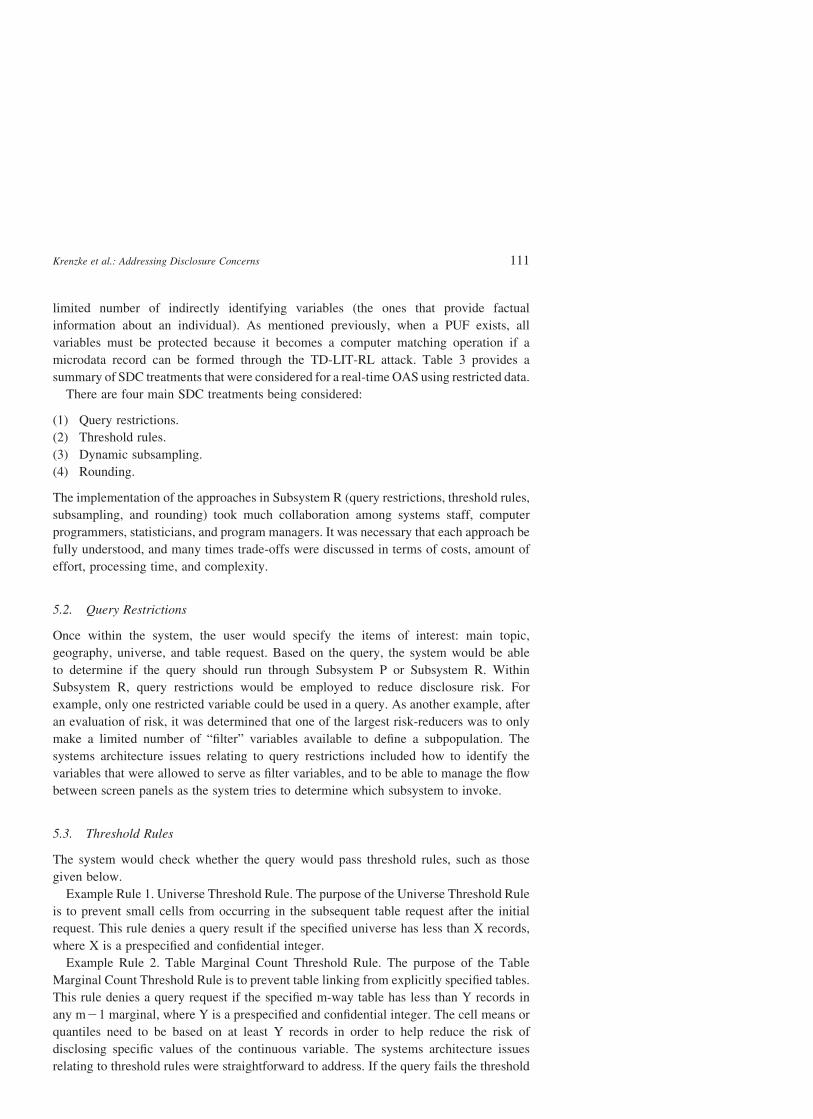
associated with multiple systems, and reduction of programmer intervention. Figure 8
depicts a pair of process-flow diagrams associated with the initiation of CATI data
collection to illustrate this integration.
The first diagram shows the process flow for a portion of the survey process with
pre-Nirvana systems, and the second diagram illustrates the flow for the same activities
with Nirvana. A comparison of the diagrams shows a reduction in the number of activities
withNirvana, from15 to ten. The number of databases has been reduced from three different
databases (control system, CATI, and tracing) to a single database (Nirvana). Duplicative
information has been eliminated, and information is shared across processes rather than
requiring data transfers. The fewer steps and reduction to a single database in turn improve
efficiency and reduce the risk of error associated with data inconsistency and redundancy.
A fundamental objective of Nirvana has been providing access to survey data and
paradata that is easy, direct, and comprehensive for all who need it (e.g., project leaders,
survey managers, data collectors, and programmers). A crucial step in meeting this
objective is the establishment of a shared database across all system components and
processes. Previously, there were multiple databases that had existed with RTI’s data
collection. Having all information across processes (e.g., sampling, mailing, tracing, self-
administered data collection, CATI, and CAPI) in one location enables survey managers to
make decisions in an informed and timely manner due to the availability of trustworthy,
real-time status details. Making such data easy for survey managers to use is a work in
progress with Nirvana. RTI is in the process of adding query and reporting tools to its ATD
framework for Nirvana. To evaluate the success of these tools and access to data for
informed decisionmaking, RTIwill include discussion of these topics in the focus groups of
survey managers, programmers, and project leaders for each of the projects implementing
Nirvana during the 18-month initial phase of implementation. Additionally, a user survey
similar to the system inventory survey will be administered at the end of the same 18-month
phase. An important aspect of this survey will be the extent to which survey managers had
easy, timely access to key information to inform the appropriate next steps and to ensure the
success of their studies.
6. Conclusions
The overarching goal of the GSSI is to improve survey quality by reducing errors and
assisting in the production of relevant, timely, accessible, and cost-effective data. A root
cause analysis was undertaken to better understand the challenges associated with a
custom systems design and development approach to collect and produce accurate study
estimates. This analysis uncovered that the lack of standardization and integration of data
collection systems could result in unintended and undetected survey error. The analysis
further revealed that the tools necessary to access survey and paradata easily and in real
time to manage survey operations were not in place.
Journal of Official Statistics46
The three objectives – standardization, integration of survey systems, and access to
survey data and paradata – were among the key design requirements for developing
Nirvana, a unified data collection and management system. The standardization and
system integration objectives are designed to provide a common easier-to-use framework
for managing survey activities. The access to survey data and paradata objective is
designed to provide direct and uncomplicated access to this information. Together, these
objectives will provide better, timelier, and easier access to data that will enable survey
managers to make more informed decisions regarding survey strategies and avoid more
unforeseen problems. By achieving these objectives, our goal is to significantly reduce the
number of opportunities for error and consequently the number of errors committed.
The Nirvana evaluation plan is designed to measure the extent to which each
objective has been met and survey quality has been improved. Our plan details the
outcomes expected and the process by which we will assess and collect further
information. The plan includes the use of focus groups, surveys, quality improvement
metrics, and cost estimates where feasible. Further enhancements will be made based on
the results of our evaluation plan.
ATD is a noteworthy improvement to the survey process that was made possible by
the integrated system provided by the GSSI. ATD maximizes survey quality by allocating
budget and personnel resources to survey activities depending on priorities and the
potential to reduce total survey error. It has been used to identify interviewers who deviate
from an expected norm, triggering the need for further investigation or retraining. It has
been used to monitor the status of the sample to determine the timing and size of sample
releases. It has been used to monitor item nonresponse rates and response distributions to
key survey variables. ATD has also been used to compare data collection costs with
budgeted costs to identify discrepancies and forecast final costs. For example, in a recent
longitudinal, in-person survey on child health and well-being, ATD charts showed that
labor hours per completed interview were less than budgeted and expected to increase only
slightly through the remaining data collection period. The anticipated cost savings were
used to plan and fund a study on nonresponse bias in the survey estimates. The potential
uses of ATD are plentiful: comparing weighted and unweighted response rates by sample
geography over time, modeling final response rates, tracking indicators of bias, comparing
characteristics of respondents with the sampling frame, identifying interviewer
falsification, and observing the real-time effects of protocol changes such as contacts by
different modes or the offer of incentives.
Together, GSSI and ATD have improved our ability to take advantage of previously
untapped data to improve the quality of survey estimates. While time and resource
intensive to establish, our investment is expected to pay off in terms of reduced costs and
errors over multiple projects, greater operational efficiencies, and enriched information for
decision making.
7. References
Biemer, P. (2010). Total Survey Error: Design, Implementation, and Evaluation. Public
Opinion Quarterly, 74, 1–35.
Thalji et al.: The General Survey System Initiative 47
Biemer, P.P. and Lyberg, L. (2003). Introduction to Survey Quality. New York: John
Wiley & Sons.
Couper, M.P. (1998), Measuring Survey Quality in a CASIC Environment. Invited paper
presented at the Joint Statistical Meetings of the American Statistical Association,
Dallas, TX. Available at: http://www.amstat.org/sections/srms/Proceedings/ (accessed
June 20, 2012)
Curtin, R., Presser, S., and Singer, E. (2005). Changes in Telephone Survey Nonresponse
Over the Past Quarter Century. Public Opinion Quarterly, 69, 87–98.
de Heer, W. (1999). International Response Trends: Results of an International Survey.
Journal of Official Statistics, 15, 129–142.
Groves, R. and Heeringa, S. (2006). Responsive Design for Household Surveys: Tools for
Actively Controlling Survey Errors and Costs. Journal of the Royal Statistical Society
Series A: Statistics in Society, 169, 439–457.
Hunter, D.C, Mitchell, S., Carley-Baxter, L., and Keating, M. (2012). Using Paradata
to Monitor Survey Production, Cost, and Quality within an Adaptive Total Design
Framework. Paper presented at the Federal Committee on Statistical Methodology
Research Conference, Washington, DC. Available at: http://www.fcsm.gov/12papers/
Hunter_2012FCSM_V-C.pdf (accessed June 20, 2012)
Juran, J.M. and Gryna, F.M. (1980). Quality Planning and Analysis: From Product
Development Through Use. New York: McGraw-Hill.
Steeh, C., Kirgis, N., Cannon, B., and DeWitt, J. (2001). Are They Really as Bad as They
Seem? Nonresponse Rates at the End of the Twentieth Century. Journal of Official
Statistics, 17, 227–247.
Tortora, R.D. (2004). Response Trends in a National Random Digit Dial Survey.
Metodolski zvezki, 1, 21–32.
United Nations (1999). Information Systems Architecture for National and International
Statistical Offices – Guidelines and Recommendations. Available at: http://www.
unece.org/stats/documents/information_systems_architecture/1.e.pdf (accessed June
20, 2012)
Received November 2011
Revised June 2012
Accepted October 2012
Journal of Official Statistics48
Redesign of Statistics Production within an ArchitecturalFramework: The Dutch Experience
Peter Struijs1, Astrea Camstra1, Robbert Renssen1, and Barteld Braaksma1
In response to a changing environment, Statistics Netherlands has embarked on a large-scaleredesign of the way statistics are produced. The aim is to increase the capability to respondto changing information demand, to lower the response burden for surveys, especially forbusinesses, and to improve efficiency, while preserving the overall quality level. The redesignis carried out within the framework of a so-called enterprise architecture, which gives overallguidance when structuring the processes of the organisation, including statistical methods andIT tools used. The article describes the redesign approach and explains the main features ofthe architecture. The emphasis is on experiences that may be relevant to other nationalstatistical institutes operating in a similar environment.
Key words: Process design; enterprise architecture; IT expenditure; standardisation; GSBPM.
1. Introduction
The context in which official statistics are produced by national statistical institutes (NSIs)
has profoundly changed in the last decades (Van der Veen 2007). Many NSIs are
experiencing budgetary tightening and political pressure to reduce the administrative
burden of survey participation, especially in the business sector (Ypma and Zeelenberg
2007). At the same time, NSIs are facing an ever-growing demand for statistical
information. This relates to new and changing user needs for relevant statistics, for
example about the financial downturn or immigration, as well as to the timeliness and
amount of detail with which statistics are to be released. In the European Union (EU),
the number of regulations requiring EU member states to produce statistics has multi-
plied in the last two decades, for instance in the area of short-term statistics and annual
business statistics.
In addition, technological advances have resulted in more possibilities for survey and
automated data collection, and administrative registers have increasingly become
available for statistical purposes. The amount of data available for use as input for
statistics has grown significantly and requires integrating different data sources in an
intelligent way.
q Statistics Sweden
1 Statistics Netherlands, Postbus 24500, 2490 HA, Den Haag, The Netherlands. Website www.cbs.nl, for allauthors. Emails: [email protected], [email protected], [email protected], and [email protected], respectively.Acknowledgments: The authors thank Geert Bruinooge, Dirkjan Beukenhorst, Frank Hofman and KeesZeelenberg, Statistics Netherlands, for their contribution to the discussion and their comments on drafts of thearticle. Comments by the guest editors of JOS were especially valuable. The views expressed in this article arethose of the authors and do not necessarily reflect the position of Statistics Netherlands.
Journal of Official Statistics, Vol. 29, No. 1, 2013, pp. 49–71
To meet the challenges of a transforming environment, NSIs will have to adapt the way
in which they produce statistics. This is widely acknowledged (Bae 2010; Braaksma et al.
2013; Doherty 2010; Falorsi et al. 2013; Galvin and Rhodes 2010; Lorenc et al. 2011;
Studman 2010; Swiss Federal Statistical Office 2007). At Statistics Netherlands (SN), the
following key strategic goals have been formulated to guide this transformation:
1. It must be possible to quickly and flexibly respond to changing information demand.
2. The existing high quality standards must be maintained and coherence improved.
3. The reporting burden should be minimal, especially for businesses.
4. The statistical processes must be cost efficient.
Although other NSIs face more or less the same challenges, they may choose to
concentrate on somewhat different strategic goals. The strategic aims themselves are not
the focus of this article, but rather the way in which they can be achieved. Translating the
strategy into the necessary organisational changes is where an enterprise architecture can
be of value.
Briefly, an enterprise architecture can be seen as a general blueprint of how to create an
organisation’s processes and IT infrastructure (Lankhorst 2009). It can serve as a guideline
for the redesign projects that are carried out to bring about the changes as well as for the
management of change. The Generic Statistical Business Process Model (GSBPM) is an
international reference for describing statistical production processes used by NSIs at a
high level (Vale 2009). However, this model only covers part of an enterprise architecture
as it mainly focuses on statistical processes.
This article illustrates how the enterprise architecture developed and used by SN
contributes to realising its strategic goals. SN began developing the architecture in 2004.
The purpose of the article is not to give a historic account, but to identify factors, pitfalls
and practices that may be relevant to other NSIs operating in a similar environment and
facing similar challenges. Obviously, the enterprise architecture has been developed given
a specific context. SN is a centrally organised institute that is responsible for providing
95% of official statistics in the Netherlands. This situation is quite different from that in
other countries where there are several producers of official statistics like ministries and
regional agencies. Institutional independence is guaranteed by law. European statistical
requirements have a serious effect on the work programme of SN: more or less 70% is
determined by European regulations, which are legally binding for the EU member states.
Nevertheless, most key elements of the enterprise architecture – and the architectural
approach itself – are independent of the local context.
We start in Section 2 with arguing for an integral approach to producing statistics,
moving away from the traditional approach of independent, parallel production lines
(sometimes called ‘stovepipes’ or ‘silos’). The integral approach is incorporated in the
enterprise architecture of SN, which is described in Section 3, together with an example of
its application in economic statistics. The section illustrates how the architecture makes
the strategic goals operational. In particular, it shows how the architecture can help to
increase the responsiveness to new information needs and reduce the response burden.
Having an enterprise architecture alone is not sufficient to realise the desired
transformations. An important factor that also contributes to the achievement of the
organisational goals is the standardisation of statistical methods and IT applications
Journal of Official Statistics50
(Braaksma 2009). This is the subject of Section 4. The availability of such standards
enhances the transparency and flexibility of the design of the statistical production process,
thus increasing the potential for reuse and hence reducing costs. Greater transparency in
designing production processes is also expected to result in a better grip on the quality of
the statistical data produced. And it is important to embed the enterprise architecture in the
organisation in order to successfully implement the ensuing redesign programme.
Section 5 describes two organisational arrangements that have been made: a board
for architectural issues and a board for portfolio decisions. Decisions on the enterprise
architecture, on standards and on the implementation of the redesign programme are to be
based on cost-benefit considerations. Section 6 is devoted to this side of applying an
integral approach to statistics. Section 7 summarises our experiences and highlights some
issues to be dealt with in the future, including international cooperation.
2. The Need for an Integral Approach
Traditionally, statistics of most NSIs are typically produced in more or less separate
and autonomous production lines, each having their own methodology and IT systems.
In a nutshell, the conventional way of producing statistics consists of surveying a
sample or census of persons, households, businesses or institutions with a questionnaire,
processing the data using appropriate methodology, compiling tables and explanations,
and publishing results on the underlying population. This way of producing statistical
information places much emphasis on the development of efficient methodology for data
collection, data editing and analysis. Over many years, the accepted statistical methods
and techniques have become increasingly sophisticated.
The changes in the environment in which they operate have prompted NSIs to
re-examine their methodological research programmes (HLG-BAS 2012). In the field of
data collection, the research is now more focussed on the use of administrative registers
and mixed-mode survey strategies, preferably using modes with lower per-unit cost
(e.g., Internet). The new ways of data collection in turn call for advanced estimation
methods for combining data from various sources, or for small areas (domains) where by
design few data points are collected. The ambition to publish statistics more rapidly
or work more efficiently has likewise driven improvements in macro-level editing and
imputation techniques.
However, new and improved methods alone are not sufficient to completely attain the
four strategic goals SN has set for itself, as they leave the traditional approach to producing
statistics intact. There are two main reasons why retaining autonomous production lines
may impede reaching the goals.
First, as independent production lines for statistical products typically have their own
design, customised methodology and IT solutions, they are expensive to develop and
maintain. Adopting a more integral approach to designing statistical production processes
creates opportunities for economies of scale in process design, statistical methods, IT
applications, development, training, and so on.
At SN, the costs of IT maintenance are particularly relevant. A decade ago, the
statistical departments often had their own IT solutions, which were in many cases
maintained locally. In fact, SN still has to deal with a large legacy of IT systems and their
Struijs et al.: Redesign of Statistics Production 51
increasing maintenance costs. The sustainability of such solutions was eventually
questioned. Incidentally, many large organisations face or have faced these problems,
which can be seen as a natural corollary to the exponential growth of IT in the last few
decades (Engelbertink and Vogt 2010).
Second, although the designs of autonomous production lines may be optimised
from a local point of view with respect to certain dimensions such as output quality
and processing costs, there is no incentive to optimise these designs from a corporate
point of view. Especially issues dealing with the coherence of statistics, but also the
reduction of the reporting burden and the reuse of IT solutions should be tackled
companywide. Moreover, autonomous production lines make it difficult to combine and
reuse already available statistical data, which is necessary for a quick response to new
information needs.
Full optimisation is the Holy Grail of so-called total survey design. However, a more
integrated approach to statistics production requires optimising the set of production
lines as a whole, that is, across the whole organisation. Reduction of response burden, for
instance, is possible when the same source data can be used in more than one production
line and, conversely, a specific set of statistical tables may be based on a number of
sources. This leads to an interconnected set of production lines, that is, a network, rather
than the traditional set of autonomous lines. In such a situation, one should ideally aim
at total network design rather than total survey design. The network is optimised for the
same dimensions as is the case when applying total survey design, but the optimisation is
global rather than local. This does not imply that tailor-made production lines have to be
totally banned, only that they have to be subjected to an organisation-wide assessment.
The need to design production lines collectively from a company-wide perspective
calls for an enterprise architecture, which serves to a link pin between the strategic goals at the
level of the organisation with the individual production lines used for producing the statistics.
3. An Outline of the Enterprise Architecture for Statistics Production
When applying an integral approach to statistics production, this does not mean that
everything has to be designed at the same time. Rather, one can begin by putting up a
framework which gives overall guidance when successively redesigning the production
processes of the organisation, in such a way that the strategic goals of the organisation are
met. Such a framework is called an enterprise architecture.
In the enterprise architecture of SN, the strategic goals are translated into a future model
of making statistics as well as a number of principles that underpin this model. Naturally,
this future model provides for the possibility of integrated production processes. It serves
as a reference framework for redesigning statistical production processes and their
supporting IT systems. The reference framework is mandatory in the sense that redesigned
processes have to be consistent with the enterprise architecture on the basis of ‘comply or
explain’. A governance process has been implemented accordingly. This process is
described in Section 5.
Within an enterprise architecture, a distinction can be made between an overall
business and information architecture on the one hand, and a software and infrastructure
architecture on the other hand (Van ’t Wout et al. 2010). The software and infrastructural
Journal of Official Statistics52
needs follow the business and information needs. In this article we focus on the business
and information architecture (Huigen et al. 2006/2009). We will broadly describe the
contents of the architecture as developed by SN, emphasizing its key features. The
architecture will be illustrated by an example in the domain of economic statistics,
showing the added value of this approach.
3.1. Future Model of Making Statistics
The future model of producing statistics is founded on a number of key principles. We
briefly mention the four most important ones.
. Output orientation. SN wishes to publish relevant statistical information of high
quality, tailored to user needs. These needs are leading when (re)designing statistical
production processes within budgetary constraints. This implies that the output
requirements need to be specified at the earliest stages of the redesign. The
specifications include quality requirements. Legal obligations, in many cases
captured in European regulations, are to be met at all times. Other less formal
information needs must be established and formally decided on by SN on the basis of
cost-benefit considerations given the strategic goals.
. Accessibility and comprehensiveness of the statistical information. For users of
statistical information it is important that the information is both accessible and
comprehensive. This is true for external users as well as for staff within SN that make
use of statistical information as input for further processing. The principle not only
implies that the populations, the variables and the reference periods to which the data
relate are clearly defined, but also the quality of the data. The relevant quality
dimensions depend on the use to be made of the information. Such data describing
information is called metadata. When (re)designing a production process, this kind of
metadata needs to be considered explicitly: there is no data without metadata.
Although this may perhaps seem obvious, practice shows that it is often not so easy to
comply with this principle. It also contributes to the strategic goal to improve
coherence.
. Reuse of data and metadata. The policy at SN for data collection stipulates never
to ask for information by questionnaire if that information is available in any
administrative register. Only if it is unavoidable can information be collected directly
from respondents, but even then the information can only be asked for once.
Moreover, the use and reuse of source data and intermediary results by different
internal users not only supports reduction of the reporting burden, but also contributes
to higher cost effectiveness. A prerequisite for reusing data and metadata is that the
available statistical information is accessible to internal users (see previous
principle). Another prerequisite is, of course, that there are no legal obstacles to
reusing data. Fortunately, the Dutch Statistics Act actually promotes the reuse, for
statistical purposes, of data by SN.
. Modular production lines. The future statistical production processes are designed
by making use of customisable standard modules. The resulting production lines are
cost efficient and can be adapted more easily and flexibly to changing information
demand.
Struijs et al.: Redesign of Statistics Production 53
The model and the principles described above hold for all future statistical production
processes of SN. It covers the production of both social statistics and economic statistics.
But up till now, the implementation of production processes according to the enterprise
architecture has focused mainly on the first three principles, as we will see in Subsection
3.3. In Section 4, the consequences of the fourth principle are discussed.
In addition to the four principles, the enterprise architecture is based on three notions
that appeared to be useful in working out the future process model and underlying
principles. These notions are steady state, fixed data interface and chain management.
They have to do with the network aspects of making statistics, mentioned in Section 2.
Statistical production processes are connected to each other when the output of one
process is (re)used as input for another. For instance, data are collected only once and then
reused where needed. But also processed data can be reused, and even disseminated data
are used in a feedback loop when producing data on subsequent periods, or can be further
processed in the context of other statistics. In this sense, the set of production processes
can be seen as constituting a network. An example of such a network is given in
Subsection 3.3.
In order for the output of one production process to be usable as input for another,
this output has to be not only well defined, but also stable. Statistical data sets that
fulfil these requirements are called steady states. They are well defined, that is, the
populations, the variables and the reference periods to which the data relate are clear as
well as the quality of the data. Thus, a steady state consists of statistical data and
the corresponding metadata. The stability concerns their quality. In the current
production lines, the quality of the data is often continuously improved, without clear
standards. To the (internal) users there is much uncertainty about the version to be used as
input for further processing, since there is always a new ‘latest’ version. In the future
production lines this uncertainty is removed. Although a steady state may consist of
different quality versions (for example relating to preliminary and final figures), each
quality version is stable and designed in advance. For short, we will call each quality
version a steady state.
For reuse it is important that the steady states are internally accessible. To that purpose
the enterprise architecture of SN recognises a number of fixed data interfaces. Besides the
(internal) archive function, a data interface facilitates the exchange of steady states
between different production lines, including the metadata concerned. A data interface has
two sides: one side to deliver the statistical data set and one side to retrieve it. The supplier
of the data (supplying production line) delivers and the user of the data (demanding
production line) retrieves. For the physical realisation of the data interfaces, an
organisational unit called the Data Service Centre (DSC) has been created. It archives the
steady states and facilitates the reuse of data and metadata.
The third notion is chain management. It concerns the planning and coordination of the
exchange of steady states between the statistical production lines (Van Delden et al. 2009).
This is distinguished from process management, which is the management within a single
statistical production line with steady states as outcomes. Chain management becomes
more important as the reuse of steady states grows and hence the interdependency between
the statistical production lines increases, that is, when we move further away from
autonomous production lines towards an integrated network.
Journal of Official Statistics54
Figure 1 gives a schematic representation of the ideal to-be situation for the production
of statistics at SN. In the figure a distinction is made between the design of the production
processes (upper layer), the management within and between the production processes
(middle layer) and the implementation of the production processes (lower layer). The
diamond shapes represent activities, while the rectangular shapes represent information
products.
On the right-hand side, the design of the production processes starts by exploring the
information needs. Based on these information needs the steady states including quality
standards, as well as the production processes and methodology are designed, depicted as
‘design data’ and ‘design process’, respectively. Thus, the design is output oriented in
accordance with the first principle, and is restrained by the strategic aims of the
organisation and by policy, in particular budgetary resources. The design of the data
results in the specifications of the steady states. The design of the statistical production
process results in production rules for the modules mentioned in connection with the
fourth principle above. This is elaborated in Section 4. The specifications of the steady
states and the production rules are both called metadata.
The implementation of the statistical production process actually produces the
steady states and consists of working through a series of activities from data collection
through dissemination. Note that the figure does not depict the dynamic nature of the
statistical production process as it is possible to go repeatedly through parts of the process
by reusing data.
Data to be shared among different production lines are exchanged through fixed data
interfaces, symbolized at the bottom of the figure by ‘data (steady states)’.
External users with
information need
Designdata
Designprocess
Metadata
Externalsuppliersof data
Management
Collectdata
Processdata
Disseminatedata
Data (steady states)
Mission, policy and strategic objectives
Fig. 1. (Simplified) model of future production of statistics at SN
Struijs et al.: Redesign of Statistics Production 55
3.2. Applying the Enterprise Architecture in Projects
At SN, redesign of statistical production processes always takes place in the form of
projects. Related redesign projects are brought together under a programme in order to
coordinate the dependencies between the projects and the deployment of resources.
Usually the following disciplines are involved in a redesign project:
. Business analysts and project architects, who design the statistical production
processes, compliant with the business and information architecture.
. Methodologists, who are responsible for sound methodology.
. Information analysts and software architects, who define the (IT-)use cases, the
logical view and the implementation view of the production line to be built,
compliant with the software and infrastructure architecture.
. Software developers and testers, who actually build and test the production lines.
. Statisticians, who are eventually going to use the production lines and who feed the
project with subject-matter knowledge.
When applying the enterprise architecture in actual redesign projects (for an example see
the next subsection), we encountered a number of practical issues. We mention the most
important ones. First, the architecture reflects the corporate interest of SN. Often no local
need to apply the architecture is perceived. Second, the architecture was initially
developed and formulated top-down, without much explanation as to how and why it
should be applied in practical situations. This led to misunderstandings. Third, there is a
need for feedback to those who design the architecture from the level of application – by
various disciplines that are involved in the redesigns projects – in order to get a practical
set of architectural guidelines. These issues are related and show that the top-down
approach has to be balanced with a bottom-up approach.
In order to overcome these issues, a number of measures were taken. One was to form
multidisciplinary project teams consisting of all the disciplines described above, including
explicit involvement of project architects. A second measure concerned the governance
structures that were set up. This is the subject of Section 5, which describes the context in
which redesign projects operate. Feedback information from both operational and strategic
areas has resulted in a number of improvements in the architecture.
3.3. Applying the Enterprise Architecture: an Example
The enterprise architecture has been applied and further elaborated in a programme for
the redesign of economic statistics (Braaksma 2007; Braaksma and Buiten 2012). This
programme ran from 2007 to 2011. It focused on the core of statistics relating to economic
growth, in particular annual business statistics and related short-term turnover statistics,
which are covered by two European regulations: the Structural Business Statistics (SBS)
and the Short Term Statistics (STS) regulation respectively. The system of National
Accounts also fell within its scope. The programme centred on three strategic goals:
increase efficiency2, reduce administrative burden and improve quality.
2 That is, to reduce the related staff by some 20%, from 325 fte to 260 fte.
Journal of Official Statistics56
This redesign programme explicitly followed an integrated approach based on a
comprehensive architecture for the statistics concerned. That is, the compilation of
the different economic statistics is no longer designed as a set of separate production
lines (stovepipes) but rather as an interconnected set of related statistical production
processes. Figure 2 shows the most important statistical production processes and their
interdependencies. In the following we concentrate on the STS part of the programme.
In the context of the STS regulation, SN publishes the period-to-period growth rates
of monthly, quarterly and yearly turnover for four major economic domains: manu-
facturing industry, retail trade, construction and other services (e.g., transport). Turnover
corresponds to market sales in goods and services to third parties. These high-profile
short-term statistics are used to analyse and monitor current economic developments at
both the national and European level.
The STS output data are growth rate indices, which provide information as to how
turnover has risen or fallen compared to the previous period (month or quarter).
Information on the structure of the economy for a specific year is provided by the annual
production statistics based on the SBS regulation. The STS and SBS, in turn, form input
for the National Accounts. For example, the short-term turnover statistics are used as a
source for the compilation of quarterly Gross Domestic Product (GDP) estimates.
Before the redesign, there were coherence problems between the turnover growth
figures produced by STS and those of SBS and National Accounts. The differences were
especially marked for large and complex business units. The coherence problems were
difficult to trace and solve, because the STS and SBS production lines were designed
independently of each other. In the new design, data for the large and complex business
units are collected and processed in a separate production line, generating turnover figures
which STS and SBS are obliged to use. This partly solved the coherence problems.
To further deal with the inconsistencies, the STS turnover figures for the smaller and less
National accounts
SBSSTS
General business register
Large andcomplex business
Yearly figures
Quarterlyfigures
Fig. 2. Dependencies within a set of production lines for economic statistics
Struijs et al.: Redesign of Statistics Production 57
complex business units are used by SBS to calibrate its yearly figures. Furthermore, the
STS figures are now mainly based on value added tax (VAT) data instead of survey data.
Use of the VAT register also added to the reduction of the reporting burden, another
important aim of the redesign.
Central to this way of compiling economic statistics is the General Business Register,
maintained by SN. From this register, population frames are derived once a month and
these are used to delineate the populations of STS, SBS and the large and complex
businesses in a coordinated way. They also provide a central linkage of business units to
administrative units, that is, fiscal units in the VAT register.
The interrelated production lines described above and depicted in Figure 2 were
designed simultaneously in two stages. In the first stage, in line with the architectural
principles, the separate products to be generated by the production lines for STS, SBS,
large and complex businesses and the General Business Register were specified in
detail, including quality requirements and delivery dates. This resulted in properly defined
steady states relating to the different periodic growth figures and the population frames
that could be exchanged according to the agreed delivery dates. In fact, different quality
versions of the steady states were defined. All parties involved, including National
Accounts as a major user of the turnover figures, collaborated in this stage, which can be
seen as a form of chain management by matching demand and supply. In addition,
agreements were made on error handling in the monthly population frame and about
dealing with (too) large differences between the turnover totals of STS based on VAT data
and SBS based on survey data. Note that the new design has not completely eliminated the
inconsistencies between STS and SBS. This first stage corresponds to the component
‘design data’ in Figure 1.
Given these joint agreements on the data to be produced, that is the steady states, the
individual production lines could be further designed relatively independently of each
other in a second stage. In Figure 1, this stage is represented as ‘design process’. If data has
to be exchanged between various users the production lines are ideally connected to a
standard data interface. However, at the time the programme was carried out, this principle
did not have the highest priority. The standard data interfaces, which are realised by the
DSC (see Subsection 3.1 above), were not fully operational. Similarly, the various
production lines were designed as much as possible according to the same pattern, but not
modular. The approach of modular production lines is still in its infancy. In the next
section we will elaborate on this approach.
4. Modular Production Lines and Standardisation
The architectural principle of using standard modules for statistical production lines may
seem obvious, since the reuse of parts of production lines has a high potential for cost
reduction. However, there are a number of complicating factors. First of all, the modules
can be viewed either from a business (process) perspective or from an IT (system)
perspective. These different viewpoints are not always recognised and may cause
miscommunications. In both approaches it is difficult to choose the most useful modules.
Especially for the IT modules, complications become apparent when considering the
degree of parameterisation, performance requirements and integration problems between
Journal of Official Statistics58
modules. Moreover, there is a limit where further standardisation is no longer efficient
in terms of costs or flexibility. We consider achieving optimal standardisation a main
challenge of the redesign programme of SN. We have converged to the following
approach, which starts from a business perspective rather than an IT perspective.
Roughly, when designing a modular production process we find it useful to distinguish
between the design of the ‘know’ and its ‘flow’. The know involves the choice and
specification of the statistical methods, such as imputation methods or estimation methods.
The flow involves the deployment of the know: the process modules in which the
statistical methods are encapsulated, the order of these modules, the decision points that
manage the statistical data through the modules, the triggers to start or end a module,
and the process indicators to manage the flow as a whole. A trigger may be quality driven,
cost driven, time driven or event driven.
Note that the process modules provide the link between the know and the flow.
We will explain this by means of an example. Suppose we have a statistical dataset which
has to be validated and corrected for so-called 1000-errors, such as made by respondents
to surveys who overlook that turnover has to be given in thousands of Euros. In order to
do so, a standard statistical method is to compare the data in this dataset, that have to be
validated and corrected, with reference values. The discrepancy with the reference value
is compared to a norm. If the discrepancy is too high, a correction is carried out. If this is
not the case, the value is retained. Quality indicators are used to indicate the validation or
correction of the data. So the process module has an input value, a reference value and a
discrepancy norm as inputs, and an output value and a quality indicator as outputs for
each data item that has to be processed. The input values are assumed to be available.
A common method to obtain reference values is to take group means. The question is
whether these group means should be determined within the validation module or that
we should define a separate averaging module for obtaining group means; or even
more generically, a module to estimate population means/totals. This example shows
the difficulty of choosing the scope of an individual module and the level of granularity of
the set of modules.
Although statistical methods are a key factor when constructing modules, the
architecture itself does not make methodological choices. Instead, it prescribes the
standard methods that may be used. Recently, the enterprise architecture of SN has been
complemented by a series of standard methods. This series can be seen as a catalogue
of validated and approved statistical methods, presently used at SN, that can assist in
the design of a production process. By using only approved methods included in the series,
the quality of the output of a production process can be better substantiated. A first version
of the series was completed in 2010, and will be updated at regular intervals with new and
improved methods. For example, a method to validate and correct 1000-errors is described
in this series.
The process modules described above are the natural starting point to define IT
modules. These IT modules do not necessarily correspond one-to-one to the process
modules. Because of performance reasons, IT modules may consist of more than one
process module. If process modules are commonly used together in statistical production
processes, this may be taken into account when building IT modules.
Struijs et al.: Redesign of Statistics Production 59
An important consequence of the modular approach is that IT modules should be rule
based. Standard methods, and the process modules that use them, can involve complex
parameterisation (or specification). We call an IT module rule based if its control
parameters can be specified by non-IT specialists (for example subject-matter specialists
or methodologists) by means of an easily accessible interface, without need to change the
internal code of the IT module itself. The extent to which an IT module should be rule
based is an implementation choice, and touches on the issue of local and global interests.
This choice depends on implementation costs, maintenance costs and the expected need to
adjust the specifications. In general, the implementation costs will rise as the IT module is
more rule based. Similarly, the costs for specification of rules will rise. But on the other
hand, the more generic rule-based IT modules can be used in more different statistical
production lines.
A key issue to consider is interoperability. When putting together different IT modules
into a single statistical production line, one might encounter a problem of integration
because the IT modules speak different languages and do not fit seamlessly together.
This requires either a conversion effort between IT modules or a standardised exchange
format (‘plug and play’).
In order to facilitate the (re)design of statistical production processes, one could
consider developing a library of standard process modules. A number of potential
candidates is currently being identified and described (Camstra and Renssen 2011).
In addition to this library of standard process modules, one may also consider a library
of standard IT modules. These IT modules are linked to the process modules, are rule
based and are interoperable. The IT modules can be exploited to quickly and efficiently
design and build a rule-based modular production line. By adjusting the rule-
based specifications, it would be possible to quickly and flexibly respond to changing
information demand.
To give an example, SN has recently developed an IT module for macro editing
(Ossen et al. 2011). The main feature of this module is to validate statistical data at an
aggregate level and if desirable to zoom in and edit the data at the micro level. This module
is flexible in the sense that users can specify their own levels of aggregation for different
types of units. As a policy, the degree of flexibility of an IT module should be such that
it is applicable in at least two statistical production processes. This is also the minimum
rate for developing a standard IT module. The idea is that other statistical production
processes will follow. Naturally, this is stimulated during the redesign projects. Currently,
one year after the release of the IT module for output validation, it has been successfully
integrated in four statistical production processes including the redesign of economic
statistics described above.
We conclude that we have not solved the standardisation challenge yet, but we have
made progress. Statistical methods are standardised and reused. A library of standard
process modules is under development. But we do not yet have a library of standard IT
modules, nor do we have rules to balance costs, flexibility to accommodate changes in
available input or required output, and other aspects that are relevant when pursuing
standardisation. This means that in practice judgmental choices have to be made when
redesigning statistical production processes. For this, SN has put a governance structure
into place. This is the subject of the next section.
Journal of Official Statistics60
5. Governance and Organisation
When embarking on a redesign of multiple statistical production processes, several aspects
are relevant from a managerial perspective:
. managing the portfolio of redesign projects.
. managing individual redesign projects.
. managing the enterprise architecture.
This implies a need for specific governance provisions. These provisions have to ensure
that the projects are correctly prioritised and that they are efficiently executed in
compliance with architectural requirements, which in turn have to reflect the strategic
goals. They have to be tuned to the existing organisation, within budgetary constraints and
taking into account the organisational culture.
In order to manage the portfolio of redesign projects and to manage the enterprise
architecture as such, two central boards have been created, the Central Portfolio Board (in
Dutch: CPR) and the Central Architecture Board (CAB), respectively. In the following
subsections, the governing and organisational arrangements are described, including these
two boards.
5.1. Portfolio Management
For the prioritisation of projects at the level of SN as a whole, the CPR has been
established. It is chaired by the Chief Information Officer (CIO) of SN; all internal
stakeholders are represented at strategic management level.
The CPR decides on the actual redesign programme at corporate level, by selecting
which projects are to be executed from the proposals submitted by the various business
units (who also have their own portfolio boards). Portfolio decisions are taken in the light
of strategic goals, and on the basis of business cases that are provided with each redesign
proposal. A business case is a comprehensive assessment of all current and future costs
and benefits; this is further explained in the next section.
The CPR also allocates resources, in particular concerning IT services, statistical
methodology, process development, and project management. The CPR does not actively
pursue a multi-annual plan of controlled redesign of all statistical processes. Rather,
business units provide requests that have been prioritised by their own portfolio boards.
5.2. Managing Individual Redesign Projects
Once the projects have been prioritised, they are executed following the well-known
Prince2 project management method (Office of Government Commerce 2009). This
method ensures that stakeholders’ interests are systematically taken into account. For each
project a steering committee is established, in which the following main roles are
distinguished (note that a steering committee member may have several roles at once):
. Executive
. User
. Supplier.
Struijs et al.: Redesign of Statistics Production 61
The executive is usually the owner of the statistical production process to be redesigned.
The executive chairs the steering committee and is responsible for the realisation of the
project. The users have an interest in the deliverables of the project. For instance, they may
be involved in carrying out the statistical production process concerned or make use of its
output. The suppliers provide the resources necessary for the redesign project as described
in Subsection 3.2. The Prince2 project management method provides for a solution
mechanism for situations in which stakeholders disagree.
The use of Prince2 in itself does not guarantee that the results of the projects are in line
with the strategic goals of SN as incorporated in the enterprise architecture. In fact, as
is the case with any enterprise architecture, compliance issues have to be dealt with
(Foorthuis 2012). Therefore, in addition to the use of the Prince2 method, there are a
number of compliance requirements to which projects have to conform. These
requirements stem from the architectural framework as described in Subsection 3.1 and
take the shape of templates (BAD, MAD, SAD, refering to business, methodology and
software, respectively; Hofman 2011) describing the main aspects of the redesigned
statistical production process. These aspects are the output data of the production
process, the data to be used as input, the methodology used, the process flow and the
IT landscape. In effect, the templates provide guidance for applying the enterprise
architecture in projects.
Once the redesigned production process is described according to the templates, it is
reviewed. For this, a review procedure has been implemented (Foorthuis et al. 2009).
5.3. Managing Architectural Issues
Evidently, the enterprise architecture as such has to be managed. That is, formal decisions
have to be taken on its contents and scope. Of course, managing the enterprise architecture
also implies change management.
As mentioned in Section 3, in the enterprise architecture the strategic goals are
translated into a future model of producing statistics, as well as a number of principles that
underpin this model. Decision making on the architecture thus involves making explicit
choices on how to interpret the strategic goals and make them operational. This includes
making choices on what aspects of producing statistics to incorporate in the architecture.
For instance, are the methods series or the set of standard IT tools to be included in the
architecture? It also includes making choices regarding the balance between local and
corporate interests. This is particularly important, since the architecture is a reference
framework for the individual redesign projects. Stakeholders in the strategic goals of SN
are not systematically represented in the steering committees of these projects, but their
interests are served by the templates (BAD, MAD, SAD) to be used by each project.
It is important to emphasise that the enterprise architecture is a point on the horizon. It
is a blueprint of the desired future situation regarding the organisation’s processes and
IT. As a consequence, decisions have to be taken concerning the trajectory to be
followed in order to approach that point on the horizon. This gives rise to issues such as
the question of what architectural principles deserve priority and the extent to which
compliance with the architecture has to be enforced, in particular if services such as the
DSC are not fully operational yet and the set of standard IT tools and modules is still
Journal of Official Statistics62
being developed. In fact, the management of such ‘libraries of standards’ is itself an
issue. And again, the choices to be made have to take into account both legitimate local
and corporate interests.
The Central Architecture Board (CAB) has been created to address all architectural
policy questions mentioned above. It is the board where architectural principles are
prioritised and compliance issues discussed. The templates used in the redesign projects
are formally approved by the CAB. It also advises on the set of standard IT tools,
mentioned in Section 4. At SN, decisions on IT issues are not taken by a corporate IT
board, as is done in some other countries; SN does not have such a board. The reason for
this is that IT is seen as the solution to business issues. These have to be solved in
accordance with the enterprise architecture, of which the IT architecture is a part. This
makes the CAB an appropriate board to discuss strategic IT issues (Hofman and Van der
Loo 2011).
The CAB is an advisory body of the Board of Directors and is chaired by the head of the
CIO office of SN. All stakeholders, either with local or corporate interests, are represented
at tactical management level. In fact, the CAB is one of the places where the tension
between local and corporate interests can be addressed: those carrying the costs of
complying with the architecture in individual redesign projects meet with those in charge
of the realisation of strategic objectives, such as the reduction of the overall administrative
burden to business or cost reduction through software standardisation. The CAB has
proved to be instrumental in obtaining support for the approach to redesigning statistical
production processes under architecture.
The role of cost-benefit considerations in the decision making of the CAB is discussed
in the next section.
6. Cost-Benefit Considerations
As explained in the previous sections, the four strategic goals of SN are advanced
by applying an enterprise architecture, promoting standardisation and implementing
organisational provisions for managing redesign projects. However, the goal of cost
efficiency is only reached if cost-benefit considerations are correctly taken into account
when taking decisions, of course. We look at cost-benefit considerations first for the
architecture, then for deciding on standardisation, and finally for project decisions on
individual (re)design projects in the context of portfolio management.
The decision to start redesigning statistical production processes based on an enterprise
architecture was strategic. Preparations were started in cooperation with an external
partner, resulting in a so-called ICT Masterplan (Deloitte and Statistics Netherlands 2005;
Ypma and Zeelenberg 2007), which envisaged an architecture for SN as a whole, the
redesign of virtually all statistics under this architecture and central provisions for its
implementation. The plan was not based on a detailed, quantitative, enumeration
of costs and benefits through time, allowing an analysis of return on investment.
Rather, preliminary studies by the external partner showed the strategic necessity to
embark on the redesign of statistical production processes within an architectural
framework. Basically, these studies provided the reasons for applying an integral
approach, as described in Section 2. One of the supporting observations made was that
Struijs et al.: Redesign of Statistics Production 63
most large information processing organisations have had similar experiences to those of
SN: a proliferation of software tools at the end of last century, followed by a drive for
standardisation.
The fact that the decision to develop and apply an enterprise architecture was based on
strategic considerations and perceived logic rather than a detailed insight into costs and
benefits does not mean that subsequent investment decisions cannot be based on cost-
benefit analyses. On the contrary, where possible, this should be done. Once the
architecture is in place, two types of investment decisions can be distinguished: the
decision to develop a standard process or IT module or tool, for instance for data editing,
and the decision to redesign a specific statistical production process or set of processes
within a common architectural framework. These two types of decision are intertwined.
The benefits of a standard IT tool or module will increase with each process that is
redesigned to use it, and a redesign becomes more attractive the more standard IT tools or
modules are available to support it. On the other hand, investing in IT standards has to be
based on the assumption that sufficiently many redesigned processes are going to use
them, and investment decisions on new statistical processes must be made under the
assumption of availability of necessary IT tools and modules.
6.1. Architecture Costs and Benefits
As already said, the decision to start developing an enterprise architecture was not based
on explicit and quantitative cost-benefit considerations. It is possible, however, to give
some indications on both aspects in hindsight. Below we give an overview of costs that
have been made and benefits that have been realised so far.
On the cost side, we can distinguish between initial investment costs, maintenance costs
and support costs. The initial investment concerned a core team of two external
consultants and three internal experts who worked almost full time during a six-month
period in 2006 on drafting the enterprise architecture. For the business architecture in
particular a lot of pioneering work had to be done, since no examples existed at the time.
Many elements had to be developed from scratch. Many other people were involved part
time, for example for reviewing drafts and for supplying subject-matter background
knowledge.
After the initial development phase, a small team of architects was established including
two lead architects (one for the business architecture, one for the IT architecture). Their
task is to maintain, promote and further develop the enterprise architecture. They also
prepare the meetings of the CAB. The architects combine their architectural work with
other duties like consultancy, research, business analysis and software development.
Another cost element is training in architecture. A first batch of people was trained by
external consultants using a standard off-the-shelf course. This was considered not
sufficiently tailored to internal needs and therefore in 2009 a three-day course on business
architecture was developed in-house. The internal course has since been given annually for
staff who need more than a casual understanding of architecture (business analysts,
methodologists, software developers). They highly appreciated the course.
Thus, the bulk of costs concerns human resources. Apart from this, some limited costs
arise from software tools supporting architecture development.
Journal of Official Statistics64
On the benefit side, most rewards materialise through application of the enterprise
architecture in concrete (re)design projects. Various benefits are reaped when applying the
architectural approach: for example, statistical production processes run more smoothly,
cost less, are better integrated into the existing environment and are more transparent,
which in turn enhances quality and speed and reduces risks. It is difficult, however, to
quantify such benefits since most of them are not easily measured, the role of architecture
is intertwined with other aspects (like project management methods, software
development methods) and we cannot conduct falsifiable or repeatable experiments.
This situation is acknowledged in the scientific community (Liimatainen 2008), although
some attempts are being made to measure benefits (Boucharas et al. 2010).
Larger-scale redesign programmes may reap additional benefits from an architectural
approach by developing a programme architecture at an early stage. A clear example is the
redesign of economic statistics introduced in Subsection 3.3, which has benefited greatly
from the comprehensive programme architecture that was developed in early 2007. The
programme architecture enabled integral management of the development programme,
and scoping of individual projects was simplified. Moreover, a new and efficient
organisational structure for economic statistics has been created along the lines of the
programme architecture. And while the main role of the programme architecture was at
design time, it still plays a part at run time. This is most obvious in chain management,
where the concept of steady state is rather important and is used heavily to manage quality
expectations and realisations.
Furthermore, an important indicator for the perceived benefits of the enterprise
architecture is its acceptance by the business, in particular key players in subject-matter
domains. An audit by a team containing external auditors showed general appreciation
among persons interviewed (internal report by the audit team, consisting of D. Baart,
A. Cholewinska, J. Jansen and Y. Vergeer, 2011). In particular, the steady state concept
was highly valued. Concerns expressed relate for example to scalability – how much
architecture is needed for smaller projects? – and communication. The fact that
appreciation for the architecture has increased is probably due to a number of key
factors. First, the business now better understands the enterprise architecture and its uses.
Second, a continuous dialogue and interaction of architects with end users has helped
to improve the architecture and the way it is being applied. Third, the continued support
and commitment from strategic management for the architectural approach, as seen in the
CAB, was crucial.
When the notion of architecture was first introduced, it met with scepticism and its
added value was questioned. The scepticism has largely disappeared over the years and the
added value is now broadly recognised. Architecture has become an established discipline.
6.2. Standard IT Tools and Modules
As to standard IT tools and modules, it has proved difficult to give decision making a
sound financial footing, although development or purchase costs can be estimated. A well-
founded judgment requires an overview of processes where a potential standard tool or
module is to be applied, insight in the costs of implementation (including interfaces), an
idea of training costs, a comparison of old versus new maintenance costs, life cycle
Struijs et al.: Redesign of Statistics Production 65
estimates, and so on. As a result, decision making on IT tooling is based on qualitative
rather than quantitative considerations.
Applying potential new standard IT tools or modules in a pilot setting may help to get a
feeling of the costs and benefits involved. This approach is implemented as one of the key
elements of the Innovation Programme that Statistics Netherlands has started in 2012
(Braaksma et al. 2012). Although the experience at the time of writing is still limited,
already a number of successful pilot studies of potential standard IT tools and modules
have been carried out, in close cooperation between potential users and IT staff. The fact
that potential users are actively involved helps to ensure that a new tool actually satisfies
business needs and hence improves the chances that it will be actually used. One new tool
(Microsoft PowerPivot, an Excel add-on for processing large datasets) is, after a successful
pilot study, submitted for inclusion in the set of standard IT tools mentioned in Section 4.
Others are expected to follow.
6.3. Individual Redesign Projects
As mentioned in the previous section, project decisions in the context of portfolio
management are based on their business case. This comprehensive assessment of all
current and future costs and benefits includes financial as well as nonfinancial aspects. It
includes, for instance, direct project costs, current and future maintenance costs, training
costs, depreciations, required staff, effect on quality, response burden, continuity
considerations and strategic consequences. Proposals for redesign are usually compared to
alternative scenarios, including as a minimum the scenario of not starting any change at
all. A manual for writing good business cases has been developed with the help of external
experts. Business cases are assessed by controllers and other internal staff. When choosing
between proposals that have a valid business case, the CPR is led by strategic
considerations.
In practice, the problem of interdependent business cases between projects can be dealt
with by starting with an integrated business case in which costs and benefits may not be
fully quantified, but in which strategic considerations are taken into account. Individual
projects may then refer to the overall business case and may assume the realisation of the
other projects that are covered by the overall business case. Such constrained business
cases allow for effective project assessments at their inception as well as during their
execution. Moreover, the overall business case can be updated at intervals. When
redesigning the chain of economic statistics, as discussed in Subsection 3.3, this was the
approach taken.
As to quality, it was assumed that redesigned statistics would at least retain their
previous level, in accordance with the second strategic goal as mentioned in Section 1.
This assumption was not further specified, although the quality aspect of coherence was
expected to improve. Actually, apart from sampling errors and response data, for many
statistics most other quality dimensions are not routinely quantified. It was envisaged that
applying architectural standards, such as specifying the quality dimension of datasets,
would help reduce the weaknesses concerning quality information of statistics (Struijs
2005). For example, in the redesign programme of the chain of economic statistics this was
taken into account by explicitly addressing quality indicators in chain management and its
Journal of Official Statistics66
procedures. Unfortunately, it is too early to draw conclusions about the actual effects of
the redesign of statistical production processes on quality, because results are only now
emerging. The proof of the pudding will be in the eating: it is up to the users of the
statistical information to assess the results of the redesign efforts.
7. Experiences and Lessons Learned
Redesigning statistical production processes within a common enterprise architecture has
been underway for about seven years. What can be learned from the Dutch experiences?
On the positive side, we conclude that an enterprise architecture for an NSI can be
developed and applied. Although not fully mature, the architecture of SN is accepted
throughout the institute as the mandatory reference for the redesign of statistics.
What has actually been achieved? SN has set up a Central Architecture Board (CAB) to
address all architectural policy questions. Templates are available to guide the redesign
projects. These templates are approved by the CAB and incorporate the essence of
the enterprise architecture. For example, the principles of output orientation and
comprehensiveness of statistical information are embodied in the templates. The notion of
steady state has proved to be most useful in redesign projects, as illustrated by the example
in Subsection 3.3. It enforces discipline: those responsible for statistical production
processes have to explicitly specify their products and their potential customers. SN has
implemented a Data Service Centre (DSC) to archive and exchange steady states, although
its actual use has so far been limited to the archive function.
Of course the enterprise architecture is not an end in itself, but should be instrumental in
bringing the strategic aims of the organisation closer to realisation. The question is to what
extent the enterprise architecture has been successful in doing this. Due to the application
of the concept of steady states, the comprehensibility of the data has been improved as well
as the transparency of the production process. This has primarily advanced the goals of
high quality standards and cost efficiency.
What has been achieved so far can be seen as an important first stage. We feel much
more can be achieved to advance the strategic goals, in particular the cost efficiency. After
all, the enterprise architecture only outlines a point on the horizon. In order to get closer to
this future situation we need to further develop the DSC so as to facilitate the exchange of
steady states. Furthermore, we have to invest in the libraries of process and IT modules,
but there are still many issues in this area to be addressed. On the one hand, these issues
concern the difficulties in identifying reusable modules and choosing the optimal degree of
(rule-based) parameterisation. On the other hand, for many modules the business case is
not well established. Especially for the IT modules the investment costs are considerable.
In this area, there may be opportunities for international cooperation. This will alter the
business case, since investment costs will be shared. But this requires considerable
coordination effort.
Many institutes face the same challenges. In fact, they have started cooperating
internationally. See for example the vision of the High-Level Group for strategic
developments in Business Architecture in Statistics, established in 2010 by UN/ECE
(HLG-BAS 2011). As a start, this vision resulted in a common language and structure
regarding statistical process and information modelling. The international reference for
Struijs et al.: Redesign of Statistics Production 67
process modelling is GSBPM and for information modelling the newly developed GSIM
(Generic Statistical Information Model). A joint study conducted by Scandinavian
countries and the Netherlands (Booleman and Linnerud 2010) has shown that the NSIs of
these countries already have similar architectures when mapped onto GSBPM, which
could be a good starting point for identifying promising cooperation efforts.
The achievements described above have not been realised in a straightforward way. We
have learned a number of lessons, some positive, some negative, that deserve to be made
explicit for the benefit of other NSIs. We mention the following three:
. Initially, support for an enterprise architecture was not general. Backing by the top
level appeared to be essential to get over the critical point. The CAB played a crucial
role in adapting and accepting the enterprise architecture. Two shortcomings in the
architecture had to be corrected. First, the enterprise architecture focused too much
on corporate interests and neglected the local interests. Second, the enterprise
architecture was developed and formulated top-down, without much practical
explanation as to how and why it should be applied.
. Complying with the enterprise architecture requires the fulfilment of certain
organisational arrangements. For instance, compulsory use of standards implies the
availability and accessibility of these standards. The same holds for reuse of data. As
long as these organisational arrangements, like the DSC, are not fully implemented,
there is much miscommunication and frustration when these standards are prescribed.
In fact, the lack of the necessary organisational arrangements affects the business
case of an enterprise architecture negatively.
. Although a good business case is essential for a good project, there are two caveats
when applying it in the context of the redesign portfolio. First, not all costs and benefits
can be expressed in financial terms, forcing a comparison of apples and oranges and
causing a bias in favour of measurable aspects. Second, costs and benefits may depend
on the realisation of other projects and vice versa. In such cases an integrated business
case is called for, which may be awkward from a managerial point of view. In
particular, standardisation benefits materialise only if adoption is sufficiently massive.
This does not mean that the effort of specifying all costs and benefits does not make
sense. It does, but the available information has to be used wisely.
How to proceed? Directed by the CAB and in cooperation with the business units
concerned we would opt for an incremental approach. For example, we could first further
develop reusable process modules and apply them in actual redesigns. Only after
successful evaluation is it worthwhile to move to the next level and focus on creating
reusable IT modules, starting with a proof of concept. Implementation of an IT module as
a standard depends on cost-benefit considerations.
8. References
Bae, L.-C. (2010). Building an Enterprise Architecture of Statistics Korea. Paper presented
at the Meeting on the Management of Statistical Information Systems (MSIS 2010),
Daejeon, 2010. Available at: http://www.unece.org/fileadmin/DAM/stats/documents/
ece/ces/ge.50/2010/wp.7.e.pdf (accessed January 29, 2013).
Journal of Official Statistics68
Booleman, M. and Linnerud, J. (2010). Cooperation Based on the GSBPM. Paper
presented at the Work Session on Statistical Metadata (METIS), Geneva. Available at:
Ypma, W.F.H. and Zeelenberg C. (2007). Counting on Statistics; Statistics Netherlands’
Modernization Program. Paper presented at the UnStatCom/ECE Conference of
European Statisticians, Geneva. Available at: http://www.cbs.nl/NR/rdonlyres/
61D36740-0489-4A76-B243-E86A3BEFBBD8/0/200932x10pub.pdf (accessed January
29, 2013).
Received December 2011
Revised April 2012
Accepted November 2012
Struijs et al.: Redesign of Statistics Production 71
Innovative Production Systems at Statistics New Zealand:Overcoming the Design and Build Bottleneck
Allyson Seyb1, Ron McKenzie1, and Andrew Skerrett1
In 2011, Statistics NZ embarked on an ambitious ten-year programme of change calledStatistics 2020 Te Kapehu Whetu: Achieving the statistics system of the future. This articleoutlines a key component of this approach to transforming how Statistics NZ delivers itsstatistics. This involves modernising all aspects of statistical production – from identifyingneed, right through to dissemination – to ensure the organisation has the functionality andcapacity to deliver now and into the future. Standardisation of processes, methods, tools, andsystems to increase flexibility and efficiency is a key component of this transformation.
Key words: Statistical production process; business architecture; administrative records.
1. Introduction
Statistics New Zealand (Statistics NZ) is the major producer of official statistics in New
Zealand and leader of the New Zealand Official Statistics System (OSS). Like other
national statistics offices, Statistics NZ faces many challenges in supplying the broad
range of information that is required by modern users of official statistics. The
organisation strives to maintain the quality of its statistics in terms of relevance, accuracy,
timeliness, accessibility, consistency, and interpretability. At the same time, the
organisation is in a tight fiscal environment that requires us to minimise costs and
maximise effectiveness. Statistics NZ’s aim is to produce statistics that are fit for purpose
in a cost-effective and sustainable way.
In 2011 Statistics NZ embarked on an ambitious ten-year programme of change called
Statistics 2020 Te Kapehu Whetu: Achieving the statistics system of the future (Stats 2020
in short). The Stats 2020 programme of change is extensive. It involves changes to the way
the organisation works; who it works with and how; to the systems, tools, and processes
used; and to the skills, attitudes, and behaviours needed for success. These elements of
change are viewed from four perspectives: transforming how statistics are delivered;
leading the New Zealand OSS; obtaining more value from official statistics; and creating a
responsive and sustainable organisation (Statistics NZ 2010).
This article outlines a key component of the approach adopted for the first of these:
transforming how Statistics NZ delivers its statistics. This goal focuses on Statistics NZ’s
q Statistics Sweden
1 Statistics New Zealand, The Boulevard, Harbour Quays, PO Box 2922, Wellington 6140, New Zealand.Emails: [email protected], [email protected], and [email protected]: The opinions, findings, recommendations, and conclusions expressed in this article are those of theauthors. They do not necessarily represent those of Statistics NZ, which takes no responsibility for any omissionsor errors in the information contained here.
Journal of Official Statistics, Vol. 29, No. 1, 2013, pp. 73–97
role as a producer of official statistics and involves modernising all aspects of delivery
from identifying need, right through to dissemination, by ensuring that it has the
functionality and capacity to deliver now and into the future. Standardisation of processes,
methods, tools, and systems to increase flexibility and efficiency is a key component of
this transformation.
The following objectives shaped this transformation project:
. Modernising information technology (IT) systems to leverage the opportunities that
new technologies offer for working more effectively.
. Reducing risk by replacing legacy software.
. Standardising processes so that staff can move between outputs without having to
learn new tools and systems. This will increase efficiency and remove a barrier to
innovation.
. Updating and standardising methodologies to eliminate unnecessary diversity and
duplication conceptually, in terms of business and information concepts, and
practically, in terms of methods and technology.
. Creating statistical methods and systems that support a growing need for more
detailed data analysis.
. Maximising the use of administrative data to reduce respondent load, minimise costs
of data collection, and maximise data re-use.
. Developing and applying a quality framework and quality indicators to inform users
about the quality of the data before and after statistical processing and to monitor and
optimise the performance of the IT system.
. Maintaining the quality of the statistics produced by ensuring they continue to meet
user needs.
While Statistics NZ is only one year into the official change programme, many of the
initiatives had already been established in the organisation. These included creating
common processing platforms for clusters of social and business collections, using
standard statistical tools, and adopting a generic Business Process Model and Quality
Management programme. Stats 2020 incorporates these existing initiatives into a
cohesive, recognised, and measured programme, raising both the organisation’s
productivity and its flexibility. A key element of this is the replacement of legacy IT
systems with fewer systems that are more flexible and more standardised, so that risks are
eliminated and systems are cheaper and easier to maintain and manage.
The programme of change also builds on previous work to confirm the approach to data
collection that will support future information needs. The existing structure of collections
at Statistics NZ is based on a traditional model of sample surveys supported by a range of
administrative data sources. By 2020, the organisation’s aim is that administrative data
will be the primary source of information, supplemented where necessary by direct
collection. Since 2008, the organisation has focused on designing statistical architectures
for both business and social statistics (see e.g., Bycroft 2011; McKenzie 2008).
A statistical architecture describes at a high level how future collections of survey and
administrative data will be managed and combined to produce statistical outputs. These
architectures have helped structure thinking and guide the development of an integrated
statistical system to meet the goals set out in Stats 2020. The new IT platforms for
Journal of Official Statistics74
processing household and economic collections are designed to support the new statistical
architectures and Stats 2020 goals.
The environment that Statistics NZ operates in has changed over the last ten years.
Societal and economic changes as well as greater diversity have heightened demand
for a broader range of statistics that will support more complex analysis at greater
levels of detail (Glaude 2008). Users of official statistics want statistics to be more
relevant to their needs. The role and contribution of Maori (the indigenous people of
New Zealand) – economically, socially, and demographically – to the growth of the
country is increasing significantly. Given this, there is an increased emphasis on
information for and about Maori to support decision making and understanding.
Statistics NZ’s role as the leader of the decentralised New Zealand OSS, as well as a
producer of official statistics, has been reconfirmed and strengthened by the New Zealand
government (Statistics NZ 2010). The organisation is mandated to coordinate statistical
activity across government by driving the overall performance of the OSS and ensuring
New Zealand both gets the information it needs and that this is value for money, at the
lowest possible cost to government, the community, and suppliers of the data (State
Services Commission 2011). This places greater expectations on the organisation to
deliver a more cost-effective and productive statistical system. At the same time, the fiscal
environment is becoming more and more challenging. Despite the growing costs of data
collection and processing, perceptions of increasing response burden, and smaller budgets,
the public sector is trying to increase and improve the services they offer.
Users of official statistics expect the national statistics office to improve the quality,
quantity, and “time to market” of their statistics. The availability of vast stores of
administrative data across government sectors, and the ability to easily store and
manipulate the data, presents a wealth of opportunities to identify and reduce duplication,
increase utilisation, and improve collection effectiveness.
Addressing these drivers has led to the developments described in this article. Section 2
describes the business statistical architecture that is helping Statistics NZ to achieve the
desired changes to its systems and direction. The focus of the article from this point
onwards is on economic statistics and the new economic platform. Section 3 focuses on
statistical development, particularly the change in IT strategy that has seen statistical
development move from being an expensive drawn-out process to a process that often does
not involve IT staff at all. Standardisation and automation of statistical processing are
discussed in Section 4. Section 5 focuses on governance. Section 6 discusses lessons learnt
and the transformation in the culture of the organisation as a result of the changes in the
way statistics are produced. Section 7 has some concluding remarks.
Throughout the article, the term “subject-matter specialist” refers to analysts who
process and analyse particular surveys, such as the survey of Retail Trade, and the term
“methodologist” refers to analysts who work in the methodology area of the organisation.
Traditionally the roles of subject-matter specialists and methodologists were quite
different from each other – methodologists primarily focussed on designing surveys and
subject-matter specialists focussed on processing, analysing, and disseminating the data
collected. More recently within Statistics NZ, the roles have begun to overlap – subject-
matter specialists are developing skills in survey design and methodologists are taking a
more active role in understanding the entire statistical production process (including the
Seyb, McKenzie and Skerrett: Overcoming the Design and Build Bottleneck 75
technology solutions) and leading the cost-benefit analyses and decision making. When
the term “analyst” is used in this article, we are referring to either a subject-matter
specialist or methodologist, or both.
2. Statistical Architecture
A key objective of Stats 2020 is to make maximum use of administrative data while
continuing to produce economic statistics that are fit for use. Further, the aim is for
administrative data to be the first source of data for statistical outputs (Statistics NZ 2010).
This key principle of the new statistical architecture has been a driver for developing the
new economic statistics platform.
2.1. Background
Statistics NZ has had access to a variety of administrative datasets for many years. A tax-
based business register was developed at the end of the 1980s after a value added tax
(called “goods and services tax”, or GST) was introduced in New Zealand. Tax data was
introduced into the quarterly and annual industry estimates of financial statistics by using
tax data for strata containing the smallest units. The risks to quality from using tax data
were mitigated by ensuring that the tax strata contributed less than 15% of the estimate.
A growing range of user needs created pressure for the development of a new approach.
The existing survey-based method provided the information needed for the compilation of
estimates of GDP, but could not meet the growing demand for detailed statistical
information to support policy development and monitoring. For example:
. studies of business development need to focus on small businesses, where sample
coverage is limited.
. longitudinal analysis needs to be able to track the performance of businesses over
time.
. the non-profit satellite account of the national accounts needs information about units
with relatively small financial flows and numbers of employees, which were not well
represented in sample surveys.
. existing sample surveys could not provide the detailed information needed to
estimate regional GDP.
. increased use of microdata analysis increased the demand for full-coverage unit
record data.
To respond to these emerging needs without increasing respondent load, Statistics NZ
embarked on a strategy that places a greater dependence on administrative data. A new
high-level statistical architecture for economic statistics was formally approved during
2006 and a programme of methodological development, assessment, and implementation
began. The architecture for economic statistics has now been subsumed within the broader
Stats 2020 programme.
2.2. Principles
The new statistical architecture for economic statistics is shaped by the following guiding
principles (McKenzie 2008):
Journal of Official Statistics76
1. Information should only be collected if a clear user need has been established.
2. Information should only be collected once.
3. Administrative data will be used as the primary source of data wherever possible.
4. Surveys will only be used to fill the gaps that cannot be met from administrative sources.
5. Survey and administrative data will be integrated using a comprehensive business
register.
6. Information should only be collected from units that can readily provide reliable and
meaningful estimates.
7. Large complex business units will be closely managed to facilitate the collection of
all the data that is needed from them.
8. Information quality will continue to be fit for purpose.
9. Reliance on administrative data will increase in incremental steps, beginning with
the parts of the population for which administrative data is robust and then expanding
into more difficult areas as data issues are resolved.
These principles represent a significant change in the collection and production of
business statistics (Kent 2011). Using administrative data wherever possible, with
surveys filling gaps in information needs, is a reversal of the previous survey-based
strategy. The developments currently underway are applying an approach that combines
the use of survey data for large complex businesses with tax data from the rest of the
population. Tax data is used directly for most of the population and surveys are
targeted at businesses or data items that make a significant contribution to statistical
outputs.
Statistics NZ has a long history of using administrative data, for example using
customs data to create estimates of changes in overseas trade volumes and building
consents data from local councils to create a sampling frame for the quarterly survey of
building activity. However, most of the administrative data currently incorporated into
business statistics has been tax data sourced from the New Zealand Inland Revenue
Department. Tax data is relatively straightforward to use, because the reference numbers
used by the administrative agencies are already mapped on the business register, so
matching and coverage issues are easy to resolve. Furthermore, the data items are
financial variables that are well defined. Limited use is being made of electronic card
transaction data. In the future, this will be developed further and other data sources such as
livestock records and store scanner data will be explored for use in our agriculture
production survey and price indices respectively, and methods to make use of these new data
sources will be introduced.
Developing a platform that can process administrative and survey data meant that a
number of issues specific to administrative data had to be addressed:
. Administrative data comes in huge volumes that need to be processed and stored. An
extract, transform, and load (ETL) workflow tool used can load large volumes of data
quickly and efficiently.
. The processes for receiving administrative data are now well controlled. Duplicate
records are often received. The administrative agency updates or corrects records
without any warning. Methods for versioning data, eliminating duplicates, and
managing revisions to data have had to be developed.
Seyb, McKenzie and Skerrett: Overcoming the Design and Build Bottleneck 77
. The large volumes of data make traditional editing methods impractical. It is not
possible for a statistical processer to examine every record. The development of
automated editing and correction processes has been essential for the use of
administrative data. An associated benefit is that the platform can apply the same
automated processes to survey data.
2.3. Range of Methods
The Stats 2020 objective of maximising the use of administrative data means that statistics
will be produced in different ways. The range of methods for using administrative data will
change and expand as new data sources are introduced and assessed and new methods are
developed and tested. The following are some of the ways administrative data is used
currently or will be used in the future:
. A tax-based business register will continue to be used as the sampling frame from
which survey samples are derived. For example, some information about business
operations cannot be obtained from administrative sources.
. Financial collections will continue to use a mix of different methods for different
parts of the population.
. When the administrative data definitions are closely aligned with the concepts
required for the relevant statistical output and reporting is timely, administrative
records will be used directly. This approach supports the production of aggregate
estimates and provides additional unit-level data for microdata analysis.
. If the concept collected in a tax form does not exactly match the concept for
a particular statistical output, some data modelling might be needed to
produce robust estimates. In some cases, the statistical model can be estimated
using data from other units in the administrative dataset. An example of this is
combining data from two-monthly and monthly GST returns to produce quarterly
statistics. In other situations, sample survey data might be needed for calibration of
the model.
. Data records from several tax forms might be combined with survey data to
produce the required statistical outputs. For example, Statistics NZ is planning to
develop a measure of quarterly operating surplus as input to an income measure
of quarterly gross domestic product. To minimise respondent load, estimates for
small and medium-sized enterprises will need to be derived from two alternative
sources: income and expenditure from their GST return and wages and salaries
from a monthly return used to collect taxes on wages and salaries
at source.
. Administrative data records will continue to be used in imputation for nonresponse in
surveys.
. Administrative data will continue to be used as auxiliary data to optimise estimates
from surveys (e.g., generalised regression estimates).
To support future uses of administrative and survey data, Statistics NZ needs systems that
can store data in such a way that allows it to be re-used in a wide range of formats and for
different purposes.
Journal of Official Statistics78
2.4. New IT Platform to Support the New Statistical Architecture
Our existing economic survey infrastructure had the following characteristics that made
the new statistical architecture harder to support:
. Each survey had a separate stand-alone custom-made system.
. Survey-based systems were designed around small data volumes and could not easily
be extended to handle the vast volumes of administrative data.
. Linking data from different sources was arduous.
. Data structures were inflexible, making it difficult to introduce new data sources.
Data was stored in highly normalised, fixed tables optimised for transaction
processing. The column names in these tables were often subject-matter specific and
thus rigidly defined for a specific topic. The links between tables were also fixed and
again were rigidly subject-matter specific. Reporting and analysis were customised to
each production system. This allows fast processing, but changes to processes are
complicated.
The microeconomic platform (previously known as BESt) developed a new storage
system with entirely different data architecture. This platform has introduced two major
innovations that are critical to the implementation of the new statistical architecture:
firstly, it is designed for analysis, and secondly, it has flexible data storage.
2.4.1. Designed for Analysis
Our existing information systems were optimised for fast transactional processing using
what is known as the online transactional processing (OLTP) model for storing data. This
system design maximises processing speed and minimises storage with a high degree of
normalisation. A strong focus on the data for the latest survey period meant that recording
and understanding the events and decisions affecting data for earlier periods tended to be
secondary. An emphasis on the most up-to-date value of each datapoint meant that when
correcting data, the values replaced are either overwritten or made inaccessible in a log or
separate history table. Analytical capability is often achieved by exporting data to a
separate dataset which is structured in a way that supports analysis by tools outside the
processing system.
When developing information systems, there is always a trade-off between speed,
flexibility, and analytical capability. Existing survey systems were designed to favour
speed over flexibility and analysis. Speed was important in a traditional survey processing
environment, when large volumes of survey data had to be entered and edited by survey
operators, but loss of history is a constraint in an environment where the emphasis is on
analysis.
In developing the new platform, it was recognised that Statistics NZ is shifting from its
narrower focus on data collection to becoming an organisation that provides a fuller
service by collecting, analysing, and disseminating information. Data processing is
becoming less important, while analytical power and flexibility in dissemination are
increasingly important. To support this change in direction, the new economic statistics
platform has been optimised for analysis, with analytical capability being built into the
basic database design.
Seyb, McKenzie and Skerrett: Overcoming the Design and Build Bottleneck 79
An online analytical processing (OLAP) methodology (Thomsen 2002) has been
adopted to support this change in direction. OLAP is very common in the corporate world
and many national statistics offices use OLAP as a read-only output data system that is
exported from OLTP survey systems. The new production systems avoid OLTP altogether
and process and store data within an OLAP analytical schema.
The software change that makes this approach possible is the ability to momentarily
“pivot” a “narrow” single-cell table into a “wide” table, which allows the system to imitate
an OLTP system when processing data. The wide table has variables as columns and units
as rows, which is the format required by tools such as Banff and many other data-
processing tools. The data is pivoted from the wide table back into the narrow table
required for OLAP when bulk data processing is complete.
This OLAP approach provides a time-intelligent, version-controlled, metadata-rich
datastore. The increase in computer processing power means that losses in processing
speed are manageable. Large volumes of data (with versioning) are accessible to analysts
without significant loss of speed in bulk data processing.
2.4.2. Flexible Data Storage
The microeconomic platform datastores are also designed for flexibility. In a traditional
OLTP system, the data tables have column names that match the input and output data. For
example, if a survey has a question about income, there will be a column called “Income”.
This hardwiring of column names requires systems to be rebuilt to handle new surveys.
Systems with hardwired columns are difficult to change when new data arrives. With large
volumes of administrative data to process and statistics combining various survey and
administrative data sources, this approach is no longer practical.
Statistics NZ has adopted a cell-based approach to data storage that eliminates the need
for fixed column names. This means that building a stand-alone system for each new
survey or administrative series is no longer necessary. The cellular data warehouse schema
adopted by Statistics NZ takes OLAP to the extreme by adopting a single-cell table structure.
In this model, each row in the narrow table contains one data item, called a fact. The other
columns contain standard metadata items, such as description, frequency, and date. This
ensures that all datasets have standard metadata including a record of the rules used to change
the data. When data is processed, it is pivoted on the fly so that each variable becomes a
column in a wide format table. When all the transactions are complete, the data is unpivoted
back into the cell-based format of a narrow single-cell table. This process is fully automated.
The cellular approach has significant advantages for the production and analysis of
statistics:
. Reports, queries, and processes developed for one collection work easily for another.
. Reports, queries, and processes developed for survey data can be applied to admin-
istrative data, and vice versa.
. A creation date on each row makes the data suitable for both point-in-time and
longitudinal updating and analysis.
. Metadata is stored alongside data.
. The system is resilient to any change in the structure of the data.
Journal of Official Statistics80
. Administrative data and survey data can be processed and stored on the same
platform.
. Metadata for survey and administrative data is stored in a way that facilitates data
integration.
. Sharing data between teams is a matter of security settings allowing access to data,
rather than an exercise in IT support and redesign.
. Subject-matter specialists can design and build production systems for new outputs,
and maintain existing production systems, without being constrained by data storage
or system barriers.
. Administrative and survey data are stored in exactly the same way, so solutions that
combine survey and administrative data are easy to implement.
. The ETL Workflow can extract and load large volumes of data very quickly.
The disadvantages of this cellular format are:
. Processing performance will always be slower than a wide-column solution on the
same hardware, but this becomes less of an issue as hardware gets cheaper and
database technologies become more advanced.
. The cellular data structure presents new challenges and requires new skills from in-
house IT developers as well as support in the form of expert advice and training from
external expert data warehouse consultants.
A number of economy-wide administrative data series and surveys with simpler data
structures have been migrated to the new platform. It now contains GST data and detailed
financial data covering every business in New Zealand for several years, plus import and
export transactions in detail for the whole economy dating back ten years, as well as
quarterly surveys of manufacturers and wholesalers. The current holding is around four
billion data points. Under development are the more complex collections, including the
economy-wide annual enterprise survey, the annual agricultural production survey, and
the business register. These latter systems demand more advanced statistical methods and
require more complex integration of survey and administrative data.
Another key development currently underway is the creation of a prototype Integrated
Data Infrastructure (IDI), an integrated dataset with person-level data from multiple
sources. The IDI contains longitudinal microdata about individuals, households and
firms.
The IDI is not a population register, but is able to be used to answer research questions
about particular populations that are well represented in the linked dataset, for example
students. By bringing together many datasets into one infrastructure, the IDI allows for
longitudinal analysis across education, employment, migration, welfare, and business,
with potential for further datasets to be added in future. This will help Statistics NZ to meet
demand for more or new information, and allow more efficient responses to changes in
existing data sources.
The prototype IDI is used as a research database by both government and academic
researchers. Statistics NZ’s standard security measures and protocols govern the
management of the data used in the IDI. Statistics NZ is required to comply with
the confidentiality provisions of the Statistics Act 1975 and also protocols for security
Seyb, McKenzie and Skerrett: Overcoming the Design and Build Bottleneck 81
in the government sector (Statistics NZ 2012). Other security measures for the IDI include
the following arrangements:
. All data collections and associated electronic workspaces will be secured (access
will only be authorised for project personnel who need to access data for
specific tasks, and to selected IT administrators who are required to maintain the IT
system).
. Datasets will not be available to third parties.
. Regular audits of individuals able to access the dataset will be made.
Statistics NZ has developed microdata access policies and confidentiality standards for the
IDI that apply to potential research outputs to protect the confidentiality of information
providers. These rules also take into consideration the existing confidentiality rules for
each contributing dataset (Statistics NZ 2012).
3. Statistical Development
Creating statistics is an intellectual, service-based activity, akin to practising law or
engineering. Just as an engineer’s bridge design is not the product of a computer-aided
drawing system, a statistician’s time series is not a product of the computer that calculated
it. Productivity in our industry is a function of the efficiency and ability of the technical
statistical staff involved. Systems can complement, but are not a substitute for, this
intellectual and human productivity.
With the goal of making the subject-matter specialist role easier and more efficient, the
following principles guided the design of the new economic platform:
. Subject-matter specialists must have direct control of all business processes and be
able to make changes easily. This is explored in more depth in Subsection 3.1 below.
. Systems must support the experimentation and creativity of subject-matter
specialists.
. Repetitive tasks should be automated.
. All data must be stored so that it can be accessed and integrated easily.
. Whenever business processes and systems interfere with analyst productivity, they
should be reviewed and considered for change. For example, most existing
processing systems could not produce graphs that meet Statistics NZ publication
standards, so data was sent to a specialised publication team to create the required
graphs. This process typically took about three working days. The solution is a
processing platform that can produce graphs that meet publication standards as part
of the usual quality monitoring.
. The platform must support continuous improvement and allow for timely monitoring
of the quality of processes and statistical outputs.
The microeconomic platform already incorporates a module for calculating sample errors.
If a new measure is developed for any other component of total survey error, a generic
module to calculate and monitor it can be easily added to the platform. These measurable
components of total survey error can be displayed along with other quality indicators in a
dashboard, which is available for methodologists when optimising a collection design and
Journal of Official Statistics82
for subject-matter specialists monitoring the ongoing performance of the statistical
production processes.
Data processing error is a significant component of total survey error in the quality
models described by Groves and Lyberg and by Biemer (Groves and Lyberg 2010; Biemer
2010). It includes errors introduced at all stages of processing, for example during data
editing and coding or during computation of weights and estimates. The versioning of data
maintained by the platform allows the pre- and post-processing versions of a dataset to be
compared and analysed to assess the significance of processing error.
3.1. The Design and Build Bottleneck
The generic Business Process Model (gBPM) was originally developed in New Zealand
(Savage 2008) and is reflected in the Generic Statistical Business Process Model (Metis
Steering Group 2012). It has, with subsequent modifications, been widely adopted by other
statistics organisations.
The gBPM includes designing and building statistical outputs as a routine part of
business activity. However, in practice, under the old approach a complex one-off
development process and separate project was required to make substantive process
changes in a given system.
“Design” and “build” have proved to be the primary performance weaknesses in the
statistical supply chain. It can take years in a national statistics office to move from
identification of need to the production of a new output. Large multidisciplinary
development teams lead to high costs, a lengthy justification and approval process, and
long development times. The cost and long lead time makes the organisation unresponsive
to changing needs. Some needs are never met as they fall below cost/benefit thresholds.
We call this problem the “Design and Build Bottleneck.”
To resolve this problem, the new platform has adopted an “analyst-driven” approach. In
this analyst-driven model, creating new or improved statistical output becomes a routine
activity for subject-matter specialists and methodologists. The role of the IT department is
limited to building a generic platform that can be used by analysts for designing and
building statistics as well as collecting, processing, analysing, and disseminating statistics.
Incorporating analyst-driven design, build, and test functionality into the microeconomic
platform allows new statistical products to be developed more quickly and at significantly
lower cost.
In this model, subject-matter specialists and methodologists control all the business
processes and methods. Examples include microdata editing, outlier detection, imputation,
adjustment of weights, estimation of model parameters, and computation of standard
errors. Common methods such as historic imputation are encapsulated in standard tools (in
this case Banff, a data editing and imputation system developed by Statistics Canada
(Statistics Canada 2005)), which are then combined into an end-to-end production process
called a configuration. A configuration, or a group of processes that will be applied to a
Need Design Build Collect Process Analyse Disseminate
Fig. 1. The generic Business Process Model
Seyb, McKenzie and Skerrett: Overcoming the Design and Build Bottleneck 83
particular set of data, can be changed by the subject-matter specialist or methodologist in
two main ways: firstly, the parameter settings that control a process in the configuration
can be altered to improve the performance of the process, for example changing the
minimum cell size criteria in an imputation cell; secondly, a process can be added or
removed from the configuration, for example changing an imputation method from mean
imputation to historic imputation.
This model offers subject-matter specialists and methodologists a great deal of
flexibility when it comes to the design of collections and processes. This flexibility
significantly affects the design of products, as it is no longer necessary to get the design
absolutely right prior to the development phase. This is because it is easy to optimise
the design once a configuration has been created. This flexibility also affects the
production process itself. The ease with which configurations can be altered means that
analysts are able to alter or replace processes as needed, with the constraint that there is
a limited range of standard methods available for each process (e.g., analysts can choose
between the imputation methods available in Banff). It also means that strict controls
are in place to differentiate between configurations used in production and those under
development. Only a very few staff are given the authority to make changes to
configurations that are used in producing published products, and clear guidelines and
procedures are in place to control changes. Also, for a tool to become available on the
platform, it must first be validated as a standard tool by methodologists and be available
in the statistical toolbox.
As outlined in Subsection 2.4.2 above, flexible and consistent data storage are critical as
they give subject-matter specialists direct control over both existing and new data. Below
we describe four features of the microeconomic platform that support subject-matter
specialists to maintain the relevance of existing outputs and to design and build new
outputs quickly and easily.
3.1.1. Business Register History
Statistics NZ maintains a comprehensive tax-based business register that is used for
selecting samples and integrating and classifying administrative data. The business
register records industry and institutional sector classifications for every economically
significant unit in the economy. Classifications on the business register are derived from
multiple sources: from administrative registers for simple units and via register
maintenance surveys for larger and/or more complex units. Inconsistencies between
sources are resolved by applying business rules during the register update process.
Before administrative data is used in the production of statistics, each administrative
unit on the dataset is linked to the business register, so the classifications from the business
register can be assigned to it. This ensures that all economic data is classified consistently
by eliminating the need to rely on the classifications that may have been received from the
administrative system.
The microeconomic platform stores point-in-time snapshots of the business register.
Samples are selected from these snapshots and coordinated so that, for example, quarterly
surveys are selected at the same time on the same basis. Immediate access to complete
business register information facilitates the design and development of new statistical
collections and outputs.
Journal of Official Statistics84
3.1.2. Configuration Store
The configuration store is an important innovation, because it makes the ETL workflows
described in Subsection 2.4.2 user configurable. The configuration for a statistical output
lists all the workflows and the parameter settings that must be applied during the
production of a statistical output. It records all the instructions and information needed for
statistical processing of a survey from collection to dissemination.
An individual workflow points to where data is stored and specifies a method or statistical
process that must be applied to it. A simple workflow may consist of a datastep that derives a
new variable. It specifies the data to be extracted, the code that is to be executed on the
variables, and the new variables to be created. A more complicated workflow might extract a
large dataset and pass it through a complex statistical tool like Banff or QualityStage. The
workflow specifies all the parameters and rulesets required by the statistical tool.
A subject-matter specialist or methodologist builds a new statistical output by creating a
new configuration in the configuration store of the microeconomic platform. This
configuration will specify all the transformations and statistical methods that must be
applied to the data to produce the output and the order in which they must be applied. The
version-controlled configuration store ensures permanent traceability between raw data,
the data process rules, the methods are applied, and the final outcome.
The components of a configuration can be copied easily and reconfigured for a different
need. This means that processes, methods, queries, and reports that have been developed
for one collection can be easily applied to another. For example, a generic editing and
imputation process is available for any survey or administrative dataset by changing the
instructions and parameters recorded in the configuration store. Standardisation is
enforced, because new configurations are required to draw on existing standard
configurations composed of processes based on standard tools.
The configuration store allows subject-matter specialists and methodologists with a
basic understanding of computer logic to set up all the statistical processes needed to
produce new statistical outputs with minimal IT support. The configuration for an output
breaks the end-to-end process into a large number of small steps, so complex data
transformation and statistical processing is achieved by combining well-tested data
processes and statistical tools. An advantage of this approach is that the production system
is created as the new output is being developed, assessed, and tested.
For example, the configuration store contains a generic automated edit and imputation
process that can apply a wide range of edit types and all standard imputation methods to
any survey or administrative dataset. To apply this process to a new dataset, the subject-
matter specialist or methodologist amends the configuration to record the methods,
parameters, and other information that is needed to apply the required edit and imputation
process to the new data.
New methods can be developed, tested, and implemented within the existing processing
system. They can be introduced to other outputs by changing the relevant configurations.
The configurations make extensive use of SAS for three reasons:
. SAS is a high performance statistical tool for data processing and statistical analysis
that manages large-scale data manipulations with ease.
Seyb, McKenzie and Skerrett: Overcoming the Design and Build Bottleneck 85
. A library of standardised and tested SAS-based statistical methods is already
available within the organisation.
. Many subject-matter specialists are trained in SAS.
The disadvantage of SAS is that subject-matter specialists and methodologists can rewrite
complex code again and again in an unstructured way, defying standardisation and
efficiency. They can create new SAS datasets easily, making security and version control
extremely difficult.
The microeconomic platform controls and limits the use of SAS by using the
configuration store as a facility for writing and managing SAS in a structured and
standardised way. The benefits of SAS described above are retained, but the pitfalls are
avoided because the platform controls the way SAS is executed and securely manages the
resulting data.
Although the new microeconomic platform uses SAS, it is not tied to this particular
software. When using SAS, the workflow sends the code stored in the configuration store
to a SAS server for processing. Other calculation engines, such as R and Excel, can also be
used in the same way.
3.1.3. Scenario Store
The scenario store is a key element in an analyst-driven statistical system. Whenever an
automated process to change data is applied, the entire dataset is extracted to a temporary
area, called the scenario store. If the analyst selects the current approved configuration
ruleset for the scenario (i.e., the version used in producing outputs) then, after confirming
that results are as expected, the data can be written back into the main permanent store and
from there be used in outputs. However, the subject-matter specialist can copy an approved
ruleset, make changes and create an experimental scenario at any time. This experimental
scenario can be used for evaluation. The approved and experimental scenarios sit side by
side in the store for easy comparison using standardised views and tools.
This means that as well as changing the process rules, analysts can easily test those
changes with live production data without affecting production systems in any way. In this
way, existing rulesets can be continuously improved or completely replaced. The scenario
area can be used to prototype entirely new outputs or to make small changes in existing
rules. The rights of subject-matter specialists to make changes are managed by security.
There is version control of the configuration rulesets and the scenario store. A change
management process ensures that all changes are properly tested and approved before they
are implemented in published statistics.
3.1.4. Reduction in Staged Processing
Reviews of existing systems to inform the new design showed that data processing was
often broken down into many stages. Each stage had its own data preparation followed by
manual inspection. Sometimes data is repaired manually when, if left alone, it would have
been corrected by automated repair processes at a later stage. Processing analysts often
had to carry out the same manual repair multiple times if data was reprocessed. If the
output result was several stages away, more serious quality issues could easily be missed.
Later detection meant more rework. In summary:
Journal of Official Statistics86
. Each process operated independently of the others, often in different parts of the
organisation. Problems and errors arose from the transfer of data between
environments.
. Inspection and manual repair was inefficient and duplicated.
. The contribution that each process made to the whole was not always clear to those
responsible for designing and monitoring it. It is often not clear whether they are
adding value.
. The effect of actions cannot be seen until the end of the last process is complete and
an output is produced. This may be days or weeks after the first process began.
. When errors are detected in later stages, the process is very slow to repeat, or in the
worst cases cannot be repeated in the time available before output deadlines.
These problems have been resolved by building larger, more holistic processes that can be
run repeatedly until quality targets are met.
In this iterative approach, each time the subject-matter specialist runs the configuration
that controls the statistical production process, the complete set of workflows is run over
the data and the results are available for inspection via a standardised reporting suite. Over
time, as more data is received in sample surveys, or rules are adjusted in administrative
collections, scenarios move closer and closer to the final outcome. Approximate output
results are always available. This methodology is born of necessity as the organisation
moves into processing more large-scale administrative data where manual intervention
and manipulation is impractical. In summary:
. Data is managed in a single very large cohesive environment.
. Processing is, as much as is possible, done in a single pass and in a single scenario set.
. Manual editing is post-process and driven by significance and by output needs.
. Processing and revision of data is easily repeatable.
. The configuration is designed and built by subject-matter specialists as a cohesive
single sequential process. The configuration specifications are improved over time as
they are fine-tuned by real world data experience.
Strategically, the microeconomic platform makes product quality highly visible. It also
allows changes to maintain quality, for example updating an industry classification to the
latest version, to be carried out quickly and cheaply. Operationally, product quality is
controlled through security settings that allow only a very few people with appropriate
authority to make changes to configurations used to produce outputs. Change control
policies and procedures ensure proper testing and review has accompanied proposed
changes.
The microeconomic platform is making statistical development a more standardised,
more cost- and time-effective process. These attributes are essential for achieving the
goals of the Stats 2020 programme of change.
4. Statistical Production Process
The development of the new platform has had a significant impact on the statistical
production process, particularly editing and imputation. Modern designs typically include
Seyb, McKenzie and Skerrett: Overcoming the Design and Build Bottleneck 87
administrative data in some way, often in large quantities, and use standard concepts,
methods, and tools.
A major part of the regular government audits of Stats 2020 has to do with measuring
improvements. The most significant savings will be made through operating efficiencies in
relation to the new statistical production platforms that have started to replace the outdated
and dissimilar existing systems. The four perspectives referred to in Section 1 are the
strategic goals of the organisation for the next seven years (transforming how statistics are
delivered, leading the New Zealand OSS, obtaining more value from official statistics, and
creating a responsive and sustainable organisation). The programme is planned to reduce
labour input by just over 20% in this time frame. Each of the Stats 2020 projects has short-
term performance targets, and a time frame in which expected benefits should be achieved.
Early indications for the microeconomic platform are ahead of this target in both labour
savings and the time taken to achieve them.
For example, a study by the methodology group found that the number of units needing
manual edit intervention decreased by 66% in repeating business surveys. This was based
on the use of the standard significance measure deployed in the new system. The business
area has confirmed this saving in practice with operational changes. Preliminary results for
another survey, using Banff to do automated repairs, combined with the impact assessment
above should see realised labour savings of 20% or more.
Development of the microeconomic platform has not involved a substantial upfront
investment. It has however been completed over quite a long period of time, taking four years
to deliver a full suite of business processes. Delivery was deliberately planned in phases, with
each phase of the programme being self-justifying in terms of costs and benefits.
The first stage focused on a large administrative data series that was not an output in its
own right, but is used to replace small units in a major postal survey. This made the initial
phase and goal much simpler. A target of reducing postal units in the survey by around 60%
over a five-year period was achieved by using more of the administrative data, developing a
more efficient data handling capacity and automated editing and imputation. At the close of
the first phase, a cashflow analysis (project cost input, reduced postal costs output) showed
an investment return on capital of 18%. In addition, the project had created generic data
handling and edit and imputation processes that could be used for other collections.
The second phase of work added the processing of GST (or value-added tax) unit
records to the platform. This phase enhanced the ability of the system to handle
longitudinal data. It also increased the confidence of the organisation in the development
and led to the organisation committing to further investment. These very large
administrative datasets are routinely transferred electronically from collecting agencies to
Statistics NZ through a standardised process. The wide variety of types of administrative
data and of statistical issues encountered, such as common mistakes that occur when filling
out a form, encouraged a pragmatic approach. Editing strategies aimed to resolve the most
common errors in form filling, such as ignoring a request to use thousands of dollars when
answering financial questions. Errors that are less common, but are material, are also
resolved. For the sake of platform performance, errors that are less common and
immaterial are ignored. The way statistical issues such as definitional differences and
temporal or cross-sectional aggregation effects are resolved depends on their importance
Journal of Official Statistics88
with respect to the statistical product being produced using techniques such as statistical
modelling.
The third phase of work brought the first postal business surveys onto the platform and
the very large Overseas Trade series. During this phase, the investment costs for
development and implementation rose dramatically, as sample selection and survey
management functionality was added to the platform. However, Statistics NZ was willing
to commit to this investment, because the core elements of the platform were already in
place and proven. Efficiencies were able to be achieved immediately for successive
products, because the generic editing and imputation tools were already available. The
platform is able to cope with a wide variety of data formats, data quality, and processing
methods. In tandem with the platform development, the organisation is focussed on
developing a proven set of methods and tools for evaluating, collecting, processing,
analysing, and disseminating products based either entirely on administrative data or on a
combination of data from multiple sources. Techniques such as statistical modelling and
data integration are especially important for making extensive use of administrative
records for statistical work.
The fourth phase of the project will see 19 statistical outputs moved to the platform in
the next two years. For some of these outputs, new functionality will have to be developed.
For example, the Business Register has been incorporated onto the platform, which has
created a need for new functionality to enable handing of units with data that does not
change every month, but does have complex ownership relationships that need to be
maintained in real time without creating performance issues. The investment for
development and implementation in this phase is greater as the platform is being scaled up
from a few users to hundreds of users. This requires intensive investment in reliability and
robustness of performance, with separate teams being established to support survey
migration activity and provide support for the new standardised platform. One result of
this is a change in focus from teams supporting individual surveys to teams supporting
clusters of surveys using common processing systems and common data storage.
The project to develop a microeconomic platform was not carried out in a way that
required a large investment upfront; rather, it was established and proven in stages over a
long period. A clear overarching vision guided the development but clear targets were set
for results in each phase. In the past, development would have been preceded by carefully
focused and relevant analyses by methodology teams before a start was made on the IT
requirements; these recent developments were approached in a different way that allowed
for a much more pragmatic decision-making process. Standard tools were predominantly
off-the-shelf rather than built in-house, so development work was more in the nature of
adding tools to the platform and optimising tools for particular collections rather than
starting from scratch and redesigning entire collections. All collections migrating to the
new platforms are expected to adopt the available standard tools and there are very few
exceptions. Teams are multidisciplinary and include methodologists, subject-matter
specialists, and IT developers. IT business analysts provide a link between methodology
and technology. They play a key role in ensuring that all business requirements are
articulated and that the implications of requirements in terms of statistical and business
architecture are understood.
Seyb, McKenzie and Skerrett: Overcoming the Design and Build Bottleneck 89
Changes to collections on the new platforms are carried out incrementally in small steps
rather than via a major effort in system development and implementation. Statistical
redevelopment is planned and implemented in a programme of work called the Statistical
Infrastructure programme, a ten-year rolling programme of statistical redevelopment to
maintain outputs at the desired quality where quality is considered in all its dimensions.
Examples include updating the industry codes in business surveys when the business
activity classification has been updated, changes in methods, and responding to real world
events such as the recent change in New Zealand’s rate of GST. A key goal for this project
is that all investment decisions around statistical development priorities take an
organisation-wide view. Until recently, redevelopment decisions were made indepen-
dently of quality and priority frameworks. A key difference between development in the
past and development on the new platforms is that in the past a change would need to be
applied in each affected collection separately, typically sequentially because of
dependencies between collections. Now many changes to collections can be applied to
all collections on the platform simultaneously.
A key to minimising production costs is the statistical toolbox, which includes standard
tools for common business processes, many sourced from other national statistics offices.
For example, editing and imputation uses the Banff and Canceis programs developed at
Statistics Canada (Statistics Canada 2005; Bankier et al. 2001). X-12-Arima is used for
seasonal adjustment, and QualityStagee is used for data integration. In this way, the
organisation promotes the use of standard tools for common processes including detecting
outliers, deterministic imputation, historic imputation, donor imputation (and many other
standard imputation models), seasonal adjustment, and data integration.
Tools in the toolbox are categorised according to whether they are current, emerging,
legacy, or graveyard tools. Emerging tools are under evaluation for inclusion in the
toolbox; current tools are those actively promoted for use within the organisation and
supported by the organisation; legacy tools have been identified as needing to be replaced
with more up-to-date versions; and graveyard tools are being phased out. The corporately
supported tools are not always the most efficient, but they usually represent the standard
methodological approach for common problems. Exceptions to the use of current tools are
only permitted by agreement at the highest levels of the organisation. The tools are
accessible from the platforms as a tools library that allows analysts to choose a tool and use
it in the production process the analysts are creating.
Standard tools have been made available on the production platforms as the need arises –
not all tools are currently available for use in the new production environments.
Methodologists are still exploring some tools; for example, Statistics NZ has been
evaluating the selective editing tool SELEKT developed by Statistics Sweden. However, it
isn’t clear yet how SELEKT could be used in a fully automated processing system. If the
goal is to score records based on the significance of any change, and then review the records
with the highest scores, then a simple scoring mechanism may suffice. In a number of cases,
tools have been modified to be of more use. For example, a version of Banff’s Proc Outlier
that includes significance criteria for identifying outliers has been developed, because of the
prevalence in business tax data of units that are extreme but also extremely small.
To achieve the organisation’s efficiency goals, production processes for designs using
administrative data are predominantly automated, as the volume of data precludes the
Journal of Official Statistics90
possibility of manual data editing. Unlike data the organisation collects itself, contacting
the data supplier to clarify data anomalies is not possible with administrative data. Full
end-to-end automation of business processes reduces manual editing of records, improves
data quality, and substantially reduces the time and staff required to produce statistics.
Adopting an analyst-driven approach has changed the underlying architecture of the
microeconomic platform. In the role-based approach, handovers of data and manual
intervention are minimised. Reliable large-scale processes automatically process data that
is stored in a central datastore. The goal is to make it easier for analysts to build and test
new configurations or make changes to existing production systems. The emphasis is on
building a highly flexible, rapidly repeatable process. Rule changes and manual repairs are
implemented at the end of each cycle and the whole process is repeated until the desired
outcome is achieved.
Examples of cost savings and improvements in quality include:
. The three administrative data collections and two business surveys currently using
the microeconomic platform are all using standard tools for each of their business
processes.
. Moving to the new platform has seen either a reduction in the size of each survey or
administrative data collection’s processing team; or a reduction in processing time; or
both.
. Analysts using the platform are able to move easily between the outputs because of
the common look and feel of production systems and the use of common tools.
. Complete audit trails are available of the changes to each record and this information
has allowed managers to easily review each output’s business processes and make
improvements in time and cost of production. For one of the first four outputs
introduced to the new platform, the publication has been brought forward.
. Statistical development for those outputs already on the platform is able to be carried out
without IT intervention in most cases, thereby reducing the cost of the work significantly.
The New Zealand Harmonised System Classification 2007 (NZHSC2007), used in
overseas merchandise trade statistics, was able to be updated to NZHS2012 by a single
subject-matter specialist. Data processing and checking is a single continuous process,
and all analysts access the same dataset. This has eliminated the problem of different
analysts holding and using different versions of the same dataset.
The platform has a high degree of flexibility in accommodating new methodologies. The
platform is able to load and process most common types of survey and administrative data.
Changes to editing and imputation strategies, such as adding new edits in response to
changes in the underlying data and using alternative imputation methods, are simple to test
and deploy. Standard statistical tools are available for most common business processes.
5. Governance
Significant governance is key to ensuring that generic solutions are delivered and that
Statistics NZ meets its organisational efficiency goals. Stats 2020 is a large and costly
programme of work, depending upon the success of over 100 multi-year projects. The
New Zealand government has made a substantial investment in the first four years of the
Seyb, McKenzie and Skerrett: Overcoming the Design and Build Bottleneck 91
programme, with additional funding of approximately NZ$60 million for operating costs
over that time, primarily funding common statistical infrastructure and common
platforms, methods, processes, and tools (Statistics NZ 2010). For that reason, there is
more oversight of the organisation by the government and a higher level of reporting
requirements than ever before.
The governance framework for the oversight and assurance of the Stats 2020
programme consists of a set of functional responsibilities that have been developed for
project management, governance, and project assurance. The Stats 2020 governance
framework is additional to the existing organisational governance model and is intended
specifically to support the delivery of the Stats 2020 programme. Such a formal approach
to monitoring the programme’s progress is necessary to ensure that the organisation is well
placed to report on progress to the government.
Governance bodies called portfolio committees have been established for clusters of
dependent and/or related projects. The portfolio committees monitor benefit realisation,
for instance that all projects in the portfolio are making their expected contributions to the
strategic priorities.
Each project has a project owner and a project manager who are focused on project
outcomes and project outputs respectively. Steering committees focus on the project
scope, financial risks, and roadblocks; they provide operational direction for the projects
and have a quality assurance role. Steering committees have the authority to make
decisions on specific project components, and enforce the organisation’s standards for
quality and risk management.
Decisions that result in changes to a project’s scope, timescales, or budget that are
outside agreed project tolerances are raised to the appropriate portfolio committee for
approval. The portfolio committee structure is different from the usual line management;
decision making is therefore independent of the usual line management considerations and
takes an OSS perspective.
Personnel are managed using a matrix-management model: line managers are
responsible for the day-to-day performance and development of their staff, and project
managers are responsible for the project management aspects of staff assigned to projects.
All projects are prioritised annually and decisions about resource allocation take into
account the priority of each project, always aiming to keep projects that have a higher
priority fully resourced.
A Transformation Office provides programme assurance. The Transformation team
monitors the programme from a benefits perspective and provides independent strategic
oversight and advice to the Government Statistician. Key members of this team are portfolio
programme managers whose role is to provide strategic oversight across portfolios, advise
on progress, and identify opportunities to leverage change. In addition, a project
management team has been established to provide internal project management assurance.
The team provides training and support on project management and the organisation has
invested significantly in project management training for all project leaders.
This governance model is supported by:
. a Standards Review Board, which oversees the corporate standards and prescribes
their use.
Journal of Official Statistics92
. a statistical toolbox, which contains the current set of standard statistical tools that are
to be used in systems developments.
. steering committees that provide operational direction and quality assurance to the
clusters of projects.
. training for staff in how to assess the quality of administrative data, process
administrative data, and develop statistical products based either entirely on
administrative data or on a combination of data from different sources, and
. training for staff in how to use the standard tools and design statistical production
systems (e.g., common editing and imputation strategies for survey data and
administrative data, typical order of business processes, and monitoring process
quality).
Performance indicators associated with each of the Stats 2020 projects show baseline
and target information and an indication of the time frame in which benefits are
expected to be achieved. An example of a performance target might be lower end-to-
end production costs. When performance indicators measure end-to-end production costs
of products, the baseline is the direct operating cost of producing each product. Direct
operating costs are available from the finance system, which is detailed enough to allow
direct operating costs, such as time spent preparing for a release, to be separated from costs
associated with development work, since these activities are “coded” differently in the time-
keeping system.
6. Lessons Learnt
The move from stand-alone production systems to a model where generic components are
developed and delivered has been difficult. In the mid- to late part of the last decade, the
organisation tried to implement a large-scale project known as the Business model
Transformation Strategy (BmTS). It aimed to create an organisation-wide framework of
standard processes and systems for statistical production. The BmTS was designed to
achieve this through a programme of projects – each project delivering different
components of a complete end-to-end processing system (Savage 2008). For example, one
project would deliver an input data environment for physical data storage; another project
would deliver an output data environment for data dissemination.
The Legolution system is one example of a processing system developed using BmTS
principles (Savage 2008). It was developed in 2005 to process a suite of surveys measuring
business performance (e.g., the Research and Development Survey). Legolution provided
generic data editing and imputation, using Banff, a data editing and imputation system
developed by Statistics Canada (Statistics Canada 2005).
Many of the principles that have been adopted for the microeconomic statistics platform
had been tried out in the BmTS-based systems. For example, every output processed in the
Legolution system had a documented data editing and imputation plan, which included
measures of processing quality to enable monitoring of the system and allow continuous
improvement. Unfortunately, the project had to be de-scoped during the initial
development because the work involved in creating a generic solution applicable to
more than one survey had been underestimated and, as a result, the solution was not as
generic as first specified.
Seyb, McKenzie and Skerrett: Overcoming the Design and Build Bottleneck 93
The BmTS project struggled to deliver some key elements within the time, scope, and
budget constraints imposed by user needs. Ultimately the programme was cancelled
(Savage 2008). The short time frame for delivery was at odds with the large scale of the
components being developed. Also, building generic components in separate projects
resulted in incompatible solutions. The generic lost out to the specific, causing affected
projects to reduce their scope and diverge in order to meet the immediate business goals of
each project. At the time, it seemed that the drive for standardisation was lost. However,
the ideas and lessons learnt had been carried forward:
. The BmTS goals of standardisation and an integrated data environment are kept in
mind but reprioritised to make business delivery the focus and generic features more
staged.
. Development teams adopt agile software development techniques (e.g., Highsmith
2004). The system is developed and delivered incrementally so that analysts are able
to conduct tests very early on and their feedback is used to improve the product.
Prototypes are developed using real data to ensure the final product is fit for purpose.
. Subject-matter specialists and methodologists adopt a more hands-on and involved
approach, becoming part of the development team and involved in all aspects of
testing and delivery. The team responds to change rather than working to plan. The
incremental approach allows for changing user needs while minimising costs.
Now, seven years on, the goals of the BmTS are beginning to be realised through the
microeconomic statistics platform.
Providing subject-matter specialists with generic highly automated production systems
is not enough to change an organisation’s culture. Traditionally, Statistics NZ has had
what is known as a process culture: there was little or no feedback and people focused on
doing things right rather than on doing the right things. The organisation was a typical
hierarchical government department where predictable and consistent systems and
procedures were highly valued and people had delegated authorities within a highly
defined structure.
In this process culture, decisions about statistical maintenance of outputs were made
independently of prioritisation and quality frameworks. The decisions were driven by the
need to replace aging production systems. Because they were reactive rather than planned
for, IT systems developments were exceedingly expensive and, because they happened at
widely spaced intervals, resulted in production silos, unique production systems for each
survey run by Statistics NZ where any further changes to systems (e.g., updating
classifications) could only be made by IT teams. Different production systems for each
survey meant it was difficult for people to move between surveys without a significant
amount of training and analysts became experts in processing data and troubleshooting IT
systems rather than in data analysis.
The new platforms allow statistical maintenance to be carried out in small regular
increments and use standard tools for common processes. The advantage of the change to a
cluster approach (i.e., groups of surveys and administrative data collections processed on
the same IT platform using the same tools for editing, imputation, confidentiality, data
dissemination, and analysis) is that analysts have more time to concentrate on data
analysis. When statistical maintenance is required, the new platform is highly configurable
Journal of Official Statistics94
so changes are easy to implement and only minimal IT intervention is needed. For
example, a new classification can be introduced to the platform by a subject-matter
specialist. All they need to do is to change the metadata and business rules in the
configuration store. The impact of the classification changes can be tested in the scenario
area without any risk to existing statistical outputs.
It has not been easy to move from a process culture to a more constructive culture –
where quality is valued over quantity, creativity is valued over conformity, cooperation is
believed to lead to better results than competition, and effectiveness is judged at the
system level rather than the component level (Cooke 1987). Statistics NZ is still in the
early stages of achieving this transformation. The organisation has developed a strategy to
help teams understand and explore what the new environment means for them. The people
strategy has been broken down into two areas of work:
. a workforce programme, which focuses on building on people’s skills and capabilities,
and makes sure systems are in place to attract, develop, and appropriately reward
people, and
. a culture and change leadership programme, which focuses on supporting people
through change, developing strong leaders, and building a performance culture.
A key enabler of the culture change to date has been the adoption of an agile project
management approach for IT development projects. The agile approach involves setting
up multidisciplinary teams, planning the team’s work in manageable pieces that take a
short period of time to complete (e.g., two weeks), and then checking in with the team
regularly to monitor progress and remove impediments. Progress is very fast under this
approach and impediments to progress are identified and resolved quickly. While
developed primarily as an iterative method of determining requirements in engineering
development projects, it can be used in any team situation and has had the added benefit at
Statistics NZ of blurring role boundaries, encouraging all team members to help solve any
problem. Team capability develops very quickly and the team environment becomes more
conducive to the creation of innovative solutions.
7. Conclusion
Statistics NZ aims to produce statistics that are fit for purpose in a cost-efficient and
sustainable way. With the Stats 2020 programme of work, the organisation is developing
and implementing business architecture that will support the organisation’s goals.
Statistics NZ is sharing the knowledge and experience gained with other national statistics
offices both informally and formally, through the international collaboration network
instigated by the Australian Bureau of Statistics in 2010.
The move from stand-alone systems to large-scale IT platforms is underway. The large-
scale platforms will support the processing and analysis of multiple outputs and are based
around standard business and information concepts encapsulated in standard methods and
systems. Opportunities identified during the move include providing systems built in such
a way that subject-matter specialists can easily create new or modified outputs by applying
standard statistical tools and processes, or combining data from different sources, without
the help of IT teams. The use of standard tools and processes ensures that production
Seyb, McKenzie and Skerrett: Overcoming the Design and Build Bottleneck 95
systems are automated as fully as possible. Governance structures, a people strategy, and a
change leadership programme focused on moving towards a more constructive culture and
supporting people through change are in place to support it.
8. References
Bankier, M., Poirier, P., and Lachance, N. (2001). Efficient Methodology Within the
Canadian Census Edit and Imputation System (CANCEIS). Proceedings of the Annual
Meeting of the American Statistical Association, August 2001. Available at: http://
integrated-data-infrastructure-and-prototype.aspx (accessed December 2012).
Thomsen, E. (2002). OLAP Solutions. Building Multidimensional Information Systems.
New York: Wiley.
Received December 2011
Revised July 2012
Accepted November 2012
Seyb, McKenzie and Skerrett: Overcoming the Design and Build Bottleneck 97
Addressing Disclosure Concerns and Analysis Demandsin a Real-Time Online Analytic System
Tom Krenzke1, Jane F. Gentleman2, Jianzhu Li1, and Chris Moriarity2
This article focuses on methods for enhancing access to survey data produced by governmentagencies. In particular, the National Center for Health Statistics (NCHS) is developingmethods that could be used in an interactive, integrated, real-time online analytic system(OAS) to facilitate analysis by the public of both restricted and public use survey data. Datafrom NCHS’ National Health Interview Survey (NHIS) are being used to investigate, develop,and evaluate such methods. We assume the existence of public use microdata files, as is thecase for the NHIS, so disclosure avoidance methods for such an OAS must account for thatcritical constraint. Of special interest is the analysis of state-level data because health care islargely administered at the state level in the U.S., and state identifiers are not on the NHISpublic use files. This article describes our investigations of various possible choices ofmethods for statistical disclosure control and the challenges of providing such protection in areal-time OAS that uses restricted data. Full details about the specific disclosure controlmethods used by a working OAS could never be publicly released for confidentiality reasons.NCHS is still evaluating whether to implement an OAS that uses NHIS restricted data, andthis article provides a snapshot of a research and developmental project in progress.
Key words: Confidentiality; data utility; disclosure risk; statistical disclosure control.
1. Introduction
To meet data user needs, a battery of systems for facilitating access to data need to be
provided. The battery of systems that a government survey organization offers to facilitate
data access must be integrated, not just to maximize usefulness and convenience to users,
q Statistics Sweden
1 Westat, 1600 Research Boulevard, Rockville, MD 20850, U.S.A. Emails: [email protected];[email protected] National Center for Health Statistics, 3311 Toledo Road, Hyattsville, MD 20782, U.S.A. Emails:[email protected]; [email protected]: The authors of this article are employees of NCHS and of Westat, NCHS’ contractor forinvestigating, developing, and evaluating disclosure avoidance methods for possible use in a future onlineanalytic system for NCHS survey data. The UCLA Center for Health Policy Research is also serving as asubcontractor. The findings and conclusions in this article are those of the authors and do not necessarily representthe views of the National Center for Health Statistics, Centers for Disease Control and Prevention. The authorsgratefully acknowledge the many individuals who are contributing to the project. We thank NCHS staff,including Brenda Baker, our original contract Project Officer, for her attention to this project; Susan Jack, whoprovided valuable assistance on the extensive preparations of variables in the underlying microdata test files; andJacqueline Lucas, who assisted in providing the necessary microdata test files. At Westat, we are grateful toMichele Harmon, our Project Director, for her oversight on this project, and to Craig Ray for his leadership andexperience relating to system development. At UCLA, special thanks to AJ Scheitler and Alberta Soranzo forsharing their experience and providing their input on the interface design. We are also indebted to the IntegratedHealth Interview Series staff at the University of Minnesota for providing advice in variable selection andassistance with classifications for variables used in NHIS test files. Lastly, the authors are grateful for the specialmethods review conducted by Natalie Shlomo.
Journal of Official Statistics, Vol. 29, No. 1, 2013, pp. 99–124
but also for disclosure avoidance. Maintaining confidentiality (which is mandated by law
and which is critical to continuing survey respondent cooperation) is becoming
increasingly complex as data user sophistication and access to technology increase. This
article describes how the National Center for Health Statistics (NCHS), the official health
statistics agency of the United States federal government, is developing methods that
would be required to offer to the public an interactive, integrated, real-time online analytic
system (OAS) to facilitate analysis of both restricted and public use survey data. Data from
NCHS’ National Health Interview Survey (NHIS) are being used to investigate, develop,
and evaluate such methods. Detailed information about the NHIS is available at: http://
www.cdc.gov/nchs/nhis.htm.
An OAS must be integrated with existing means of data access and must also within
itself deal with the tradeoffs between providing access to data and observing the agency’s
own rules and laws for protecting confidentiality. The NHIS website releases annual
public use NHIS microdata files as well as documentation and numerous analytic reports
(NHIS 2010, 2011). Like all of the surveys conducted by the NCHS, the NHIS has a
mandate to protect the confidentiality of survey participants. Personally identifiable
information (PII), such as persons’ names, is not released. Certain “restricted variables,”
including U.S. state identifiers, lower-level geographical identifiers, and sensitive
variables, are not available in public use files (PUFs) because the combination of low-level
geographic data and demographic data on an individual microdata record could lead to a
breach of confidentiality. In general, this means that detailed versions of indirect
identifying variables are not released to the public. By “indirect identifying variables,” we
refer to variables that are factual in nature, such as age, gender, and geographical area, and
that can reveal the identity of an individual when used in combination.
The NCHS alleviates limitations on public access to its restricted data by providing
access to NCHS restricted data through its Research Data Center (RDC) (NCHS RDC
2011; Meyer, Robinson and Madans 2012; http://www.cdc.gov/rdc/).
The NHIS was designed mainly to produce national estimates. However, the NHIS
collects data in all 50 states and the District of Columbia, and the NHIS sample is designed
so that NHIS data are representative of the target population (the civilian
noninstitutionalized population) at the state level as well as at the national level. As
discussed in Gentleman (2012), analysis of state-level data is appropriate and desirable for
studying the U.S. health care system because the U.S. health care system is largely
administered at the state level. Nevertheless, appreciable numbers of state-level NHIS
sample sizes are normally too small for analysts to produce stable state-level estimates from
a single year of data. Sometimes, satisfactorily precise state-level estimates can be produced
by combining two or more adjacent years of data. However, for confidentiality reasons,
NCHS does not include any state identifiers on the NHIS PUFs. Thus, when NHIS state
sample sizes are insufficient for a particular state-level analysis, an NHIS data user from
outside NCHS who wishes to perform that analysis must currently utilize the NCHS RDC.
In developing a new policy to provide access to restricted microdata, an agency must
identify and consider what types of data access already exist (such as through an RDC) so
that new uncontrolled or inadvertent risks to confidentiality are not created. In particular,
the disclosure avoidance methods needed for an OAS are highly dependent on whether or
Journal of Official Statistics100
not PUFs are also produced, because users of an OAS can compare its results with PUFs
and analyses thereof.
The NHIS has been in the field since 1957. Since 1997, the Family Component of the
NHIS has collected data about persons of all ages in each family within each interviewed
household, and additional data have been collected about one randomly selected child (the
“sample child”) and from one randomly selected adult (the “sample adult”) in each family.
The existence of a PUF (and any other publicly available linkable file) makes the creation
of an OAS for the NHIS particularly challenging, as discussed in this article.
The OAS under consideration for use with the NHIS would use NHIS data starting with
the 1997 data year. It would integrate two real-time OAS subsystems in a manner
that would be transparent to the user: 1) “Subsystem P,” which uses only public use data;
and 2) “Subsystem R,” which uses its own underlying microdata files containing selected
restricted data (e.g., state) as well as public use data. All developmental work assumes this
system design. In addition, OAS analyses would be performed in real time with no pre-
prepared results.
NCHS is still evaluating whether to implement an OAS that uses restricted NHIS data,
and this article provides a snapshot of where the OAS research and development project is
at the time of writing. Therefore, it is important to note that all aspects of the system
discussed in this article are under evaluation, including, as examples, a utility to allow the
user to combine categories of variables, the parameters for thresholds on unweighted
counts to determine whether or not to deny results from being shown to the user, and the
Statistical Disclosure Control (SDC) treatments.
The OAS approaches discussed here are generic for agencies/organizations that conduct
household sample surveys, provide PUFs, and have confidentiality constraints. We do not
attempt to explore disclosure risks related to administrative records data or to data with
highly skewed distributions, such as data from establishment-based surveys.
In Section 2, we discuss OAS features being considered, including general data
management for data to be accessed in the integrated system, analysis methods, and
transmission and storage of the results of analyses. Section 3 presents a discussion of
challenges and trade-offs that impact design decisions. Section 4 describes the main
disclosure threats to such a system and investigations of how to protect against such risks.
Section 5 presents various statistical disclosure control (SDC) treatments under
consideration. An initial evaluation of some SDC approaches is discussed in Section 6
in terms of their impact on disclosure risk and analytic utility. Lastly, concluding remarks
are given in Section 7.
2. General OAS Features
The general system architecture for an OAS such as the one under consideration for use
with the NHIS would include the distinct system components that are described below and
depicted in Figure 1.
User interface. For greatest efficiency and cost effectiveness, it is necessary to include
the interface design as an integral part of the system development. For the OAS under
development, the user interface is implemented through a web-based, statistical reporting
tool, for which the challenge is to arrive at a single interface that provides a
Krenzke et al.: Addressing Disclosure Concerns 101
user-friendly environment that appeals to a wide audience. The interface would
accommodate sophisticated queries as well as guide novice users effectively through the
system to generate results that meet their needs.
Metadata database. A metadata database is needed to provide the capability to easily
define datasets and to group variables into logical “folders,” to enable selected options for
statistics and missing values, and to define the contexts in which each variable can be used.
A metadata database helps to determine which full-sample weight is needed to request
estimates from different sub-questionnaires, to provide information about rounding rules
for each variable, and to indicate the data years for which each variable is available. The
metadata database is impacted by disclosure risk concerns. For example, it will contain
information to help integrate the two subsystems. If a restricted variable (e.g., state) is
specified in the query, then Subsystem R, its SDC treatments, and the restricted data would
be used. The database would contain information on the subsetting population filter
variables for Subsystem R. If a restricted variable is not being used, then Subsystem P,
without restriction, would be used. System usage should be tracked within the database,
including information about queries to inform system managers about what variables are
most frequently requested. If the OAS database were, for example, implemented using a
SQL Server, the website would communicate with the database via a metadata and usage
class library.
Administrative tools. The system needs to include a suite of parameter-driven
administrative tools that allow for rapid configuration of projects using the same interface
and analytic engine. A parameter-driven system provides the flexibility to put in values
that define certain rules. For example, rounding rules can be turned off, or the amount of
rounding can be changed. Under evaluation is an administrative infrastructure to maintain
user profiles and project-specific configurations, and to migrate metadata from a staging
area to the production environment.
Survey microdata file. The integration of data sources would allow queries to be
requested using variables from multiple sources. It may be beneficial to combine data into
one large file with multiple sets of weights and sets of survey variables, and include several
survey years. The survey microdata files are impacted by disclosure risk since the
restricted data files may have been treated by random perturbation, while the
corresponding public use files may not have been perturbed for the same variables.
User queryrequest via
Internet userinterface
Firewall
OAS website
Firewall
Protected (web) zone
Restricted (data) zoneWeb serviceMetadata and
usage databaseSurvey
microdata file
Administrativetools
Fig. 1. General System Architecture from Query to Data Access
Journal of Official Statistics102
Types of analysis and analytic engine. The types of analyses under consideration for
the OAS include descriptive statistics (proportions, means, medians and other quantiles,
etc.), multi-way cross-tabulations, ratios, standardized rates, standard errors, confidence
intervals, and graphs. The graphing utility will only display estimates that have passed
disclosure-related threshold rules set up for the tables (e.g., as discussed in the introduction
in Section 5). More advanced statistical options could include choice of confidence
interval width and type and provide the capability to do significance tests to compare pairs
of cells in a cross-tabulation. Any changes to the types of analyses, such as a new approach
to estimating confidence intervals or adding new modeling capabilities, might require
enhancements to the analytic engine. With interface panels devoted to each components of
the query (e.g., selecting geography, variables for tables, statistical options), a natural
progression would be to add a new panel to the interface to devote to regression modeling
capabilities. In addition, the methodologies related to reducing disclosure risk are
relatively fluid and continue to develop with new approaches. For example, for regression
analysis, Reiter (2003) provides an approach to perturbing residuals prior to displaying a
diagnostic plot. Chipperfield and Yu (2011) provide a discussion of disclosure rules
applied to regression analysis in an OAS. Once a system is launched, if an SDC treatment
is enhanced or changed, it could impact on the consistency of results from prior runs.
Therefore, a balance between reducing disclosure risk further and the impact on data
utility would need to be considered.
A benefit is that since the analytic engine is a portable utility (i.e., un-plug and plug-in
capabilities), it would allow for any methodological (statistical or disclosure-related) changes
and additions to be developed in-house and uploaded without disruption to users. The analytic
engine is optimized for speed of computation, and takes into account the complex sample
design when estimating sampling error. A replication method to estimate variances from
sample surveys with complex sample designs is being evaluated. Replicates are random
subsamples of the full sample, and replicate weights are created for each replicate to account
for the sample cases that were dropped from the full sample to form the subsample.
The existence of disclosure risk makes an impact on how the components of the OAS
architecture are constructed. We discuss further the disclosure threats with respect to
challenges faced during development in the next section, and we discuss the specific
disclosure risks, various limitations and SDC treatments later in the article.
3. Beginning the Work: Challenges and Trade-offs Relating to the System
Architecture
We describe here some challenges and trade-offs encountered and addressed during
the early phases of development of the OAS that may give others a head start in the
development of their own systems. The challenges for the architectural structure are
classified into three categories: 1) balancing risk, utility, and user friendliness; 2) system
issues; and 3) maximizing statistical methodology. We start by describing some decisions
that had to be made in balancing risk, utility, and user friendliness.
Decision about providing ways to combine multiple years of data. The utility of
Subsystem R can be increased through limited efforts of constructing consistent recodes
(new variables created from existing variables), values, and value labels across data years.
Krenzke et al.: Addressing Disclosure Concerns 103
Decision about what age groupings to permit. Data analysts would ideally be free to
choose whatever age groupings suit their specific subject matter, but the desired age
groupings, especially for health data, often are not common (e.g., five-year) age groupings.
An intruding user, if allowed to choose any age groupings, could deliberately select age
groups that differ by, for example, one year, which would make it possible for a
differencing/linking attack to occur. The topic of differencing tables is summarized in
Duncan et al. (2011), and an example in the context of official statistics can be found in
ONS (2006). Striving for flexibility in defining age ranges to meet the needs of the
data user led to the initial development of a dynamic utility for combining (but not
disaggregating) variable categories within the OAS.
Decision about the extent to which users should be protected from denials. Various
threshold rules were decided upon to deny tables of high risk. Threshold rules are
discussed further in Section 5. In an ideal OAS using NHIS data, analysts would be free to
request, for example, a state-level cross-tabulation involving any state. But requests for
analyses of states with small populations would very likely have to be denied by the
system because of unacceptably high risks to confidentiality.
Decision about the number of variables to allow in a given query. Initial
investigations show that limiting the number of variables used for subsetting the data so as
to define the subpopulation or creating universe of interest helps to reduce disclosure risk.
Therefore, decisions were made as to the maximum number of variables to allow (i.e., about a
dozen variables) and which ones were analytically important to keep for this purpose.
Decision about how much to tell users about the confidentiality protection methods
used. Analysts of perturbed data need to be warned that their analyses will have reduced
accuracy and increased inconsistencies due to the application of confidentiality protection
methods. A summary of approaches to perturb microdata is given in Duncan et al. (2011).
The following decisions address challenges relating to the subsystems.
Decision about integrating Subsystems R and P. It was decided to integrate
Subsystem R and Subsystem P because many users would not be able to or want to specify
to which subsystem they want to submit their queries ahead of time. This led to the
development of a smart system to determine which underlying microdata file to use (PUF
or restricted), depending upon the variables in a specific query. The challenge arises in the
handling of changes to the query as the user provides a developing series of specifications
for the desired analysis.
Decision about the structure of the underlying files. We were faced with several
options relating to file structures underlying the system. The decisions took into account
the size of the file, processing of integrated public and restricted data (perturbed), and the
various levels of the NHIS data (i.e., file types). Because a query that uses restricted data
must use perturbed data, it was decided to make a set of the files containing just the public
use data and a set containing perturbed restricted use data. This simplified the system
processing at the expense of higher storage costs.
The following decisions address challenges while attempting to maximize the statistical
methodologies available.
Decision about dynamic combining of categories. Without the ability to combine
categories, the user is constrained by the categorized versions of the variables in the
underlying dataset, with no ability to modify the variables. However, the combining of
Journal of Official Statistics104
variable categories increases disclosure risk, which must be attended to in developing the
system. The associated increase of disclosure risk due to dynamic combining of categories
is touched upon in Section 6.1.1. In addition, the decision to offer dynamic collapsing of
categories has several implications for creating estimates for a variety of statistics.
Decision pitting confidentiality against consistency. In an OAS using NHIS data,
analysts using Subsystem R to obtain state-level estimates will likely want to compare
those state estimates to national estimates. Using Subsystem R’s underlying microdata file
to compute both state-level and national estimates would provide consistency. For smaller
domains, intense exploration by an intruder of the differences between estimates produced
from Subsystem R data files and the same estimates produced from PUFs could result in a
threat to confidentiality. To avoid such intrusion, the current approach is for Subsystem R
to use PUFs to calculate any requested estimate that does not involve restricted variables
(e.g., a national estimate). Under that plan, some inconsistencies caused by differences
between Subsystem R’s underlying data file and the PUFs will need to be tolerated.
Decision about rounding rules. Rounding reduces the amount of detailed and precise
information. As an example, the NCES Statistical Standards Section 5.3 (NCES 2003)
addresses rounding rules that should be applied to numbers and percentages in text and
summary tables.
Decision about dynamic degrees of freedom. Degrees of freedom are used in
calculating confidence intervals and conducting significance tests. They are an indication
of the stability of the estimated sampling variance. In the case of an OAS using NHIS data
with a focus on providing state-level estimates, and because some states have a small
number of primary sampling units, the associated degrees of freedom could vary widely.
The dynamic approximation of the degrees of freedom in the OAS depends on the
subgroup, number of active replicates, the type of replication approach (which may require
the number of unique strata in the subgroup), and the type of statistic.
4. Challenges Relating to Disclosure Risk in an OAS
A major task is controlling risks involved within the data that can be exposed in a real-time
OAS. The main disclosure risk elements in an online table generator are 1) cross-
tabulations with small unweighted cell sizes, especially in the margins of the tables,
2) table linking, 3) weights that vary and variables with a large number of categories, and
4) table differencing. We expand on each of these risks.
There are different ways to define small cell sizes. By “cell size,” we refer to the
underlying unweighted number of respondents from which the weighted cell frequency
was calculated. Sometimes the “Rule of Three” is used based on the concept of
k-anonymity (Sweeney 2002), which specifies that at least three individuals must be
present (a count of at least three). The Rule of Three is based on the premise that a
singleton (a table cell that is based on one sample case) can possibly be identified by
another individual, while a cell count of two is susceptible to disclosure if a sampled
individual finds himself in the cell and deduces the characteristics about the other
individual in the cell. Singletons and doubletons (table cells that are based on one and two
sample cases, respectively) are typically high risk. A singleton is sometimes referred to as
a “sample unique.” Sample uniques are not necessarily unique in the population. Ways to
Krenzke et al.: Addressing Disclosure Concerns 105
find risky data values by estimating the probability of being a population unique are
discussed throughout the literature and summarized in Hundepool et al. (2012).
Table linking is an attacking technique used to string together information, called the
“matching key,” from several tables in order to form a microdata record on a singleton.
By “matching key,” we refer to a combination of variables from the restricted file that,
when used together, can be matched to a publicly available external file in order to
merge restricted variables (e.g., detail on geographic location) to the public file. This
type of table linking in the context of producing tables (albeit static, as opposed to real-
time in this article) when a PUF exists is described in the context of the Census
Transportation Planning Products (CTPP) on five-year American Community Survey
(ACS) data (Krenzke et al. 2011b) and the existence of the ACS public-use microdata
sample (PUMS). For the OAS, when a singleton exists in the marginal of variable S0
(e.g., a questionnaire or registry variable such as gender) in cross-tabulations with other
variables, and S0 appears in several explicit table queries, a microdata record can be
created for the singleton. Suppose a series of two-way tables (where a “*” means “crossed
with”) using other questionnaire or registry variables is requested, such as S0*S1,
S0*S2, : : : ,S0*S3, and suppose that a category in S0 is comprised of a singleton. The tables
can be linked together to define a microdata record for the single sample unit consisting of
values of S0, S1, S2, S3, : : : ,Sk, for k variables crossed pairwise with variable S0. Suppose
the series of tables is generated for a subgroup R¼1 defined by a restricted variable (e.g.,
State¼Maryland). This may allow restricted information, such as detailed geographic
information, to be assigned to a public-use record on an external file.
Fienberg (2009) summarizes various disclosure risks attributable to weights. Because
sampling weights almost always vary, tables with many cells that are generated from a
small universe usually would show unique weighted totals for selected cells that would show
up for other tables requested for the same universe, leaving the system susceptible to table
linking. By “universe” we refer to a key domain of interest to make inference about, which
could be a group or subgroup of persons specified by the user, and based on one or more
variables. Suppose S0 has two levels (such as gender), and there are three records with S0¼1.
The following series of tables (Table 1) shows the sum of weights for variable S0 being crossed
pairwise with S1 (six levels), then with S2 (eight levels), and then with S3 (four levels), for the
restricted subgroup R¼1. Other variables can be crossed pairwise in the same manner with S0
but are not shown here. Moreover, only the row for S0¼1 is shown in the illustration.
Suppose the sampling fraction is such that a weight of 1,000 is one of the smallest
weights on the file. As one example from the series of tables in Table 1, an intruder can see
a very small number 1,000 for S0¼1 and S1¼1, then 1,000 for S0¼1 and S2¼1, and
lastly 1,000 for S0¼1 and S3¼2. Therefore, the intruder can link the tables together using
the common variable S0 and determine that S1¼1, S2¼1, and S3¼2. Since 1,000
continues to appear in the tables, the intruder would grow in confidence that the cell is a
singleton. Even when two sample records fall into the same cell, as shown in the third part
of Table 1 where S0¼1 and S3¼1, one knows from the prior tables that the two
contributing weights are 3,000 and 3,500, since those are the only two that can sum to
6,500. With this intruder approach, the tables can be linked using their sampling weight to
arrive at pseudo-microdata records displayed in Table 2, which would serve as a
“matching key” to attempt to attach the restricted subgroup to the public file.
Journal of Official Statistics106
Differencing tables from multiple requests poses another challenging threat. By
“differencing,” we refer to an intruder attack where the difference is taken between common
cell estimates between two explicit tables displayed in the online tool in order to create
an implicit table (perhaps written down on paper). Suppose there are two tables that use
the same table variables but differ in the universe specification. Suppose both queries
successfully satisfy query threshold rules (such as the Rule of Three, which requires three or
more sample cases). These two queries may lead to an implicit table (the difference between
the two tables) that would have failed the query threshold rule if explicitly specified. This is
also sometimes referred to as “slivering,” since the multiple requests may create “slivers” of
universes.
Likewise, differencing tables from multiple requests on the same universe can lead
to the derivation of tables on subgroup slivers when “not applicable” populations occur
for items in different tables. Given the above risk elements, we formulate the
intruder scenario as it would relate to Subsystem R. We define the following groups of
variables:
R¼Set of restricted variables that would reside on Subsystem R only.
D¼Set of demographic variables and other indirect identifiers that reside on the public
use file (PUF) and within Subsystem R. The source of the variables could come from a
registry or the questionnaire. Examples are age, race, sex, and marital status.
S¼Set of questionnaire variables that reside on both the PUF and within Subsystem R,
which contain subject matter information, such as body mass index (BMI), duration
Table 1. Series of tables illustrating table linking due to weights for subgroup R ¼ 1
If 0 2 1 variables 0.001 0.0001Else if 25th percentile # 9 0.01 0.001Else if 25th percentile # 99 0.1 0.01Else if 25th percentile # 999 1 0.1Else if 25th percentile # 9,999 10 1: : : : : : : : :
Journal of Official Statistics114
determine the query restrictions, threshold rules, the parameters relating to dynamic
subsampling, and the rounding rules.
6.1. Impact on Disclosure Risk
Here we take the risks in turn with a discussion of table differencing (TD) and linking
implicit tables (LIT), and then record linkage (RL).
6.1.1. TD and LIT Risk
To reduce the risk due to table differencing and linking implicit tables, the following
Subsystem R treatments are being evaluated: query restrictions (e.g., the number of
variables allowed to define the universe and tables), threshold rules, dynamic subsampling,
and rounding rules.
Query restrictions and threshold rules. To evaluate the impact from query restrictions
and threshold rules, restricted NHIS test microdata files were used for six combinations of
data years (2009 and 2007–2009) and file types (Person (Family Core), Sample Adult, and
Sample Child). Restricted NHIS data were accessed at the NCHS Research Data Center in
Hyattsville, Maryland. While the sample size varies across the years, the 2009 Person File
had about 88,000 records, which was about four times as much as the Sample Adult File
and about eight times as much as the Sample Child File. The six combinations of years and
file types were processed first through an initial risk analysis.
Exhaustive tabulations were processed for a given set of variables, which formed m-way
tables. Given lower (MINDIM) and upper (MAXDIM) bounds for the table dimension size
m, n tables were formed by
n ¼XMAXDIM
m¼MINDIM
p
m
!¼
XMAXDIM
m¼MINDIM
p p2 1� �
· · · p2 mþ 1� �
m m2 1ð Þ· · ·1ð1Þ
where p is the number of variables used in the table generation. For example, suppose there
are p ¼ 20 total variables and all two-way, three-way, and four-way tables are created,
then 6,175 tables would be generated. If the number of cases in a cell was less than the
threshold, the cell was flagged as a violation cell, and the variables/categories used to
define the cell were identified as “contributing to cell violations.” Violation counts were
the number of times a record was in a violation cell. The percentage of cell violations for a
variable/category was computed as follows:
V ¼ 100½Vc=kc� ð2Þ
where Vc is the number of violation cells involving this variable/category c, and kc is the total
number of cells formed by this variable/category c. The above formulation can be adapted to
define universes in lieu of defining tables. The records were classified into a risk measure with
five categories (values 0 through 4), from low to high, based on the frequency that a record was
flagged for violations. Category 0 was assigned to the records with the lowest risk, and
Category 4 was assigned to records with the highest risk as determined by the violation counts.
The analysis compared different Universe Threshold Rules and Table Marginal Count
Threshold Rules. Examples of variables used in the initial risk analysis were state, Core-
Based Statistical Area size and status, urban/rural status, income groups, poverty status,
employment status, earnings groups, living quarters, family type, education attainment,
Krenzke et al.: Addressing Disclosure Concerns 115
house ownership status, gender, race/ethnicity, age, country of birth, citizenship, health
insurance information, height and weight of sample children, smoking status, and diabetes
status, among others. We note that the number of variables allowed to define the universe, or
table, had a large impact on the number of violations. The violation percentage was far
greater when three variables were used, and far less with one or two variables. Surprisingly,
combining years impacted the number of violations to a lesser extent. In general, threshold
rules provided much protection – without rules, tables would show small sample sizes or
singletons, and table linking could occur to form microdata records.
It is typically assumed that an intruder does not know if a given person is in the sample,
in which case the probability of disclosure for a sample unique is a function of the sample
selection rate and the indirectly identifiable data. As an alternative to the above risk
measure, many have considered the expected number of correct matches to a population
file for a sample unique to be written as:
GlobalRisk ¼XSU
ð1=Fkj f k ¼ 1Þ ð3Þ
where SU is the set of sample uniques, fk is the sample frequency in cell k, and Fk is
the population frequency in cell k. The aforementioned mu-Argus 4.2 manual provides a
discussion of how disclosure risk is measured as a function of the sampling fraction, when an
intruder knows that the unweighted cell count is one (sample unique). Investigation into the
use of models to provide more stable estimates of risk has been conducted by researchers
(e.g., Skinner and Shlomo 2008). A more extensive risk measure that takes into account the
measurement error (e.g., data swapping) is given in Shlomo and Skinner (2010).
When determining the level of disclosure risk a file may pose, other factors need to be
considered in conjunction with any single risk measure, such as the degree of potential
harm to individuals if data were disclosed and the presence of risk-reducing factors, such
as the level of geographic detail; availability of external data; age of the data; existence of
imputation, perturbed data, recodes; and variable suppression.
Dynamic Subsampling. The benefit of dynamic subsampling is displayed in the
following example. Suppose an intruder would like to make a table using a sparse category
1 of a three-category variable (A) as shown in Table 5. The intruder would be denied a
table due to the threshold rule. However, if the system allows combined categories, then
the categories could be combined in different trials: combining categories A¼1 with A¼2
and then A¼1 with A¼3 in separate queries. These explicit tables that pass the threshold
rules could be differenced to arrive at a table that involves category 1. The first two tables
show explicit two-way tables A0 £ X and A00 £ X, followed by the implicit table from the
difference of the two explicit tables. For each cell, the noise added to the cell estimate due
to subsampling is provided by aij and a0ij where i is the row and j is the column. The noise
from the subsampling is in unpredictable amounts, and therefore the intruder cannot
determine with certainty the value of X in the implicit difference table even though there is
a single case with a weight of 4,000 where A¼1 and X¼1. This is because the aij and a0ijdo not necessarily cancel out since the sum of RND is different in the row marginal, and
the amount of the difference between aij and a0ij does not have a defined limit.
Evaluations were conducted on the data to provide indications of the levels of aij and a0ijunder different subsampling scenarios. To understand the level of risk reduction through
Journal of Official Statistics116
subsampling, we found it best to incorporate all SDC treatments used by the system (i.e.,
subsampling, rounding, thresholds), and then evaluate the reduction in disclosure risk
through extreme examples where two universes differ by only one case. This allowed us to
make clear observations about the impact on risk reduction. Through such effort, we found
that when selecting a subsample in an OAS using simple random sampling there is a danger of
creating a sliver. Through further evaluation, we also determined that limiting the variables to
form universes greatly limits the ability to create implicit slivers with a sample size of 1.
We also note that we evaluated a post-tabular random rounding approach, and if relied
upon without subsampling or other post-tabular perturbation, we are skeptical about its
protection in the extreme case of a single case with A ¼ 1 and X ¼ 1. In this extreme
case, suppose 1 is the resulting amount added or subtracted to result in a rounded value of a
weighted cell frequency. Suppose cells are rounded to the nearest 1,000. When table
differencing (TD) explicit tables that differ by one case, the results allow a possible
identification of the true attribute since all cells but one would have a difference of 1,000,
0, or 21,000. If the direction of the rounding is only triggered by the sum of the RND
values for the cell, in order to retain cell consistency, then all cells in the implicit
difference table, with the exception of one cell, would have a difference equal to 0.
Therefore, when linking implicit tables (LIT), a set of true attributes can be revealed,
which then can be used in record linkage (RL). The amount of protection is related to, and
limited to, the size of 1 relative to the magnitude of the estimate.
Table 5. Illustration of dynamic combining of categories with subsampling
Krenzke et al.: Addressing Disclosure Concerns 117
Rounding rules. Deterministic rounding, as illustrated in Table 6, has a risk-reducing
effect on the TD-LIT-RL attack. As discussed above, for each cell, the amount added to
the cell estimate due to subsampling is provided by aij and a0ij, and we introduce bij and b0ijto represent the amount added or subtracted due to the rounding mechanism. The amount
of rounding depends on the original cell estimate and the amount of noise added
through subsampling. Therefore, as illustrated in Table 6, the bij and b0ij do not necessarily
cancel out.
6.1.2. Record Linkage (RL) Risk
Attempts were made to provide indications of the level of disclosure risk that remain for a
possible sample unique record that may leak through the threshold rules, possibly through
linking tables due to unusual variation in the weights across queried tables, for example.
Conditional on threshold rules being applied, and under the assumption that a series of
table queries were linked to form a microdata record, the risk due to the matchability to the
PUF was assessed. For the group of records in the highest risk stratum j determined
through state-level tabulations using the Subsystem R data (RkDkS), we use the key DkS
to attach R to the PUF. We expect EMj records to match if there was a one-to-one match,
where EMj is the number of Subsystem R records in risk stratum j. When the match occurs,
let AMj equal the actual number of records on the PUF (national level) that are matched,
including all one-to-many matches. Without perturbation or subsampling, then the general
risk measure for the highest risk records in risk stratum j was computed as RJ ¼ EMj=AMj.
This assessment for a group of risky records defined by the initial risk analysis provided a
general indication of the risk level.
6.2. Evaluating Subsystem R SDC Treatment Impact on Disclosure Utility
To analyze the impact of subsampling on data utility, an extensive analysis was
conducted on a wide variety of subsampling approaches. The evaluation included an
exhaustive tabulation of state-level two-way tables using selected variables, and the
relative difference between the full sample and the subsample estimates was computed.
The results of each run used the same rounding rules. Both universe and marginal
threshold rules were applied to suppress tables with too few cases in the universe or in
any margins. The average subsampling rates within table cells dropped gradually down
to a specified rate as the unweighted cell sizes increased. The results can be reviewed in
risk-utility charts, such as the one illustrated from one subsampling scheme as presented
in Figure 3. The chart summarizes the results from more than 1,500 tables that contained
over 20,000 cells. In the graph, the 10th, 50th, and 90th percentiles of the relative
differences in weighted counts are displayed at three levels: grand total, one-way tables,
and two-way tables. The size strata of the subgroups, one-way tables, and two-way
tables are labeled, with 1 indicating the smallest size (higher risk) and 6 indicating larger
size (lower risk). Since a calibration adjustment was done to ensure that the subsample
sums to the same weighted total as the full sample, the relative differences at the grand
total level are zero for universes of all sizes. For two-way table cells, the ratio of full
sample to subsample estimates has a median at 1 regardless of the cell sizes. The 10th
Journal of Official Statistics118
and 90th percentiles of the ratios show that subsample estimates for smaller cells deviate
more from the full sample estimates due to higher subsampling rates.
In addition, the impact of subsampling on standard errors can be simply computed as the
square root of the reciprocal of the relative difference in sample size. Table 7 provides
information on the increase to the standard errors, based on the number of records
deselected (q), relative to the number in the original sample (n).
6.3. Other Remarks Related to the Evaluation
If the risk measures indicate that risk levels are not acceptable, as determined by
the agency, then the perturbation rates, subsample rates, and other treatments, such as
6
5
4
6
5
4
3
2
1
6
5
4
3
2
1
Overall
1-way m
argin
al2-w
ay cell
0.90 0.95 1.00 1.05 1.10 1.15
Percentile of relative differences
Siz
e (1
-sm
alle
st)
10th percentile
Median
90th percentile
Fig. 3. Percentiles of ratios of full sample to subsample estimates by dimension and size
Krenzke et al.: Addressing Disclosure Concerns 119
rounding rules, will need to be adjusted. Another approach is to be more restrictive; that is,
adjust the threshold parameters to deny more tables, reduce the number of filter variables
allowed, and reduce the number of variables allowed when defining tables. If the utility
measures indicate that deviations are outside of tolerance bounds, then the parameters for
the SDC treatments need to be reviewed with the objective of reducing the amount of the
deviation. For example, the amount of data perturbation or subsampling could be reduced.
If correlations indicate that attenuation is occurring, then the perturbation approach would
need to be reviewed and adjusted by involving key variables in the process. As one can
see, trade-offs between risk and utility cannot be avoided.
Once a system is up and running, the performance of the system needs to be evaluated.
Performance of the system should be measured in terms of the time it takes from the
submission of the query to the display of the results, assuming good Internet connectivity.
The implementation of SDC treatment methodology, with the addition of dynamic
subsampling and/or calibration, may or may not add to the server processing time due to the
computations required for any one query. The extent to which the additional processing is
actually noticeable to the user should be measured. If the incremental time for each query
web request is excessively long, then improvements to performance may be attained by
reducing the file size, reworking the SDC code, or upgrading the server platform.
7. Concluding Remarks
Two general objectives of conducting a survey are for the data to be useful and for the data
to be used. As technology advances, however, the challenges of preserving confidentiality
while at the same time maintaining data access increase. This article has described how
we, like other researchers around the world, are striving to adapt systems architecture to
facilitate methods for making restricted survey data more accessible for analysis while
preserving confidentiality. The development of an OAS is a very large undertaking, but
such a system has the very worthwhile potential to simplify and increase accessibility and
use of the data.
Several components of systems architecture are impacted by disclosure-limitation
methodology. The user interface is impacted because the interface is dynamic to the query
being submitted. For example, if a state is selected for a query, then Subsystem R is
invoked and fewer and sometimes different variables are available for the analysis. Since
Table 7. Increase in standard errors when deselect-
February 1, 2013). University of California, Los Angeles Center for Health Policy
Research.
Woo, M., Reiter, J., Oganian, A., and Karr, A. (2009). Global Measures of Data Utility for
Microdata Masked for Disclosure Limitation. The Journal of Privacy and
Confidentiality, 1, 111–124.
Received January 2012
Revised March 2012
Accepted November 2012
Journal of Official Statistics124
A Potential Framework for Integration of Architecture andMethodology to Improve Statistical Production Systems
John L. Eltinge1, Paul P. Biemer2, and Anders Holmberg3
This article outlines a framework for formal description, justification and evaluation indevelopment of architectures for large-scale statistical production systems. Following anintroduction of the main components of the framework, we consider four related issues:(1) Use of some simple schematic models for survey quality, cost, risk, and stakeholder utilityto outline several groups of questions that may inform decisions on system design andarchitecture. (2) Integration of system architecture with models for total survey quality (TSQ)and adaptive total design (ATD). (3) Possible use of concepts from the Generic StatisticalBusiness Process Model (GSBPM) and the Generic Statistical Information Model (GSIM).(4) The role of governance processes in the practical implementation of these ideas.
Key words: Adaptive Total Design (ATD); Evolutionary Operation (EVOP); GenericStatistical Business Process Model (GSBPM); paradata; survey quality, cost and risk;stakeholder utility; total survey error.
1. Introduction: Systems Development, Implementation and Maintenance in the
Context of Total Survey Design
1.1. Definition and Evaluation of Systems for Statistics Production and Their
Architectures
Over the past two decades, large-scale production of official statistics has become
increasingly complex. Efforts to manage the resulting business processes and statistical
production systems have led to development of a literature on “architecture” for these
systems. Ideally, an architecture provides a reference point (used between and within
statistical organisations) for efficient coordination of common business processes,
information flows, production components, and development decisions. Architecture is
considered especially important for reduction of development and maintenance costs and
risks, for improvement of data quality, and for management of transitions from old to new
production systems. See, for example, Dunnet (2007), Penneck (2009), Braaksma (2009),
Pink et al. (2010), Sundgren (2010), Finselbach (2011), and UNECE (2011). In addition, a
system perspective has helped some statistical organizations to improve standardization in
q Statistics Sweden
1 Bureau of Labor Statistics, Postal Square Building, 2 Massachusetts Avenue, NE Washington DC, U.S.A.Email: [email protected] RTI, Research Triangle Park, NC 27709-2194, U.S.A. Email: [email protected] Statistics Sweden, Box 24300, SE-701 89 Orebro, Sweden. Email: [email protected]: This article benefited from many discussions with Mike Hidiroglou and several otherparticipants in the 2011 International Total Survey Error Workshop and the Statistics Canada Symposium 2011.In addition, Boris Lorenc provided invaluable contributions to the content and exposition of this article.
Journal of Official Statistics, Vol. 29, No. 1, 2013, pp. 125–145
order to reduce system complexity, and to identify redundant production systems. See, for
example, Sundgren (2007), Field (2009), Renssen and Van Delden (2008), Renssen et al.
(2009), Penneck (2009), Jug (2009), Gloersen and Saeboe (2009) and Studman (2010).
Work with system architecture has also strengthened international collaborations through
the use of common frameworks. See Vaccari (2009), Todorov (2011), ABS (2012),
Hamilton and Tam (2012a, 2012b), and UNECE (2012a). European Commission (2009),
Statistics Canada (2012), UNECE (2011), Sundgren (2011) and Munoz-Lopez (2012)
provide additional background on statistical architecture; and Sowa and Zachman (1992),
CIOC (1999, 2001), Rozanski and Woods (2005), OMB (2009) and The Open Group (2009)
provide background on architectural frameworks and architecture of systems in general. In
addition, the articles in this special issue of the Journal of Official Statistics discuss some
important aspects of architecture for statistical production systems.
The abovementioned references use somewhat varying definitions of the terms
“statistical production system” and “architecture.” For the current article, “statistical
production system” will include systems used for sample surveys (for which the statistical
organization exercises a high degree of control) and for statistical work with administrative
record systems and registers (for which the statistical organization may have a lesser degree
of control). In addition, the term “architecture of a statistical production system” (or simply
“architecture” for short) will mean an overall description of the system structure (input,
output and logic), its components (subsystems), their interrelationships, and the
performance characteristics of the components, the integrated system, and system outputs.
Inclusion of the performance characteristics will be crucial if the architecture is to be useful
to assist in improving a production system. For system output these would typically be an
overall account of system capability and ability to deliver what is required by the business
owner (ideally the same as the clients/users want). Section 1.2 below considers performance
assessments that contribute to the architecture. These assessments simultaneously depend
on methodology factors as well as factors of system design and development.
Careful descriptions of systems architecture generally require balanced discussion of
features related to management, methodology and information technology. It is important
that they contain views from all of these fields and that the descriptions are complementary
and compatible. For some purposes, descriptions at a very high conceptual level can be
useful, but practical evaluation and implementation generally require a substantial amount
of technical detail. These details often involve interactions among heterogeneous
subsystems, as well as evaluation of quality, cost, and risk factors over the full life cycle of
the system (Camstra and Renssen 2011; Munoz-Lopez 2012). Important system features
include efficiency, reliability, durability, maintainability, vulnerability, flexibility,
scalability, adaptability, and extensibility to future systems. These features are not unique
to statistical systems; see MIT (2004) and Rozanski and Woods (2005) for related comments
in a broader context.
1.2. Improving the Balance of Total Survey Quality, Cost and Risk in the Context of
Stakeholder Utility
Because statistical system architecture has developed to improve the balance of quality,
cost, and risk in production systems, it is useful to consider this architecture in the context
Journal of Official Statistics126
of total survey design and stakeholder utility. For general background on total survey
design, see, for example Biemer (2010), Groves and Lyberg (2010) and references cited
therein. For the current development, we note that a “total survey design” approach can
provide a useful conceptual framework in which to develop, implement, and evaluate a
wide range of methodological features, including work with frames, sampling,
instruments, fieldwork, estimation, and inference. In addition, schematic extensions of
the total survey design approach may help to provide a stronger and more systematic basis
for the integration of methodology with production systems and survey management. This
would involve three long-term goals:
(1) Provide a framework in which to explore the impact that specific features of the
system design may have on the balance among multiple performance criteria,
including data quality, cost, risk, and stakeholder utility. Each of these performance
criteria are multidimensional, and require evaluation over the full lifecycle of a
production system, including initial design and development, implementation,
continuing operations, maintenance, and periodic upgrades. This exploration may
involve direct effects of the system design as such, as well as interactions between the
systems design and relevant features of the methodological and administrative design.
(2) Use the framework in (1) to guide practical decisions related to resource allocation
and governance processes for methodological, systems, and administrative design.
(3) Use the results from (1) and (2) to identify specific areas of research that are most
likely to have a substantial impact on work at the interface of methodological,
systems, and administrative design.
The current article will focus on schematic extensions related to goal (1), while goals (2)
and (3) will be considered in future work. Consider a general survey design characterized
by a vector X, where the term “design” includes both formal design decisions and
implementation of those decisions. Components of X generally would include all features
of standard survey procedures, for example: development and refinement of frames and
related administrative record systems; sample designs; collection methods; review, edit,
imputation, and estimation methods; and procedures for dissemination of the resulting
estimates. Additional components of X include features of the computational systems used
to implement the abovementioned survey procedures, and features of administrative
processes that may have an effect on survey quality, cost, and risk.
In the development of this article, it will be useful to distinguish among factors
associated primarily with methodological (M), systems (S), and administrative (A) features
of the design, and we will partition the design vector X ¼ ðXM ;XS;XAÞ and related model
parameter vectors accordingly. In addition, performance of our survey design may be
affected by uncontrolled factors Z. These factors may include general features of the
statistical environment (e.g., quality of frame information, accessibility of sample units
through prospective collection modes, and the willingness of specific subpopulations to
cooperate with survey requests), availability of resources, operational constraints, and
changes in stakeholder needs for data. The factors Z also include process data and other
forms of metadata and paradata (e.g., data on contact histories, costs, and effort expended
at the unit level of effort, and incomplete-data patterns) as discussed in, for example,
Couper (1998) and Kreuter et al. (2010).
Eltinge, Biemer and Holmberg: Potential Framework for Statistical Production 127
We emphasize that each of XM, XS and XA may depend heavily on the statistical
production system components of the architecture. Also, the sensitivity of these
components to changes in Z may depend on the architecture.
We can characterize the performance of the resulting survey design in terms of its
quality, cost, risk, and stakeholder utility. In most practical cases, each of these
performance measures will be multidimensional. First, let Q represent standard measures
of data quality. This might include the components of a standard total survey error model,
as well as more qualitative properties like timeliness and relevance, as reviewed by
Brackstone (1999) and others. The quality measures may also include criteria developed
originally in the computer science and information systems literature, for example, use of
generally accepted systems design features, transparency of system architecture and code,
or performance of the system with specified test cases.
Second, let C represent the costs associated with the development, implementation,
maintenance and operation of the procedures; this includes costs for field operations,
systems work, dissemination and methodology. One may consider schematic models for
quality and cost, for example,
Q ¼ gQðX; Z;bQÞ ð1:2:1Þ
and
C ¼ gCðX; Z;bCÞ ð1:2:2Þ
where gQð·Þ and gCð·Þ have (nominally) known functional forms, and bQ and bC are
parameter vectors. In many cases, some or all components of bQ and bC are unknown.
Third, note that standard approaches to survey quality have tended to focus on issues
that arise from cumulative effects of a large number of random or quasi-random events,
such as separate household-level decisions on whether to respond to a survey request.
However, the performance of a statistical production system can be seriously degraded by
a small number of discrete events. For example, in many large-scale surveys, managers
devote considerable effort to prevention of catastrophic degradation in one or more
dimensions of quality. These efforts may include reduction of the probability of a given
failure, as well as development of system features that will ameliorate the effects of
failures that do take place. As a second example, Linacre (2011) and others have noted that
in the development of survey systems, there are substantial risks that the development
project might be aborted for a variety of reasons. For example, in many cases, termination
took place when it became clear that initial assessments of cost or quality effects were
unrealistic.
In principle, one could expand the definition of “survey quality” to include the
abovementioned problems. However, since previous literature on survey quality has
generally not included these issues, we will instead use a separate definition of survey risk
R as the combined impact of a substantial and discrete failure in one or more components
of a survey process. This would include degradation in survey quality, as well as failures in
database management; in system development, testing and maintenance; in confidentiality
protection for disseminated data; or in standard electronic data security. Characterization
of these components of risk generally will include the severity of the failure, the duration
and trajectory of recovery, effects of resource re-allocation arising from the failure, and
Journal of Official Statistics128
the related impact on institutional credibility and on perceived stakeholder utility. Thus,
for this discussion, the term “risk” incorporates the probability of a specific failure, its
direct and indirect costs, and its broader impact.
As in the case of quality and cost, the survey risk R generally will be multidimensional,
and we can consider a model
R ¼ gRðX; Z;bRÞ ð1:2:3Þ
where gRð·Þ is a function of general form and bR is a vector of unknown parameters.
Fourth, let U represent the perceived stakeholder utility of the resulting survey design as
implemented, and consider a model
U ¼ gUðQ;C;R;X; ZÞ ð1:2:4Þ
intended to link perceived utility with measures of quality, cost, and risk. In some
relatively simple settings, R is perceived to be negligible, gUð·Þ is the identity function and
U ¼ Q. However, in many cases, perceived utility is influenced by components of the
design or environmental factors that may not be captured directly through standard quality
measures Q. Furthermore, perceptions of utility may be influenced by components of risk
and cost. For example, the risk that data releases will not occur on schedule may reduce the
perceived value of these releases. Similarly, if cost structures are unpredictable from one
year to the next, then data availability in a future year may be problematic, which may in
turn reduce the perceived utility of the proposed production system.
In addition, note that Model (1.2.4) includes Q, C, and R (which are functions of X and
Z), and also incorporates X and Z directly. For example, let X1 be the design factor that
determines the level of geographical granularity in the publication; this may have a direct
effect on the perceived utility of the data release. On the other hand, let X2 be the design
factor that determines sample allocation across strata; this factor may affect U only
through the components of Q related to estimator variance.
Fifth, note that each of the performance measures Q, C, R and U will have distinct
subvectors associated, respectively, with development and implementation of the design,
as well as with ongoing production and maintenance. To simplify the exposition, we
will use “performance” as an umbrella term for all of our quality, cost, risk, and utility
measures at any point in the cycle of design, implementation, operations, and
maintenance, and will use
P ¼ gPðX; Z;bPÞ ð1:2:5Þ
to define the resulting “performance surface,” which is somewhat analogous to a
multivariate “response surface” considered in industrial quality control. In addition, we
emphasize that there are often complex multivariate relationships among Q, C, R and U,
and one could expand Model (1.2.5) to reflect these relationships.
Finally, in keeping with the term “schematic” we emphasize that Models
(1.2.1)–(1.2.5) are intended primarily to provide some structure for discussion of the
complex trade-offs among cost, quality, risk, and perceived utility encountered in large-
scale statistical work, and should not be interpreted in an excessively literal or reductionist
form. For example, some components of P may be measured with a reasonable level of
precision, while other important components may allow only very general qualitative
Eltinge, Biemer and Holmberg: Potential Framework for Statistical Production 129
assessments. Similarly, for some components of P, relationships with factors X and Z may
be reasonably approximated by, for example, a linear or nonlinear regression model, while
in other cases the relationships are highly fluid and not reasonably characterized or
estimated through standard statistical models with available data.
1.3. The Combined Effects of Methodological, Systems, and Administrative Components
of the Design Vector X
To address goals (1) through to (3) presented in Section 1.2, consider a relatively simple
linear form of the performance model:
P ¼ gPðX; Z;bPÞ ¼ bP0 þ bPMXM þ bPSXS þ bPAXA þ ðinteractionsÞ þ eP ð1:3:1Þ
Under Model (1.3.1), bP contains the intercept vector bP0, the main-effect coefficient
vectors bPM, bPS, bPA, and bPZ and the coefficient vectors for the two-factor and higher-
order interactions as needed. In addition, the error term eP is assumed to have a mean of
zero and a variance-covariance matrix VeP that may depend on the design variables X and
the environmental and process variables Z.
Eltinge (2012) and Eltinge and Phipps (2009) explored variants of Model (1.3.1) for
general survey design work. The current article focuses primary attention on the effect that
the system design vector XS has on the mean and variance functions of the performance
measures P. Specifically, in the use of Model (1.3.1), three topics of special interest are:
(a) System features XS that allow the measurement or (partial) control of specified
components of P. Examples include features that facilitate the collection and analysis
of data from a contact history instrument (CHI); computer-assisted recording (CARI);
cost accounting records; audit trails produced by microdata edit and review processes;
or disaggregated reports of interviewer activity linked with survey responses.
(b) System features XS that impose constraints on some components of the
methodological and administrative design vectors (XM, XA), or on the use of
information regarding environmental factors Z. For example, use of certain
standardized system features may preclude some types of local optimization of a
methodological design; or may limit the amount of process data that one may collect
on specific measures of cost, quality, or risk. Moreover, system constraints that do not
allow for poststratification or response-propensity adjustments would restrict the use
of such environmental information in Z for the improvement of survey weights.
(c) Direct effects of XS on P, through the main-effect coefficient bPS and related
interaction coefficients. For example, some system features may allow for improved
editing of collected data; timelier follow-up for nonrespondents; more flexible on-
demand production of estimates for special subpopulations; or real-time monitoring
of estimates based on data collected to date, as considered in some forms of
responsive design. In some cases, one may also consider the effect of XS on VeP, in
keeping with the study of dispersion effects in the response surface methodology
literature (e.g., Brennerman and Nair 2001, Bisgaard and Pinho 2003 and references
cited therein). However, dispersion effects appear to have received relatively little
attention in the survey and systems design literature to date.
Journal of Official Statistics130
The remainder of this article explores issues (a), (b) and (c) through the following steps.
Section 2 considers the use of the performance model (1.3.1) to inform design decisions.
Section 3 explores the relationship between the general model (1.3.1) and more specific
models developed for Total Statistical Quality and Adaptive Total Design. Section 4 links
the model, and related design decisions, with the Generic Statistical Business Process
Model (GSBPM) and the Generic Statistical Information Model (GSIM). Section 5
outlines related issues with governance processes that link the managerial design features
XA with the system design features XS.
2. Use of Performance Models to Inform Design Decisions
2.1. General Questions for Exploration of Design Decisions
Ideally, one would have extensive information on all relevant aspects of the performance
model (1.3.1), including identification of the applicable predictors X and Z (incorporating
both main effects and interactions); sufficiently precise estimates of the coefficients bP;
and the values of R 2 and other goodness-of-fit measures. Under such conditions, selection
of a preferred design X (including the systems design features XS) is arguably a
straightforward exercise in optimization or satisficing, based on the specified multivariate
performance criteria.
In most practical cases, however, currently available empirical information falls far
short of the abovementioned ideal. Consequently, it is important to apply standard
concepts from social measurement and response surface methodology to describe the more
limited types of design information that may be feasible to obtain, and that may be useful
in practical work with the systems design features XS. The following questions are of
particular interest:
(A) What practical design decisions are under consideration? Examples include:
(A.1) Design of a survey that is mostly or entirely new. For this case, one would seek to
understand the extent to which previous experience with somewhat similar surveys may
offer partial insights into the performance surface for the proposed new survey. Beyond
that limited information, evaluation of the performance surface will depend primarily on
new empirical work, such as small-scale tests of system components and of the interfaces
of those system components with specific methodological or managerial design
components.
(A.2) Comprehensive revision of one or more survey design features, while leaving
other design features largely unchanged. Here, it will be important to identify the extent to
which design components that are subject to change will have substantial interactions with
other factors in the performance surface (1.3.1). If the changed components influence the
performance surface only through main effects, then it may be relatively simple to assess
the likely performance of the survey under the proposed new design. On the other hand, if
the changed components enter Model (1.3.1) through complex interactions, then
evaluation of performance under the new design may require extensive amounts of
additional empirical work.
(A.3) Incremental revision of one or more design features. In this case, detailed
empirical information on the performance surface (1.3.1) under the previous design may
Eltinge, Biemer and Holmberg: Potential Framework for Statistical Production 131
provide important insights into likely performance under the new design. This final case is
somewhat analogous to “evolutionary operation” approaches considered in industrial
response surface methodology. See, for example, Box (1957) and Box and Draper (1969).
(B) Out of the many potential performance characteristics reviewed in Section 1, which
features are of primary interest to the survey organization? Are there practical and
objective methods available to measure these performance characteristics? If not, what
methodological, systems or management work should one carry out to develop and
implement such measures?
(C) Within the context defined by parts (A) and (B):
(C.1) What information is currently available regarding Model (1.3.1), including its
functional form, dominant main effects and interactions, and parameters bP and VeP?
(C.2) Does the information in (C.1) provide sufficient information to guide the practical
decisions identified in (A)? The definition of “sufficient information” will depend heavily
on the decisions of primary interest in (A). For example, for the extensive redesign work in
cases (A.1) or (A.2), it may suffice to have very rough order-of-magnitude indications of
the improvements in quality or cost likely to follow from the proposed changes in X.
Conversely, one may consider incremental revisions considered in Case (A.3) as part
of a modest effort to obtain moderate improvements in quality or efficiency; and
the corresponding definition of “sufficient information” may depend primarily on the
variances of available estimators of the coefficient vector bP. Similar comments apply to
cost, quality and risk measures related to the system development process itself.
(C.3) If the answer to (C.2) is no, what additional information is needed, and what
methods should be used to obtain that information (e.g., formal experiments, pilot tests, or
comparisons with industry benchmarks)?
(C.4) During development, implementation, operation and maintenance of a designed
production system, what are the ways in which available information will be used to
monitor performance and identify needed mid-course adjustments? This information may
include model parameter data from (C.1)–(C.3), the performance measures from (B), and
related paradata. In keeping with the cautionary note by Linacre (2011) cited above, it is
especially important to use relevant measures of cost, quality and risk incurred during
the process of system development and implementation, as well as performance measures
that apply to operation and maintenance of the production system after implementation.
(D) Are there external constraints that have an important effect on the design project?
These constraints may include standard methodological and managerial constraints,
as well as imposition of limits on certain system design features. For example, senior
management may mandate the use of specified security software, increased use
of standardized system features, or reduced funding available for specified types of
design work.
2.2. Questions Arising from Dynamic Features of Quality, Cost, Risk, and Utility
One may use Model (1.3.1) to characterize a survey process that is static, in the sense that
(after completion of design implementation) the coefficients bP are essentially fixed, the
design vector X is generally not subject to change, and the distribution of the paradata Z is
relatively stable. For this reason, some persons who specialize in one area of methodology,
Journal of Official Statistics132
management, or systems may tend to perceive the other areas as readily characterized by a
fixed set of “requirements.”
In many practical settings, however, the schematic models presented in Section 1.2 are
fundamentally dynamic in nature. For example, some environmental factors Z may vary
over time, and thus may have an effect on quality, cost, risk, and stakeholder utility. To
take one methodological case, changes in cell telephone and landline telephone use over
the past two decades have had a substantial effect on the quality characteristics of standard
random digit dialing surveys. In addition, during the recent recession, many stakeholders
had increased interest in unemployment rates and other labor-force characteristics, which
in turn led to changes in the linkage between perceived utility and standard quality
measures like accuracy and timeliness.
Similarly, both survey methodology and systems work are dynamic in nature, so the
schematic models for quality, cost, risk, and utility may change over time. Some relatively
simple examples of changes include the maturing of specific methodological features (e.g.,
more sophisticated use of incentives or nonrespondent-conversion techniques); improved
testing and robustness of complex skip patterns in CATI or CAPI instruments; or
amortization of costs related to methodology, training or systems development and
implementation.
Dynamics in the development and maturation of methodology imply that system
architecture work often must go beyond specification and satisfaction of static “system
requirements.” Conversely, dynamics in systems architecture, and in the needs of data
users, imply that methodologists must be open to considering a wide range of performance
criteria, some of which may differ substantially from traditional statistical performance
criteria like bias and mean squared error.
Consequently, it may be important to supplement questions in areas (A) through (D)
with additional questions that are linked directly with the dynamics of the survey process.
Some examples include:
(E.1) In keeping with a suggestion by Hidiroglou (2011, personal communication), what
are appropriate practical criteria to use to determine whether a given methodological or
managerial component has reached a level of “maturity” that warrants incorporation into
standard production systems?
(E.2) To what extent, and in what ways, should one try to build flexibility into
standardized systems to increase the likelihood that they will accommodate further
methodological refinements or managerial changes at a relatively low cost?
2.3. Approximations Arising from Standardization Processes
As noted in the preceding sections, work with system architecture often leads to discussion
of standardization of some or all of the components of a survey process across surveys.
Potential benefits of standardization include improvement in some components of data
quality (especially those related to failure to execute design features as specified), and
reduction of certain components of cost and risk. On the other hand, in some cases
standardization may prevent a given survey from making optimal use of survey-specific
information on, for example, characteristics of the underlying target population. In that
sense, an excessively rigid application of standardization may lead to degradation of some
Eltinge, Biemer and Holmberg: Potential Framework for Statistical Production 133
components of survey performance. Similar issues have been noted for standardization in
some areas far removed from survey work. For example, Hall and Johnson (2009) discuss
distinctions between environments in which a process may be improved through the
application of “art” or “science” respectively. Extending their general ideas to the
statistical performance model (1.3.1), one could suggest that extensive use of
standardization may be warranted when one can account for most of the variability of
cost, quality, risk and utility through some simple predictors X that correspond to highly
standardized design features. Conversely, standardization may be problematic when much
of the variability of cost, quality, risk and utility are attributable to the uncontrolled
environmental factors Z, unobserved remainder terms eP, or design components X that
correspond to highly customized design decisions.
3. RelationshipWithModels for Total Statistical Quality and Adaptive Total Design
Sections 1 and 2 were developed in the context of general performance measures P. To
date, the survey literature has devoted a large amount of attention to some quality
measures Q, some attention to cost structure (e.g., Groves 1989), and relatively little
attention to survey risk R and stakeholder utility U. Consequently, this section reviews
some previously developed strategies for continually improving the quality of system
outputs in real time as the outputs are being generated. In previous literature, this approach
has been given several different labels, including active management (Laflamme et al.
2008), responsive design (Groves and Heeringa 2006) and adaptive design (Schouten et al.
2011). It may be of interest to develop similar approaches for C, R and U in future work.
As with many cases involving high-dimensional objective functions, a focus on specific
subcomponents can lead to suboptimization, but nonetheless may be necessary for
tractability.
For the current discussion, we will focus on a strategy known as Adaptive Total Design
(ATD), as presented in Biemer (2010). ATD aims to reduce the risks of poor data quality
in survey processes by using concepts embodied in the total survey error paradigm. In the
notation defined in Section 1, ATD seeks to maximize Q under a constraint on C by
selecting design features X so that Q(X,Z) is maximized subject to the constraint C(X,Z)
, CT where CT is the data collection budget.
Alternatively, the ATD may seek to minimize the total risk, R(X,Z), subject to the same
budget constraint. At the present time, ATD has only been applied for the data collection
process. See, for example, Carly-Baxter et al. (2011) and Cunningham et al. (2012).
In addition, some important features of ATD have been implemented in other data
collection work. For example, Calinescua et al. (2013) apply some elements of ATD to
control nonresponse and measurement error in the initial design, but their approach does not
incorporate quality monitoring and improvement during data collection. Wagner (2008)
uses adaptive design to reduce the effect of nonresponse on the estimates during data
collection; however, his work does not attempt to control other types of nonsampling errors,
such as measurement error or frame error. Further generalizations to other components of
the GSBPM framework are conceivable and will be discussed subsequently.
To illustrate the principles of ATD for real-time, quality improvement we begin with a
preliminary assessment of Z, say Z0, and available budget CT. We choose an initial design
Journal of Official Statistics134
(or, as in the current case, a data collection approach) X0 which we believe will produce the
optimal quality level Q*. However, typically, the quality level produced by X0 will not be
optimal because either gQ and/or gC are usually misspecified in the initial design or the
initial assessment of Z was not current or otherwise did not describe the true, current
process environment. Suppose that, during the implementation of the process, new
information on Z, say Z1, is obtained. Based upon Z1, the initial design X0 may no longer be
optimal; that is, the quality level that can be achieved by X1 is Q1,Q*. In order to achieve
a quality level that better approximates Q*, the preliminary design must be altered to some
extent, say, to X1 while still ensuring that the budget, CT, is not exceeded. As the process
continues to completion, there may be new assessments of Z, say, Z2, Z3,: : : with
consequential design alterations, X2, X3, : : : .
ATD relies on one’s ability to obtain updated information on Z during production and
perhaps better specifications of gQ and/or gC so that Q(X,Z) can be re-estimated, leading to
a re-optimization of the design. For example, in the data collection setting, information on
interviewer field performance may be continually updated as the interviewers work on
their assignments. This information may relate to the cost of interviewing by area,
difficulties in contacting and interviewing certain types of sample units, sample unit
cooperation as a function of the unit characteristics, and so on. This information and other
paradata streaming in from the field constitute Zk for k ¼ 1, 2, : : : .
As the design is altered during implementation to achieve quality levels that
approach Q*, the budget must be continually assessed requiring precise estimates of the
cost to completion at each stage. For example, at the start of data collection, the full
budget CT was available. However, by the time that Z1 is observed, only C1 of the
original budget remains; that is, CT–C1 has been spent by the time Z1 is observed.
Therefore, in determining what interventions X12X0 are needed to achieve Q* under
Z1, the currently available budget, C1, must not be exceeded. Thus, the shift from X0 to
X1 is made that will produce a final level of quality Q1 where Q0,Q1#Q* where the
costs of X1 are constrained by C1. Note that the difference X12X0, referred to above as
design “interventions,” are changes in the original design necessary to achieve the
desired level of quality. This process of iteratively re-evaluating Z (i.e., Z1, Z2, : : :) and
applying interventions to achieve designs X1, X2, X3, : : : such that Q1,Q2
,Q3, · · · # Q* while holding total costs fixed at CT is referred to as Adaptive Total
Design (Biemer 2010).
To summarize, ATD begins with an initial design X0 which is optimal given Z0, and then
seeks to find a sequence of designs X1, X2, : : : ,Xk based upon the updated information Z1,
Z2, : : : and updated functions gQ and gC such that Q(Xk,Zk)¼Q*k, the maximum quality
that can be achieved for a total cost of CT. ATD can be thought of as a form of
Evolutionary Operation (EVOP; e.g., Box 1957; Box and Draper 1969 and Hahn 1982) for
data collections where the goal is to find the maximum of the performance surface under
cost constraints.
Some of the implications of ATD can be summarized as follows:
a. Paradata feeds the EVOP process by providing updated information on Z and the
specifications of gQ and gC.
b. Therefore, the goal of collecting paradata should be to:
Eltinge, Biemer and Holmberg: Potential Framework for Statistical Production 135
i. best inform those aspects of Z, gQ, and gC that are most predictive of Q
and C and
ii. best capture the dynamic nature of the data collection process.
c. It is important to monitor these paradata in order to maximize data quality because the
difference Qk – Q1 (i.e., the quality improvement after k ATD cycles) may be quite
large.
d. When the budget is reduced, the reduced budget, say CT1, CT, is entered into the ATD
optimization and the design X is reoptimized. This usually results in a lower level of
quality that can be achieved.
4. Possible Integration With the Generic Statistical Business Process Model
(GSBPM) and the Generic Statistical Information Model (GSIM)
Sections 2 and 3 explored the ideas of Section 1 in the context of general performance
models and Adaptive Total Design, respectively. Detailed conceptual and empirical
expansion of Section 1 also would require a detailed characterization of survey processes.
Over the past decade, several organizations have developed forms of this characterization.
See Dunnet (2007), Renssen and Van Delden (2008), Gloersen and Saeboe (2009), and
Pink et al. (2010). An effort to standardize these approaches and related terminology
through a Common Metadata Framework has led to a Generic Statistical Business Process
Model (GSBPM; Vale 2009) based largely on Statistics New Zealand’s business process
model.
The GSBPM has quite rapidly become a standard instrument to communicate between
organizations. This outcome arose from the resemblance of GSBPM to already existing
descriptive models, its successful union of terminology for higher level statistical
production processes, and good communication and anchoring. The GSBPM was
identified by the High-Level Group for Strategic Developments in Business Architecture
in Statistics (HLG-BAS) as a key standard for modernizing official statistics (UNECE
2011 and UNECE 2012a).
It would be premature to forecast specific impacts of the GSBPM, but its shared process
terminology has the potential to accelerate and improve development of common areas.
For example, it has already been used to pinpoint collaboration areas and to a certain
extent it helped in the harmonization of architectures (see Vaccari 2009). In addition, some
authors have suggested that the GSBPM also could be a framework for process quality
assessment and improvement (Todorov 2011) and that it will facilitate the sharing of
statistical software and components (Hamilton and Tam 2012a, 2012b).
An important complement to the GSBPM is the Generic Statistical Information Model
(GSIM). GSIM is described as “a reference framework of internationally agreed
definitions, attributes and relationships that describe the pieces of information that are used
in the production of official statistics (information objects). This framework enables
generic descriptions of the definition, management and use of data and metadata
throughout the statistical production process” (UNECE 2012b).
In particular, GSIM aims to define and describe in a harmonized way the information
objects that flow through and control the statistical production processes. The resulting
common framework may help development of shared production systems by improving
Journal of Official Statistics136
communication between distinct disciplines, for example, subject matter statisticians,
IT specialists and methodologists. GSIM is also aligned to standards such as DDI (Data
Documentation Initiative; http://www.ddialliance.org/) and SDMX (Statistical Data and
Metadata eXchange; http://sdmx.org/), but it does not depend on them.
In the future, the GSBPM and GSIM (or similar frameworks) could be valuable for
exploration of the schematic approach outlined in Section 1, and related topics considered
in this special issue of the Journal of Official Statistics. Two cross-cutting areas may
warrant special attention. First, GSBPM (or similar national models) could lead to
standardized and perhaps highly modular production systems and architectures, and GSIM
could support standardized handling of information objects in a complex production
system. Stated in terms of Models (1.2.1)–(1.2.5), the resulting modularity could have an
effect on system performance through both the XS and Z factors. Some effects may be
related to XS because modularity (more subsystems/components) will require system
design with higher attention directed toward the system’s life cycle factors. If a system
fails when one of its components fails, then increased standardization and reuse of
components will increase the importance of managing the full spectrum of risks. This
includes risks associated with individual components, integration of these components,
and performance of the overall production chain. In addition, if standards and
harmonization of information objects lead to more system components that share data,
then the resulting production systems may have performance that is less subject to
uncontrolled environmental factors Z. An arguably desirable development would be that
some factors that today are observable but not controlled (i.e., Z terms) can be replaced
by controllable design factors XM or XS. One such example could be automation of
certain parts of a production system. Hamilton and Tam (2012a, 2012b) and Borowik et al.
(2012) provide thoughts about possible future modular production systems where attention
to these matters is needed.
Second, one could consider expansions of the GSBPM that would incorporate in-depth
collection and use of information on costs and data quality throughout the process chain.
Although quality management is present in the model as an overarching process, it is not
reflected specifically in the model phases or subprocesses. For example, as noted above, an
important part of the design work is the design of ATD monitoring and improvement
components that run simultaneously with, and gather data from, the processes. These
components are critical for updating Z and respecifying X to optimize Q in real time; and
are implemented later, during data collection. Likewise, our ability to conduct post-survey
data quality evaluations requires that components are in place to capture the relevant data
on survey errors that aid these evaluations. In addition, systems for quality control are key
components of work with initial development, as well as data collection and processing.
Quality control components need to be developed and implemented to assure both product
and process quality. Finally, documentation on data quality is a critical component of data
dissemination and archiving. These are just a few areas of the GSBPM where quality
management could be emphasized by providing specific references to subprocesses that
address ATD-related improvements to data quality. In this regard, the current version of
the GSBPM seems to emphasize statistical standards (i.e., standards related to data
production). However, it provides relatively little coverage of quality standards (i.e.,
standards related to quality improvement) and of quality functions like the measures Q
Eltinge, Biemer and Holmberg: Potential Framework for Statistical Production 137
considered in Section 1 above. The European Code of Practice (available from http://epp.
þBusinessþProcessþModel. (accessed February 12, 2013).
Wagner, J. (2008). Adaptive Survey Design to Reduce Nonresponse Bias. Unpublished
Ph.D. dissertation, University of Michigan, Ann Arbor, MI.
Received May 2012
Revised November 2012
Accepted November 2012
Eltinge, Biemer and Holmberg: Potential Framework for Statistical Production 145
Discussion
Daniel Defays1 and Jean-Marc Museux1
1. Preamble
This discussion draws mainly on four contributions in this special issue (those of Statistics
New Zealand, NASS, RTI International and Statistics Netherlands) that report on
experiences in integrating statistical production systems with a direct focus on
industrialisation and integration-related issues. The framework proposed by Eltinge et al.
for the integration of architecture and methodology is also taken on board. The article on
the Real-Time Online Analytic System (Westat/NCHS) is marginally integrated into the
discussion on data access.
2. Introduction: Systemic Issues
The articles from Statistics New Zealand, NASS, RTI and Statistics Netherlands all focus on
efficiency gains through the integration of production systems. In most cases, the
re-engineering of the systems that is necessary for integration leads to quality improvements
through greater consistency and timeliness of statistical outputs. The systems also aim to
give greater control to survey managers and the flexibility they need to optimise their
processes. As a result, overall quality is better managed, opening the way for Adaptive Total
Design as described by Eltinge et al.
Integration requires an overall framework (sometimes referred to as an architecture) for
organising production systems. For methodologists and survey managers, architecture is a
new concept which is worth close examination. The question “What is in an architecture?”
is not easy to answer. What kind of new methodological issues does this raise? How is the
concept of quality related to the concept of architecture, beyond the traditional quality of
a survey or of a system designed to process information? Moreover, as the Statistics
Netherlands article asks, how do we get from the concept of total survey design to total
network design? Does this question our traditional definition of quality, which so far has
been very much linked to a single data collection rather than to a set of data collections?
We will reflect on those issues through an analysis of the work carried out in different
fora and described in the articles produced by Statistics New Zealand, NASS, RTI and
Statistics Netherlands. Our approach is compatible with, and complements, Eltinge et al.,
q Statistics Sweden
1 Eurostat, Directorate for Corporate Statistical and IT Services, Batiment Jean Monnet, L-2920 Luxembourg,LUXEMBURG Emails: [email protected] and [email protected]: Authors wish to thank Walter Radermacher, Chief Statistician of the European StatisticalSystem, for support and inspiring comments.
Journal of Official Statistics, Vol. 29, No. 1, 2013, pp. 147–155
who proposes a framework for analysing systemic issues. We lay greater emphasis on a
limited set of topics: the international perspective, the constraints imposed by architectures
and standards, the problem of design/specification raised by modular approaches to data
processing (called the “frame problem” in the rest of this discussion), some new attributes
of architectures, and issues of implementation and data access.
3. The International Context
The integration of production processes belongs to a new set of initiatives aimed at
industrialising the production of official statistics. This is acknowledged in Eltinge et al.
among others, with a reference to international frameworks such as GSBPM (Generic
Statistical Business Process Model) and GSIM (Generic Statistical Information Model).
The business case for this kind of endeavour is clear and has been described several times:
at the level of UNECE (United Nations Economic Commission for Europe) through the
vision and strategic papers of a high-level group on business architecture for statistics
(now renamed the highlevel group for modernisation of statistical production and services)
(Statistics Netherlands 2011); at the EU level through a joint strategy developed to
improve the efficiency of production and quality of European statistics (Eurostat 2010);
and at national level, as illustrated in the articles under discussion as well as in countries
such as Australia (Studman 2010), Canada (Doherty 2011), or Sweden (Axelson et al.
2011). Among the arguments put forward in favour of an integrated approach, there are
the constraints put on resources which require greater production efficiency. This is
recognised in all the articles in this issue as one of the main drivers of change. There are
also users’ expectations regarding the rapid delivery of information, or new data needs.
Statistics New Zealand, for instance, has developed an environment where there is room
for experimentation in testing scenarios and rapidly designing new indicators. Then there
is globalisation, which requires the merging of different kinds of data from different
origins, by improving the interoperability of national systems for example. As regards the
proliferation of data sources, in some countries surveys are now used to complement
administrative sources. There are also quality improvements brought about by the use of
paradata to handle nonresponses better (RTI International) or to facilitate the use of
mixed-mode data collection (NASS). A more complete list of drivers can be found
in Radermacher and Hahn (2011).
4. The Concept of Architecture
Architecture is an abstract concept used in different contexts. All articles refer to it as an
appropriate framework to deal with system complexity. This section explores some of the
dimensions of this concept building on the articles contributions. The ISO/IEC defines
an architecture as “the organisation of a system embodied in its components, their
relationship to each other and to the environment and the principles governing its design”.
Eltinge et al. propose to qualify architecture through “the performance characteristics of
the components, the integrated system, and system outputs”. An architecture is a model for
the design of business processes and related supporting information systems providing
building blocks, principles and constraints aiming at facilitating the maintenance and the
evolution of complex and open systems. An architecture encapsulates, ab initio, some
Journal of Official Statistics148
knowledge and/or assumptions regarding the functioning and the organisation of the
system. An architecture aims at striking the right balance between flexibility,
rationalisation/efficiency, and quality. Information can be injected a priori in two
different ways: either it is encoded in the models through parameters, input files,
orchestration of building blocks or it is imbedded in the system itself. For instance, a
building block can cover different GSBPM steps (say, A and B). In that case,
the information that step A has to be followed by step B is encapsulated in the
system/architecture and cannot be modified by the user. All architectures referred to in the
articles build on the principle of modularity as the expression of the need for flexibility.
The processing of information should be split into different steps corresponding to the
different modules of the system. In the Statistics New Zealand article, statistical processing
is carried out as an assembly of generic modules. NASS excludes multifunctional
applications. Statistics Netherlands places modularity at the centre of its new system and
RTI models a data collection as a combination of actions and steps, implementing those
sequences in a standardised way to make them reusable. Eltinge et al. presents the
increasingly used GSBPM framework as leading to highly modular systems. However, in
doing so, the elementary blocks (representing operations, modules, GSBPM steps) out of
which the processes are constituted represent the words of a language used to model
statistical processing. Statistics Netherlands rightly questions the granularity of the
modules, which, according to our analogy, means the vocabulary used to define processes.
Eltinge et al. underline that in some cases standardisation may “prevent a given survey from
making optimal use of survey-specific information” or “preclude some types of
local optimisation of a methodological design”. Regarding how the modules are defined,
the articles do not go into sufficient detail, but it is clear that systems which lean on
primitives such as exponential smoothing or linear interpolation or primitives such as
historic imputation, seasonal adjustment (with a prescribed method encapsulated in the
primitive), or micro aggregation (where the method for defining the micro aggregates from
the original data is fixed) will have different “expressibilities”. As defined for instance in
Artificial Intelligence (see, for instance, Finlay and Dix 1996), an expressive system will be
able to handle different types and levels of granularity of requirements. The more complex
data processing it will enable to implement, the more expressive it will be. The range can
span from a large set of statistical macros to a limited number of modules aligned to
the GSBPM steps. A large number of modules gives expressibility and flexibility but makes
the description of a process look like a computer programme. A system based on a limited
set of modules will be more rigid and it will mean that a number of specific methods cannot
be run. Nevertheless, it will probably lead to more standardised processes, which are easier
to manage. There is no doubt that this is a key issue which should be carefully addressed
with the right skills. In this context, it is important to draw on the competence of
methodologists.
Similar issues arise when standards to represent the data and the metadata (including
paradata) are embedded in the architecture. Here, too, the structure will restrict what can
be represented. In SDMX (statistical data and metadata exchange), for instance, the notion
of variable or question does not exist, contrary to what is offered by the DDI (Data
Documentation Initiative). The articles under discussion do not go into much detail on
how to represent key information. At European level, technical standards are currently
Defays and Museux: Discussion 149
being developed to structure, reference and process metadata (ESMS – Euro-SDMX
Metadata Structure) and quality reports (ESQRS – ESS Standard for Quality Reports
structure). Although like the modules they are extremely useful, they restrict what can be
expressed. It would be interesting to explore if similar limitations exist in the way paradata
are represented in Nirvana – the integrated data collection system designed by RTI.
5. The Frame Problem
Another difficult issue linked to the concept of processing as an assembly of modules is the
implicit assumption that operations and data/metadata are independent of each other. More
explicitly, a module is supposed to accept as input a set of information related to the data,
metadata and parameters relevant for the processing to process the data and deliver an
output which can be transformed into data, new metadata, or, for instance, a report on the
processing. But as the processing is modular, in most cases the output in itself has no other
raison d’etre than to feed the next step of the process. But which step? If the modules are
designed independently, and this is necessary in a modular approach, any kind of step
which makes sense from a statistical or logical viewpoint is possible (imputation after
validation, secondary cell suppression after the masking of primary confidential cells,
etc.). However, how can we be certain that the output will be self-contained and ensure
that all the relevant information for any kind of subsequent processing is available?
The traditional system from which GSBPM is derived provides an overview of the
whole chain and the information needed at the different steps of the processing. In a
modular and network approach, this is no longer the case. To take a simple example: when
a value is imputed in an edit module, how should attention be drawn to it? By flagging the
value as estimated? It may be that later on it will be important to know that this was
estimated using a linear interpolation technique in order not to conclude to a linear trend
which will be detected by an analysis module. You may well need to know even more
about the method which has been used. Everything could be relevant a priori.
However, keeping the metadata/paradata of all information that might become relevant
at some stage of a potential treatment is just not an option. This issue has similar features to
the well-known “frame” problem in Artificial Intelligence. Here, the frame problem is the
challenge of representing the effects of actions without having to represent explicitly a
large number of intuitively obvious noneffects (see for instance Callan 2003).
6. The Quality of an Architecture
Methodologists are used to design surveys to optimise their overall quality under
constraints (see for instance the interesting framework proposed by Eltinge et al.). This
includes reducing the effects of nonresponse, frame coverage error, measurement and data
processing errors while at the same time maximising timeliness and relevance. Often,
other quality factors such as comparability and consistency are also taken into account
(see for instance the Eurostat definition of quality). Strictly speaking, the last components
are not characteristic of a survey, as they refer to the relationship which the statistics may
have with statistics issued from other sources. They are, in fact, the property of a system,
the kind of entity which becomes highly relevant when surveys are integrated. The shift in
focus from a single survey to a set of integrated surveys affects the way quality has to be
Journal of Official Statistics150
defined. In this new context, comprehensiveness (see the Dutch experience), redundancy,
and local versus global optimisation become relevant issues. When the architecture is at
stake, quality issues go beyond the quality of the system of integrated data collections it
supports, as recognised in Eltinge et al. . Capacity is also relevant: to host new surveys
(extensibility and adaptability); to promote reuse of components and interoperability
(efficiency); to use standards; to be consistent with frameworks (such as accounting
frameworks); to exploit the same set of data for multiple purposes; and to rationalise data
processing in a sustainable way. This is an area which is only just starting to be explored
by statisticians.
7. Process Standardisation Issues
In the model designed by Statistics New Zealand to meet the need to create or improve
statistical output in a flexible way and make it a baseline activity for statistical subject-
matter specialists, the common methods used to process the data (editing, outlier
detection, imputation, adjustment of weights, estimation of model parameters, etc.) are
combined into an end-to-end production process known as a configuration. In the
Common Reference Environment (ESSnet CORE 2012), a proof-of-concept project
carried out at European level to test the feasibility of modelling and orchestrating a
statistical process as an assembly of services, work flow is also a key concept. When
processes have to be integrated or reused, they need formal representations that can be
processed by machines or by statisticians. Of course the notion of process is not new for
official statistics and there are numerous methods for designing, managing and
documenting them (see for instance the EPMS standard currently being drawn up at
European level; Eurostat 2013). Nevertheless, the representation of processes as objects
which drive processes as used in CORE and in Statistics New Zealand deserves to be
highlighted. In the Dutch experience, the concept is slightly different, resting on the notion
of a set of stable datasets (called steady states) and a production chain for the exchange of
steady states. This goes beyond the notion of production lines and again only makes sense
as part of a holistic approach.
More systemic approaches in statistical surveys and data collections will lead to new
kinds of information concepts and objects that still have to be precisely defined and
supported in production systems. These aspects were missing from GSBPM, but they have
been partially integrated into the recently released Generic Statistical Information Model.
As stressed in Radermacher and Hahn (2011), “looking at individual production
processes and grouping them into larger entities is not enough. All processes will need to
be tackled in a holistic approach with a view to enabling their integration and modularity
within the whole statistical authority, across statistical authorities and with international
organisations. Thus, there is a need to enlarge the scope of standardisation with meta-
processes – going beyond the GSBPM – that allow for a bird’s eye view on production”.
Figure 1 illustrates the scope of a statistical “factory”:
In this broader context, an architecture can be extended to cover nonproduction
processes such as common professional standards for statistics as developed by the
European Statistical System project of an European master programme of official
statistics, standardised press releases and other press activities, and so on.
Defays and Museux: Discussion 151
Finally, the standardisation of processes/metaprocesses cannot be disentangled from a
“product”- component, which is the second strand developed in Radermacher and Hahn
(2011). As long as we define our products in a tailor-made way, fit for (and only for) the
purpose of specific users, the industrialisation-potential of processes will be extremely
limited. The new architectures for Official Statistics should include the building blocks for
“multipurpose-products”, which are ideally “pret-a-porter”, meaning of high quality,
usable for many purposes, and provided in the form of a coherent set of mesodata
organised through accounting frameworks.
8. The Implementation Issue
Although the industrialisation of statistical processes and the rationalisation of
information systems have been discussed for several years, success stories and
implementation reports are still rare. On the basis of the four articles, good practices can be
derived for the re-engineering production systems.
All the initiatives target a paradigm shift in the production environment. This requires
high-level skills, dedicated governance mechanisms, an adequate mobilisation of
resources and deep involvement on the part of the organisation business process owners.
All transformation initiatives include well-defined governance that breaks down
hierarchical barriers. Architecture boards are frequently required for translating strategic
goals into models, operationalising the goals and balancing local and corporate interests.
The ongoing experiences described in the articles show that while the final strategic goal
is very important, it is nonetheless essential for the programme to be structured as a
sequence of transitions towards intermediate states, where benefit can be demonstrated
and reorientation is possible should there be changes in the environment. Success stories
Management
Strategy HRControlling
DisseminateDevelopment
Statisticalmethods
Technology
Programme
Marketing
User support
Publications
Data warehouses
Microdata access
Press office
Cooperation withprivate sector
Management of Production
Surveypreparation
Survey Validation Preparation ofpublication Average
Support Resources
Socialquestions
Legal Information
ICTOrganisationTraining
Methods
Communication
Production
Metadata Registers Datamatching
… …
Fig. 1. The statistical factory (Radermacher and Hahn 2011)
Journal of Official Statistics152
are frequently built on past failures which have been analysed and served to build
capabilities.
Resource allocation must be agile as it can be necessary to reallocate resources (be it
financial or human) rapidly at any stage of the implementation. This is difficult to integrate
in a standard cost-benefit analysis. A recommended way (Statistics New Zealand) is to
proceed step by step (phasing), measuring the benefit of specific pilots, either further
optimising the future state or continuing the planned implementation.
The articles highlight the need for the strong involvement of users. Agile development
involving users, developers, and designers is also proposed as a means for the gradual
creation of competence.
The skills for designing a new system are not always available in house. In the event of
outsourcing, shadowed capabilities (RTI International) have been found to be necessary in
order to build in-house competence to ensure the sustainability of the system.
Eurostat has recently designed a programme for developing a set of common
infrastructures to support the implementation of the ESS vision for the production of
EU statistics (Eurostat 2009). The main technical infrastructure components include: 1)
a secured network supporting the flow of information among ESS partners; 2) a platform
for sharing common services; 3) common data repositories; and 4) a common validation
architecture. The approach combines the business realisation of key flagship initiatives
which will demonstrate and pilot key features of the ESS Vision (exchange of information
and interoperability of statistical processes) while gradually building up the infrastructure
components of the future system. The approach involves a paradigm shift from a
stovepipe, bottom-up and project-based approach to a programme-based approach closely
tying together business outcomes and crosscutting infrastructure developments.
The programme infrastructure being set up builds on the above principles adapted to the
international and decentralised context. For more information on current developments,
see Eurostat (2012).
9. The Data Access Issue
In a systemic context, as acknowledged in the business case for official statistics in
a global information market (Radermacher and Hahn 2011), access to detailed and
confidential information by partners or external users has to be integrated into the
architecture design. Official statistics have traditionally maintained a privileged
relationship with information providers. Indeed, the protection of individual information
collected for statistical purposes is usually seen as the foundation for the quality of the
primary information collected. This has led to a well-developed security and statistical
disclosure limitation architecture components. However, it is also building barriers against
the wider integration of statistical systems and the necessary specialisation of statistical
work. The move towards reusing existing information (currently coming mainly from
administrative sources, as shown by the Statistics New Zealand article) is creating a slight
shift in the focus of statistical confidentiality, to the extent that there will be less direct
interaction between statisticians and data providers, although the principle of respect for
confidentiality will have to remain enshrined in the future architecture. Given the place of
data analytics in the new architecture, innovative solutions must be found to ensure the
Defays and Museux: Discussion 153
appropriate trade-off between flexible access to detailed data and statistical disclosure
limitation. The Westat/NCHS article gives a detailed account of the design of an online
analytic system targeting external users, which is required in order to cope with statistical
confidentiality. In an integrated system such as the European statistical system, new
architecture should push the provision for security towards the system’s border,
implementing the Schengen model for the movement of individuals within the EU (see for
instance Bujnowska and Museux (2011) on the implementation of the Schengen model for
research into microdata access). Under the Schengen approach, all the data collected under
European legislation should be considered as the common good of the European Statistical
System and, consequently, each national authority should be authorised to access and
grant access to all European data. This could only be possible if a common architecture
defines rights and duties, protocols and basic principles (most likely to be enshrined in the
appropriate legislation).
In the medium to long term, the public’s experience of statistical confidentiality is
expected to change, given the ever-increasing amount of individual information
deliberately or unconsciously made available on the internet through social networks or
mobile devices. Statistical confidentiality will no doubt have to be redefined to take a
changing reality into account. A new paradigm will almost certainly have to be found.
Efficiency gains, quality improvements, and higher reactivity push statisticians to
conceive their systems in a more holistic way. This requires new concepts; this raises new
issues. The shift from systems to architecture, from local optimisation to global
optimisation, from the production chain to the factory is on its way. The current empirical
approach needs to be embedded in a more theoretical framework. This is a new challenge
for statisticians.
10. References
Axelson, M., Engdahl, J., Fossan, Y., Holm, E., Jansson, I., Lorenc, B., and Lundell, L.G.
(2011). Enterprise Architecture Work at Statistics Sweden. Paper presented at the 2011
International Methodology Symposium, Statistics Canada.
Bujnowska, A. and Museux, J.-M. (2011). The Future of Access to EU Confidential Data
for Scientific Purpose, 2011 UNECE-ESTAT Work Session on Statistical Data
Confidentiality.
Callan, R. (2003). Artificial Intelligence. Basingstoke: Palgrave Macmillan.
Doherty, K. (2011). Update on How Business Architecture Renewal is Changing IT at
Statistics Canada. Working paper 3, MSIS 2011, United Nations Economic
Commission for Europe.
ESSnet CORE (2012). Common Reference Environment, EU Commission funded project.
Available at http://www.cros-portal.eu/content/core-0 (accessed February 14, 2013).
Eurostat (2009). Communication 404/2009 of the Commission and the European
Parliament on the “Production of EU statistics: a vision for the next decade”.
Available at http://eur-lex.europa.eu/LexUriServ/LexUriServ.do?uri¼COM:2009:
0404:FIN:EN:PDF.
Journal of Official Statistics154
Eurostat (2010). Communication from the Commission on the European Parliament and
the Council on the Production Method for EU Statistics –– Joint Strategy Paper, 5th
Meeting of European Statistical System Committee, document ESSC 2010/05/6/EN.
Eurostat (2012). The ESS VIP Programme, 15th Meeting of European Statistical System
Committee, document ESSC 2012/15/6/EN.
Eurostat (2013). Better Documenting Statistical Business Processes: the Euro Process
Metadata Structure, forthcoming paper METIS UNECE Work Session, May 2013.
Finlay, J. and Dix, A. (1996). An Introduction to Artificial Intelligence. London: UC Press.
Radermacher, W. and Hahn, M. (2011). The Business Case for 21st Century Official
Statistics. Unpublished paper, available at http://www.cros-portal.eu/content/business-
case-21st-century-official-statistics (accessed February 19, 2013).
Statistics Netherlands (2011). Strategic Vision of the High-Level Group for Strategic
Developments in Business Architecture in Statistics. Paper presented at the 59th plenary
session of the conference of European statisticians, UNECE.
Studman, B. (2010). A Collaborative Development Approach to Agile Statistical
Processing Architecture –– Australian Bureau of Statistics (ABS) Experience and
Aspirations. Working paper 3, MSIS 2010, UNECE.
Defays and Museux: Discussion 155
Discussion
Alan F. Karr1
These five articles and the framework proposed by Eltinge, Biemer, and Holmberg
illuminate an exciting view of the future of official statistics. The articles are innovative,
forward-looking, and remarkably complementary to one another. Below, for brevity, I refer
to the five articles as the NASS, StatsNL, StatsNZ, RTI and Westat/NCHS articles. I will
comment on each article individually, on them collectively in the context of the framework,
and on the entire concept of “systems and architectures for high-quality statistics
production.” First, however, I present two complementary perspectives on official statistics.
1. A Broad Perspective
Official statistics are like cars. A few aficionados are interested in them for the sake of
style, technology or snob appeal, but almost everyone else sees them solely as a means of
fulfilling other needs. Utility and affordability affect people’s choices of cars, and in the
future, if not already, will affect people’s choices of official statistics. These five articles
and the Eltinge/Biemer/Holmberg framework are nascent recognitions of that reality.
Except for respondents,manypeople associatedwith the production of official statistics –
myself included – are aficionados. We think of data as the end product – and the more
stylish, technologically advanced and elegant, the better. Most other people, if they were to
think about it, would say that, like a car, data are valuable (if at all) because they enable other
needs to be met. In reality, the end product of our efforts is the decisions made by
governmental bodies on the basis of official statistics, at national, state/provincial and local
levels, as well as decisions by private sector organizations. Examples of the latter are
decisions where to locate manufacturing and retail facilities.
Some people might also include as an end product improvements to society resulting
from (academic and other) research that employs official statistics. Education, health and
transportation are examples of contexts where such research has clearly made a difference,
although widespread recognition that this is so may be lacking. Note carefully that I did
not term the research itself a “true end product,” but rather the societal impact of the
research, which places data two steps removed from reality.
Only boutique car manufacturers are run by aficionados, and official statistics agencies
run by aficionados risk becoming enamored of the product, rather than of what it enables.
Ultimately, our value to society depends on the quality of decisions and the quality of
societal improvements. These are not the same thing as data quality, about which we still
know precious little, so the challenges are immense.
q Statistics Sweden
1 National Institute of Statistical Science 19 T.W. Alexander Drive, P.O. Box 14006 Research Triangle Park, NC27709-4006, U.S.A. Email: [email protected]
Journal of Official Statistics, Vol. 29, No. 1, 2013, pp. 157–163
Confronting the challenges requires new modes of thought, organization and operation.
Maintaining political and scientific impartiality but being conscious of the political and
sometimes partisan decisions based on the data we produce is not impossible – only
exquisitely difficult. Failing to understand and serve our customers is a death sentence.
Modernizing our systems and architectures, in ways described in these articles and other
ways, is an essential step away from the precipice. The authors and editors are to be
congratulated for recognizing this and doing something about it.
2. A Narrower Perspective
Speaking as an aficionado, like most others in official statistics, I would include in my list
of the biggest obstacles (but also opportunities!) that we face: (1) Declining agency
budgets, (2) decreasing response rates, and (3) the need to use administrative data as
a complement or substitute for survey data. Importantly, the seeming gulf between these
and the broader perspective in Section 1 is not unbridgeable. Indeed, the systems and
architectures described in these five articles represent thought and action that begin to
unite the two perspectives.
Perhaps not everyone will agree with this analogy, but system- and architecture-based
production of automobiles serves both customers and producers. It improves the product,
makes it more broadly affordable, and at the same time focuses intellectual creativity on
the issues that really matter: price, features, reliability and safety. Perhaps there has
become less room for artisans, but this is more than compensated for by the new
opportunities. These five articles embody the same kind of thinking: production of official
statistics can become less artisanal without becoming less professional, less exciting or
less rewarding. On the contrary, new systems and architectures may be the best if not last
chance for us to address the issues that really do matter, and that really do demand that we
be professionals.
3. The Five Articles
The NASS, StatsNL and StatsNZ articles describe agency-wide efforts that share some
characteristics, but also differ in important ways. The RTI article focuses exclusively,
albeit broadly, on survey operations, and the Westat/NCHS article addresses the still more
specific issue of data confidentiality within a systems and architectures context.
NASS. This article, which in my opinion is outstanding, describes a near-complete
makeover of an official statistics agency for which new IT infrastructure was the enabler,
but not the purpose. The effort was initiated by the CEO of the agency, who clearly built
up significant support within NASS for it, but who also seemingly made clear that changes
were necessary. Three factors appear to have driven the effort: reduction of personnel
costs in response to declining budgets, modernization of – especially the software
component of – the IT infrastructure at NASS, and reorganization of a legacy system of
decentralized field offices into a more efficient, less cumbersome structure.
Although the NASS article emphasizes survey operations, the scope of the changes is
clearly broader, especially with respect to internal and external dissemination of data and
analyses. The article demonstrates the thought, planning, and care thatwent into the creation
of the new architecture, including the need for a business case for each component of it.
Journal of Official Statistics158
Among the most interesting aspects of the process is the way in which NASS combined
in-house expertise with that of contractors. NASS depends less on contractors than some
other U.S. official statistics agencies for collection of data, but clearly recognized and
responded to the need for external assistance. Also outstanding is the people-oriented
manner in which the process was carried out, as confirmed by the inclusion of references
such as Collins’ Good to Great (Collins 2001), which I have read and recommend highly.
(Another of my favorite references of this sort will be mentioned in Section 5.) Not
surprisingly, most of the lessons learned presented in this article have to do with people,
not systems and architectures. They were possibly more foreseeable than the article seems
to suggest, but at least they have been learned.
What to me is missing from this article is the “end products of our efforts” perspective in
Section 1. It is not clear to what extent users of NASS data were involved in the process,
nor what role they are playing in evaluation of the changes. Are better decisions being
made as a result of the new architecture? Is better research being conducted? How will
NASS know?
StatsNL. The redesign of Statistics Netherlands’ production system described in this
article is comparable in scope to that of NASS, but with more emphasis on the integration
of data from registries. There are many similarities between the two efforts. Like NASS,
StatsNL began from strategic rather than operational goals. Like NASS, it created
advisory and governance structures to oversee the process. And like NASS, it was
responding to cost considerations, although in this case the main concerns seem to be costs
of system implementation and maintenance. And one final similarity: both StatsNL and
NASS sought explicitly to reduce respondent burden, albeit in different ways.
However, there are also important differences. StatsNL created and based its system
architecture on a rather formal data model, as well as a set of use cases. StatsNL may have
realized earlier in its process that, as the article states, “the architecture itself does not
make methodological choices.” The StatsNL and NASS perspectives on edit and
imputation appear to differ, although there is not sufficient detail in the articles to say
precisely how. The StatsNL view of costs and benefits appears to be somewhat broader
than the NASS view, but this may reflect in part the relative maturities of the two projects.
StatsNL does seem to have thought more directly about risks, as well as to have realized
that no matter how detailed the planning, sound the execution and thorough the evaluation,
things will not be right the first time.
The extent to which StatsNL relied on external expertise during the redesign process is
not clear. Whether its system is robust enough to withstand the future remains to be seen.
StatsNZ. The context, systems and approach described in this article are generally more
similar to those for StatNL than those for NASS, but there remains much in common
among all three efforts. StatsNZ is very much like NASS with respect to breadth: “Stats
2020 [: : :] involves changes in the way the organization works; who it works with and
how; to the systems, tools, and processes used; and to the skills, and behaviours needed for
success.” Like StatsNL, StatsNZ is highly focused on use of administrative data, a luxury
not equally available to agencies in other countries.
Among the strengths of this effort are explicit consideration of risk (e.g., arising from
legacy software) and the user-centric “quality framework and quality indicators.”
However, the view of quality remains that of an aficionado. The nine principles laid out in
Karr: Discussion 159
Section 2.2 of this article are laudable, but at the same time are to me too general to be
actionable and too dogmatic to be useful. In the same way that there is no disclosure
prevention but only disclosure limitation or avoidance, saying that “Surveys will be used
only to fill the gaps that cannot be met from administrative sources” misses the point,
especially in countries like my own where distrust in the national government is high.
This article raises a number of technical issues that are interesting and important.
Versioning of data is, I believe, largely ignored by official statistics agencies. No serious
producer of software could exist without version control. In a project with a major
telecommunications company to perform statistical analyses of their software
development processes, I worked with a version control system that enabled the software
to be “built” as of any date in the twenty-year history of the system. Should we not think in
the same way about data? Steps in this direction are occurring: the U.S. National Center
for Education Statistics (NCES) will in the not-distant future release a thoroughly
modernized dataset for its 1982–92 High School and Beyond (HS&B) study (NCES 2013)
that nevertheless permits replication of every previously published analysis.
StatsNZ identifies clearly the need for automated data editing. StatsNL and NASS
recognize the same need, but even though there is progress, no one has yet developed the
mature, powerful tools that we really need – especially to integrate editing, imputation and
statistical disclosure limitation.
StatsNZ’s configuration store is also important. In the software development project
alluded to above, more than one-half of the 200 millionþ lines of code were in make and
header files. As statisticians, we should be comfortable with the concept of a configuration
store, which is essentially metadata for software.
RTI. RTI is a survey contractor, conducting surveys on behalf of official statistics
agencies in the U.S. While efficient in some ways (RTI, NORC, Westat and other private
sector organizations have incredible accumulated knowledge, and are, as evidenced by this
article, true innovators), this arrangement creates two disconnects. First, the agency loses
direct contact with respondents, contact that NASS, for instance, finds invaluable. Second,
the survey contractor has no (or little) direct relationship with data users, which can lead to
data quality being measured too mechanically (e.g., by response rates or contact attempts
necessary), rather than in the user-centric perspective in Section 1, or by metrics associated
with inferential uses of the data, let alone in terms of decisions based on the data.
The Nirvana system described in the RTI article is a tool for survey managers concerned
on a day-by-day basis with issues such as response rates, interviewer assignment and costs.
It is overtly a tool to support operational decisions. In this respect, for instance, through the
now beaten-to-death dashboard metaphor, it is similar to some components of the NASS
system. More important, however, is the data and metadata infrastructure on which it rests.
The standardization, modularity and extensibility are entirely in the spirit of NASS,
StatsNL and StatsNZ. Whether as a result of proprietary or other concerns, the level of
detail about the system is less than in the other articles.
The account of the development process, on the other hand, is as interesting as it is
instructive. Like NASS, StatsNL and StatsNZ, RTI understood from the beginning the
people-centricity of the system development process, and put in place what seem to have
been very effective advisory and decision-making mechanisms. However, three groups
StatsNL and StatsNZ have involved in their system development projects) and data users.
Why?
Westat/NCHS. Westat, like RTI, is a survey contractor. This article, unlike the RTI
article, describes a partnership between Westat and a U.S. official statistics agency – the
National Center for Health Statistics (NCHS), which is part of the Centers for Disease
Prevention and Control (CDC). It is not an article about systems development per se: the
dissemination system that motivates it does not exist and might never exist.
The article is, instead, an object lesson in the external realities of system building:
enterprise architectures, standardization, modularity, extensibility, virtual servers and
APIs aside, how do we determine system requirements, and how do we know that they can
be, or when they are, fulfilled?
No amount of generalities can answer these questions, and so this article stands as a
beautifully concrete instantiation of the problem. Without going into technical detail, the
basic problem is whether a query-based access system (Karr et al. 2010) can run in real
time on both restricted (confidential) data and publicly released versions of the same data.
None of the other articles addresses a usability issue of this specificity; indeed most of
them consider dissemination only obliquely, and confidentiality not at all.
As in the other articles, there is a gap between system and users, let alone decisions,
research, or societal improvements. There is little discussion of data utility even from an
inferential perspective, although a lot is known about utility for tabular data (Cox et al.
2011; Gomatam et al. 2005). The discussion of risk omits consideration of nefarious users
to whom denial of a query may be informative, or who have the computational resources
and wit to enumerate all tables compatible with the released information.
The extremely important message of this article is that implementation of systems and
architectures has a detailed as well as high-level side, which can be extremely delicate.
The devil is always in the details. Bringing them in too soon can stop a project in its tracks.
Bringing them in too late, on the other hand, can be fatal. Most software projects that fail
do so because of incompletely, inconsistently, or incorrectly specified requirements. The
NASS, StatsNL, StatsNZ, and RTI articles are all, to varying degrees, vague about how
requirements were specified and modified. The authors of this article deserve praise for
reminding us how much requirements matter.
4. The Five Articles in the Context of the Eltinge/Biemer/Holmberg Framework
In a related setting (Cox et al. 2011) I and co-authors have criticized risk-utility paradigms
in statistical disclosure limitation as useful for “how to think, but not how to act.” By this,
we distinguish frameworks for structuring decisions from systems and architectures for
making decisions. To a significant degree, I feel the same about the editors’ framework.
Even though they would be first to admit that the framework is not in remotely final form,
at the current level of generality, there is little clarity how to move forward. Albert
Bowker, former chancellor at the University of Maryland and the University of California
Berkeley, once told me that it is often more important to take a step in the right direction
than to be able say what the final destination is. Eltinge, Biemer, and Holmberg might do
well to heed his advice. The authors of the five other articles certainly have: they all
recognize the difference between a step and a destination.
Karr: Discussion 161
The most glaring omission in the framework is people. Each of the five articles
emphasizes the centrality of people to systems and architectures. To quote from StatsNZ,
“Systems can complement, but are not a substitute for, [this] intellectual and human
productivity.” The equations in the framework do not even begin to capture the
complexities of the people immediately involved in the process, let alone data subjects,
clients or users, researchers, decision makers, or the public at large.
To write down equations of the form Q ¼ gQ(X, Z, bQ) simply does not move the
conversation forward. Why should there be a parameter bQ when gQ is entirely
unspecified?What if every object involved is of unimaginably high dimension?What if the
“science” is nothing but a collection of special cases? At this stage, to suggest particular
functional forms or methods of statistical estimation seems premature, and deflects
attention from the central issue of better decisions.
5. Conclusion
The stunning common characteristic of the systems and architecture projects reported here
is that they are all, perhaps to degrees not yet known fully, successes. To the agencies and
people involved, I can only say “Bravo!” In an age of highly publicized, expensive
software projects in both the public and private sectors that are failures to the point of
abandonment, it is truly heartening to see what is possible with limited but intelligently
applied financial, human, hardware and software resources. Repeating myself, these five
articles demonstrate how much can be accomplished given attention to people and the
willingness to take a step in the right direction.
So, do these successes mean that the situation for official statistics is now rosy?
Sadly, I fear that it is not. These five articles are, at the moment, rather isolated
instances of success. There have also been failures, many of whose lessons learned
were never shared with others. The corporate-like thinking associated with some
systems and architecture projects may not go far enough. In addition to Good to Great,
my favorite business reference is Clayton Christensen’s The Innovator’s Dilemma:
When New Technologies Cause Great Firms to Fail (Christensen 1997). Christensen
originated the concept of disruptive technologies, such as personal computers, that
vitiate old-line companies “from below,” with products that are both better and
cheaper, or are so much cheaper that being as good as (or even almost as good as) the
incumbent technology leads to success.
The business and profession of official statistics are vulnerable to disruptive
technologies. What if data from Facebook, Google, and Twitter are good enough to
support the decisions that need to be made, as well as the research that is necessary to
improve, say, public education and health? What if privatization of government data
collection were to work “well enough,” and at one-tenth the current cost?
Haughty sneers that we more fully respect confidentiality or produce higher quality data
may not help. (American Motors once thought that it made better cars than General
Motors, Ford or Honda, and RIM dismissed iPhones as frivolous alternatives to
Blackberries.) These five articles, and the Eltinge/Biemer/Holmberg framework, show
that disruptive technologies can be harnessed, and should inspire others. However, they
create no conceivable case for complacency.
Journal of Official Statistics162
6. References
Christensen, C.M. (1997). The Innovator’s Dilemma: When New Technologies Cause
Great Firms to Fail. Cambridge, MA: Harvard Business Review Press.
Collins, J. (2001). Good to Great: Why Some Companies Make the Leap : : : and Others
Don’t. New York: HarperBusiness.
Cox, L.H., Karr, A.F., and Kinney, S.K. (2011). Risk-Utility Paradigms for Statistical
Disclosure Limitation: How to Think, but not How to Act (with discussion).
International Statistical Review, 79, 160–199.
Gomatam, S., Karr, A.F., and Sanil, A.P. (2005). Data Swapping as a Decision Problem.
Journal of Official Statistics, 21, 635–656.
Karr, A.F., Kinney, S.K., and Gonzalez, J.F. Jr. (2010). Data Confidentiality––the Next
Five Years: Summary and Guide to Papers. Journal of Privacy and Confidentiality,
1, 125–134.
National Center for Education Statistics (NCES) (2013). High School and Beyond
(HS&B). Information available at: http://nces.ed.gov/surveys/hsb/.
Karr: Discussion 163
Discussion
Frauke Kreuter1
This special issue on “Systems and Architectures for High-Quality Statistics Production”
is a stimulating resource for statistical agencies and private sector data collectors in a
challenging time characterized by massive amounts of data, from a variety of sources,
available in varying intervals, and with varying quality.
Traditionally, statistical products were created from a single source, most often through
surveys or administrative data. However, neither surveys nor administrative data alone can
match the data needs of today’s society. In addition, the need to reduce the costs of data
production necessitates that multiple sources are used in combination. The need to reduce
costs also necessitates the streamlining of production cycles, and the increasing difficulties
in data collection itself require such systems to be much more flexible than they have been
in the past. Increasingly, these reasons are driving statistical agencies and private data
collectors to redesign their entire data production cycle. The examples in this special issue
from Statistics Netherlands and Statistics New Zealand demonstrate such developments in
government agencies; the example from RTI reflects efforts visible among private sector
data collectors. This commentary will highlight some issues of general interest related to
organizational challenges, and some that create the basis for reproducible research and are
therefore of general interest to the research community.
1. Organizational Challenges
A common phenomenon among many national statistical agencies and also many private
data collectors is an organizational structure around projects or topics, rather than around
tasks. Such an organizational structure is often referred to as one involving stovepipes or
silos, and all three articles comment on the presence of such structures in their
organizations. In each of these organizations, the silo structure resulted in a multiplicity
of software solutions, duplication of work, a lack of dissemination of knowledge from
silo to silo on particular tasks, and a lack of standardization in survey products and
documentation.
To overcome the disadvantages of silos, each organization restructured the statistics
production process. At RTI, the restructuring revolved around a core of software tools that
in the future will be used across all survey data collection projects as well as a common
data storage system. Similar approaches were taken by Statistics New Zealand. Statistics
Netherlands went a step further and also changed the structure of the organization itself,
q Statistics Sweden
1 Joint Programme in Survey Methodology, University of Maryland, Ludwig Maximilian University, Munichand Institute for Employment Research (IAB), Email: [email protected]
Journal of Official Statistics, Vol. 29, No. 1, 2013, pp. 165–169
implementing modular production lines, and moving away from parallel production lines.
For Statistics Netherlands, the modular approach allowed for better use of scarce resources,
such as expertise in specialized fields, like sampling. Moving away from silos also greatly
facilitated the use of the same metadata (data about data) and documentation across systems,
streamlining training needs and ultimately reducing costs.
All three organizations report on the difficulties they encountered in implementing the
changes to existing data production systems. Most of these challenges are not unique in
this context and can be found elsewhere. One of these challenges is the adoption of a new
system during ongoing production. More subtle, but nevertheless important problems
reported in these articles are those arising from the lack of participatory decision making.
Because individual units are most familiar with specific processes, input from these units
is essential to developing new routines. The Statistics Netherlands article points out that
communication across people working in Information Technology and survey production
is crucial to a successful operation. Another common challenge is the continuous updating
of the data within the systems and the availability of data from the system to each
production unit at appropriate times.
All three articles, but in particular the two from the national statistical agencies,
emphasize the growing demand for the use of administrative data on its own or in
combination with survey data. However, the descriptions in the articles could spend more
time detailing on how such combinations are achieved. When data from multiple sources
are combined, individual records do not always have unique and identical sets of
identifiers. In such cases, probabilistic record linkage is used. Privacy concerns often result
in identifiers being encrypted, creating another challenge for unified systems. Here, new
methods are being developed to allow for privacy-preserving record linkage (see e.g.,
Schnell et al. 2009). In some cases, clearing houses (within or across agencies) are used to
allow for record linkage with unencrypted identifiers. It would be interesting to know how
the various agencies handle this problem.
When administrative data is used for statistic or data production, its quality is of
paramount importance. The three articles here lack some clarity on how the quality of
administrative data is assessed and ensured beyond edit checks. It is not unlikely that
several data sources will have overlapping sets of variables and that those variables are of
different quality, depending on their source and the importance of a given variable when
the data are entered. Incorporating the perspective of efficient data linkage into the
building of statistics production systems is important.
2. Reusability and Reproducibility
One of the key motivations for the restructuring of the statistical production process is the
possibility to reuse existing knowledge, data and code across statistical products and
across organizational silos. The focus of all three organizations on employing unified
software systems and comparable documentation systems not only enhances
reproducibility but creates the basis for quality assurance. For example, at Statistics
New Zealand, undocumented manual repairs to the data threatened the quality of the
final product in the past. The article comments on new software systems that allow
automatization of routine tasks (to avoid hand-coding) and the automated creation of data
Journal of Official Statistics166
tables for storage and reports. Such automatization is often missing, and even
organizations with smaller projects would benefit from unified software code stored for
long-term use and reproducibility.
Metadata play an important role in this process. In order to move data across silos or
production processes in an automated fashion, certain standardizations must be in place.
One example of this kind of standardization is the introduction of common labels for
corresponding variables. As simple as this might seem from the outside, each article
commented on the difficulty of achieving such standardization. With long-standing data
products in particular, such changes can be tedious for individual silos. Having achieved a
common set of metadata that allows easy exchange of data within the organizations is
therefore a major accomplishment.
However, this agenda could be pushed even further. Thinking of statistical data users
located outside the statistical agencies, standardization across statistical offices would also be
advantageous. Outside users are much more likely to use data from various sources, maybe
even various countries, than users within the same agency. Outside users often attempt to
combine or compare such data. Large resources are then needed (over and over again) when
researchers make data comparable post hoc. The standards developed by the Data
Documentation Initiative (DDI 2012) could help overcome this problem. DDI has developed
standards for describing data from the social, behavioral, and economic sciences that support
the entire research data life cycle, including the collection, processing, distribution, and
archiving of data. For example, a set of controlled vocabularies sets metadata standards in
semantics (which elements should be defined), and content (what values should be assigned
to elements and how). A naıve user of data might think, for example, that all surveys ask
questions about race and ethnicity in the same way, whereas quite the opposite is true even
within a single organization. To date, primarily academic entities have subscribed to the DDI
standards, but some Research Data Centers (RDC) affiliated with government organizations,
such as the RDC at Statistics Canada or the RDC affiliated with the German Institute for
Employment Research (IAB), are in the process of designing their metadata systems
according to such international standards (Bender et al. 2011).
Of course, if analysts frequently shared their data preparation and analysis code,
efficiency gains in such repetitive work could be accomplished even without the
international standardization of metadata. Fortunately, some journals already encourage, if
not require, the dissemination of analysis code. However, the inability to search journals’
supporting online material make the dissemination of analysis code through free code
repositories such as GitHub (http://github.com) and SourceForge (http://sourceforge.net)
much more desirable (for a larger discussion, see Peng 2011). Publicizing the code used by
statistical agencies to transform raw data into data products can not only increase
efficiency, but also contributes to quality assurance by making the process reproducible.
In addition to metadata and shared analysis code, paradata – data created as a by-
product of the production process – are another key element in quality assurance, and one
that has to be considered in the construction of unified systems. Many agencies are
interested in using survey production-based paradata to inform decisions about cases
during ongoing fieldwork and to allow for a timely shift of cases from one production
mode to another. One example – beyond the ones discussed here – is the U.S. Census
Bureau, which is currently creating a flexible and integrated system to use paradata in
Kreuter: Discussion 167
ongoing survey management (Thieme and Miller 2012). However, paradata can also be
used to monitor the processes within the agencies themselves. Paradata examples of the
latter could be records on edits done to a particular case or data set (already prominently
used at RTI), production times for a particular module (e.g., in the Dutch case), or the
number of data manipulations necessary to move raw data into long-term storage in
flexible data bases (e.g., in the case of New Zealand). In this sense, the whole statistical
production process can be monitored through paradata. The development of useful
paradata is currently still in its infancy and their measurement error properties are
unknown (see also Kreuter 2013).
3. Outlook
It is interesting that each organization developed its own system, and did not seem to
collaborate with others in the design process. This special issue is a valuable step towards
fostering such collaborations. These articles will help disseminate information about
the new system developments and hopefully spur dialogue and interaction amongst the
various data collection entities. My wish would be for organizations to share some of
the system infrastructure when possible. While it would probably be difficult to share the
entire IT infrastructure, code pieces could very well be provided and would be of use to
others – for example, code pieces necessary to extract paradata from data collection
software, or algorithms used in call scheduling or models used for responsive designs.
A larger discussion would also benefit from developments in other fields or those that
develop across disciplines. To mention just one example, the British company Jisc aims to
create a Virtual Research Environment (http:jisc.ac.uk/whatwedo/programmes/vre.aspx).
The discussion about the system development also highlights anew the need for people
trained with a total survey error perspective. The total survey error perspective (TSEP)
deconstructs error in a survey estimate into its constituent pieces, such as nonresponse
error and errors due to measurement. Being aware of the various sources of error and
their likely contributions to a given estimate based on previous research will allow for
informed trade-off decisions as data are combined within the system. A framework
similar to the TSEP could also be used to understand the errors in administrative data,
although much more work is needed in this area. One obvious place to look to begin
to create an error taxonomy for administrative data is the study of questionnaire design,
for administrative data are often also collected through self-administered forms that
resemble surveys.
Survey methodologists can also help identify the effects of changes made to one
production module on other modules. This will be important, for example, when unified
systems are used to move cases in a flexible way, mid-field, from one mode of data
collection to another. In addition, survey methodologists can use their tools to assess the
possibilities of merging various data sources with different error structures (a point not
mentioned in the three articles), and their expertise in the analysis of such linked data
(Lahiri and Larsen 2005). Finally, survey methodologists can contribute their knowledge
about issues of data linkage that need to be addressed at the data collection stage, for
example, when asking for linkage requests (see e.g., Calderwood and Lessof 2009;
Sakshaug et al. 2013).
Journal of Official Statistics168
4. References
Bender, S., Dieterich, I., Hartmann, B., and Singula, D. (2011). FDZ-Jahresbericht
2009/2010. Available at: http://doku.iab.de/fdz/reporte/2011/MR_06-11.pdf (accessed
February 14, 2013).
Calderwood, L. and Lessof, C. (2009). Enhancing Longitudinal Surveys by Linking to
Administrative Data. Methodology of Longitudinal Surveys, P. Lynn (ed.). New York:
Wiley.
DDI (2012). What is DDI? Available at: http://www.ddialliance.org/what (accessed
February 14, 2013).
Kreuter, F. (ed.) (2013). Improving Surveys with Paradata: Analytic Use of Process
Information. New York: Wiley.
Lahiri, P. and Larsen, M. (2005). Regression Analysis with Linked Data. Journal of the
American Statistical Association, 100, 222–230.
Peng, R. (2011). Reproducible Research in Computational Science. Science, 334, 1226.
Schnell, R., Bachteler, T., and Reiher, J. (2009). Privacy-Preserving Record Linkage
Using Bloom Filters. BMC Medical Informatics and Decision Making, 9(41).
Sakshaug, J., Tutz, V., and Kreuter, F. (2013). Placement, Wording, and Interviewers:
Identifying Correlates of Consent to Link Survey and Administrative Data. Survey
Research Methods (forthcoming).
Thieme, M. and Miller, P. (2012). The Center for Adaptive Design. Presentation to the
National Advisory Committee on Racial, Ethnic, and Other Populations. October 25,
2012, Washington, D.C.
Kreuter: Discussion 169
Discussion
Thomas Lumley1
1. What is the Same? What Has Changed?
Collecting and integrating high-quality information from a census or population sample
will always be difficult and expensive, requiring specialized expertise, and benefiting from
accumulated institutional memory. The same used to be true of analyzing the data, which
required expensive computers with many megabytes of storage and advanced software
capable of computing appropriate standard errors for the sampling design.
In the modern world, however, any major general-purpose statistical package will
support not just tables but regression models on complex samples, and ordinary laptops
have the processing power to handle almost all complex survey data sets. For the few very
large samples, such as the American Community Survey (3 million/year) and the US
Nationwide Emergency Department Sample (25 million/year), it is still possible to
perform analyses with standard statistical software on commodity server hardware: for
example, a rack-mount Linux server with 128 Gb memory can easily be found for under
US$5,000.
The statistical expertise needed for analysis has also become less specialized. The
software only requires users to be able to understand and describe the basic design, or a
one-stage approximation to it, and then to use essentially the same scripting syntax and
analysis options as they do for unstructured data. This is perhaps most dramatic in Stata,
where the svy: prefix can be applied to almost any command, but is also true of SPSS,
SAS, and R with the survey package.
With the fall in cost of analysis relative to data collection and integration we should
rationally expect more analyses to be done on each data set, and this is indeed the case.
Secondary analysis of microdata, especially the publicly-available microdata from US
health and social surveys, has exploded. For example, a Google Scholar search with the
keywords “NHANES survival” lists 20,800 results, and 24,300 results for ““current
population survey” regression”. In fact, the analysis performed on microdata by external
researchers may be more varied and complex than that performed in-house by official
statistics services.
That is, some of the “High-Quality Statistics Production” addressed by this special issue
is, and will continue to be, outside the direct control of the official statistics system,
although it relies on the official statistics system for its data and may be paid for by the
q Statistics Sweden
1 Department of Statistics, University of Auckland, Private Bag 92019, Auckland 1142, New Zealand. Email:[email protected]
Journal of Official Statistics, Vol. 29, No. 1, 2013, pp. 171–175
same taxpayers. National statistics institutes need to consider cost-effectiveness from the
point of view of their mandates, their budgets, and their costs, but governments should
look for broader circumstances where it makes sense to fund the national statistics
institutes to simplify and encourage external data analysis and reuse.
2. Architecture at National Statistics Institutes
The articles by authors from Statistics New Zealand (SNZ) and Statistics Netherlands (SN)
in this special issue emphasize a similar list of needs: information should be collected as
few times as possible, administrative data should be integrated with survey data, the data
outputs should be flexible, and all this should be done with less money and higher quality.
To some extent this is achievable as the payoff from inexpensive computing and
accumulated statistical research: cheaper computing allows for higher-level, less efficient
specifications of tasks, and improved statistical understanding makes previously disparate
tasks look the same. These are the same payoffs that made the R “survey” package feasible
(Lumley 2010): modern computing permits the use of an inefficient programming
language, and a view of inference based on estimating functions makes programming
simpler and more modular (Binder 1983; Estevao et al. 1995).
The SN article emphasizes modularity in the design of the Dutch statistical system. The
real issue with modularity is not the concept, but the size of the modules, which typically
come in two sizes: too small, and too big. When the modules are too big, the resulting
system is inflexible and new modules are always needed; when they are too small, the
system is flexible but maintainability and consistency suffer. As the authors say,
“complications become apparent when considering the degree of parameterisation,
performance requirements and integration problems between modules.”
My personal experience with large analytical and data integration systems has mostly
been in genomic epidemiology, working with high-throughput genetic data. Flexibility
and correctness are overwhelmingly important, while consistency and long-term
maintainability are very much secondary. Methodology evolves very rapidly, and it is
important to use the best techniques available, but it is relatively less important to maintain
analyses from five years earlier. In this context, the analytic system must be small-grained
but allow easy assembly of complex tools from simple parts. Nonrelational data stores,
together with programming in Java or R, are preferred.
In the official statistics context, consistency and maintainability are primary, and while
modern systems are designed to be much more flexible than earlier systems, analysis needs
and methodology actually do not change all that fast. This leads to a preference for larger
modules, and ones that are assembled in something like a linear fashion, rather than the
deeper nesting of a programming language. The SNZ article describes a similar design in
their attack on the “Design and Build” bottleneck, where a broad array of modules is
linked serially into a “configuration”.
If data are to be reused rather than recollected, a fully linked microdata system is
necessary, and a single denormalized data store is attractive. The SNZ article describes
such a store, which follows the trend towards increasingly unstructured storage for Big
Data. The main risk in such complete data integration is security: as the number of possible
data queries increases, it becomes increasingly hard to do any useful content-based
Journal of Official Statistics172
screening. Within the national statistics institutes this problem need not be serious, since
these organizations already rely on trusted individuals and non-computational data
security procedures. Microdata access for outsiders, however, does become more difficult.
When data came as separate surveys it was possible to decide that a specific subset of the
variables for a specific survey could be used by a particular class of outsiders under particular
conditions. Only a small number of decisions needed to be made, and these could be made in
advance.When all analyses rely on data from a comprehensive central store, any combination
of variables might be requested and it is much harder to set down rules.
3. Results or Data?
Traditionally, official statistics organizations produced tables for public consumption, and
sometimes released subsets of microdata for external analysis. An online analytical server
(OAS), as discussed by Krenzke et al. in this special issue, is an intermediate made
possible by inexpensive computing and networks. In principle, it could combine the
security and much of the simplicity of pre-processed tables with some of the flexibility of
microdata analysis.
The difficulty is that decisions about the risk of releasing a particular statistic must
be automated. As the authors emphasize, this is not only difficult, but is specific to the
particular data set. In contrast to supervised analyses of restricted microdata carried out at
internal data centers, it is entirely possible that multiple users could be collaborating to
attack the OAS, so that restricting queries based on information available to the same user
is not sufficient. Security of an NHIS online analytic server is further complicated by the
availability of public-use microdata that could be combined with results from the server.
One of the approaches they evaluate and recommend is to restrict the number of
variables available. This obviously reduces the utility of the system, but it is important not
just because of the known attacks that they demonstrate, but because of potential unknown
attacks. For example, they discuss a situation involving two-way tables of a variable S0
with each of k variables S1 to Sk, and where small cells in some of these tables, combined
with variable weights, allow an individual to be identified. It is obvious that this attack
fails if all the cell counts in all the tables are large.
It may seem obvious that this set of tables could not leak any identifiable information if
all the cell counts were large and the attacker had no detailed information about any of the
joint distributions of S1 to Sk, especially if, say, S0 is only binary and the other variables are
only trinomial. The failure of this conclusion caused widespread consternation in genetic
epidemiology in 2008, when it was discovered that knowing S1 to Sk for an individual in
the sample allowed S0 to be guessed with very high accuracy if k is as large as the typical
cell counts (Homer et al. 2008; Church et al. 2009; Im et al. 2012). In survey statistics the
number of variables is not high enough for this particular attack to be of concern, but the
fact that it came as such a surprise illustrates the problem with high-dimensional data, that
our intuitions about sparseness and identifiability become very unreliable.
It may be valuable to explore the possibilities for wider screened-but-unsupervised use
of microdata. There would be legal implications, which I cannot comment on, but from the
point of view of confidentiality the risk may be quite low. As a comparison, medical
research data often contains variables whose disclosure would be genuinely damaging.
Lumley: Discussion 173
When this data is provided under a suitable informed-consent agreement it is not unusual
for data access to be provided to other researchers, based on an agreement about how it is to
be used, stored, and destroyed. In principle, this is risky. In practice, essentially all
disclosures of confidential medical information occur at medical practices or hospitals.
Staff who are supposed to disclose this information in response to the right requests are
tricked, bribed, or otherwise suborned into giving out the information for the wrong
requests (Anderson 2001, p. 166–172). Since epidemiologists have no valid reasons to be
giving out personal information, it is harder to convince them to go to substantial lengths
to do it for invalid reasons.
4. Economies of Scale and Open Source
The SN architecture explicitly invokes economies of scale, and these are implicit in the NZ
design. In these and some of the other articles there is an automatic conclusion that a single
system should be large enough for all of the data integration, processing, and analysis for
one statistics organization. Some reasons are given for not wanting a system of smaller
scope, but there is no discussion about systems of larger scope. If it always makes sense to
use the same modular data processing or analysis components within SNZ or within the
SN, why does it never make sense to use systems developed externally or cooperatively?
In fact, according to the list maintained by the Section on Survey Research Methods,
Statistics Netherlands, like Statistics Canada, used to sell and support survey software.
Such an approach would also reduce the risk of having no-one available who can maintain
or update the system, and would reduce the cost of the necessary testing and audit
procedures needed for high-reliability software.
Open source approaches could be one way to gain further economies of scale. In low-
level areas such as operating systems and databases there have long been open-source tools
of first-rank quality and reliability. Statistical analysis has also benefited from an open-
source approach, as exemplified by R (R Core Team 2012), which is a completely open
system, and Stata (StataCorp 2012), which is a proprietary system designed to encourage
transparent user-written extensions. In many of these systems the basic architecture and
implementation are the work of a small, coordinated team, with community development
occurring later and providing additional robustness and further features.
If a single national agency, or a small group of them, developed an information
management and analysis system (which they have to do anyway) and then made the
source code and design available to others, further developments could be made without
starting from scratch each time. This “develop then release” approach reduces the
burden of coordination at the initial design time and ensures delivery of the initial system
(to the extent that any approach ensures this), with the benefits of wider development
and Guidelines for Good Practice. New York and Geneva: United Nations.
Nordbotten: Discussion 185
Discussion
Stephen Penneck1
1. Introduction
The redesign of statistical systems to reflect an agency-wide strategic architecture is one of
the most fundamental challenges a statistics agency faces. It is both necessary and difficult.
It is necessary because it will yield the cost savings and quality improvements that funders
and users demand. The development of methods, systems and processes to common
standards under a unified architecture yields savings in development and maintenance costs,
which are timely given ever tightening budget constraints. At the same time common
metadata standards, methods and approaches guarantee quality standards at a time when users
become more demanding. However, although the agency-wide benefits of this approach are
self evident, statistical producers have found this approach hard to deliver.
The strategic redesign of statistical systems poses a number of difficulties and the
articles in this issue give some good examples of these and how statistical producers have
attempted to overcome them. The articles also underline the importance of statistical
leadership, and my discussant note focuses on this aspect.
2. The Strategic Challenge
The extent of the challenge of redesigning systems will vary for each statistical producer,
depending on its history of statistical development and the extent to which past
development has been at a strategic level. The challenge is particularly daunting for
producers that have a diverse infrastructure. Diversification may have arisen for a variety
of reasons. One cause, as in the Office for National Statistics (ONS) in the UK, is the move
from a largely decentralised statistical system to greater centralisation. The component
agencies in decentralised systems tend to follow separate and diverse IT and
methodological approaches. As each production area merges into the centre, it takes
with it its own particular approaches. Or it may result from the agency maintaining diverse
systems in different geographical areas. This is the background set out in the Nealon and
Gleaton article, which describes the National Agricultural Statistics Service (NASS)
experience (and I shall refer to as the NASS article). Or, as in the article by Seyb,
McKenzie and Skerrett from Statistics New Zealand (the SNZ article), diversification may
arise from a process culture (also a factor at ONS in the UK, I think), which together with a
hierarchical organisation structure led to investment decisions being driven by the need to
replace ageing production systems in production silos. At RTI International (the article by
q Statistics Sweden
1 President, International Association for Official Statistics, Former Director General, Office for NationalStatistics (ONS), UK. Email: [email protected]
Journal of Official Statistics, Vol. 29, No. 1, 2013, pp. 187–192
Thalji et al.) it appears to have arisen from a project approach, designed to meet specific
requests from users. In addition, diversification may arise on the technology front as a
result of the preference in some agencies two or three decades ago for IT services to be
bedded out to specific statistical areas, as described in the article by Struijs et al. (the CBS
Netherlands article). This local ownership of IT weakens the strategic drive and often
leads to a multiplicity of different solutions and software licencing arrangements.
Whatever the reason for the problem, I think we would all agree that the costs of
maintaining such diverse systems escalate. It is useful to see this documented in the SNZ
article, and there are also good examples in the NASS article. The CBS article sets out
their Enterprise Architecture approach, being the framework needed to successively
redesign the statistical processes of an organisation. But bringing systems and methods
under a common architecture can be very difficult where the cultural tradition favours
diversity. Local statistical solutions for individual business areas, be they national
accounts, prices or population statistics, will usually produce optimal solutions for those
areas. For example, software that supports a particular editing approach which suits price data
may differ from that which suits social surveys. Users, to the extent that they have a view on
statistical methods, will support local solutions, as will the statisticians that manage those
systems, who may have had a key role in their development. The benefits of locally focused
development will be very evident at the local level. Strategic solutions are often suboptimal
locally, and their benefits are apparent only for the agency as a whole. In the end, the issue
may come to a head if there are simply not the resources to continue with locally led
development. However, managers of local statistical systems will have invested much of their
time and energy in developing and maintaining those systems, and will have considerable
expertise in them, and not necessarily be expert in the strategic solutions being proposed.
3. The Role of Statistical Leadership
In these circumstances, the need for effective top level statistical leadership is clear. By
statistical leadership I mean the ability of the senior professional statisticians in the
organisation, working as a team, to meet the strategic challenge, set the direction and take
their stakeholders with them. Statistical leaders can do this by propounding the benefits of
strategic change to all stakeholders, but especially to funders, to users, and to staff.
Strategic development of statistical systems is expensive and cannot always be funded
internally. External funders will principally be concerned about value for money: that is,
control of costs and delivering financial benefits. Where an organisation is primarily funded
through users, for example, by charging for surveys, judgements need to be made about the
extent to which overhead charges can pay for statistical developments. Government
agencies which are mainly vote funded by government may need to bid for development
funds. The strategic nature of statistical system development generally leads to a statistical
programme made up of many projects. These will often include technology projects,
projects to determine best methods, projects to redesign business processes and projects to
deliver production systems. Indeed technology projects are often prerequisites for statistical
transformation, which requires common technology platforms and standards. Thus the
NASS article describes a project to consolidate network services across their Field Offices;
standardise and integrate survey data and metadata; and generalise survey applications and
Journal of Official Statistics188
databases. The SNZ article covers a modernised IT system, standardised processes and
methodology. The RTI article covers a centralised database, case management system,
survey instruments and a quality evaluation system. The CBS article notes that the
major financial savings will often not be apparent until the programme is complete,
although some articles note the possibility of realising some savings along the way.
Each project is complex and generally there is a high degree of interrelationship
between them, making the estimation of the overall costs uncertain. In addition, financial
benefits will often not be fully apparent until production systems are delivered, often much
later than the early infrastructure development projects. At the beginning of the
programme business cases will be produced, highly uncertain given the nature of these
developments, but essential to secure the funding needed. Unless funders are made aware
of the complexity of the developments planned and the attendant pitfalls, there is a high
risk that failure to deliver the benefits in the business case will adversely affect the
reputation of the agency. The SNZ article stresses the expectations that public sector
agencies have on them to deliver cost-effective statistical systems.
Leaders will also need to ensure that users fully understand the strategic benefits.
Locally managed systems will often deliver rapid responses to changing user
requirements. Users may be concerned that a strategic solution will be less responsive.
They may also be concerned that a significant change of approach will lead to
discontinuities. Users will need to be persuaded of the broader benefits of the new
approach and that the existing approach may not be sustainable in the long run.
The agency’s staff is the key stakeholder group. The new development approach will
require a high level of detailed understanding by all staff. It is likely to require a large
number of projects, all to operate within a common architectural framework. Project
managers and business area managers will need to understand the new approach and be
able to see the implications for their work and how the approach can best be used. Staff in
the agency will often be alert to the benefits of change. It is interesting that in the NASS
article staff were asked where savings in the future might come from, and they identified
the more effective use of staff, seen in the wasteful duplication of functions in the agency.
Agencies often use statements of principles to articulate the new approach. The NASS
article uses a set of four criteria: centralisation, integration, standardisation and flexibility
to provide direction to its transformation. SNZ defined a set of nine “guiding principles”.
CBS founded their enterprise model on a set of key principles. RTI identified
standardisation, integration, and data access. Such statements of principle are powerful
ways of communicating the strategic approach to staff. The degree of commonality in
these sets of principles in different organisations is striking.
With each of these stakeholder groups – funders, users and staff – it is for the
leadership in the agency to articulate the vision, and set out the benefits in ways that can be
readily understood. A relentless focus on communications is essential, together with
setting up good governance and evaluation approaches. The NASS article pays tribute to
the NASS Administrator’s support and the role of the senior executive team. There will
always be differences of view amongst senior executives, especially where a development
programme has led to some re-ordering of priorities. Staff will be looking for the
wholehearted commitment of the senior team to the changes that are about to be made, and
a divided team will have a considerable impact on how well the programme can be
Penneck: Discussion 189
delivered. SNZ recognise the need for a culture and change leadership programme to
develop strong leaders and develop a performance culture. The CBS article also notes
that insufficient communications in the early stages led to misunderstandings.
4. The Complexity of Statistical Development: The Need for Methodologists and
Technologists to Work Together
The need to upgrade and develop technical architecture and the need to improve statistical
methods often go hand in hand, and technologists and methodologists need to work closely
together to ensure success. Both NASS and SNZ describe a move away from traditional
transactions processing, with its emphasis on speed and repeatability of process, towards
analytical processing, providing more flexible and powerful analysis. Technology
innovations such as thin client architecture, virtualisation of servers and the development
of Agile development approaches, as described in the NASS article, lend themselves both
to the easier consolidation of statistical systems and the active engagement of statisticians
in their development.
Although we have come to view a generalisation of the statistical process as set out in
UNECE (2009) as the norm, that high level view covers a degree of complexity, leading to
what SNZ describe as the “design and build” bottleneck. At each stage of the model there
are options and variations, often tied up with particular software choices. In addition,
the detailed coding required in software solutions, even for proprietary software, can be
complex and require a high degree of statistical understanding. Close collaboration is
required between the designers (traditionally the statistical methodologists) and the system
builders (traditionally information technologists). A third player in the development
triangle is the business owner of the system being developed, often a statistician, but
possibly from a related analytical discipline, such as an economist or social researcher, or
maybe an expert process manager. The SNZ article describes this group as “subject matter
specialists”. As the NASS article makes clear, one of the most frequent causes of failure is
a failure to meet business requirements, caused by a lack of understanding between the
three parties concerned. Both NASS and SNZ have employed the agile approach to help
build collaboration by requiring constant communication between the parties. In fact SNZ
have gone further. By developing a highly flexible statistical infrastructure and a generic
set of tools, they have empowered their subject matter specialists enabling them to develop
systems themselves, and providing a quick and low-cost development approach.
Collaboration between professionals builds over time and as the transformation
progresses through a number of projects there is a degree of organisational and individual
learning. Using external IT providers or outsourced staff can be a barrier to this, although it
may be necessary if sufficient skills – either specific skills or the quantity of skills – are
not available in-house. In most countries, contractors will rarely have experience of
developing statistical systems, as such systems are not widely used outside statistical
agencies. Consultants tend to underestimate the complexity of these systems, and if they
are only contracted for a single project, do not have the opportunity to learn. A longer term
strategic relationship is needed, but can be difficult to sustain, given the agencies’ need
for contestability and the contractors’ uncertainty about the value of long-term skills
investment. The employment of contractors for statistical development is difficult to
Journal of Official Statistics190
envisage in the “analyst builds” approach of SNZ. RTI looked at a variety of commercial
off-the-shelf packages for its data collection project, but decided to develop in-house to
maximise its design control.
How can we manage such complexity? Good project management techniques are
essential, together with programme management to ensure interdependencies between
projects are understood and managed. SNZ has developed an approach to complexity by
breaking down the transformation into a number of phases, and setting targets for each
phase. Furthermore, they have used a prototyping approach with their scenario store: this
essentially mirrors the live production environment. Statistical leaders also need to think
about the organisational implications of enterprise-wide strategic developments. The
CBS article describes the need to set up new units to undertake new corporate functions
(e.g., their Data Service Centre), while in the UK, the ONS has brought together
methodologists and IT experts into a Strategy and Standards Directorate, providing an
innovative focus for the Office, and ensuring that their developments are aligned with the
corporate strategy and standards.
5. The Need for Strong Governance
The NASS article is right to point to the need for strong governance as part of the answer to
complexity. It can help to ensure that the strategic benefits are realised, and that business
requirements are met. As noted earlier, all articles have a set of guiding principles which
describes their visions.
The NASS article identifies the role of a Senior Project Manager, which in the ONS we
called an Executive Sponsor, or Senior Responsible Owner: a board level executive who
takes on the role of ensuring strategic alignment and that the agency level business benefits
are delivered. SNZ have set up Portfolio Committees. RTI had a team of senior executives
as a steering committee.
The NASS article also describes an Enterprise Architecture Council (in ONS known as
the Design Authority) that has the role of approving technical standards and of ensuring
that projects meet them. SNZ have a similar Standards Review Board. Without some such
Authority it is very easy for the results of such developments to be an updated technology
with little change to business process or methods, so that the overall business benefits are
not delivered. The CBS have created an Enterprise Architecture Board to interpret their
strategic goals and make decisions on how to operationalise them.
SNZ recognise that their development model, using analysts as builders, requires a high
degree of control to prevent the problems of the past resurfacing. Hence they build
limitations and controls into what the analysts can do.
6. The Need for Organisational Learning
A number of agencies have now been working on strategic redesign for some years. The
CBS has been following its current enterprise architecture approach for about seven years.
SNZ has had more than one attempt at standardising its statistical production. The ONS
has also been on this path for a while now (see Penneck 2009), using different approaches.
There are some similarities here, with the agencies moving from a large-scale
infrastructure development approach to smaller-scale rapid developments.
Penneck: Discussion 191
The RTI has a well-developed approach to evaluating the success of its developments,
which relates performance to success criteria based on its original principles. RTI also
plans to monitor development costs in the new strategic environment compared with ad
hoc developments. The other articles say less on how they will evaluate their programmes,
although they are clear about the need to measure benefits.
Most of the articles set out the points they have learned along the way, and bringing
them together will be a valuable aid for all agencies engaged on this work. The work
described in these articles is necessarily long term, and the membership of project
teams and the holders of key posts will change over time. The leaders of an organisation
will want to ensure that the lessons derived – the positive as well as the negative – are
learned by the whole of the organisation and not only by a few individuals who may
move on (or worse, only by external consultants). Organisational learning is the key to
organisational improvement, and can only be successful if the lessons are widely
disseminated within that organisation.
Is there scope for greater international collaboration? The answer must be “Yes”.
Reading RTI’s development of a case management system reminded me of ONS’ similar
attempt some years ago. Certainly statistical producers should be encouraged to write up
and publish their experiences in this area: there is a great deal of common ground and
potential for international learning.
7. Conclusion
In this short note I have attempted to draw on some of the experiences set out in some
of the articles in this issue, together with my own experience in ONS, to underline the
importance of statistical leadership for an organisation which is embarking on strategic
redesign of its statistical systems. By exercising statistical leadership, the senior statisticians
in the organisation can respond to the strategic challenges of a change typified by:
. a legacy of diverse systems, methods and processes.
. benefits most evident at a corporate level.
. a high degree of complexity.
. a need for good governance.
. a need for organisational learning.
8. References
Penneck, S.J. (2009). The ONS Statistical Modernisation Programme What went right?
What did we learn? Paper given at the Conference on Modernisation of Statistics
Production. Available at: http://www.scb.se/Grupp/Produkter_Tjanster/Kurser/
MIT-ESD Symposium Committee (2001). ESD Terms and Definitions – Version 12.
Working paper ESD-WP-2002-01, Massachusetts Institute of Technology, Engineering
Systems Division, October 19, 2001. Available at: http://esd.mit.edu/wps/esd-wp-
2002-01.pdf (accessed March, 2013)
Ravindra, D. (2012). The Integrated Business Statistics Program: An Overview.
Proceedings of the Fourth International Conference on Establishment Surveys.
Montreal, June 11–14, 2012. Available at: http://amstat.org/meetings/ices/2012/pro-
ceedings/KESIV_TOC.pdf (accessed March, 2013)
Poirier et al.: Discussion 201
Discussion
Siu-Ming Tam1 and Bill Gross1
1. Introduction
We congratulate the Editors for the production of this special JOS issue on “Systems and
Architecture for High-Quality Statistics Production”, and the selection of articles for
inclusion in this volume. Statistics organisations, and national statistical organisations
(NSOs) in particular, are at a crossroad. Faced with significant statistical challenges that
have not been seen before (Pink et al. 2009), they can choose to transform their business
model to “survive and thrive” or, ignoring these challenges, to continue to operate the way
they have been successfully operating in the past and face the increasing risk of becoming
irrelevant in the future.
In order to sustain the mission of NSOs to provide the statistical evidence for informed
decision making, the choice is abundantly clear. Many NSOs have started thinking about
or are embarking on a course with a view to offering new statistical products and services.
They are finding creative ways to harness new data sources (a vision for products) and are
actively looking for more efficient and effective ways in the production of statistics
(a vision for processes). They also aim to maintain the same or a similar level of quality of
the products.
Undertaking business transformation of the statistics production process and
international collaboration in the development of concepts, classifications, tools and
products are increasingly seen as promising strategies to address these challenges.
Recognising the need to work collaboratively with NSOs in the world, the United Nations
Economic Commission for Europe (UNECE) and, in late 2012, the United Nations
Economic Commission for Asia and the Pacific (UNECAP) have set up High Level
Groups comprising Chief Statisticians and Directors General from national and
international statistical offices to work with member countries to develop an international
vision and strategy for business transformation (HLG BAS 2011).
In addition, currently led by the Australian Bureau of Statistics (ABS), the NSOs from
Canada, Italy, New Zealand, Norway, Sweden, and UK are members of a Statistical
Network established to develop and experiment with models for working together to co-
design and co-develop statistical frameworks, concepts, and tools. One of the more notable
q Statistics Sweden
1 Methodology and Data Management Division, Australian Bureau of Statistics, Locked Bag 10, Belconnen,ACT 2617, Australia. Emails: [email protected] and [email protected]: The authors wish to thank Chris Duffy, Alistair Hamilton, Michael Glasson, Brian Studman,and the reviewers for their comments on earlier drafts of this article. The responsibility for the content of thisarticle remains, however, solely with the authors. Disclaimer: the views expressed by the authors do notnecessarily reflect those of the Australian Bureau of Statistics.
Journal of Official Statistics, Vol. 29, No. 1, 2013, pp. 203–211
achievements of the Statistical Network is the development of the Generic Statistical
Information Model (GSIM) (Hamilton and Tam 2012a). This is a metadata model for
describing the information objects used in the statistical production process, as described
by the Generic Statistical Business Production Model (GSBPM) (Vale 2009).
We will restrict our discussion to the Group of Four (GoF) articles by Nealon and
Gleaton, Seyb et al., Struijs et al., and Thalji et al. The reason for our choice is principally
a reflection of our interests in this challenging and emerging area in the work of NSOs. We
will refer to these articles as the NASS (National Agricultural Statistics Service), SNZ
(Statistics New Zealand), SN (Statistics Netherlands), and RTI (RTI International) articles
respectively. Clearly the four articles cover a lot of ground in describing their journey to
transform their business, and it will not be possible to discuss all aspects. Instead we chose
to discuss the strategic issues in the business transformation, how they align with the
emerging international vision for transformation, and conclude with comments on what
we believe are significant challenges facing the NSOs as a statistical community.
2. The Products Vision – the GoF Articles
There are more similarities in the visions articulated in these articles than differences. The
SNZ and SN articles describe efficiency, responsiveness, and expanding data sources as
major aims for their business transformation. On the other hand, the NASS article
articulates efficiency as the main aim, and achieves this through economy of scale by
centralising their collection and network operations in a small number of offices in the
NASS. The RTI article outlines improvement in accuracy and timeliness of their statistical
products and services as their main aim, and seeks to achieve it by developing and
implementing data collection and management systems to manage the production life
cycle of statistics.
Whilst we generally agree with the articulated vision of transformation in the GoF
articles, we feel that, as the articles are predominately focussed on the process vision, there
is a gap in information about their statistical offerings. We argue that the products vision is
the raison d’etre for the process vision and, without a vision for the product, the process
vision can degenerate into a mere pursuit for efficiency. Whilst efficiency is important, we
believe that innovation and creativity in harnessing new data sources to produce richer,
more relevant statistics more responsively are the main challenges facing official
statisticians now. The four emerging IT mega trends of Cloud, Social, Big Data, and
Mobile provide major opportunities.
We therefore believe that readers of the GoF articles would benefit from learning their
plans for the creation of new or better statistical offerings through the strategic use of the
ever-increasing alternative sources of data: of administrative data available from
governments, transactional data from businesses, and Big Data (or “organic data”, Groves
2011) from social media, as well as through the opportunities available from the IT mega
trends. That said, we felt that SNZ and SN are better positioned than NASS and RTI to do
so, given the process transformation being undertaken in these organisations, a point we
will return to later in this discussion. An excellent description of the characteristics of Big
Data in terms of volume, velocity, variety, and degree of structure can be found in Daas
(2012).
Journal of Official Statistics204
In articulating their products vision, the UNECE High Level Group stated:
“The raw materials, the data we use to create our products, will need to be found in the
data that are available throughout society: : :The active pursuit of data and the creation
of products that give insight from an impartial perspective, our unique selling point, will
be our new mission. It will undoubtedly mean that our organisations will have to leave
their comfort zone and will have to question the work that seems so normal at
present : : : ” (HLG-BAS 2011)
There is a paucity of novel and innovative combinations of these different data sources,
both existing and emerging ones, in the creation of new statistics. In the case of Big Data,
Glasson (2012, internal ABS report) provides an interesting insight into why this may be
the case by noting the differences in the supply chain and value proposition of these data
sets between statistical agencies and nongovernmental organisations. There are some
examples of a Big Data application for official statistics. Hal Varian, Chief Economist of
Google, demonstrated in his lecture to ABS staff in 2011 how using Google search terms
and statistical modelling can be used to “nowcast” US unemployment. The methods used
in nowcasting are available in the public domain (Varian and Choi 2009).
Kimura et al. (2012) also describe a collaborative project between the National Data
Centre of Japan and NTT DOCOMO, a Japanese major network operator, to use the
latter’s operational data about location and attribute to provide the capacity to estimate the
daytime population on a real time basis.
Other examples of uses and issues with Big Data can be found in the Volume of
Significance published in August 2012 by the Royal Statistical Society of the UK and in
Daas (2012).
We urge statistical offices to release their plans for the creation of such new statistical
products and services in the public domain with a view to sharing information and
knowledge with their counterparts. In the ABS, our plans include the development and
implementation of interdepartmental protocols for the creation of linked datasets
combining ABS data with administrative data, subject to appropriate approvals, to provide
the information to address complex issues facing contemporary Australia, and the
development of facilities for accessing such datasets for secondary data analysis without
compromising the confidentiality of respondents’ data (Tam et al. 2009; Tam 2011).
3. The Process Vision
There is a wealth of information provided in the GoF articles on the transformation
of statistical processes, ranging from organisation-wide transformational change to
structural/systems change impacting on the collection and processing of information. We
are particularly interested to compare their process vision with that of an emerging
international vision for statistical transformation.
The process vision as articulated by UNECE High Level Group stated:
“The production of statistics should be based on common and standardised
processing: : :We view this as the industrialisation and standardisation of statistics
production: : :The production of official statistical information should have its own
industrial standards : : : ”
Tam and Gross: Discussion 205
Summarising these aspirations, the ABS recently used the slogan “Industrialisation,
Modernisation, Transformation, and Future-Proofing” (IMTP) to galvanise support for its
business transformation program across the ABS, and embarked on a strategy based on the
following philosophies:
. plug and play – to build modular components (e.g., for imputation or weighting)
which are easy to assemble into a reliable processing system, with an aim to
supporting a future “assemble-to-order” statistical business model.
. standardisation and corporatisation – to standardise and corporatise concepts,
classifications, methods, tools, and processes to reduce cost and lead time in the
creation of statistical production processes and to improve timeliness and relevance
of ABS statistical outputs. The effort to standardise and corporatise ABS metadata is
huge and should not be underestimated.
. metadata-driven processes – to build content-agnostic processes whose metadata-
rich outputs are driven entirely by input metadata.
. connectivity – to ensure statistical data and metadata can flow freely from one
modular component of a statistical system to another with little, if any, manual
intervention.
. capability building – to equip staff with the skills in anticipation of the move from
low value-added to high value-added statistical activities; skills of which will be
needed following the completion of the transformation, and
. international cooperation – to share or collaboratively build common standards,
methods, tools and processes to decrease the ABS costs of their development (if
going alone), and to work productively with the Statistical Network to achieve these
aims.
Refer to Hamilton and Tam (2012b) for a more detailed exposition of these ideas.
3.1. GoF Transformation Strategies
Whilst all four statistical organisations plan to standardise tools, SNZ and SN aspire to
build “plug and play” capability in their processes and tools with an aim of assembling
components to form end-to-end statistical process systems quickly and with little or no IT
involvement. In contrast, NASS and RTI have more modest goals and aim to “consolidate
and generalize survey applications” (NASS) and for configuration of a particular
collection to be “done by a programmer with less experience” (RTI). Building “plug and
play” capability is a substantial capital investment and for statistical agencies with a large
number of collections, there is ample opportunity to reap the budgetary benefits of such
investment. Equally important, particularly for centralised statistical agencies, is that this
plug and play capability enables new collections – whether direct, from administrative or
transactional data or repurposing of existing holdings – to be developed and made
operational quickly so that emerging user needs can be met in the time frames they expect.
While SN’s (IT) treatment of metadata is unclear, the other organisations have
information about data, with SNZ storing “metadata close to the data” but “in a way that
facilitates data integration” and the others having a central store. SN and RTI extend the
traditional thinking of metadata covering classification and data items to statistical
Journal of Official Statistics206
processes, but NASS and SNZ handle information about processes and workflows
separately. In addition, RTI has metadata about data, processes and workflows in a central
system, and this has a number of advantages. It allows a process to update metadata about
its outputs automatically and provides a comprehensive store from which to generate
metadata for dissemination. It is easily searchable, thereby facilitating repurposing of data,
reuse of workflows and use of standard processes. A central system should encourage
metadata to be created in a standardised fashion.
We believe that metadata should be extended to cover paradata (Scheuren 2005) and
metadata about statistical processes, as they are important to support an assemble-to-order
business model as described above. Whilst we are not necessarily wedded to a centralised
metadata store, federated data stores need to ensure that the metadata in all the stores are
searchable and accessible by all statistical production staff. Furthermore, good metadata
registration is needed for maximisation of metadata re-use.
Notably, SNZ makes extensive use of tools developed by other statistical agencies, such
as BANFF (Statistics Canada) and Blaise (from SN), which is also used by NASS. The
uptake in the use of tools developed by other NSOs is less than one would have liked to
see. Part of the reason is that the tools that could be used in an organisation are constrained
by the base level language (e.g., R for SN) or statistical package (e.g., SAS for Statistics
Canada, SNZ, ABS) and associated data storage. More widespread use of these tools in the
“future world” seems to require the developers to recognise the importance, and
the provision, of “plug and play”, “connectivity”, and “metadata-driven” capabilities in
the tools.
Summarising the lessons learnt in implementing a similar transformation program
undertaken in the Office of National Statistics (UK), Penneck (2009) emphasised the
importance of leading and sustaining a cultural change in the “new way of doing things”.
Whilst some references were made in the GoF articles about engagement with their
business counterparts and statistical staff in general, there is not a lot of information, if
any, in these articles to assist those who want to learn from their experience. We urge the
authors make them available in the public domain.
3.2. Enterprise Architecture (EA)
A business transformation program is fundamentally a change program. To be successful
in any change programs, it is important to articulate and communicate the vision and
create a roadmap for change, including the creation of short-term wins (Kotter 1995).
Successful change programs in an NSO will, in our view, require transformation of the
business process, of how statistical data and metadata are managed, and of the technology
infrastructure and application platforms. Outside the statistical world, it is customary to
use an EA (Zachman 1987) as a tool to describe the interplay between, and steer, these
essential elements of the change program. We believe that it is a useful tool for NSOs in
undertaking their transformation programs.
From The Open Group’s (2009) Architecture Framework, “[t]he purpose of enterprise
architecture is to optimize across the enterprise the often fragmented legacy of processes
(both manual and automated) into an integrated environment that is responsive to change
and supportive of the delivery of the business strategy.” It is customary to visualise the EA
Tam and Gross: Discussion 207
to comprise a Business Architecture layer, an Information Architecture layer, an
Application Architecture layer, and a Technology layer, typically referred to as the
Enterprise Domains. At the strategic level, the EA also comprises business segments
including statistical leadership, statistical production, statistical support, and business
support, which transcend people, products, and performance in the statistical organisation.
It is also customary to accompany the EA with a set of EA principles. These are used as
a “guiding light” when it is unclear which one of a number of alternative choices, or
pathways in the transformation, should be adopted. The SNZ article provided a set of the
principles for their “Economic statistics business architecture”, but we believe a broader
set covering all official statistics would, for obvious reasons, be preferred.
4. Methodology and Methodology Architecture
Whilst all articles in the GoF mentioned statistical methods in conjunction with tools in the
context of standardisation, the focus of the articles is on the tools, rather than the
methodology. What role did methodology play in the transformational change carried out
in the four statistical organisations, and how did methodologists contribute to the
transformation process?
We believe that methodologists play a crucial role in shaping and contributing to the
development and implementation of strategies to support a business transformation
program. In recognition of this, we believe that the EA for statistical agencies should be
extended to include a Methodology Architecture (MA) within the Business Architecture
layer. Underpinned by the NSO transformational needs, the MA lays out the vision for
methodology, supported by an envisaged future inventory of statistical methods and uses,
contrasting with the current inventory, and a transition plan for migrating from the current
methodological state to the future state.
In developing the MA, we believe consideration needs to be given to the following
issues:
. how the suite of methods should be modularised – what should the scope and
boundaries of each module be and what are the interdependencies?
. how to trade off between ease of application (usability), scope of application
(flexibility), efficiency, and simplicity?
. the availability and use of process quality measures.
. the soundness and consistency of relevant conceptual frameworks underpinning the
methods, and
. the relationship between MA and the Business, Information, Application and
Technology layers within the EA.
5. Challenges for the NSOs as a Community
Pink et al. (2009) argued that given the enormity of the transformation program, it will be
difficult, and indeed not sensible, for NSOs to do it alone. In the transformational space,
we believe that NSOs could work (better) together in the development of the EA
framework, standards (as was shown in the development of GSBPM and GSIM), products,
ways to improve skills, and the processes to manage the transformation. In what follows,
Journal of Official Statistics208
we outline what we believe are key challenges for the NSOs in collaborating as a
community.
5.1. Collaboration in the Development of Future Statistical Products and Services
The use of Big Data as shown in Varian and Choi (2009) and Kimura et al. (2012) to create
timely statistics relevant to official statisticians demonstrates the potential value of these
data sets to contribute to the NSOs’ mission to provide timely and relevant statistics and
services for more informed decision making. One question faced by NSOs is: “Is this a
space that we should be in?” In our view, the answer is obvious if we want to remain
relevant in the future. If so, the question is how. Until recently, official statisticians gave
little attention to Big Data’s potential. However, this is going to be changed with the
UNECE signalling its intention to commission a paper to understand what Big Data is and
how it can be used in official statistics.
The statistical community will benefit from more sharing of ideas, developments and
advances in this space, including the methods for processing and quality assuring the data.
5.2. Collaboration in the Development of Business Architecture (BA)
The GoF articles and our interactions with statistical counterparts in other parts of the
world show that there is general convergence in our thinking on improving the efficiency
and effectiveness of, and growing, our business. There is also remarkable similarity
between the ideas about reusing data, reusing metadata, and reusing statistical methods
and processes to improve the NSOs’ value proposition to their users. Their vision is in
strong accord with the vision of HLG-BAS.
Is the commonality of purposes for transformation in the NSOs of such a high level that
it warrants the development of an international “reference” for statistical BA? If so, what
work is needed for this to occur, who should be leading this work and how can NSOs
contribute? The benefit of such an international collaboration effort is enormous, including
the placement and recognition of statistical production standards like GSBPM, GSIM in
this architecture. In late 2012, UNECE released GSIM 1.0 (UNECE 2012), including a
User Guide and specification for consultation within the international statistical
community. The Statistical Network referred to earlier has commenced a project to
collaborate on developing a “common” BA for the participating countries in the Network.
5.3. New Form of International Collaboration to Create Statistical
Processes and Tools?
Hamilton and Tam (2012b) argued that official statisticians can learn a lot from the model
used by some well-known smartphone manufacturers in getting the world’s developers to
develop applications for their handsets to improve the functionality of the phones and user
experience. They argued that this collaborative model should be added to the “stand-
alone” model (as used in the development of PCAXIS, Blaise, etc.), the “co-development
and co-design” model (as used in developing GSIM), and other existing models for
international collaboration.
Tam and Gross: Discussion 209
Under this “platform-based” collaboration model, developers (e.g., staff in the NSOs)
can upload applications to an internet-based statistical applications store for sharing. In
choosing the processes or tools to plug and play, the official statistician shall no longer be
restricting the search to applications within their own statistical organisation, but will have
applications from other NSOs available to search and to download. In addition, private
developers who want to sell their products to NSOs can also upload them to the same store
for showcasing to the NSOs.
If this new form of international collaboration is to work, a number of prerequisites have
to occur, including a reference EA, with internationally agreed protocols for developing
applications under the EA, standards for plug and play, connectivity, and metadata-driven
systems. Whilst some work has been undertaken on this front, more needs to be done and
particularly more involving the great many NSOs outside Europe, Asia, and Pacific, and
beyond the participating countries in the Statistical Network.
In regard to defining standards for “plug and play”, we are pleased to note that, in
November 2012, HLG BAS commissioned a major collaborative work program to be
undertaken in 2013.
We thank the authors for their thought-provoking articles.
6. References
Daas, P. (2012). Big Data and Official Statistics. Sharing Advisory Board Newsletter,
Issue 7. 2–3. Available at: http://www1.unece.org/stat/platform/download/attachments/