http://pen.sagepub.com/ Nutrition Journal of Parenteral and Enteral http://pen.sagepub.com/content/38/6/717 The online version of this article can be found at: DOI: 10.1177/0148607113495415 2014 38: 717 originally published online 26 July 2013 JPEN J Parenter Enteral Nutr Thomas Gonyon, Phillip W. Carter, Gerald Phillips, Heather Owen, Dipa Patel, Priyanka Kotha and John-Bruce D. Green Probability-Based Compatibility Curves for Calcium and Phosphates in Parenteral Nutrition Formulations Published by: http://www.sagepublications.com On behalf of: The American Society for Parenteral & Enteral Nutrition can be found at: Journal of Parenteral and Enteral Nutrition Additional services and information for http://pen.sagepub.com/cgi/alerts Email Alerts: http://pen.sagepub.com/subscriptions Subscriptions: http://www.sagepub.com/journalsReprints.nav Reprints: http://www.sagepub.com/journalsPermissions.nav Permissions: What is This? - Jul 26, 2013 OnlineFirst Version of Record - Jul 16, 2014 Version of Record >> at IMC - BAXTER HEALTHCARE CORPORATION on July 16, 2014 pen.sagepub.com Downloaded from at IMC - BAXTER HEALTHCARE CORPORATION on July 16, 2014 pen.sagepub.com Downloaded from
Transcript
http://pen.sagepub.com/Nutrition
Journal of Parenteral and Enteral
http://pen.sagepub.com/content/38/6/717The online version of this article can be found at:
DOI: 10.1177/0148607113495415
2014 38: 717 originally published online 26 July 2013JPEN J Parenter Enteral NutrThomas Gonyon, Phillip W. Carter, Gerald Phillips, Heather Owen, Dipa Patel, Priyanka Kotha and John-Bruce D. Green
Probability-Based Compatibility Curves for Calcium and Phosphates in Parenteral Nutrition Formulations
Published by:
http://www.sagepublications.com
On behalf of:
The American Society for Parenteral & Enteral Nutrition
can be found at:Journal of Parenteral and Enteral NutritionAdditional services and information for
at IMC - BAXTER HEALTHCARE CORPORATION on July 16, 2014pen.sagepub.comDownloaded from at IMC - BAXTER HEALTHCARE CORPORATION on July 16, 2014pen.sagepub.comDownloaded from
Pharmacists make use of published compatibility curves to make critical decisions concerning the dosing of calcium and phosphate concentrations in parenteral nutrition formulations. The researchers who generate these compatibility curves often-times perform extensive experimental designs, and usually only a few key data points at the edge of the compatibility zone are used to define the curve. The objective of the current study was to present the value of using logistic regression for gener-ating information-rich compatibility curves. Logistic regres-sion is a well-known form of analysis, which makes use of more of the experimental data and also generates information concerning the probability of failure at each calcium and phos-phate pair. This extra information may provide the physicians and pharmacists with more valuable insight when weighing the clinical benefit vs the precipitation risk.
Introduction
Pharmacists and clinicians rely on compatibility curves for compounding pharmaceutical formulations safely to meet their patients’ therapeutic needs. There are multiple stability risk factors associated with parenteral nutrition (PN) admixtures.1-3 One hazard specifically associated with calcium- and inorganic
phosphate-containing nutrition admixtures stems from the pos-sible formation of calcium phosphate precipitates, which can lead to pulmonary emboli, respiratory distress, and even death.4-7 Currently, calcium and phosphate compatibility curves specific to each parenteral formulation are found in texts and/or software packages.8 Since these compatibility curves are compiled from various original sources representing diverse methodologies and compatibility criteria, a uniform interpretation of each compatibility curve is not always appro-priate. Understanding these variations in compatibility curves
495415 PENXXX10.1177/0148607113495415Journal of Parenteral and Enteral Nutrition / Vol. XX, No. X, Month XXXXGonyon et alresearch-article2013
From Baxter Healthcare, Round Lake, Illinois.
Financial disclosure: This study was fully supported by Baxter Healthcare Corporation.
Supplementary material for this article is available on the Journal of Parenteral and Enteral Nutrition website at http://pen.sagepub.com/supplemental.
Received for publication March 1, 2013; accepted for publication June 4, 2013.
This article originally appeared online on July 26, 2013.
Corresponding Author:John-Bruce D. Green, PhD, Baxter Healthcare, Technology Resources, 25212 W. Illinois Route 120, Round Lake, IL 60073, USA. Email: [email protected]
Probability-Based Compatibility Curves for Calcium and Phosphates in Parenteral Nutrition Formulations
Thomas Gonyon, BS; Phillip W. Carter, PhD; Gerald Phillips, MSc; Heather Owen, MSc; Dipa Patel, BS; Priyanka Kotha, MSc; and John-Bruce D. Green, PhD
AbstractBackground: The information content of the calcium phosphate compatibility curves for adult parenteral nutrition (PN) solutions may benefit from a more sophisticated statistical treatment. Binary logistic regression analyses were evaluated as part of an alternate method for generating formulation compatibility curves. Materials and Methods: A commercial PN solution was challenged with a systematic array of calcium and phosphate concentrations. These formulations were then characterized for particulates by visual inspection, light obscuration, and filtration followed by optical microscopy. Logistic regression analyses of the data were compared with traditional treatments for generating compatibility curves. Results: Assay-dependent differences were observed in the compatibility curves and associated probability contours; the microscopic method of precipitate detection generated the most robust results. Calcium and phosphate compatibility data generated from small-volume glass containers reasonably predicted the observed compatibility of clinically relevant flexible containers. Conclusions: The published methods for creating calcium and phosphate compatibility curves via connecting the highest passing or lowest failing calcium concentrations should be augmented or replaced by probability contours of the entire experimental design to determine zones of formulation incompatibilities. We recommend researchers evaluate their data with logistic regression analysis to help build a more comprehensive probabilistic database of compatibility information. (JPEN J Parenter Enteral Nutr. 2014;38:717-727)
718 Journal of Parenteral and Enteral Nutrition 38(6)
and driving toward a clear, harmonized interpretation will fur-ther reduce patient risk during formulating and compounding activities.
Compatibility curve data are generally built by varying cal-cium and phosphate test compositions within a specific paren-teral formulation and monitoring for evidence of precipitation. Although many factors are known to influence precipitation (pH, amino acid, calcium salt, phosphate type, temperature, and mixing),8-13 the precipitation risk for individual test sam-ples is evaluated using a pass-fail approach where compatible (pass) and incompatible (fail) zones are separated by a compat-ibility curve.
Table 1 enumerates references and highlights the diversi-fied approaches to generating calcium phosphate compatibility curves. These approaches differ in their choice of storage con-ditions (time and temperature), test methods, and the rule used to draw the compatibility line. This work will not dwell on the storage conditions but instead will focus on the choice of test method and the manner of deriving the compatibility curves. As shown in Table 1, some researchers use the highest passing calcium concentration at each phosphate concentration, while others use the lowest failing calcium concentration at each phosphate concentration to generate their compatibility curves. These highest passing or lowest failing individual results are frequently connected by line segments to create the published compatibility curves. It is concerning that 2 separate compati-bility curves can be generated for the same formulation data depending on the rules chosen. To add more complexity to this methodology, different precipitation assays are employed in making the pass-fail assignment. Visual inspection,9,11,14 light obscuration particle-counting techniques,15-17 and optical microscopy (membrane filters18-20 or solutions21-25) are the 3 most common particle detection assays. The use of multiple detection methods is often employed to provide a more com-plete picture of calcium and phosphate compatibility as well.26-
28 Overall, the variations in rules and assays lead to an ambiguity that causes difficulty in the comparison and clear interpretation of published compatibility curves.
The approaches described above ultimately are attempting to provide the data required to construct an admixture-specific calcium-phosphate compatibility diagram and to clearly define zones where the risk of spontaneous particle formation is mini-mal. These particle nucleation events are stochastic in nature, and therefore generating statistically meaningful compatibility curves is challenging due to the large sample sizes needed. In fact, none of the studies referenced above were powered to provide precipitation probabilities as a function of admixture composition. More often, single-point to triplicate measure-ments are made per test condition over a broad array of cal-cium and phosphate concentrations. The most stressful test condition where no appreciable precipitate is detected typi-cally represents a single point on the proposed compatibility curve (highest passing formalism). However, the probability of precipitation occurring if formulated on or just below the line
in a nominally “safe” region remains undefined in the current literature. Perhaps more problematic is the belief that there is a 0% chance of particle formation when formulating with just slightly lower calcium or phosphate concentrations relative to an established compatibility line.
This work describes the use of logistic regression applied to the pass-fail particle detection data to generate probabilistic compatibility curves. Although the logistic regression statisti-cal tool is not new, its application to calcium-phosphate com-patibility of PN formulations is unexplored. The added value to the analyses is the ease of defining the probability of failure (incompatibility) for each curve or each and every calcium and phosphate composition. As a case study, this work used a 5% amino acid/15% dextrose (5/15) code of Clinimix (Baxter, Deerfield, IL), which given the experimental design space was diluted by additives to a 4% amino acid/12% dextrose (4/12) formulation. In the comprehensive data set described below, the logistic regression curves are compared with the classically determined lowest failing and highest passing curves for the 3 most common methods for assessing precipitation (visual inspection, light obscuration, and filtration/microscopy). These resulting probabilistic compatibility curves may assist clini-cians in the safe use of admixtures and could be incorporated into software tools designed to protect the patient.29
Materials and Methods
PN Solutions
The formulation considered for this work consisted of a pre-mixed amino acid/dextrose PN solution (Clinimix 5/15 sulfite-free amino acid in dextrose solution, code 2B7709 or 2B7730; Baxter). This product is a sterile nonpyrogenic hypertonic solu-tion in a flexible dual-chamber Clarity container (Baxter, Deerfield, IL) composed of a patented multilayer film30 that con-tains a fluid-contacting layer of styrene-ethylene/butylene- styrene block copolymer. In this dual-chambered container, 1 chamber contains the amino acids and the other contains the dextrose, and after opening the seal between the chambers, the chambers are mixed thoroughly for use in the formulation below.
Formulation and Storage
All test and control articles were prepared in a laminar flow hood. The order of addition was as follows: PN solution, sterile water (code 2B0304; Baxter), sodium chloride solution (23.4% 4 mEq/mL, code 2900-25 [American Regent, Shirley, NY] or 14.6% 2.5 mEq/mL, code 06657-73 [Hospira, Lake Forest, IL]), potassium chloride solution (2 mEq/mL, code 96520; APP, Schaumburg, IL), potassium phosphates (3 mmol/mL, code 2350-25; American Regent), and magnesium sulfate solu-tion (4.06 mEq/mL, code 2610-25 [American Regent]; 0.325 mEq/mL, code 0409-6729-09 [Hospira]; or 4 mEq/mL, code 5491 [Sandoz, Boucherville, Canada]). All solutions were
at IMC - BAXTER HEALTHCARE CORPORATION on July 16, 2014pen.sagepub.comDownloaded from
720 Journal of Parenteral and Enteral Nutrition 38(6)
commercial solutions for injection. The samples were thor-oughly mixed prior to addition of calcium gluconate (0.465 mEq/mL, code 3900-25; American Regent) and then thor-oughly mixed once more. The addition of the electrolyte solu-tions diluted the amino acid concentration from an initial value of 5% to a range of values (4.1%–4.6%) depending on the exact electrolyte formulation. Formulas were prepared in 100 mL precleaned glass bottles with varying amounts of sterile water added to achieve a uniform final concentration of 4% amino acids and 12% dextrose in all containers, as seen in Table 2. The cleanliness of the bottles was ensured by exhaus-tive rinsing with filtered distilled water followed by testing with the light obscuration method to confirm minimal back-ground particle counts (0 particles/mL greater than 2 µm). All units were mixed by inverting the glass bottles 5 times prior to placing them in the environmentally controlled storage cham-bers. Test articles were first stored at 25 ± 2°C for 24 hours, followed by a transfer to a second chamber set at 40 ± 2°C for 24 hours of storage. The above conditions were intended to stress the test articles beyond both USP <797>31 (30 hours at 20–25°C) and the specified current product insert instruc-tions32 of using promptly after mixing and any storage with additives refrigerated and limited to a brief period, less than 24 hours. After removal from the sample storage chamber and allowing them to reach ambient conditions, all samples were inverted prior to testing. Figure 1 shows the experimental design for this study with several different phosphate concen-trations tested at several different calcium concentrations. In an effort to fully map the compatibility space, this design inten-tionally includes formulations too extreme for clinical applica-tions. Some formulations are expected to precipitate calcium phosphate, whereas others are not. The entire range of the for-mulation space was prepared and tested, with calcium = (0, 4.7, 11.6, 18.6, 27.9, 37.2, and 46.5 mEq/L) and phosphates = (6, 12, 18, 24, 30, and 36 mmol/L). The formulation with 0 mEq/L of calcium and 18 mmol/L of phosphates functioned as the control sample, since it was not expected to precipitate cal-cium salts. Although the total phosphorous concentration was known from the addition of phosphates, the exact ratio of the different phosphate species was not measured, and although the pH of the experiments dictated that the ions were
predominantly the mono and divalent phosphate ions, for sim-plicity, we will hereafter refer to phosphates and use the sym-bol [P] = [ ] [ ] [ ] [ ]PO HPO H PO H PO4
342
2 4 3 4− −
−+ + + .For samples with concentrations that demonstrated exces-
sive visual precipitation (eg, 46.5 mEq/L calcium with 36 mmol/L phosphates), testing was limited to visual inspection. The quantity of precipitate in these cases was not quantified, but from experience, these samples would have formed a thick cake of precipitate had they been filtered for microscopy, or they may have plugged the light obscuration counter. In the second and third experiments, an additional phosphate series at [P] = 9 mmol/L was added, and those formulations that gener-ated excessive precipitation from the first experiment were not prepared in future experiments.
Using the results from the experiments with the 100-mL glass bottles, a series of formulations were created to system-atically probe the breadth of the compatibility zone. These test formulations were prepared in activated 1-L dual-chambered containers to demonstrate the utility of the logistic regression
Table 2. Formulations for the 100-mL and 1-L Systems.
Component Target Concentration 100-mL Actual Value or Range 1-L Actual Value or Range
Figure 1. Compatibility curves are generated from triplicate microscopic measurements labeled as all pass (+), all fail (×), or at least 1 pass and 1 fail (*). Connecting the highest calcium that passed at a given phosphate creates the highest pass curve (dotted line), and connecting the lowest calcium that failed creates the lowest fail curve (solid line).
at IMC - BAXTER HEALTHCARE CORPORATION on July 16, 2014pen.sagepub.comDownloaded from
contours for predicting the more clinically realistic containers. As with the 100-mL bottles, all 1-L test and control articles were prepared in a laminar flow hood and the order of addition was the same as previously with sterile water added to achieve a constant concentration of amino acids and dextrose in each container. The 1-L test and control articles were first stored at 25 ± 2°C for 24 hours followed by a transfer to a second cham-ber set at 40 ± 2°C for 24 hours’ storage prior to performing the identical tests completed on the 100-mL containers.
Visual Inspection
The visual inspection of the test solutions was completed by trained and prequalified analysts performing an untimed inspec-tion of the entire test solutions for the presence or absence of visible particulates. The inspections were performed in a visual inspection booth incorporating both black and white back-grounds with overhead fluorescent lighting providing a mini-mum illumination of 500 foot-candles within the light box.33 A positive visual result for precipitation was defined as the visual observation of any crystals, haziness, or cloudiness within the sample. In the event that the result was positive with a large amount of precipitate, no further particle testing was performed on that specific unit, and the microscopic and light obscuration tests were assumed to exceed the acceptance criteria for each test. For visually positive results where only a few crystals were observed or for samples with no visual crystals but where the haziness or cloudiness detected was barely perceptible, further particle testing with microscopic analysis and light obscuration particle counting was performed.
Microscopic Analysis
A 50-mL aliquot from each unit that passed the visual test or had only a few crystals was filtered through a 0.8-µm reten-tion-rated cellulose ester filter membrane as described in USP <788>34 and USP <1788>.35 The isolated particulate matter present on the test membranes was counted or characterized with a light microscope with lighting prescribed by USP <788>. However, only particulate matter that appeared crystal-line was counted with a light microscope against the following limits: not more than (NMT) 6 particles/mL ≥10 µm and NMT 1 particle/mL ≥25 µm. These more stringent and somewhat arbitrary limits represent 50% of the USP limits for large vol-ume injectable (LVI), which would normally correspond to NMT 12 particles/mL ≥10 µm and NMT 3 particles/mL ≥25 µm. This reduction is an effort to recognize that the USP <788> limits are intended for heterogeneous, randomly sourced extra-neous particulate matter rather than the calcium phosphate crystals expected to be formed in this study.
Light Obscuration Analysis
Particle size analysis and distribution of each formulation were determined using an AccuSizer Model 780 (Particle Sizing
Systems, Santa Barbara, CA) counter equipped with a syringe injection sampler using an LE 400 sensor in extinction mode previously calibrated with 2, 5, 10, 15, and 25 µm of NIST traceable polystyrene latex spheres. Four sequential 4-mL ali-quots from each test solution that passed the visual test or had only a few crystals present were evaluated with the AccuSizer particle counter determining the cumulative particle counts per milliliter greater than or equal to the following sizes: 1.5, 2.0, 5.0, 10.0, and 25.0 µm. The results from the first 4-mL aliquot test from each sample were excluded from the average of the last 3 aliquots. The criterion for passing the light obscuration particle counts test was NMT 25 particles/mL cumulative counts for particles >10 µm, the same as the USP <788> light obscuration limits.
pH Determination
The pH of each test solution was measured with an Orion PerpHecT LogR pH Meter, model 330 (Thermo Fisher Scientific, Boston, MA). The pH meter was calibrated prior to use, and a single pH measurement was performed for each solution.
Logistic Regression Analysis
For the logistic regression analysis, each calcium and phosphate pairing was assigned a zero for a pass and a value of 1 for a failure according to each test method criterion. Logistic regres-sion was used to fit the data from the 100-mL glass bottle exper-iments with a standard interaction model. The standard interaction model is as follows: ln(p/(1 – p)) = a
0 + a
1 [P] + a
2
[Ca] + a12
[P]·[Ca], where [Ca] is the total calcium concentra-tion, [P] is the total concentration of all phosphates, p is the probability of failing this specific test method, and a
0, a
1, a
2, and
a12
are the logistic regression fitting constants. Table 2 provides the fitting coefficients corresponding to each of the 3 test assays, along with χ2 goodness-of-fit values. The Hosmer and Lemeshow (HL) χ2 goodness-of-fit test36 was used to assess how well the 100-mL data were estimated by the logistic regres-sion fits. To confirm the predictive value of the logistic regres-sion, 10 calcium-phosphate pairs were run in triplicate for each test method using the 1-L dual-chambered containers. A χ2 goodness-of-fit test was also used to assess how well the 100-mL–based logistic regression fits predict the 1-L plastic container probability of failure.
Results
Figure 1 shows the experimental design space of the formula-tions and the results from the microscopic inspection of the formulation. The data corresponding to the figures can be found tabulated in the supplementary material. In all figures, the (×) symbols represent concentrations of calcium and phos-phate where the formulation always exceeded (failed) the acceptance limit for that assay (microscopic, light obscuration,
at IMC - BAXTER HEALTHCARE CORPORATION on July 16, 2014pen.sagepub.comDownloaded from
722 Journal of Parenteral and Enteral Nutrition 38(6)
or visual), and the (+) symbols represent those concentrations where the formulation always passed the assay. The (*) sym-bols represent where there was at least 1 pass and 1 fail at the experimental condition probed.
Figure 1 also shows the 2 most common methods for gener-ating the lines that separate the compatible and incompatible zones. One method, termed here highest pass and based on the literature referenced in Table 1, simply connects the highest passing calcium concentrations (highest “+” data point) at a given phosphate level using straight-line segments to “con-nect” the individual data points. Alternatively, the lowest fail method connects data points at the minimum calcium concen-trations showing at least 1 failing data point at a fixed phos-phate concentration. Simple regression analysis or other fitting functions may also be considered for generating compatibility curves based on goodness of fit, physical relevance, or a com-bination of both. Although the quality of the connect-the-dots approach and/or any fitting function will improve with an increasing number of replicates, the analysis will still be based on the data points represented by the highest passing or the lowest failing experimental conditions.
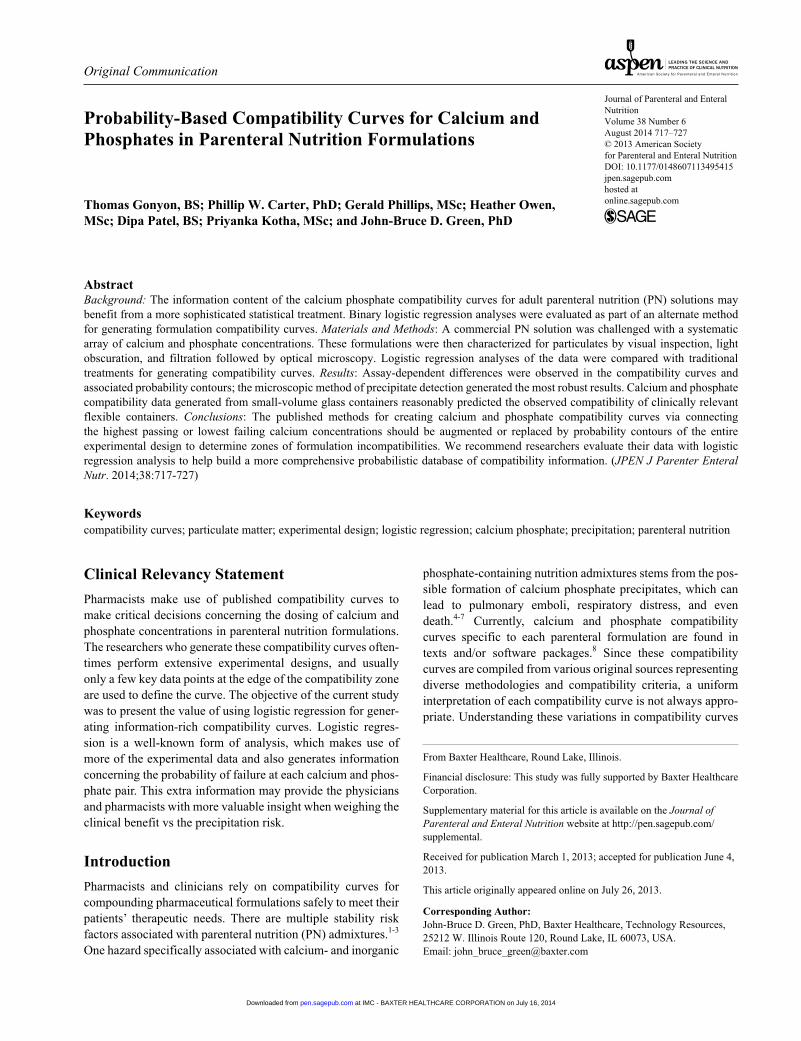
Figure 2 shows probability contours generated from the same data set shown in Figure 1 but using logistic regression analysis. As with any curve fitting, the choice of functional form is an important part of logistic regression. The standard interaction model was chosen because (1) it is a simple and direct model, and (2) the functional form allows for an inverse functional relationship between phosphate and calcium observed in the data. The logistic regression analysis uses all data points in generating the fitting coefficients, found in Table 3. These fitting coefficients are then used to generate the prob-ability contours in Figure 2, which show the likelihood of exceeding the acceptance criteria for the microscopic test at various calcium and phosphate values. For example, a formu-lation prepared with calcium and phosphate values directly on the 50% line would have a 50% chance of exceeding the accep-tance criteria and failing the microscopic test.
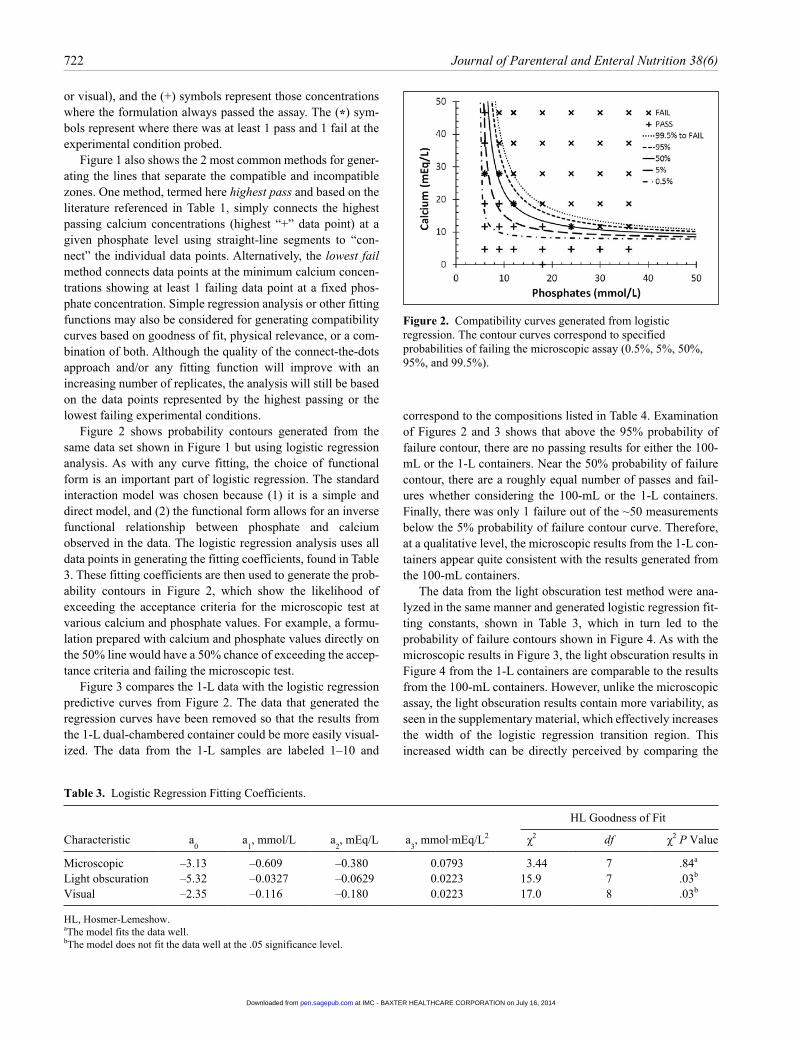
Figure 3 compares the 1-L data with the logistic regression predictive curves from Figure 2. The data that generated the regression curves have been removed so that the results from the 1-L dual-chambered container could be more easily visual-ized. The data from the 1-L samples are labeled 1–10 and
correspond to the compositions listed in Table 4. Examination of Figures 2 and 3 shows that above the 95% probability of failure contour, there are no passing results for either the 100-mL or the 1-L containers. Near the 50% probability of failure contour, there are a roughly equal number of passes and fail-ures whether considering the 100-mL or the 1-L containers. Finally, there was only 1 failure out of the ~50 measurements below the 5% probability of failure contour curve. Therefore, at a qualitative level, the microscopic results from the 1-L con-tainers appear quite consistent with the results generated from the 100-mL containers.
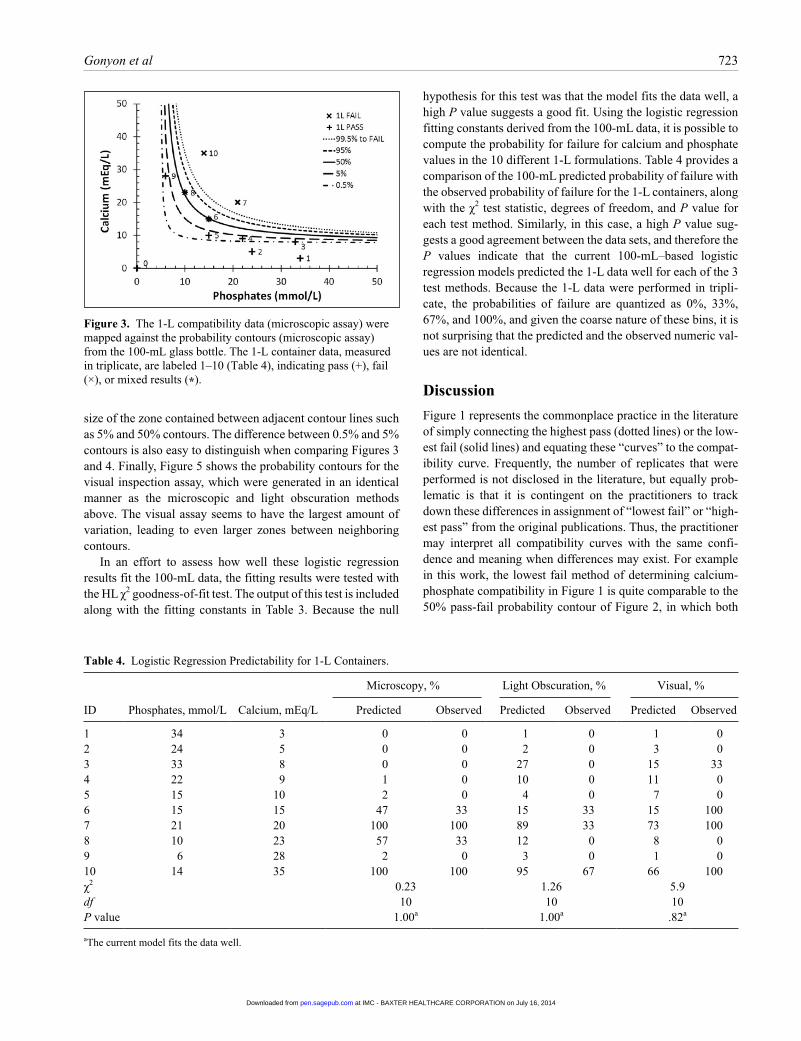
The data from the light obscuration test method were ana-lyzed in the same manner and generated logistic regression fit-ting constants, shown in Table 3, which in turn led to the probability of failure contours shown in Figure 4. As with the microscopic results in Figure 3, the light obscuration results in Figure 4 from the 1-L containers are comparable to the results from the 100-mL containers. However, unlike the microscopic assay, the light obscuration results contain more variability, as seen in the supplementary material, which effectively increases the width of the logistic regression transition region. This increased width can be directly perceived by comparing the
Figure 2. Compatibility curves generated from logistic regression. The contour curves correspond to specified probabilities of failing the microscopic assay (0.5%, 5%, 50%, 95%, and 99.5%).
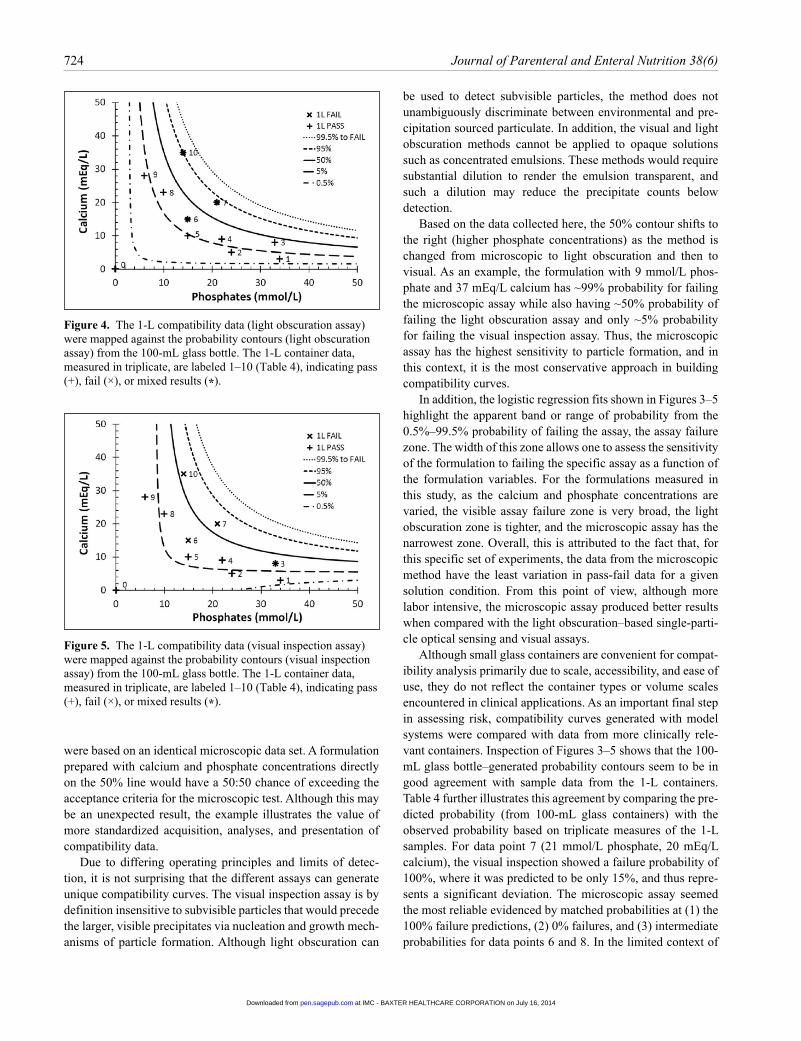
size of the zone contained between adjacent contour lines such as 5% and 50% contours. The difference between 0.5% and 5% contours is also easy to distinguish when comparing Figures 3 and 4. Finally, Figure 5 shows the probability contours for the visual inspection assay, which were generated in an identical manner as the microscopic and light obscuration methods above. The visual assay seems to have the largest amount of variation, leading to even larger zones between neighboring contours.
In an effort to assess how well these logistic regression results fit the 100-mL data, the fitting results were tested with the HL χ2 goodness-of-fit test. The output of this test is included along with the fitting constants in Table 3. Because the null
hypothesis for this test was that the model fits the data well, a high P value suggests a good fit. Using the logistic regression fitting constants derived from the 100-mL data, it is possible to compute the probability for failure for calcium and phosphate values in the 10 different 1-L formulations. Table 4 provides a comparison of the 100-mL predicted probability of failure with the observed probability of failure for the 1-L containers, along with the χ2 test statistic, degrees of freedom, and P value for each test method. Similarly, in this case, a high P value sug-gests a good agreement between the data sets, and therefore the P values indicate that the current 100-mL–based logistic regression models predicted the 1-L data well for each of the 3 test methods. Because the 1-L data were performed in tripli-cate, the probabilities of failure are quantized as 0%, 33%, 67%, and 100%, and given the coarse nature of these bins, it is not surprising that the predicted and the observed numeric val-ues are not identical.
Discussion
Figure 1 represents the commonplace practice in the literature of simply connecting the highest pass (dotted lines) or the low-est fail (solid lines) and equating these “curves” to the compat-ibility curve. Frequently, the number of replicates that were performed is not disclosed in the literature, but equally prob-lematic is that it is contingent on the practitioners to track down these differences in assignment of “lowest fail” or “high-est pass” from the original publications. Thus, the practitioner may interpret all compatibility curves with the same confi-dence and meaning when differences may exist. For example in this work, the lowest fail method of determining calcium-phosphate compatibility in Figure 1 is quite comparable to the 50% pass-fail probability contour of Figure 2, in which both
Figure 3. The 1-L compatibility data (microscopic assay) were mapped against the probability contours (microscopic assay) from the 100-mL glass bottle. The 1-L container data, measured in triplicate, are labeled 1–10 (Table 4), indicating pass (+), fail (×), or mixed results (*).
Table 4. Logistic Regression Predictability for 1-L Containers.
724 Journal of Parenteral and Enteral Nutrition 38(6)
were based on an identical microscopic data set. A formulation prepared with calcium and phosphate concentrations directly on the 50% line would have a 50:50 chance of exceeding the acceptance criteria for the microscopic test. Although this may be an unexpected result, the example illustrates the value of more standardized acquisition, analyses, and presentation of compatibility data.
Due to differing operating principles and limits of detec-tion, it is not surprising that the different assays can generate unique compatibility curves. The visual inspection assay is by definition insensitive to subvisible particles that would precede the larger, visible precipitates via nucleation and growth mech-anisms of particle formation. Although light obscuration can
be used to detect subvisible particles, the method does not unambiguously discriminate between environmental and pre-cipitation sourced particulate. In addition, the visual and light obscuration methods cannot be applied to opaque solutions such as concentrated emulsions. These methods would require substantial dilution to render the emulsion transparent, and such a dilution may reduce the precipitate counts below detection.
Based on the data collected here, the 50% contour shifts to the right (higher phosphate concentrations) as the method is changed from microscopic to light obscuration and then to visual. As an example, the formulation with 9 mmol/L phos-phate and 37 mEq/L calcium has ~99% probability for failing the microscopic assay while also having ~50% probability of failing the light obscuration assay and only ~5% probability for failing the visual inspection assay. Thus, the microscopic assay has the highest sensitivity to particle formation, and in this context, it is the most conservative approach in building compatibility curves.
In addition, the logistic regression fits shown in Figures 3–5 highlight the apparent band or range of probability from the 0.5%–99.5% probability of failing the assay, the assay failure zone. The width of this zone allows one to assess the sensitivity of the formulation to failing the specific assay as a function of the formulation variables. For the formulations measured in this study, as the calcium and phosphate concentrations are varied, the visible assay failure zone is very broad, the light obscuration zone is tighter, and the microscopic assay has the narrowest zone. Overall, this is attributed to the fact that, for this specific set of experiments, the data from the microscopic method have the least variation in pass-fail data for a given solution condition. From this point of view, although more labor intensive, the microscopic assay produced better results when compared with the light obscuration–based single-parti-cle optical sensing and visual assays.
Although small glass containers are convenient for compat-ibility analysis primarily due to scale, accessibility, and ease of use, they do not reflect the container types or volume scales encountered in clinical applications. As an important final step in assessing risk, compatibility curves generated with model systems were compared with data from more clinically rele-vant containers. Inspection of Figures 3–5 shows that the 100-mL glass bottle–generated probability contours seem to be in good agreement with sample data from the 1-L containers. Table 4 further illustrates this agreement by comparing the pre-dicted probability (from 100-mL glass containers) with the observed probability based on triplicate measures of the 1-L samples. For data point 7 (21 mmol/L phosphate, 20 mEq/L calcium), the visual inspection showed a failure probability of 100%, where it was predicted to be only 15%, and thus repre-sents a significant deviation. The microscopic assay seemed the most reliable evidenced by matched probabilities at (1) the 100% failure predictions, (2) 0% failures, and (3) intermediate probabilities for data points 6 and 8. In the limited context of
Figure 4. The 1-L compatibility data (light obscuration assay) were mapped against the probability contours (light obscuration assay) from the 100-mL glass bottle. The 1-L container data, measured in triplicate, are labeled 1–10 (Table 4), indicating pass (+), fail (×), or mixed results (*).
Figure 5. The 1-L compatibility data (visual inspection assay) were mapped against the probability contours (visual inspection assay) from the 100-mL glass bottle. The 1-L container data, measured in triplicate, are labeled 1–10 (Table 4), indicating pass (+), fail (×), or mixed results (*).
at IMC - BAXTER HEALTHCARE CORPORATION on July 16, 2014pen.sagepub.comDownloaded from
this example and for the microscopic assay, switching con-tainer types and solution volumes appears to have no signifi-cant impact on calcium and phosphate compatibility. The P values in Table 4 indicate that the current 100-mL–based logis-tic regression models fit the 1-L data well for each assay. Researchers interested in extending the relevance of the com-patibility curves for a given parenteral formulation could increase the variables from calcium and phosphate to include other variables such as shipping, storage, and reformulation conditions with a smaller design of experiments, as was imple-mented for container type here.
There are a few additional technical details to consider when evaluating the logistic regression–based probability data. The first is the choice of the function used with the logistic regression. In this work, a standard interaction model was cho-sen, in which the [Ca], [P], and an interaction product, [Ca][P], were treated as separate variables. More complicated cubic models, which included higher order terms such as [Ca][P]2, were also examined using stepwise algorithms. In this case, the more complex models did not produce better fits to the data, based on the HL χ2 goodness-of-fit test. The specific functional form of the standard interaction model places certain restric-tions on the functional form of the probability contours. For example, it is not possible for this basic interaction model to generate a peak in the contour plots; however, a detailed expla-nation of the nuances related to the exact functional forms and their impact on the results is outside the scope of this article. The output from logistic regression analysis of the data is not always in the functional form familiar to users, as illustrated in Figure 5 for the 0.5% probability contour for the visual inspec-tion test method. Although implementation of the logistic regression–based probability contours will require an increased level of sophistication, it is expected to lead to higher quality of information.
The choice of experimental design remains critical to effi-cient generation of quality compatibility information. This work used a grid-based experimental design, which was acceptable for this study; however, moving forward, perhaps there are better designs. There is limited value in testing numer-ous formulations that are deep in the 0% or 100% probability of failing zones. Therefore, a coarse grid design could be used to gain insight into a formulation zone where there are interme-diate probabilities of failure, and then a systematic formulation design could be targeted throughout and around this zone. Although replicates are always valuable, in a resource-limited experimental design, the use of logistic regression in this way would de-emphasize the need for replicate measurements at identical formulations to establish “highest passing” criteria. Incrementally unique formulations are easily incorporated in analytical treatments to provide a finer resolution between con-tours produced by logistic regression. Minimizing gaps in the key formulation space will enable the full utility of logistic regression. This experimental approach can be further stream-lined with the use of modern automated electron microscopy
systems that are capable of automatically measuring and iden-tifying (elementally) thousands of particles per filter mem-brane in the range of minutes to hours. This could enable rapid screening of formulation space for precipitation-based incompatibilities.
Although this article focused on precipitation-based com-patibility, some of the ideas can be readily extended to other incompatibilities and even drug interactions. Given the binary output (pass or fail) with regard to USP methods, logistic regression seems appropriate for determining the fitting, and while the detailed functional form may be varied to obtain the best fit to the data, the resulting probability of failure contours should be more useful to pharmacists. In general, the com-pounding space can always be divided into “compatible” and “incompatible” zones. By selecting an assay with appropriate acceptance criteria and by making measurements at key points in this formulation space, logistic regression analysis can be used to generate the probability for the formulation failing the predefined acceptance criteria.
This work used a premixed formula as the case study for generating the probabilistic compatibility information. Although many pharmacies make use of concentrated amino acid formulations that are compounded on demand, the pre-mixed formulas are limited to lower total concentrations. These premixed formulations (eg, Clinimix 5/15) are intended for central vein infusion and may not be appropriate for all appli-cations. When augmented with lipids, these formulations sup-ply the needed amounts of protein, fat, energy, and water for most mildly to moderately ill patients. Similarly, the electro-lyte conditions were chosen not as the typical or standard val-ues but instead to reflect extreme electrolyte levels, which, although potentially outside safety limits, are sometimes administered to patients who may require higher amounts of electrolytes due to excessive losses or increased metabolic demands.37
Conclusion
Experimental design and statistical analysis using logistic regression have been used to generate improved calcium-phos-phate compatibility curves that include probability contours. Probability contours for a PN formulation were generated using a matrix of calcium- and phosphate-containing solutions. The probability contours generated for 100-mL test solutions in glass showed that at lower phosphate concentrations, the microscopic test method generated the most robust and conser-vative compatibility curves. The light obscuration method was less conservative, and the visual method of particle detection was the least conservative of the 3 assays with the largest zones between selected contour lines. The results demonstrate that the uncertainties associated with a single compatibility curve for each formulation can be replaced by contour plots indicat-ing the probability of failure/incompatibility. The application of logistic regression analysis offers superior information
at IMC - BAXTER HEALTHCARE CORPORATION on July 16, 2014pen.sagepub.comDownloaded from
726 Journal of Parenteral and Enteral Nutrition 38(6)
quality when compared with either the connect-the-dots approach or the linear regression of highest passing or lowest failing formulations. The probabilistic contours define the cal-cium and phosphate region of compatibility in a quantitative manner that is potentially more readily accessible, understand-able, and accurate. We recommend the retrospective evaluation of compatibility data with logistic regression analysis and that future compatibility curves plan for logistic regression analysis in experimental designs to help build more comprehensive probabilistic databases. This will enable a shift in the commu-nication of calcium phosphate precipitation information away from single curves with no probability information to a proba-bility-based assessment of each proposed formulation. With time, infrastructure development, and training, this higher quality probabilistic information would be integrated into soft-ware for use in a clinical environment while remaining back-ward compatible for products where probabilistic data do not exist. Presently, based on the available data contained here, we propose using the 5% microscopic curve (5% chance of exceeding the microscopic criteria) as the most appropriate probability-based compatibility curve to be applied for patients.
Acknowledgments
We thank Christine Holly, MSc, for verification of various data tables, as well as Laura Gripman, MSc, RD, and Tom Westercamp, MSc, RPh, for their discussions and guidance.
References
1. Pertkiewicz M, Cosslett A, Mühlebach S et al. Basics in clinical nutrition: stability of parenteral nutrition admixtures. e-SPEN. 2009;4:e117-e119.
2. Wormleighton CV, Catling TB. Stability issues in home parenteral nutri-tion. Clin Nutr. 1998;17(5):199-203.
3. Bouchoud L, Sadeghipour F, Klingmuller M, et al. Long-term physico-chemical stability of standard parenteral nutritions for neonates. Clin Nutr. 2010;29(6):808-812.
4. Knowles JB, Cusson G, Smith M, et al. Pulmonary deposition of calcium phosphate crystals as a complication of home total parenteral nutrition. JPEN J Parenter Enteral Nutr. 1989;13(2):209-213.
5. Lumpkin MM. Safety alert: hazards of precipitation associated with par-enteral nutrition. Am J Hosp Pharm. 1994;51(11):1427-1428.
6. McKinnon BT. FDA safety alert: hazards of precipitation associated with parenteral nutrition. Nutr Clin Pract. 1996;11(2):59-65.
7. Shay DK, Fann LM, Jarvis WR. Respiratory distress and sudden death associated with receipt of a peripheral parenteral nutrition admixture. Infect Control Hosp Epidemiol. 1997;18(12):814-817.
8. Trissel LA. Calcium and Phosphate Compatibility in Parenteral Nutrition. Houston, TX: TriPharma Communications; 2001.
9. Allwood MC. The compatibility of calcium phosphate in paediatric TPN infusions. J Clin Pharm Ther. 1987;12(5):293-301.
10. Allwood MC, Kearney MC. Compatibility and stability of additives in parenteral nutrition admixtures. Nutrition. 1998;14(9):697-706.
11. Poole RL, Rupp CA, Kerner JA Jr. Calcium and phosphorus in neo-natal parenteral nutrition solutions. JPEN J Parenter Enteral Nutr. 1983;7(4):358-360.
12. Driscoll DF, Newton DW, Bistrian BR. Precipitation of calcium phos-phate from parenteral nutrient fluids. Am J Hosp Pharm. 1994;51(22): 2834-2836.
13. Driscoll DF. Stability and compatibility assessment techniques for total parenteral nutrition admixtures: setting the bar according to pharmaco-peial standards. Curr Opin Clin Nutr Metab Care. 2005;8(3):297-303.
14. Eggert LD, Rusho WJ, MacKay MW, et al. Calcium and phosphorus com-patibility in parental nutrition solutions for neonates. Am J Hosp Pharm. 1982;39(1):49-53.
15. Parikh MJ, Dumas G, Silvestri A, et al. Physical compatibility of neonatal total parenteral nutrient admixtures containing organic calcium and inor-ganic phosphate salts. Am J Health Syst Pharm. 2005;62(11):1177-1183.
16. Joy J, Silvestri AP, Franke R, et al. Calcium and phosphate compatibility in low-osmolarity parenteral nutrition admixtures intended for peripheral vein administration. JPEN J Parenter Enteral Nutr. 2010;34(1):46-54.
17. Bouchoud L, Fonzo-Christe C, Sadeghipour F, et al. Maximizing calcium and phosphate content in neonatal parenteral nutrition solutions using organic calcium and phosphate salts. JPEN J Parenter Enteral Nutr. 2010;34(5):542-545.
18. Li LC, Chang HC, Sampogna T. Prediction of calcium phosphate precipi-tation in 3-in-1 total nutrient admixtures: an apparent solubility product approach. Pharm Sci. 1996;2(4):165-168.
19. Lenz GT, Mikrut BA. Calcium and phosphate solubility in neonatal par-enteral nutrient solutions containing Aminosyn-PF or TrophAmine. Am J Hosp Pharm. 1988;45(11):2367-2371.
20. Shatsky F, McFreely EJ, Takahashi D. A table for estimating calcium and phosphorus compatibility in parenteral nutrition formulas that contain TrophAmine plus cysteine. Hosp Pharm. 1995;30(8):690-692.
21. Wong JC, McDougal AR, Tofan M, et al. Doubling calcium and phosphate concentrations in neonatal parenteral nutrition solutions using monobasic potassium phosphate. J Am Coll Nutr. 2006;25(1):70-77.
22. Ribeiro DdO, Lobo BW, Volpato NM, et al. Influence of the calcium con-centration in the presence of organic phosphorus on the physicochemical compatibility and stability of all-in-one admixtures for neonatal use. Nutr J. 2009;8(51):1-13.
23. Fitzgerald KA, MacKay MW. Calcium and phosphate solubility in neo-natal parenteral nutrient solutions containing TrophAmine. Am J Hosp Pharm. 1986;43(1):88-93.
24. Koorenhof MJC, Timmer JG. Stability of total parenteral nutrition sup-plied as ‘all-in-one’ for children with chemotherapy-linked hyperhydra-tion. Pharm Weekbl Sci. 1992;14(2):50-54.
25. MacKay MW, Fitzgerald KA, Jackson D. The solubility of calcium and phosphate in two specialty amino acid solutions. JPEN J Parenter Enteral Nutr. 1996;20(1):63-66.
26. Ronchera-Oms CL, Jimenez NV, Peidro J. Stability of parenteral nutri-tion admixtures containing organic phosphates. Clin Nutr. 1995;14(6): 373-380.
27. Driss Chaieb S, Sfar S, Chaumeil JC. Calcium and phosphates compat-ibilities in parenteral nutrition admixtures. Tunis Med. 2006;84(11): 677-682.
28. Zhang Y, Xu Q, Trissel LA, et al. Physical compatibility of calcium ace-tate and potassium phosphates in parenteral nutrition solutions containing Aminosyn II. Int J Pharm Compound. 1999;3(5):415-420.
29. Canada T, Albrecht J. Parenteral calcium gluconate supplementation: efficacious or potentially disastrous? J Am Coll Nutr. 1998;17(4):401-403.
30. Becker M, Masterson M, Desbrosses F, inventors; Baxter International Inc, assignee. Containers and methods for storing and admixing medical solutions. US patent 6,319,243. 2001.
31. Chapter <797>: Pharmaceutical compounding—sterile preparations. In: United States Pharmacopeia [35th rev] and the National Formulary [30th ed]. Rockville, MD: United Book Press; 2011:350-387.
34. Chapter <788>: Particulate matter in injections. In: United States Pharmacopeia [35th rev] and the National Formulary [30th ed]. Rockville, MD: United Book Press; 2011:5157-5159.
35. Chapter <1788>: Methods for the determination of particulate matter in injections and opthalmic solutions. In: United States Pharmacopeia [35th rev] and the National Formulary [30th ed]. Rockville, MD: United Book Press; 2011:945-954.
36. Hosmer DW, Stanley L. Applied Logistic Regression. 2nd ed. New York, NY: John Wiley; 2000.
37. Mirtallo J, Johnson D, Kumpf V, et al. Safe practices for parenteral nutri-tion. JPEN J Parenter Enteral Nutr. 2004;28(6):S39-S70.
38. Fitzgerald KA, MacKay MW. Calcium and phosphate solubility in neo-natal parenteral nutrient solutions containing Aminosyn PF. Am J Hosp Pharm 1987;44(6):1396-1400.
39. Dunham B, Marcuard S, Khazanie PG, et al. The solubility of calcium and phosphorus in neonatal total parenteral nutrition solutions. JPEN J Parenter Enteral Nutr. 1991;15(6):608-611.
40. Alexander SR, Arena R. Predicting calcium phosphate precipitation in premature infant parenteral nutrition solutions. Hosp Pharm. 1985;20: 656-658.
41. Migaki EA, Melhart BJ, Dewar CJ, et al. Calcium chloride and sodium phosphate in neonatal parenteral nutrition containing TrophAmine
43. MacKay M, Jackson D, Eggert L, et al. Practice-based validation of cal-cium and phosphorus solubility limits for pediatric parenteral nutrition solutions. Nutr Clin Pract. 2011;26(6):708-713.
44. Anonymous. Novamine and Travasol calcium phosphate solubility curves, from Baxter Healthcare Corp. 1995. In: Trissel LA, ed. Calcium and Phosphate Compatibility in Parenteral Nutrition. Houston, TX: TriPharma Corporation; 2001:82.
45. Rosen PD. Personal communication, 1999. In: Trissel LA, ed. Calcium and Phosphate Compatibility in Parenteral Nutrition. Houston, TX: TriPharma Corporation; 2001:14.
46. Anonymous. Maximum calcium and phosphorous concentrations for FreAmine III TPN and PPN solutions, from B. Braun Medical Inc. 2000. In: Trissel LA, ed. Calcium and Phosphate Compatibility in Parenteral Nutrition. Houston, TX: TriPharma Corporation; 2001:46.
47. Anonymous. Calcium/phosphate compatibility in TPN solutions containing Trophamine (6% and 10% amino acids injections), from B. Braun Medical Inc. 2000. In: Trissel LA, ed. Calcium and Phosphate Compatibility in Parenteral Nutrition. Houston, TX: TriPharma Corporation; 2001:98.
at IMC - BAXTER HEALTHCARE CORPORATION on July 16, 2014pen.sagepub.comDownloaded from