Journal of Pharmacological and Toxicological Methods xxx (2016) xxx–xxx
JPM-06355; No of Pages 11
Contents lists available at ScienceDirect
Journal of Pharmacological and Toxicological Methods
j ourna l homepage: www.e lsev ie r .com/ locate / jpharmtox
Research article
Cardiotoxicity screening with simultaneous optogenetic pacing, voltageimaging and calcium imaging
Graham T. Dempsey a, Khuram W. Chaudhary b,⁎, Nicholas Atwater a, Cuong Nguyen a, Barry S. Brown b,John D. McNeish c, Adam E. Cohen d,e,f, Joel M. Kralj a
a Q-State Biosciences, Cambridge, MA, USAb GlaxoSmithKline-Safety Assessment, King of Prussia, PA, USAc GlaxoSmithKline-Alternative Discovery and Development, Cambridge, MA, USAd Department of Physics, Harvard University, Cambridge, MA, USAe Department of Chemistry and Chemical Biology, Harvard University, Cambridge, MA, USAf Howard Hughes Medical Institute, Chevy Chase, MD, USA
Abbreviations: CiPA, Comprehensive in vitro ProarrhyPointes; AP, action potential; CT, Ca2+ transient; hiPSCstem cell; CM, cardiomyocyte; CaViar, Ca2+ andchannelrhodopsin variant; EAD, early after depolarizahERG, human Ether-à-go-go-Related Gene; MEA,Archaerhodopsin; VSD, voltage sensitive dye.⁎ Corresponding author.
Please cite this article as: Dempsey, G.T., etimaging, Journal of Pharmacological and Toxic
a b s t r a c t
a r t i c l e i n f o
Article history:Received 2 February 2016Received in revised form 2 May 2016Accepted 9 May 2016Available online xxxx
Introduction: The Comprehensive in vitro Proarrhythmia Assay (CiPA) initiative seeks an in vitro test to accuratelypredict clinical Torsades de Pointes (TdP).We developed a cardiotoxicity assay incorporating simultaneousmea-surement of the action potential (AP)waveform and Ca2+ transient (CT) in human iPSC-derived cardiomyocytes(CMs). Concurrent optogenetic pacing provided a well-controlled electrophysiological background.Methods:We used the Optopatch platform for all-optical electrophysiology (Hochbaum et al., 2014). In a mono-layer culture, a subset of cells expressed a genetically encoded, calcium and voltage reporter, CaViar (Hou, Kralj,Douglass, Engert, & Cohen, 2014), while others expressed a channelrhodopsin variant, CheRiff. Optical pacing ofCheRiff-expressing cells synchronized the syncytium.We screened 12 compounds (11 acute, 1 chronic) to iden-tify electrophysiological (AP rise time, AP50, AP90, beat rate) and CT effects in spontaneously beating and pacedcultures (1 Hz, 2 Hz).Results: CaViar reported spontaneous and paced APs and CTs with high signal-to-noise ratio and low phototox-icity. Quinidine, flecainide, E-4031, digoxin and cisapride prolonged APs, while verapamil and nifedipine short-ened APs. Early after depolarizations (EADs) were elicited by quinidine, flecainide and cisapride. All but fourcompounds (amiodarone, chromanol, nifedipine, verapamil) prolonged AP rise time. Nifedipine and verapamildecreased CT amplitude, while digoxin increased CT amplitude. Pentamidine prolonged APs after chronic expo-sure.Discussion: The Optopatch platformprovides a robust assay tomeasure APs and CTs in hiPSC-CMs. This addressesthe CiPA mandate and will facilitate comparisons of cell-based assays to human clinical data.
Keywords:CardiomyocytesCardiotoxicityChannelrhodopsinComprehensive in vitro Proarrhythmia AssayHuman induced pluripotent stem cellsMethodsOptogeneticsPacingTorsades de PointesVoltage indicator
1. Introduction
Toxicity accounts for 20% of all drug attrition, of which, approxi-mately one third is cardiovascular (Guengerich, 2011). Drug inducedabnormalities in the electrocardiogram(ECG),which can lead to suddendeath, account for nearly half of these failures (Stevens & Baker, 2009).Because the cost of bringing a novel chemical entity to market can ex-ceed $1.2 billion, along with N10 years of research and development,
thmia Assay; TdP, Torsades de, human induced pluripotentvoltage indicator; CheRiff,
it is critical to address and eliminate cardiovascular toxicity early indevelopment (Adams & Brantner, 2010; Stevens & Baker, 2009).
A major focus in reducing cardiotoxicity has been to identify com-pounds that cause acquired long QT syndrome. A causal link exists be-tween QT prolongation and increased incidence of the potentiallylethal arrhythmia, TdP (Coumel, Leclercq, & Lucet, 1985; Keating,1995; Roden et al., 1996). As our understanding of electrophysiologicalmechanisms for QT prolongation has increased, especially the propensi-ty of hERG potassium channel blockade to cause long QT and TdP, regu-lators have created guidance documents (ICHS7A/B) to characterize thein vitro and in vivo consequences of this property (Haverkamp et al.,2000; ICHS7B, 2005; Sanguinetti, Jiang, Curran, & Keating, 1995; Zhouet al., 1998).
Studies on clinically relevant compounds have shown that hERG in-hibition is not always predictive of QT prolongation and torsadogenicpotential (Lu et al., 2008; Redfern et al., 2003). While selective hERG
with simultaneous optogenetic pacing, voltage imaging and calcium://dx.doi.org/10.1016/j.vascn.2016.05.003
2 G.T. Dempsey et al. / Journal of Pharmacological and Toxicological Methods xxx (2016) xxx–xxx
blockers tend to prolong the QT/QTc interval when unbound plasmaconcentrations fall within 30–100 fold of their hERG IC50, several com-pounds exist in this concentration range yet elicit little to no change inQTc (Gintant, 2011; Redfern et al., 2003). Compounds such asranolazine and verapamil are often cited to refute the sole use of hERGpotency in making predictions of QT, because they block depolarizingcurrents in a manner that compensates for hERG block, renderingthese compounds clinically safe (Chouabe, Drici, Romey, Barhanin, &Lazdunski, 1998; De Ponti, Poluzzi, Cavalli, Recanatini, & Montanaro,2002; Schram et al., 2004; Song, Shryock, Wu, & Belardinelli, 2004).These examples clearly illustrate the shortcomings of simplifying APprolongation to the liability against a single ion channel and highlightthe need for more physiologically relevant in vitro platforms.
Pre-clinical in vivomodels can provide relatively strong concordancewith human QT interval, as is the case for QTc comparisons between ca-nines and humans; whereas other in vitromodels lack the sensitivity orare prone to technical artifacts (Hanson et al., 2006; Holzgrefe et al.,2014). In a retrospective analysis, approximately 80% of cardiotoxicitieswere identified by animal studies (including ECG abnormalities),whereas assays such as the dog Purkinje fiber have shown correlationsas low as 33% (Hanson et al., 2006; Olson et al., 2000). Each of these invitro preparations provides insight into the mechanism of toxicity, yetfalls short of recapitulating the human condition. Regulatory guidelinesacknowledge the investigative nature of the surrogate in vitro assaysand accommodate incorporation of new assays.
The advent of stem cell-derived CMs has revolutionized our ability tostudy human cardiac physiology in vitro. CMs derived from humanembryonic and inducible pluripotent stem cells express myofilamentproteins and have electrophysiological properties similar to primarymyocytes (Doevendans et al., 2000; Ribeiro et al., 2015). These cells ex-press cardiac ion channels, produce APs resembling the atrial, nodal andventricularmyocytes, and create spontaneously beating tissues (He,Ma,Lee, Thomson, & Kamp, 2003; Ma et al., 2011; Mummery et al., 2003;Vanderlaan, Oudit, & Backx, 2003; Wang et al., 2014). HiPSCs can nowbe differentiated into cultures that are predominantly (95%)cardiomyocytes. Early measurements based on small numbers of cellsreportedmixed populationswith action potential waveforms indicativeof ventricular, atrial and nodal cells (Burridge et al., 2014; Lan et al.,2013; Puppala et al., 2013). More recent measurements with voltage-sensitive dyes suggested a continuous distribution of AP morphologies,with a dependence on cell density (Du, Hellen, Kane, & Terracciano,2015).
Studies have shown that hiPSC-derivedCMs exhibit sensitivity to ionchannel inhibitors by replicating characteristic changes in AP duration(Honda, Kiyokawa, Tabo, & Inoue, 2011; Ma et al., 2011). These innova-tions have changed the landscape of pre-clinical cardiotoxicity screen-ing such that regulatory agencies are considering the use of hiPSC-derived CMs as an early screen for proarrhythmic risk (Cavero &Holzgrefe, 2014; Himmel, 2013; Sager, Gintant, Turner, Pettit, &Stockbridge, 2014). As stem cell technologies evolve, it is important torecognize their utility and limitations, especially as they relate to clinicaltranslation.
ECG arrhythmias are by definition electrical, so assaysmustmeasureelectrical activity of CMs when screening for proarrhythmic risk. Whilecurrent-clamp electrophysiology provides the gold standard of APmea-surement, it requires specialized skill, is labor intensive and low-throughput. Thus, researchers have studied the use of multi-electrodearrays (MEA) to recreate a pseudo-ECG from a monolayer of hiPSC-de-rived CMs to measure field potential duration and electrical conduction(Caspi et al., 2009; Guo et al., 2011). Themonolayer of cells behaves as asyncytium much like cardiac tissue; however, the cells are unpaced.Beat rate is a critical determinant of AP duration and rate-associatedchanges in AP waveform can mask more subtle drug effects. Further, itis difficult to qualify the nature of proarrhythmic events, such as earlyversus delayed after depolarizations. MEA provides neither single-cellresolution nor calcium data.
Please cite this article as: Dempsey, G.T., et al., Cardiotoxicity screeningimaging, Journal of Pharmacological and Toxicological Methods (2016), http
Here, we describe a novel optogenetic technique for simultaneousoptical pacing, voltage imaging and calcium imaging in a syncytial cul-ture of hiPSC-derived CMs. Pacing is achieved through optogeneticstimulation of a subset of the cells. These cells synchronize the syncy-tium through gap junction-mediated conduction. Readout is achievedthrough expression of reporter proteins in a disjoint subset of thecells. By segregating the paced cells from the readout cells, we ensurethat the recordings are free of stimulus artifacts.
Pacing of CMs is achieved through the use of a channelrhodopsinvariant called CheRiff (Hochbaum et al., 2014). CheRiff, derived from afreshwater alga, has been shown to trigger APs in neurons with approx-imately 9-fold lower blue light intensity than is required for the widelyused Channelrhodopsin 2 H134R actuator (Hochbaum et al., 2014). Weshow that optical stimulation of CheRiff expressed in a subset of CMscan pace the entire syncytium through gap junction-mediated electricalconduction.
Detection of AP and CT waveforms was accomplished through theuse of a fusion protein called CaViar (for ‘Ca2+ and voltage indicator’(Hou, Kralj, Douglass, Engert, & Cohen, 2014)) consisting of a red-light-excited voltage indicating fluorescent protein, QuasAr2(Hochbaum et al., 2014) with a blue-light-excited Ca2+ indicating pro-tein, GCaMP6f (Chen et al., 2013). The QuasAr2 andGCaMP6f constructshave each been thoroughly characterized individually aswell as in com-bination in the CaViar construct (Hou et al., 2014). QuasAr2 has a rapidresponse time (0.3 ms at 34 °C), high intrinsic sensitivity to voltagechanges (90% ΔF/F per 100 mV), although imperfect trafficking insome cells reduces the effective sensitivity to 10–30% per 100 mV, nophotocurrent (Hochbaum et al., 2014) and negligible capacitive load(Maclaurin, Venkatachalam, Lee, & Cohen, 2013). In neurons, expres-sion of QuasAr2 did not perturb resting voltage, membrane resistance,membrane capacitance, AP initiation voltage or AP waveform(Hochbaum et al., 2014).
The GCaMP6f indicator responds to Ca2+ with a fluorescence dy-namic range of 52:1, a Kd of 375 nM, a Hill coefficient of 2.3 and anCa2+ off-rate of 3.9 s−1 (Chen et al., 2013). This sensor has been usedfor high-resolution mapping of Ca2+ dynamics in hiPSC-derived CMs(Huebsch et al., 2014). In primary CM, a membrane-targeted versionof the sensor showed 4-fold faster kinetics than the cytoplasmic variant,and was shown not to disrupt endogenous Ca2+ handling (Kaestner etal., 2014; Shang et al., 2014). The linker in the CaViar construct hasbeen optimized to eliminate steric interactions or energy transfer be-tween the GCaMP6f and the QuasAr2. CaViar has been used to map si-multaneous propagation of APs and CTs in embryonic zebrafish heartsin vivo (Hou et al., 2014).
The combination of the CheRiff actuator and CaViar reporter formthe basis of the platform we call Cardiac Optopatch. To test CardiacOptopatch as a platform for cardiotoxicity screening, the effects of elev-en compounds were measured at the endogenous beat rate and at twooptically stimulated rates. Pentamidinewas tested under chronic condi-tions, demonstrating the ability of long-termmeasurements. This studyprovides a benchmark for rapidly evaluating cardiotoxic effects, includ-ing AP morphology, kinetics and CTs, of clinically relevant compoundsin an optically paced cardiomyocyte preparation using fluorescentproteins.
2. Methods
2.1. Cell culture and transduction with Cardiac Optopatch vectors
iCell® Cardiomyocytes, Cellular Dynamics Inc. (CDI) were culturedin six-well plates following manufacturer instructions. Five days afterplating, hiPSC-derived CMs were transduced overnight with custommade lentiviral vectors for either CaViar and/or CheRiff. Virus was re-moved from the cells and 1.5 mL of maintenance medium added toeach well. The efficiency of viral delivery was ~90%.
with simultaneous optogenetic pacing, voltage imaging and calcium://dx.doi.org/10.1016/j.vascn.2016.05.003
3G.T. Dempsey et al. / Journal of Pharmacological and Toxicological Methods xxx (2016) xxx–xxx
For voltage imaging, CaViar and CheRiff-expressing cells were resus-pended, mixed and replated onto glass-bottom imaging wells. Dishes(MatTek; 10 mm glass diameter, #1.5) were coated with 10 μg/mLfibronectin (Sigma-Aldrich) in 0.1% gelatin overnight at 4 °C. Cellsexpressing CaViar and CheRiff were trypsinized according to themanufacturer's protocol, mixed at a ratio of 5:1 CaViar:CheRiff, andthen pelleted. The combined cells were then re-suspended in 2.1 mLof maintenance medium and plated overnight at a density of8.5 × 104 cells/cm2 in 100 μL of plating medium. Maintenance medium(1.0 mL) was added to each dish and the cells were fed every 48 h.
For simultaneous voltage and Ca2+ imaging, CheRiff-expressing cellswere replated in the periphery of each imaging chamber, with CaViarcells replated in the center. MatTek dishes were prepared to segregateCheRiff-expressing cells from CaViar-expressing cells. 8 mm-diameterpoly-dimethylsiloxane (PDMS) discs were treated with 10 μg/mL fibro-nectin in 0.1% gelatin on one side for 10 min at room temperature. Thediscswere dried and pressed onto theMatTek dish glass surface, slightlyoffset. The remaining area of the glass was coated with 10 μg/mL fibro-nectin in 0.1% gelatin and left overnight. Cells expressing the CheRiffwere trypsinized according to the manufacturer's protocol and re-suspended in 50 μL of maintenance medium per dish. For plating,50 μL of the CheRiff cells were added to the exposed glass surface andallowed to sit for 40 min at 37 °C in 5% CO2. The PDMS discs were re-moved, the glass surface washed with 150 μL of maintenance mediumand the remaining volume aspirated. Trypsinized CaViar cells werethen re-suspended in 100 μL of maintenancemediumper dish and plat-ed overnight at a density of 7.0 × 10⁴ cells/cm2. 1.0 mL of maintenancemedium was added to each dish and the cells were fed every 48 h.
2.2. Sample treatment prior to imaging
Cells were imaged 5–7 days post-replating (12–14 days post-thaw).Prior to imaging, cells were incubatedwith 5 μM retinal inmaintenancemedium for N30 min at 37 °C in 5% CO2. Exogenous retinal is added tothe dishes to ensure that all QuasAr2 proteins contain the chromophorein the event that inadequate retinal is supplied in the cellular media.Retinal-containing medium was removed from the dish and 1.5 mL ofwarmed maintenance medium without phenol red, vitamins andamino acids (referred to as cardiac imaging buffer) was added. Cellswere kept at 37 °C in 5% CO2 for 30 min prior to imaging.
2.3. Preparation and storage of drug stocks and dilutions
Drugs were purchased as dried powders (Sigma-Aldrich). Com-pounds were dissolved in DMSO, with the exception of E-4031 whichwas dissolved in H2O, at a stock concentration of 10 mM. Compoundswere solubilized by vortexing the solution at room temperature untildissolved. Stock solutionswere stored at−20 °C until use. Immediatelyprior to use, drugs were diluted in cardiac imaging buffer. Addition of100 μL of diluted stock to the dish achieved the final drug concentration.A blank containing cardiac imaging buffer alone was prepared for eachdrug. Drugs were kept at 37 °C in 5% CO2 prior to use.
2.4. Spontaneous beating and paced action potentials
CMs expressing CaViar were exposed to whole-field illuminationwith red laser light (λ = 640 nm, 50 W/cm2) to excite fluorescence ofQuasAr2. Fluorescence was collected via a 20× water immersion objec-tive with a numerical aperture (NA) of 1.0 through a Cy5 emission filter(Chroma). Signals were recorded on a sCMOS camera (Hamamatsu) atframe rates of 100 Hz or 500 Hz. Pulses of blue LED illumination(6 ms, 0.5 W/cm2
, λ = 488 nm) stimulated CheRiff, which paced theentire syncytium through gap junction-mediated conduction.
Please cite this article as: Dempsey, G.T., et al., Cardiotoxicity screeningimaging, Journal of Pharmacological and Toxicological Methods (2016), http
2.5. Simultaneous imaging of voltage and Ca2+
Pulses of blue LED illumination (6ms, 0.5W/cm2,λ=488nm) stim-
ulated CheRiff in the peripheral cells to pace the syncytium. Blue laserlight (λ = 488 nm, 0.15 W/cm2) excited fluorescence of GCaMP6f inthe central cells. Red laser light (λ = 640 nm, 50 W/cm2) excited fluo-rescence of QuasAr2 in the central cells. A dual-view imaging systemprojected emission from GCaMP6f (525–575 nm) and from QuasAr2(660–760 nm) onto adjacent halves of a sCMOS camera, operating at aframe rates of 100 Hz or 500 Hz.
2.6. Drug measurements
Imaging was performed on a custom-built epi-fluorescence micro-scope. Cells weremaintained at a temperature of 35–37 °C using a heat-ed stage (Warner Instruments) and objective collar (Bioptechs). Ahome-built environmental chamber maintained 100% humidity and5% CO2.
The imaging protocol comprised measurement of spontaneous ac-tivity (30 s), immediately followed by activity under 1 Hz and 2 Hz pac-ing (15 s each), repeated in three fields of view (FOV). Drug additionstarted with a blank, followed by within-dish dose-escalation. A vehiclecontrol was performed for DMSO at concentrations of 0.003%, 0.01%,0.03%, 0.1% and 0.3%.
2.7. Analysis
Voltage traceswere first corrected for photobleaching using a slidinglinear interpolation with a 2 s window. Each trace was scaled to reportfractional changes in fluorescence relative to baseline (ΔF/F). The firstderivative of each trace was used to locate the spike upstroke (maximaldF/dt). In paced recordings, blue light stimulus artifacts were removedby linear interpolation between the frames immediately before andafter the stimulus pulse. There was typically a 10 ms delay betweenthe onset of the blue pulse and the upstroke of the AP. Ca2+ traceswere not corrected for photobleaching. The spike timing was extractedusing the information from the voltage traces. Each Ca2+ trace wasscaled to fractional fluorescence units, ΔF/F.
The inter-beat intervalwas calculated by recording the average time,in seconds, between AP upstrokes,whose timingwas determined as de-scribed above. AP50 and AP90 were calculated from the average beatfrom each 100 Hz frame-rate movie. The AP width was the time be-tween crossing 50% (or 10%) of the maximum fluorescence deviationon the upstroke and the downstroke. Linear interpolation was used toachieve sub-frame precision. The rise time was determined from500 Hz movies. The upstroke was defined as the time for the fluores-cence to travel between 30 and 70% of the full swing. Timingwas calcu-lated with sub-frame precision using linear interpolation. The reportedvalue was the mean rise time over all beats in a given trace. The Ca2+
transientwas characterized by the amplitude ofΔF/F in theCT, averagedover all beats in a given trace.
All error bars reported represent the standard error of the meanacross three FOV acquired in each of two dishes unless indicated other-wise. All statistical comparisons were performed using a one-wayANOVA with Dunnett's test for statistical significance. All P values areconsidered significant if b0.05.
3. Results
3.1. QuasAr2 accurately and non-perturbatively reports AP waveforms
We first tested the capability of QuasAr2 to report AP waveforms bycomparing with a highly sensitive VSD, FluoVolt (Miller et al., 2012).QuasAr2 was expressed under control of the CMV promoter in a subsetof hiPSC-derived CMs and all cells were labeled with FluoVolt. The two
with simultaneous optogenetic pacing, voltage imaging and calcium://dx.doi.org/10.1016/j.vascn.2016.05.003
4 G.T. Dempsey et al. / Journal of Pharmacological and Toxicological Methods xxx (2016) xxx–xxx
reporters absorb and emit at different wavelengths, so their signalswere readily separated and recorded simultaneously (Fig. 1).
Spontaneously beating cells expressing QuasAr2 and labeled withFluoVolt showed bursts of fluorescence from each reporter, synchro-nous with the beating. To test whether QuasAr2 accurately reportedthe underlying AP waveform, we compared the FluoVolt and QuasAr2signals recorded from the same cell. The two waveforms showed goodcorrespondence (b2% difference in AP50; Fig. 1A). To test whether ex-pression of QuasAr2 affected the AP waveform, we compared FluoVoltsignals in neighboring cells ± QuasAr2 expression. The FluoVolt wave-form showed no detectable difference between cells ± QuasAr2 (Fig.1A).
Because QuasAr reporters require high illumination intensity, wetested for photobleaching or phototoxicity arising from imaging of Qua-sAr2 in CMs. Fig. 1B shows the QuasAr2 fluorescence during 500 s ofcontinuous red laser illumination (50 W/cm2), with baseline drift re-moved. The signal amplitude decreased by 12% during the acquisitionand showed a modest shortening of the AP50 (199 ms to 192 ms) andAP90 (318 ms to 307 ms). This level of variability in AP width is withinthe natural variation in spontaneously beating hiPSC-derived CMs.
3.2. CheRiff and CaViar form the Optopatch system to optically stimulateand record voltage and Ca2+ in hiPSC-derived CMs
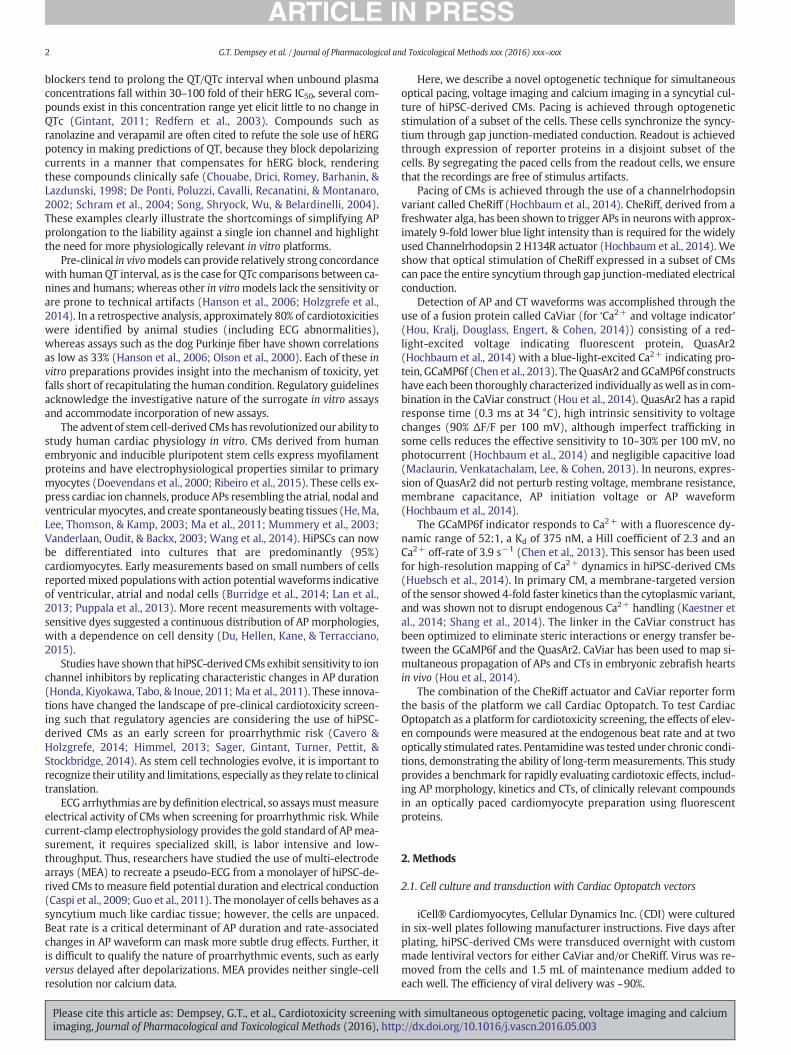
To avoid artifacts from non-specific channelrhodopsin conductance,cell expressing CheRiff alone were used to pace the syncytium. For de-tection of APwaveform alone, cells expressing CheRiff and cells express-ing CaViar were intermixed (Fig. 2). For detection of APs and CTs,CheRiff-expressing cells were plated to the side of the syncytium, toavoid spurious CheRiff activation by the blue light used to exciteGCaMP6f (Fig. 2B). Fig. 2C shows simultaneously recorded single-trialfluorescence time traces for QuasAr2 and GCaMP6f, without filteringor other post-processing. AP and CT waveforms could be detected forspontaneous or paced beating at 1 Hz and 2 Hz.
3.3. Cardiac Optopatch as a platform for cardiotoxicity testing
We next tested the effects of drugs on cardiac AP dynamics at 37 °C.We measured voltage transients in 8–10 cells per FOV, at three pacingrates, three FOVs per dish, six drug concentrations (1 ‘blank’ with no
Fig. 1.QuasAr2 reports cardiomyocyte (CM) action potentials (APs). (A) Comparison of the CMvoltage-sensitive dye, FluoVolt. Cells were sparsely transfected with the QuasAr2 construct anddetection centered at 720 nm. FluoVoltwas excited by 488nm laser lightwith fluorescence detefrom a cell expressing QuasAr2 (red line) and labeled with FluoVolt (green line). The lower traabsence (FluoVolt+, QuasAr2−, cyan) of QuasAr2 expression. (B) Phototoxicity and photobleac(~50 W/cm2) for 500 s. Expanded views of the fluorescence recording are shown in the lowereferred to the web version of this article.)
Please cite this article as: Dempsey, G.T., et al., Cardiotoxicity screeningimaging, Journal of Pharmacological and Toxicological Methods (2016), http
drug and 5 drug concentrations) and two dishes. The duplication overdishes was to control for dish-to-dish variation.
Dish-to-dish variability across all of the studies was quantified using‘blank’ measurements made immediately prior to compound addition.Fig. 3 shows average AP and CT waveforms as well as dot density plotscomparing AP50, AP90, beat rate and rise time for spontaneously beat-ing cultures and cultures paced at 1 Hz and 2 Hz. The pacing shortenedthe AP in a rate-dependentmanner and decreased dish-to-dish variabil-ity in AP parameters (Fig. 3C). The AP50was 391±61ms (mean± s.d.)in spontaneously beating cultures, 293 ± 24 ms at 1 Hz pacing and191 ± 17 ms at 2 Hz pacing. AP90 showed a similar trend (528 ±79 ms for spontaneous beating, 422 ± 40 ms for 1 Hz pacing, 293 ±23 ms for 2 Hz pacing), as did the rise time, but only at 2 Hz pacing(3.9 ± 1.0 ms for spontaneous beating, 3.3 ± 1.1 ms for 1 Hz pacing,2.8 ± 0.4 ms for 2 Hz pacing). The dot density plot is also shown forthe spontaneous beat rate of the cultures (32.1 ± 7.6 beats/min).
Cells followed the specified pacing regime, and voltage changeswere detected with fractional fluorescence changes of ΔF/F = 30% andhigh signal-to-noise ratio (500:1 at 100 Hz frame rate; 200:1 at500 Hz frame rate). In the un-paced culture, the AP width showed anapparent decrease with increasing DMSO concentration: from 0% to0.3% DMSO, AP50 decreased from 464 ± 11 ms to 394 ± 8 ms andAP90 decreased from 600 ± 23 ms to 512 ± 15 ms (not shown). How-ever, these results are explained by the increase in the spontaneous beatrate from 25.8 ± 0.9 to 28.8 ± 2.4 beats/min over the course of 75 minmeasurement. Under optical pacing conditions, the fractional changesin AP parameters were approximately three-fold smaller: at 1 Hz from0% to 0.3% DMSO, AP50 decreased from 315 ± 8 ms to 292 ± 10 msand AP90 decreased from 439 ± 20 ms to 408 ± 19 ms.
3.4. Acute drug effects on AP waveform as measured by Cardiac Optopatch
To characterize pharmacological effects on APs, we tested com-pounds with known mechanisms, including several hERG K+ and Na+
channel blockers, as well as some with multiple targets. A summary ofthe effects of compound addition on voltage dynamics is shown inTable 1, as determined using Optopatch.
Cisapride is a gastroprokinetic removed from themarket due to car-diac side effects arising from hERG block (Hennessy, Leonard,Newcomb, Kimmel, & Bilker, 2008). In our Optopatch assay, cisapride
APwaveforms, asmeasured by the genetically encoded voltage indicator QuasAr2 and thethen treated with FluoVolt dye. QuasAr2 was excited by red laser light with fluorescencection centered at 525 nm. The top panel shows the simultaneously recordedAPwaveformsce compares the FluoVolt AP waveform in the presence (FluoVolt+, QuasAr2+, green) andhingmeasurement of QuasAr2. Cells were imaged under continuous red laser illuminationr panels. (For interpretation of the references to color in this figure legend, the reader is
with simultaneous optogenetic pacing, voltage imaging and calcium://dx.doi.org/10.1016/j.vascn.2016.05.003
Fig. 2. Optogenetic constructs and plating schemes for simultaneous pacing, voltage and Ca2+ measurement. (A) Schematic structures of optogenetic proteins used for pacing anddetection of voltage and intracellular Ca2+. The crystal structures of CheRiff and QuasAr2 have not been solved; the diagrams show homologous proteins. Pacing of CMs is achievedthrough pulsed 488 nm LED illumination of CheRiff. The CheRiff construct is coupled to an eGFP tag for detection of CheRiff expression. A fusion protein called CaViar (Hou et al.,2014), consisting of QuasAr2 (Hochbaum et al., 2014) fused to GCaMP6f (Chen et al., 2013), was used for simultaneous voltage and Ca2+ imaging. QuasAr2 was excited via red laserlight. GCaMP6f was excited via blue laser light. Cells were separately transduced with either CheRiff or CaViar vectors. (B) CM plating configurations. For simultaneous optical pacingand voltage imaging, CheRiff cells (solid cyan circles) were co-mingled with CaViar cells (solid red circles). The yellow dotted line indicates a microscope field of view. Forsimultaneous optical pacing and imaging of both Ca2+ and membrane voltage, cells were plated to spatially segregate CheRiff-expressing cells to avoid optical crosstalk. The CheRiff-expressing cells lay outside the imaging region. (C) Voltage traces for spontaneous beating (black), paced beating at 1 Hz (blue) and paced beating at 2 Hz (red). Optical pacing stimuliare shown as cyan dashes. The simultaneous measurement of Ca2+ (magenta) is shown at each pacing condition. (For interpretation of the references to color in this figure legend, thereader is referred to the web version of this article.)
5G.T. Dempsey et al. / Journal of Pharmacological and Toxicological Methods xxx (2016) xxx–xxx
had a pronounced effect on the AP waveforms (Fig. 4A, C). Under spon-taneous beating, 0.1 μM cisapride increased AP90 (from 536 ± 8 ms to851 ± 4 ms, Fig. 4C). The spontaneous beat rate remained constant be-fore decreasing sharply at 1 μM. At 1 μM, EADs were observed, alongwith a dramatic increase in the AP90 to 1200 ± 210 ms (Fig. 4A, C).The effects of additional hERG channel blockers, E-4031 andterfenadine, are summarized in Table 1.
We next tested several Na+ channel blockers including flecainide(Fig. 4B, D). Flecainide, at 1 Hz pacing, increased the AP90 from465 ± 7 ms to 616 ± 2 ms at 3 μM (Fig. 4D). The rise time increasedfrom 2.6 ± 0.1 ms to 9.4 ms at 3 μM. At 3 μM, cells showed a cessationof spontaneous beating and at 10 μM stopped beating all together(Fig. 4B). The effects of the Na+ channel blockers lidocaine and quini-dine are summarized in Table 1.
Finally, two drugs showed no effects at any concentrations tested.Amiodarone, which exhibits Class I, II, III and IV properties, showed nosignificant changes with increasing concentration in either of the mea-surements. Similarly, chromanol had no effect on the AP waveforms.
3.5. Acute drug effects on AP waveform and CT dynamics as measured byOptopatch
We next tested three compounds using simultaneous measurementof voltage and Ca2+. A summary of the effects of compound addition onvoltage and calcium dynamics is shown in Table 1.
As in the voltage-only measurements, DMSO addition showed littleeffect on the AP waveforms or CTs. The measured amplitude of the cal-cium transients slightly decreased throughout the experiment due to
Please cite this article as: Dempsey, G.T., et al., Cardiotoxicity screeningimaging, Journal of Pharmacological and Toxicological Methods (2016), http
photobleaching of the GCaMP6f sensor; at 1 Hz pacing the amplitudedecreased from ΔF/F = 0.13 ± 0.01 to 0.08 ± 0.01 at 0.3% DMSO. Atthe spontaneous beat rate, the AP50 decreased from 352 ± 1 ms to278 ± 7 ms and AP90 decreased from 481 ± 3 ms to 392 ± 4 ms at0.3% DMSO, respectively. This decrease is consistent with the observedincrease in spontaneous beat rate from 34.7 ± 1 bpm to 42.6 ±1 bpm. This change was smaller in paced cultures. At 1 Hz pacing, theAP50 decreased from 275 ± 2 ms to 252 ± 3 ms at 0.3% DMSO andAP90 decreased from 420 ± 1 ms to 356 ± 2 ms at 0.3% DMSO.
Nifedipine affected voltage and calcium transients in both spontane-ously beating and paced cultures (Fig. 5).Most notably, the calcium am-plitude showed a decrease from ΔF/F = 0.12 ± 0.02 to 0.08 ± 0.02under 1 Hz pacing conditions at the lowest concentration tested(0.01 μM), and continued to decrease to 0.02 ± 0.01 at 0.3 μM. At 1 Hzpacing, AP50 decreased from 307 ± 6 ms to 171 ± 18 ms at 0.03 μMas did AP90 from 407 ± 2 ms to 251 ± 22 ms before the spontaneousbeat rate exceeded the pacing rate (Fig. 5B). The syncytium stoppedbeating at 1 μMnifedipine. The effects of additional Ca2+ channel effec-tors, verapamil and digoxin, are summarized in Table 1.
3.6. Cardiac Optopatch reports chronic drug effects on AP waveform
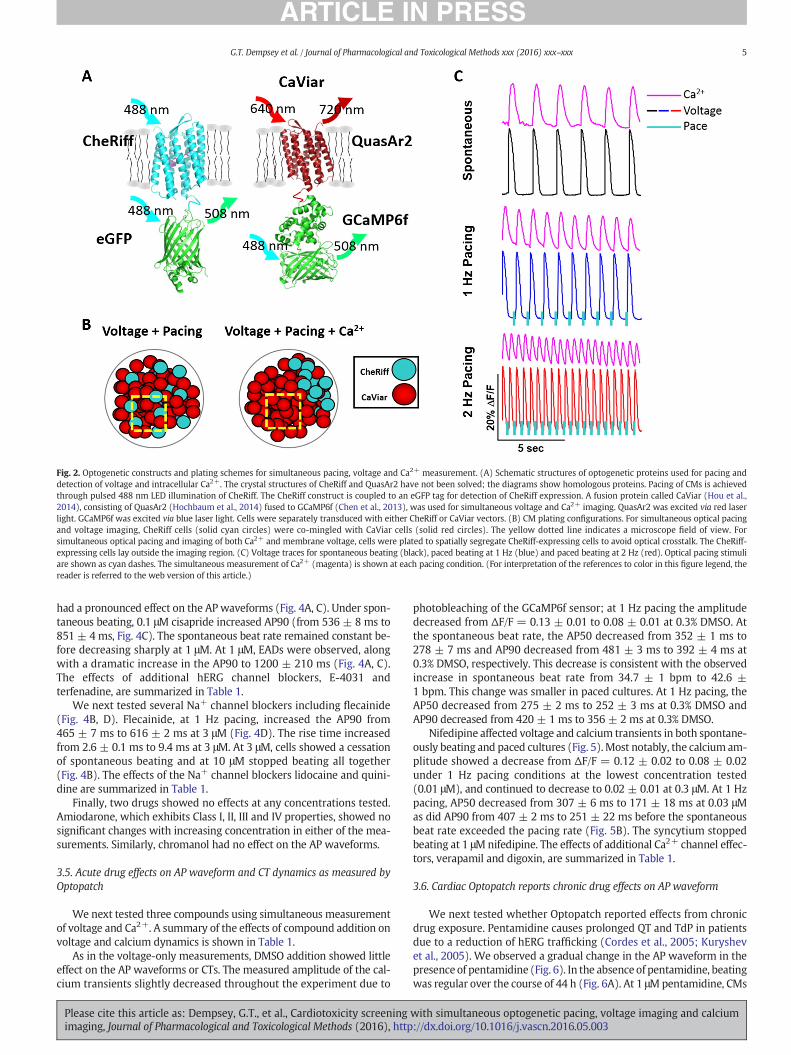
We next tested whether Optopatch reported effects from chronicdrug exposure. Pentamidine causes prolonged QT and TdP in patientsdue to a reduction of hERG trafficking (Cordes et al., 2005; Kuryshevet al., 2005). We observed a gradual change in the AP waveform in thepresence of pentamidine (Fig. 6). In the absence of pentamidine, beatingwas regular over the course of 44 h (Fig. 6A). At 1 μMpentamidine, CMs
with simultaneous optogenetic pacing, voltage imaging and calcium://dx.doi.org/10.1016/j.vascn.2016.05.003
Fig. 3. Dish-to-dish variability of AP and CT parameters. (A) Average AP and (B) CT waveforms at spontaneous and paced regimes. (C) Dish-to-dish variability of AP and CT parametersbefore compound addition. Dot density plots for the AP50, AP90, AP rise time and spontaneous beat rate showing dish-to-dish variability across different beat rates. AP parametersshow reduced variability with pacing, as indicated by the tighter clustering of data points. Black horizontal lines indicate the mean of the distributions.
6 G.T. Dempsey et al. / Journal of Pharmacological and Toxicological Methods xxx (2016) xxx–xxx
showed no acute change in APwaveform (Fig. 6B). However, at 20 h, theAP waveform showed clear AP90 prolongation, and at 44 h, EADs weredetected. At 10 μM pentamidine, we observed a dramatic AP90 prolon-gation after 20 h (Fig. 6C). Cells did not beat at 44 h. These measure-ments demonstrated that the Cardiac Optopatch system can probelong-term effects of drug exposure.
4. Discussion
Advances in drug screening for safety (Hardy, Lawrence, Standen, &Rodrigo, 2006; “International Conference on Harmonisation; guidanceon S7B Nonclinical Evaluation of the Potential for Delayed VentricularRepolarization (QT Interval Prolongation) by Human Pharmaceuticals;availability. Notice,” Federal Register, 2005; Ma et al., 2011) and efficacy(Itzhaki et al., 2011; Yazawa et al., 2011), new stem cell-based therapies(Segers & Lee, 2008) and improved understanding of cardiac develop-ment (Panakova, Werdich, & Macrae, 2010) all necessitate new ap-proaches to simultaneously measure voltage and calcium dynamics,
Table 1Summary of the effects of compound addition on select features of the action potential and calcifirst occurred is listed. The symbols ‘↑20%’ and ‘↓20%’ indicate that the listed parameter increasedA dashmark (–) implies that no effectwas observed. ‘Stop beating’ refers to the lowest concentrin at least one field of view. Cells that did not adhere to the specified pace rate were omitted f
Please cite this article as: Dempsey, G.T., et al., Cardiotoxicity screeningimaging, Journal of Pharmacological and Toxicological Methods (2016), http
with increased throughput, high dynamic range of spatio-temporal res-olution and the ability tomake both acute and chronicmeasurements invitro and in vivo (Kaestner & Lipp, 2011; Leyton-Mange et al., 2014;Mandel et al., 2012). The CiPA initiative encourages creation of a morereliable assay to predict cardiac toxicity in vivo. One approach tocardiotoxicity screening is to use VSDs, which have been used to recordAP waveforms from intact hearts since the 1970′s (Entcheva & Bien,2006; Panakova et al., 2010; Salama & Morad, 1976), in culturedcardiomyocytes since the early 1990′s (Fast & Kleber, 1993; Windisch,Ahammer, Schaffer, Muller, & Platzer, 1995) and more recently fromhuman iPSC-derived cardiomyocytes (Park, Lee, Tung, & Yue, 2014;Ren et al., 2011). However, dye-mediated phototoxicity is a concernand repeated imaging is a challenge. Dye-mediated phototoxicity ismost acute for single-cellmeasurements, which require highmagnifica-tion and consequently high illumination intensity.
Measurements of multiple modalities can distinguish among possi-ble drug mechanisms of action. Simultaneous measurements with aVSD and a Ca2+ sensitive dye have been applied in intact guinea pig
umwaveforms. For each drug, the concentration atwhich the observed physiological effector decreased by ~20%, respectively, relative to the addition of a ‘blank’ containing no drug.
ation at which beating stops completely at both spontaneous beating and paced conditionsrom consideration. Abbreviations: EADs, early after depolarizations; N/A, not applicable.
Fig. 4. Alterations in the APwaveform induced by cisapride and flecainide. Fluorescence (ΔF/F) versus time for (A) cisapride and (B) flecainide, for spontaneously beating cells (top, black),cells paced at 1 Hz (middle, blue) and 2 Hz (bottom, red). Cells were treatedwith sequentially increasing concentrations of drug. Cisapride induced EADs. (C) Change in AP90 as a functionof cisapride concentration. (D) Change in AP90 and rise time as a function of flecainide concentration. (For interpretation of the references to color in this figure legend, the reader isreferred to the web version of this article.)
7G.T. Dempsey et al. / Journal of Pharmacological and Toxicological Methods xxx (2016) xxx–xxx
hearts (Choi & Salama, 2000) and in centimeter-scale cultures of humaniPSC-derived cardiomyocytes (Herron, Lee, & Jalife, 2012; P. Lee et al.,2012). Simultaneousmeasurement of voltage and Ca2+with geneticallyencoded indicators has until recently been impossible due to the
Fig. 5. Alterations in the AP waveform and Ca2+ transients induced by nifedipine. (A) Averagconcentrations tested (cyan to magenta; lowest to highest concentration). (B) Quantification o
Please cite this article as: Dempsey, G.T., et al., Cardiotoxicity screeningimaging, Journal of Pharmacological and Toxicological Methods (2016), http
spectral overlap of GFP-based fluorescent proteins. The far red spectrumof the QuasArs resolves this challenge.
AP and CT waveforms are both highly sensitive to the beat rate. Inspontaneously beating cultures, drugs can affect this rate, leading to
e normalized AP and (B) average (ΔF/F) CT waveforms at 1 Hz pacing for the nifedipinef the AP50, AP90, rise time, CT amplitude and spontaneous beat rate.
with simultaneous optogenetic pacing, voltage imaging and calcium://dx.doi.org/10.1016/j.vascn.2016.05.003
Fig. 6. Alterations in the AP waveform following chronic treatment with pentamidine. Fluorescence (ΔF/F) versus time at 0, 20 and 44 h after pentamidine addition.
8 G.T. Dempsey et al. / Journal of Pharmacological and Toxicological Methods xxx (2016) xxx–xxx
changes in the waveform parameters that mask direct effects of thedrug on particular ion channels. Pacingwith field stimulation electrodesis standard practice, but risks contamination of the culture, a particularconcern for long-term measurements. Combination of optogeneticpacing and voltage imaging has recently been achieved with achannelrhodopsin actuator and a red VSD (Park et al., 2014). The Cardi-acOptopatchplatform allows for a genetically encoded approach,whichis desirable to alleviate concerns about phototoxicity and to enable celltype-specific labeling.
The Optopatch measurements precisely reflect the underlying APand CT waveforms, but as with most optical assays, do not report abso-lute voltage or Ca2+. Thus the assays are insensitive to perturbationsthat subtly shift the resting voltage or baseline Ca2+. However, the car-diac action potential waveform is sensitive to restingmembrane poten-tial, and changes in APD are expected if compounds induce a shift inresting voltage. The calcium dynamics are reported with high signal-to-noise ratio by using a membrane-tethered GCaMP variant. Expres-sion of the sensor at the plasmamembrane has demonstrated faster dy-namics than cytoplasmic versions, and furthermore reports Ca2+ sparksandwaves.While these eventswere not the subject of our analysis, theywere often seen in our movies.
Optopatch also offers a new dimension to testing delayed drugcardiotoxicity. Drugs with delayed cardiotoxic effects (Cordes et al.,2005; Kuryshev et al., 2005), (Molife et al., 2007) present a challengefor conventional hERG assays. The chronicmeasurementswith pentam-idine demonstrate the ability of the Optopatch assay to address thischallenge. The assays performed here were performed on single-wellcultures, but parallelization to multiple wells for higher throughputcan be achieved through standard engineering measures.
In evaluating a prospective cardiotoxicity assay, one must distin-guish between the measurement modality and the cellular substrate.As a substrate for cardiotoxicity screening, hiPSC-derived CMs replicatesome, but not all physiological aspects of adult ventricular myocytes.Excitation-contraction coupling is a well-defined property of adult pri-mary cardiomyocytes. Calcium mismanagement has been used in thepast as a hallmark for pathology andmaturity of cells.Within physiolog-ically relevant pacing rates, the hiPSC-derived cardiomyocytesresponded with action potential shortening upon increases in stimu-lation frequency, as do adult human myocytes. However, we ob-served a decrease in CT amplitude at elevated beat rate (Fig. 2),while an increase in CT amplitude at elevated beat rate has been re-ported for primary human atrial myocytes (Llach et al., 2011).Human embryonic stem cell-derived cardiomyocytes (hESC-CMs)showed expression of calcium handling proteins more similar tofetal than to adult ventricular myocytes, suggesting a mechanismfor the difference in calcium transient morphology between thetwo (Liu, Fu, Siu, & Li, 2007). HiPSC-CMs exhibit a further
Please cite this article as: Dempsey, G.T., et al., Cardiotoxicity screeningimaging, Journal of Pharmacological and Toxicological Methods (2016), http
suppression of amplitude and slower kinetics of the calcium tran-sient than hESC-CMs, indicating an even greater immaturity of calci-um handling (Y. K. Lee et al., 2011). A shift to a fetal gene expressionpattern of calcium homeostatic proteins has been well characterizedin failing humanmyocardium, supporting our hypothesis that the in-verse calcium vs. frequency relationship observed in hiPSC-derivedCMs is due to a lack of maturity and/or a similarity in phenotype topathological heart tissue (Fisher, 1995).
Some compounds, including hERG, Na+ and Ca2+ channel effectors,elicited responses which deviated from anticipated physiological re-sponses. The increases in AP90 induced by cisapride and E-4031 areconsistentwith theirmechanism as hERG blockers. EADswere observedfor cisapride but only occasionally for E-4031. E-4031 is a commonlyused positive control, with potent and selective hERG blocking proper-ties. Canine in vivo and purkinje fiber studies using E-4031 haveshown APD prolongation at concentrations ranging from b1 nM–30 nM, respectively (Faivre, Forest, Gout, & Bril, 1999; Webster et al.,2001). Our results observed significant APD prolongation at 100 nM, ahigher concentration than reported by others using similar hiPSC-CMs.For example, Peng et al. and Ma et al. reported a ≥66% prolongation ofAPD90 at 30 nM in electrically paced cells (1 Hz), with subsequentEADs at 100 nM in spontaneous or slower paced cells (0.5 Hz) (Ma etal., 2011; Peng, Lacerda, Kirsch, Brown, & Bruening-Wright, 2010).Non-invasive MEA measurements on hiPSC-CMs reported arrhythmicactivity at concentrations ≥10 nM (Guo et al., 2013; Harris et al., 2013;Nakamura et al., 2014). The recent observation that AP waveform de-pends on plating density (Du et al., 2015) suggests that this variable,not standardized between research groups, may explain some of thevariability within the literature and the different results obtained here.The paucity of data on cells from the same source, studied on thesame platform, under identical conditions makes it difficult to form aconsensus on pharmacological effects.
In the case of Na+ channel block, both anticipated and unanticipatedeffects were observed. Flecainide and quinidine showed an increase inrise time consistent with their mechanism as Class Ia Na+ channelblockers and led to EADs at 1 and 3 μM, respectively. E-4031 also in-creased AP rise time, suggesting an interaction with cardiac sodiumchannels in addition to its known action on hERG. Alternatively, adepolarizing shift in the restingmembrane potential has been observedfor selective hERG blockers, which may induce similar sodium channelinactivation-dependent shifts in rise time (Gibson, Yue, Bronson,Palmer, & Numann, 2014; Ma et al., 2011). Frequency-dependent in-creases in rise time were not observed across drugs tested and mostpreparations did not respond to 2 Hz pacing after exposure to Na+
channel blockers. Inability to respond to increased pacing may be, inpart, due to the frequency-dependent increase in sodium channelpotency observed for Class 1 exhibiting compounds.
with simultaneous optogenetic pacing, voltage imaging and calcium://dx.doi.org/10.1016/j.vascn.2016.05.003
9G.T. Dempsey et al. / Journal of Pharmacological and Toxicological Methods xxx (2016) xxx–xxx
Ca2+ modulators produced the expected drug effects. Decreases inCT amplitude for nifedipine and verapamil are consistent with theirmechanism as L-type Ca2+ channel blockers, while the increase in CTamplitude for digoxin is consistent with its mechanism as a positiveinotrope.
For most compounds tested (with the exception of chromanol andamiodarone), we observed a dose-dependent reduction in the signalamplitude. Cisapride, for example, showed a decrease in signal ampli-tude between 0 and 0.1 μM of 14%. At the highest concentration, weobserved EADs and a decrease in the signal amplitude by 30% relativeto no drug added. Measurements of photostability establish thatphotobleaching is responsible for a negligible portion of this decrementin signal amplitude. Thus it is likely that the reductions in signal ampli-tude reflect real changes in the membrane voltage. Nifedipine, forexample, showed a dramatic reduction in both the Ca2+ and voltageamplitudes with increasing dose (Fig. 5B). The block of Ca2+ channelsby nifedipine leads to an increase in the beat rate and a reduction inthe AP amplitude that correlateswell with the reduction in Ca2+ ampli-tude. These effects are consistentwith nifedipine'smechanismof action.
Lastly, some compounds showed no effect upon addition to iPSC-de-rived CMs. The absence of responses to chromanol implies that the cellslack a substantial Iks current, likely a consequence of the immaturity ofthese cells. The lack of effects of amiodarone are more difficult to recon-cile. Amiodarone is commonly prescribed as an antiarrhythmic, as it ex-hibits sodium (15.9 μM), calcium (1.9 μM) and hERG (0.86 μM) block tovarying degrees (Kramer et al., 2013). Clinically, amiodarone has beenassociated with “slowed sinus nodal discharge rate, lengthened A–Vnodal conduction time, increased atrial and ventricular monophasic ac-tion potential duration and refractory periods.” (Zipes & Troup, 1978). Astudy in hiPSC-CMs reported a reduction in spontaneous beat rate up to100 μM (Yokoo et al., 2009), while a similar study reported significantincreases in beat rate from1 to 10 μM(Mehta et al., 2013). In thepresentstudy, we observed no effect on AP duration, rise time or spontaneousbeat rate from 0.3–3.0 μM, which compares well to a recent study byGilchrist et.al. (Gilchrist, Lewis, Gay, Sellgren, & Grego, 2015). Thus theeffects of amiodarone are quite variable in hiPSC-CM platforms and re-quire further investigation. Additional work with a broader array ofcompounds will be required to develop a detailed map of drug effectsin vitro to clinical outcomes in vivo.
Our study, as well as others in the literature, has confirmed the het-erogeneous population of cardiomyocytes present in hiPSC-derivedCMs (Fig. 1). The cardiomyocytes used for this study are claimed to beN95% pure according to the manufacturer's specifications, with relativecontributions of 50% ventricular, 25% atrial and 25% nodal cells. As is thecase in the human heart, regional differences in pharmacology havebeen observed and often serve as the basis for specificity of drugs. Forexample, atrial-selective drugs exploit thepresence of Kv1.5 and the rel-atively depolarized membrane potential (Ravens, Poulet, Wettwer, &Knaut, 2013). Because our current analysis captures APs from a discretepopulation of cells, it is plausible that differences in pharmacology ob-served arise from statistical averaging over the mixed population. Fu-ture work will entail the design of cell-type specific vectors fortargeted expression in either ventricular, atrial or nodal cell populations,a capability uniquely afforded by genetically encoded indicators.
These data demonstrate that the Optopatch technology provides ameans to non-invasively study hiPSC-derived cardiomyocytes to bettercharacterize their native phenotype and the cardiotoxic effects of novelchemical entities. The use of fluorescent proteins to study complex elec-trophysiology is also amenable to increased throughput using automa-tion and multi-well plate based platforms, providing increasedflexibility to capturemyocyte physiology. The ability to pace the CMs re-duces the rate-dependent changes in AP and CT waveforms, whichwould otherwise mask the effects of many compounds. Differences insome pharmacological responses within the literature and betweenthe literature and the present measurements highlight the importanceof defining standard cell culture and measurement conditions. This
Please cite this article as: Dempsey, G.T., et al., Cardiotoxicity screeningimaging, Journal of Pharmacological and Toxicological Methods (2016), http
platform should prove useful in reaching one of the major goals of theCiPA initiative, namely an in vitro assay with hiPSC-derived CMs forthe accurate reporting of cardiotoxic effects of drug compounds.
Author contributions
GTD, KWC, BSB, JDM, JMK, and AEC designed the study. GTD, NA, CNand JMK performed all cell culturing, transductions and drug prepara-tions. GTD and JMK built the instrument and performed all measure-ments. GTD, KWC and JMK performed all analyses. GTD, KWC and JMKwrote the manuscript. AEC contributed to sensor design prior to workperformed at Q-State Biosciences.
Ethical approval
None required.
Funding information
AEC and JMK were partially supported by PECASE award N00014-11-1-0549 and US National Institutes of Health grants 1-R01-EB012498 and New Innovator grant 1-DP2-OD007428.
Conflict of interest
JMKandAEC are co-founders of Q-State Biosciences. GTD, NA andCNare affiliated with Q-State Biosciences. KWC and BSB are affiliatedwith GlaxoSmithKline Safety Assessment. JDM is affiliated withGlaxoSmithKline Alternative Discovery and Development.
Acknowledgments
We thank K. Eggan, D. Margulies, K. Werley and C. Hechard for theirhelpful discussions.
References
Adams, C. P., & Brantner, V. V. (2010). Spending on new drug development1. HealthEconomics, 19, 130–141.
Burridge, P. W., Matsa, E., Shukla, P., Lin, Z. C., Churko, J. M., Ebert, A. D., ... Wu, J. C. (2014).Chemically defined generation of human cardiomyocytes. Nature Methods, 11,855–860.
Caspi, O., Itzhaki, I., Kehat, I., Gepstein, A., Arbel, G., Huber, I., ... Gepstein, L. (2009). In vitroelectrophysiological drug testing using human embryonic stem cell derivedcardiomyocytes. Stem Cells and Development, 18, 161–172.
Cavero, I., & Holzgrefe, H. (2014). Comprehensive in vitro proarrhythmia assay, a novel invitro/in silico paradigm to detect ventricular proarrhythmic liability: A visionary 21stcentury initiative. Expert Opinion on Drug Safety, 13, 745–758.
Chen, T. W., Wardill, T. J., Sun, Y., Pulver, S. R., Renninger, S. L., Baohan, A., ... Kim, D. S.(2013). Ultrasensitive fluorescent proteins for imaging neuronal activity. Nature,499, 295–300.
Choi, B. R., & Salama, G. (2000). Simultaneous maps of optical action potentials and calci-um transients in guinea-pig hearts: Mechanisms underlying concordant alternans.The Journal of Physiology, 529(Pt 1), 171–188.
Chouabe, C., Drici, M. D., Romey, G., Barhanin, J., & Lazdunski, M. (1998). HERG andKvLQT1/IsK, the cardiac K+ channels involved in long QT syndromes, are targets forcalcium channel blockers. Molecular Pharmacology, 54, 695–703.
Cordes, J. S., Sun, Z., Lloyd, D. B., Bradley, J. A., Opsahl, A. C., Tengowski, M. W., ... Zhou, J.(2005). Pentamidine reduces hERG expression to prolong the QT interval. BritishJournal of Pharmacology, 145, 15–23.
Coumel, P., Leclercq, J. F., & Lucet, V. (1985). Possible mechanisms of the arrhythmias inthe long QT syndrome. European Heart Journal, 6(Suppl. D), 115–129.
De Ponti, F., Poluzzi, E., Cavalli, A., Recanatini, M., & Montanaro, N. (2002). Safety of non-antiarrhythmic drugs that prolong the QT interval or induce torsade de pointes: Anoverview. Drug Safety: an International Journal of Medical Toxicology and DrugExperience, 25, 263–286.
Doevendans, P. A., Kubalak, S. W., An, R. H., Becker, D. K., Chien, K. R., & Kass, R. S. (2000).Differentiation of cardiomyocytes in floating embryoid bodies is comparable to fetalcardiomyocytes. Journal of Molecular and Cellular Cardiology, 32, 839–851.
Du, D. T., Hellen, N., Kane, C., & Terracciano, C. M. (2015). Action potential morphology ofhuman induced pluripotent stem cell-derived cardiomyocytes does not predict cardi-ac chamber specificity and is dependent on cell density. Biophysical Journal, 108, 1–4.
Entcheva, E., & Bien, H. (2006). Macroscopic optical mapping of excitation in cardiac cellnetworks with ultra-high spatiotemporal resolution. Progress in Biophysics andMolecular Biology, 92, 232–257.
with simultaneous optogenetic pacing, voltage imaging and calcium://dx.doi.org/10.1016/j.vascn.2016.05.003
10 G.T. Dempsey et al. / Journal of Pharmacological and Toxicological Methods xxx (2016) xxx–xxx
Faivre, J. F., Forest, M. C., Gout, B., & Bril, A. (1999). Electrophysiological characterization ofBRL-32872 in canine Purkinje fiber and ventricular muscle. Effect on early after-depo-larizations and repolarization dispersion. European Journal of Pharmacology, 383,215–222.
Fast, V. G., & Kleber, A. G. (1993). Microscopic conduction in cultured strands of neonatalrat heart cells measured with voltage-sensitive dyes. Circulation Research, 73,914–925.
International conference on harmonisation; guidance on S7B nonclinical evaluation of thepotential for delayed ventricular repolarization (QT interval prolongation) by humanpharmaceuticals; availability. Notice. Federal Register, 70(2005)., 61133–61134.
Fisher, D. J. (1995). Recent insights into the regulation of cardiac Ca2+ flux during perina-tal development and in cardiac failure. Current Opinion in Cardiology, 10, 44–51.
Gibson, J. K., Yue, Y., Bronson, J., Palmer, C., & Numann, R. (2014). Human stem cell-de-rived cardiomyocytes detect drug-mediated changes in action potentials and ion cur-rents. Journal of Pharmacological and Toxicological Methods, 70, 255–267.
Gilchrist, K. H., Lewis, G. F., Gay, E. A., Sellgren, K. L., & Grego, S. (2015). High-throughputcardiac safety evaluation and multi-parameter arrhythmia profiling ofcardiomyocytes using microelectrode arrays. Toxicology and Applied Pharmacology,288, 249–257.
Gintant, G. (2011). An evaluation of hERG current assay performance: Translating preclin-ical safety studies to clinical QT prolongation. Pharmacology & Therapeutics, 129,109–119.
Guengerich, F. P. (2011). Mechanisms of drug toxicity and relevance to pharmaceuticaldevelopment. Drug Metabolism and Pharmacokinetics, 26, 3–14.
Guo, L., Coyle, L., Abrams, R. M., Kemper, R., Chiao, E. T., & Kolaja, K. L. (2013). Refining thehuman iPSC-cardiomyocyte arrhythmic risk assessment model. Toxicological Sciences,136, 581–594.
Guo, L., Qian, J. Y., Abrams, R., Tang, H. M., Weiser, T., Sanders, M. J., & Kolaja, K. L. (2011).The electrophysiological effects of cardiac glycosides in human iPSC-derivedcardiomyocytes and in guinea pig isolated hearts. Cellular Physiology andBiochemistry: Internation Journal of Experimental Cellular Physiology, Biochemistry,and Pharmacology, 27, 453–462.
Hanson, L. A., Bass, A. S., Gintant, G., Mittelstadt, S., Rampe, D., & Thomas, K. (2006). ILSI-HESI cardiovascular safety subcommittee initiative: Evaluation of three non-clinicalmodels of QT prolongation. Journal of Pharmacological and Toxicological Methods, 54,116–129.
Hardy, M. E., Lawrence, C. L., Standen, N. B., & Rodrigo, G. C. (2006). Can optical recordingsof membrane potential be used to screen for drug-induced action potential prolonga-tion in single cardiac myocytes? Journal of Pharmacological and Toxicological Methods,54, 173–182.
Harris, K., Aylott, M., Cui, Y., Louttit, J. B., McMahon, N. C., & Sridhar, A. (2013). Comparisonof electrophysiological data from human-induced pluripotent stem cell-derivedcardiomyocytes to functional preclinical safety assays. Toxicological Sciences, 134,412–426.
Haverkamp, W., Breithardt, G., Camm, A. J., Janse, M. J., Rosen, M. R., Antzelevitch, C., ...Shah, R. (2000). The potential for QT prolongation and pro-arrhythmia by non-anti-arrhythmic drugs: clinical and regulatory implications. Report on a policy conferenceof the European Society of Cardiology. Cardiovascular Research, 47, 219–233.
He, J. Q., Ma, Y., Lee, Y., Thomson, J. A., & Kamp, T. J. (2003). Human embryonic stem cellsdevelop into multiple types of cardiac myocytes: Action potential characterization.Circulation Research, 93, 32–39.
Hennessy, S., Leonard, C. E., Newcomb, C., Kimmel, S. E., & Bilker, W. B. (2008). Cisaprideand ventricular arrhythmia. British Journal of Clinical Pharmacology, 66, 375–385.
Herron, T. J., Lee, P., & Jalife, J. (2012). Optical imaging of voltage and calcium in cardiaccells & tissues. Circulation Research, 110, 609–623.
Himmel, H. M. (2013). Drug-induced functional cardiotoxicity screening in stem cell-de-rived human and mouse cardiomyocytes: Effects of reference compounds. Journal ofPharmacological and Toxicological Methods, 68, 97–111.
Hochbaum, D. R., Zhao, Y., Farhi, S. L., Klapoetke, N.,Werley, C. A., Kapoor, V., ... Cohen, A. E.(2014). All-optical electrophysiology in mammalian neurons using engineered mi-crobial rhodopsins. Nature Methods, 11, 825–833.
Holzgrefe, H., Ferber, G., Champeroux, P., Gill, M., Honda, M., Greiter-Wilke, A., ... Saulnier,M. (2014). Preclinical QT safety assessment: Cross-species comparisons and humantranslation from an industry consortium. Journal of Pharmacological andToxicological Methods, 69, 61–101.
Honda, M., Kiyokawa, J., Tabo, M., & Inoue, T. (2011). Electrophysiological characterizationof cardiomyocytes derived from human induced pluripotent stem cells. Journal ofPharmacological Sciences, 117, 149–159.
Hou, J. H., Kralj, J. M., Douglass, A. D., Engert, F., & Cohen, A. E. (2014). Simultaneous map-ping of membrane voltage and calcium in zebrafish heart in vivo reveals chamber-specific developmental transitions in ionic currents. Frontiers in Physiology, 5, 344.
Huebsch, N., Loskill, P., Mandegar, M. A., Marks, N. C., Sheehan, A. S., Ma, Z., ... Healy, K. E.(2014). Automated video-based analysis of contractility and calcium flux in humaniPS-derived cardiomyocytes cultured over different spatial scales. Tissue Engineering.Part C, Methods.
ICHS7B (2005). Nonclinical testing for effect on ventricular repolarization. http://www.ich.org/cache/compo/276-254-1.htmlhttp://www.emea.eu.int/htms/human/ich/safety/ichdraft.htm (online)
Itzhaki, I., Maizels, L., Huber, I., Zwi-Dantsis, L., Caspi, O., Winterstern, A., ... Gepstein, L.(2011). Modelling the long QT syndrome with induced pluripotent stem cells.Nature, 471, 225–229.
Kaestner, L., & Lipp, P. (2011). Screening action potentials: The power of light. Frontiers inPharmacology, 2, 42.
Kaestner, L., Scholz, A., Tian, Q., Ruppenthal, S., Tabellion,W., Wiesen, K., ... Lipp, P. (2014).Genetically encoded Ca2+ indicators in cardiac myocytes. Circulation Research, 114,1623–1639.
Please cite this article as: Dempsey, G.T., et al., Cardiotoxicity screeningimaging, Journal of Pharmacological and Toxicological Methods (2016), http
Keating, M. T. (1995). Molecular genetics of long QT syndrome. Society of GeneralPhysiologists Series, 50, 53–60.
Kramer, J., Obejero-Paz, C. A., Myatt, G., Kuryshev, Y. A., Bruening-Wright, A., Verducci, J. S., & Brown, A. M. (2013). MICE models: Superior to the HERGmodel in predicting Tor-sade de Pointes. Scientific Reports, 3, 2100.
Kuryshev, Y. A., Ficker, E., Wang, L., Hawryluk, P., Dennis, A. T., Wible, B. A., ... Rampe, D.(2005). Pentamidine-induced long QT syndrome and block of hERG trafficking. TheJournal of Pharmacology and Experimental Therapeutics, 312, 316–323.
Lan, F., Lee, A. S., Liang, P., Sanchez-Freire, V., Nguyen, P. K., Wang, L., ... Wu, J. C. (2013).Abnormal calcium handling properties underlie familial hypertrophic cardiomyopa-thy pathology in patient-specific induced pluripotent stem cells. Cell Stem Cell, 12,101–113.
Lee, P., Klos, M., Bollensdorff, C., Hou, L., Ewart, P., Kamp, T. J., ... Herron, T. J. (2012). Simul-taneous voltage and calcium mapping of genetically purified human induced plurip-otent stem cell-derived cardiac myocyte monolayers. Circulation Research, 110,1556–1563.
Lee, Y. K., Ng, K. M., Lai, W. H., Chan, Y. C., Lau, Y. M., Lian, Q., ... Siu, C. W. (2011). Calciumhomeostasis in human induced pluripotent stem cell-derived cardiomyocytes. StemCell Reviews, 7, 976–986.
Leyton-Mange, J. S., Mills, R. W., Macri, V. S., Jang, M. Y., Butte, F. N., Ellinor, P. T., & Milan,D. J. (2014). Rapid cellular phenotyping of human pluripotent stem cell-derivedcardiomyocytes using a genetically encoded fluorescent voltage sensor. Stem CellReports, 2, 163–170.
Liu, J., Fu, J. D., Siu, C. W., & Li, R. A. (2007). Functional sarcoplasmic reticulum for calciumhandling of human embryonic stem cell-derived cardiomyocytes: Insights for drivenmaturation. Stem Cells, 25, 3038–3044.
Llach, A., Molina, C. E., Fernandes, J., Padro, J., Cinca, J., & Hove-Madsen, L. (2011). Sarco-plasmic reticulum and L-type Ca(2)(+) channel activity regulate the beat-to-beatstability of calcium handling in human atrial myocytes. The Journal of Physiology,589, 3247–3262.
Lu, H. R., Vlaminckx, E., Hermans, A. N., Rohrbacher, J., Van Ammel, K., Towart, R., ...Gallacher, D. J. (2008). Predicting drug-induced changes in QT interval and arrhyth-mias: QT-shortening drugs point to gaps in the ICHS7B guidelines. British Journal ofPharmacology, 154, 1427–1438.
Ma, J., Guo, L., Fiene, S. J., Anson, B. D., Thomson, J. A., Kamp, T. J., ... January, C. T. (2011).High purity human-induced pluripotent stem cell-derived cardiomyocytes: Electro-physiological properties of action potentials and ionic currents. American Journal ofPhysiology. Heart and Circulatory Physiology, 301, H2006–H2017.
Maclaurin, D., Venkatachalam, V., Lee, H., & Cohen, A. E. (2013). Mechanism of voltage-sensitive fluorescence in a microbial rhodopsin. Proceedings of the National Academyof Sciences of the United States of America, 110, 5939–5944.
Mandel, Y., Weissman, A., Schick, R., Barad, L., Novak, A., Meiry, G., ... Binah, O. (2012).Human embryonic and induced pluripotent stem cell-derived cardiomyocytes exhib-it beat rate variability and power-law behavior. Circulation, 125, 883–893.
Mehta, A., Chung, Y., Sequiera, G. L., Wong, P., Liew, R., & Shim, W. (2013).Pharmacoelectrophysiology of viral-free induced pluripotent stem cell-derivedhuman cardiomyocytes. Toxicological Sciences, 131, 458–469.
Miller, E. W., Lin, J. Y., Frady, E. P., Steinbach, P. A., Kristan, W. B., Jr., & Tsien, R. Y. (2012).Optically monitoring voltage in neurons by photo-induced electron transfer throughmolecular wires. Proceedings of the National Academy of Sciences of the United States ofAmerica, 109, 2114–2119.
Molife, R., Fong, P., Scurr, M., Judson, I., Kaye, S., & de Bono, J. (2007). HDAC inhibitors andcardiac safety. Clinical Cancer Research: An Official Journal of the American Associationfor Cancer Research, 13, 1068 (author reply 1068–1069).
Mummery, C., Ward-van Oostwaard, D., Doevendans, P., Spijker, R., van den Brink, S.,Hassink, R., ... Tertoolen, L. (2003). Differentiation of human embryonic stem cellsto cardiomyocytes: Role of coculture with visceral endoderm-like cells. Circulation,107, 2733–2740.
Nakamura, Y., Matsuo, J., Miyamoto, N., Ojima, A., Ando, K., Kanda, Y., ... Sekino, Y. (2014).Assessment of testing methods for drug-induced repolarization delay and arrhyth-mias in an iPS cell-derived cardiomyocyte sheet: Multi-site validation study. Journalof Pharmacological Sciences, 124, 494–501.
Olson, H., Betton, G., Robinson, D., Thomas, K., Monro, A., Kolaja, G., ... Heller, A. (2000).Concordance of the toxicity of pharmaceuticals in humans and in animals.Regulatory Toxicology and Pharmacology, 32, 56–67.
Panakova, D., Werdich, A. A., & Macrae, C. A. (2010). Wnt11 patterns a myocardial electri-cal gradient through regulation of the L-type Ca(2+) channel. Nature, 466, 874–878.
Park, S. A., Lee, S. R., Tung, L., & Yue, D. T. (2014). Optical mapping of optogeneticallyshaped cardiac action potentials. Scientific Reports, 4, 6125.
Peng, S., Lacerda, A. E., Kirsch, G. E., Brown, A. M., & Bruening-Wright, A. (2010). The ac-tion potential and comparative pharmacology of stem cell-derived humancardiomyocytes. Journal of Pharmacological and Toxicological Methods, 61, 277–286.
Puppala, D., Collis, L. P., Sun, S. Z., Bonato, V., Chen, X., Anson, B., ... Engle, S. J. (2013). Compar-ative gene expression profiling in human-induced pluripotent stem cell-derivedcardiocytes and human and cynomolgus heart tissue. Toxicological Sciences, 131, 292–301.
Ravens, U., Poulet, C., Wettwer, E., & Knaut, M. (2013). Atrial selectivity of antiarrhythmicdrugs. The Journal of Physiology, 591, 4087–4097.
Redfern, W. S., Carlsson, L., Davis, A. S., Lynch, W. G., MacKenzie, I., Palethorpe, S., ...Hammond, T. G. (2003). Relationships between preclinical cardiac electrophysiology,clinical QT interval prolongation and torsade de pointes for a broad range of drugs:Evidence for a provisional safety margin in drug development. CardiovascularResearch, 58, 32–45.
Ren, Y., Lee, M. Y., Schliffke, S., Paavola, J., Amos, P. J., Ge, X., ... Qyang, Y. (2011). Small mol-ecule Wnt inhibitors enhance the efficiency of BMP-4-directed cardiac differentiationof human pluripotent stem cells. Journal of Molecular and Cellular Cardiology, 51,280–287.
with simultaneous optogenetic pacing, voltage imaging and calcium://dx.doi.org/10.1016/j.vascn.2016.05.003
11G.T. Dempsey et al. / Journal of Pharmacological and Toxicological Methods xxx (2016) xxx–xxx
Ribeiro, M. C., Tertoolen, L. G., Guadix, J. A., Bellin, M., Kosmidis, G., D'Aniello, C., ... Passier,R. (2015). Functional maturation of human pluripotent stem cell derivedcardiomyocytes in vitro-correlation between contraction force and electrophysiology.Biomaterials, 51, 138–150.
Roden, D. M., Lazzara, R., Rosen, M., Schwartz, P. J., Towbin, J., & Vincent, G. M. (1996).Multiple mechanisms in the long-QT syndrome. Current knowledge, gaps, and futuredirections. The SADS foundation task force on LQTS. Circulation, 94, 1996–2012.
Sager, P. T., Gintant, G., Turner, J. R., Pettit, S., & Stockbridge, N. (2014). Rechanneling thecardiac proarrhythmia safety paradigm: A meeting report from the cardiac safety re-search consortium. American Heart Journal, 167, 292–300.
Salama, G., & Morad, M. (1976). Merocyanine 540 as an optical probe of transmembraneelectrical activity in the heart. Science, 191, 485–487.
Sanguinetti, M. C., Jiang, C., Curran, M. E., & Keating, M. T. (1995). A mechanistic link be-tween an inherited and an acquired cardiac arrhythmia: HERG encodes the IKr potas-sium channel. Cell, 81, 299–307.
Schram, G., Zhang, L., Derakhchan, K., Ehrlich, J. R., Belardinelli, L., & Nattel, S. (2004).Ranolazine: Ion-channel-blocking actions and in vivo electrophysiological effects.British Journal of Pharmacology, 142, 1300–1308.
Segers, V. F., & Lee, R. T. (2008). Stem-cell therapy for cardiac disease. Nature, 451,937–942.
Shang, W., Lu, F., Sun, T., Xu, J., Li, L. L., Wang, Y., ... Cheng, H. (2014). Imaging Ca2+
nanosparks in heart with a new targeted biosensor. Circulation Research, 114,412–420.
Song, Y., Shryock, J. C., Wu, L., & Belardinelli, L. (2004). Antagonism by ranolazine of thepro-arrhythmic effects of increasing late INa in guinea pig ventricular myocytes.Journal of Cardiovascular Pharmacology, 44, 192–199.
Stevens, J. L., & Baker, T. K. (2009). The future of drug safety testing: Expanding the viewand narrowing the focus. Drug Discovery Today, 14, 162–167.
Please cite this article as: Dempsey, G.T., et al., Cardiotoxicity screeningimaging, Journal of Pharmacological and Toxicological Methods (2016), http
Vanderlaan, R. D., Oudit, G. Y., & Backx, P. H. (2003). Electrophysiological profiling ofcardiomyocytes in embryonic bodies derived from human embryonic stem cells:Therapeutic implications. Circulation Research, 93, 1–3.
Wang, G., McCain, M. L., Yang, L., He, A., Pasqualini, F. S., Agarwal, A., ... Pu, W. T. (2014).Modeling the mitochondrial cardiomyopathy of Barth syndrome with induced plu-ripotent stem cell and heart-on-chip technologies. Nature Medicine, 20, 616–623.
Webster, R., Allan, G., Anto-Awuakye, K., Harrison, A., Kidd, T., Leishman, D., ... Walker, D.(2001). Pharmacokinetic/pharmacodynamic assessment of the effects of E4031,cisapride, terfenadine and terodiline on monophasic action potential duration indog. Xenobiotica, 31, 633–650.
Windisch, H., Ahammer, H., Schaffer, P., Muller, W., & Platzer, D. (1995). Optical multisitemonitoring of cell excitation phenomena in isolated cardiomyocytes. Pflügers Archiv,430, 508–518.
Yazawa, M., Hsueh, B., Jia, X., Pasca, A. M., Bernstein, J. A., Hallmayer, J., & Dolmetsch, R. E.(2011). Using induced pluripotent stem cells to investigate cardiac phenotypes inTimothy syndrome. Nature, 471, 230–234.
Yokoo, N., Baba, S., Kaichi, S., Niwa, A., Mima, T., Doi, H., Yamanaka, S., Nakahata, T., &Heike, T. (2009). The effects of cardioactive drugs on cardiomyocytes derived fromhuman induced pluripotent stem cells. Biochemical and Biophysical ResearchCommunications, 387, 482–488.
Zhou, Z., Gong, Q., Ye, B., Fan, Z., Makielski, J. C., Robertson, G. A., & January, C. T. (1998).Properties of HERG channels stably expressed in HEK 293 cells studied at physiolog-ical temperature. Biophysical Journal, 74, 230–241.
Zipes, D. P., & Troup, P. J. (1978). New antiarrhythmic agents: Amiodarone, aprindine,disopyramide, ethmozin, mexiletine, tocainide, verapamil. The American Journal ofCardiology, 41, 1005–1024.
with simultaneous optogenetic pacing, voltage imaging and calcium://dx.doi.org/10.1016/j.vascn.2016.05.003