Page 1
Journal of Plant Development Sciences (An International Quarterly Refereed Research Journal)
Volume 6 Number 3 July 2014
Contents
Field performance of Swietenia macrophylla King. sapling in municipal garbage as the potting media for
reforestation in the tropics
—Vidyasagaran, K., Ajeesh, R. and Vikas Kumar -------------------------------------------------------------- 357-363
Micropropagation of an endangered medicinal herb Ocimum citriodorum Vis.
—Anamika Tripathi, N.S. Abbas and Amrita Nigam ---------------------------------------------------------- 365-374
Evaluation of TGMS line of safflower (Carthamus tinctorius L.) at Raipur
—Nirmala Bharti Patel and Rajeev Shrivastava ---------------------------------------------------------------- 375-377
Comparative cypselar features of two species of Tagetes (Tageteae-asteraceae) and their taxonomic significance
—Bidyut Kumar Jana and Sobhan Kumar Mukherjee -------------------------------------------------------- 379-383
Bud growth and postharvest physiology of gladiolus and chrysanthemum-a review
—K. Elavarasan1, M. Govindappa and Badru Lamani-------------------------------------------------------- 385-388
Molecular chracterization of chrysanthemum (Chrysanthemum morifolium Ramat) germplasm using rapd
markers
—Deeksha Baliyan, Anil Sirohi, Devi Singh, Mukesh Kumar, Sunil Malik and Manoj Kumar Singh --------
------------------------------------------------------------------------------------------------------------------------------- 389-395
Assessment of genetic diversity in chrysanthemum (Chrysanthemum morifolium Ramat) using microsatellite
markers
—Deeksha Baliyan, Anil Sirohi, Devi Singh, Mukesh Kumar, Sunil Malik, and Manoj Kumar Singh ------
------------------------------------------------------------------------------------------------------------------------------- 397-403
Phenological behaviour of selected tree species in tropical deciduous forest of Hastinapur region in western U.P.
—Narendra Pal Singh, R.C. Arya, Narendra Pratap Singh and Vinay Pratap Singh ------------------ 405-411
Effect of zinc and iron application on yield and acquisition of nutrient on mustard crop (Brassica juncia L.)
—Anuj Kumar, Satendra Kumar, Pradeep Kumar and Pramod Kumar --------------------------------- 413-416
Effect of time and method of budding in ber (Zizyphus mauritiana Lamk.)
—Gokaran Meena and M.M. Syamal ------------------------------------------------------------------------------ 417-420
Response of hybrid rice (Oryza sativa L.) to integrated nutrient management (inm) in partially reclaimed sodic
soil
—A.K.S. Parihar, Suresh Kumar and Adesh Kumar ---------------------------------------------------------- 421-423
Cultivation of medicinal plants in natural ecosystem in Gujarat (India): constraints and conservation need
—Vikas Kumar, Sreejith Babu, Amit Kumar Revale, Rajesh Kumar Meena, Manas Kumar Ranjan and
B.S. Desai ------------------------------------------------------------------------------------------------------------------ 425-435
Response of phosphorus and weed control measures on yield and yield contributing characters of chickpea
(Cicer arietinum L.)
—Prem Nath, Satendra Kumar, J.K. Verma, Amar Nath and Arvind Kumar -------------------------- 437-441
Variability and genetic parameters for grain yield and its quality attributes in cms based rice hybrids (Oryza
sativa L.)
—Madhuri Grace Minz, Deepak Sharma, Alice Tirkey, Fakeer Chand Sao, Laxmi Singh and Hadassah
Ch. --------------------------------------------------------------------------------------------------------------------------- 443-446
Page 2
ii
Identification of cold tolerant genotypesat seedling stage in rice (Oryza sativa L.)
—S.K. Verma, M.S. Xalxo, R.R. Saxena and S.B. Verulkar -------------------------------------------------- 447-449
Influence of organic and inorganic fertilizers on growth, yield and economics of potato crops under Chhattisgarh
plains
—Eshu Sahu, D.A. Sarnaik, P.K. Joshi, Pravin Kumar Sharma and Smita Bala Barik --------------- 451-454
Effect of different levels of fym, press mud and zinc sulphate application on soil properties
—Manmohan Sharma, Y.K. Sharma, M.L. Dotaniya1 and Pardeep Kumar----------------------------- 455-459
Genetic variability, correlation and pathcoefficient analysis of some yield components of mungbean (Vigna
radiata L.)
—Manoj Kumar Sao, S.K. Nair, Fakeer Chand Sao, Sanjay Kumar Yadav and Sourabhpaikara - 461-464
REPORT
Methods and practical aspects in mungbean hybridization
—K.N. Sivaiah, R. Narasimhulu, G.Govardhan and R. Vinoth ---------------------------------------------- 465-466
SHORT COMMUNICATION
Assessment of internet using behavior of post graduate agriculture students in Chhattisgarh
—Priyanka Chandrakar, M.L. Sharma and M.A. Khan ------------------------------------------------------ 467-470
Yield and economics of finger millet influenced by post emergence herbicides
—Srishti Pandey, Damini Thawait and H.L. Sonboir ---------------------------------------------------------- 471-473
Prospects of utilizing water cabbage (Limnocharis flava (L.) Buchenau) biomass as an alternate organic manure
source
—Nishan, M.A, and Sansamma George --------------------------------------------------------------------------- 475-476
Analysis of factors associated with the productivity of scented rice varieties amongst the tribal farmers of
Jashpur district (Chhattisgarh)
—Subodh Kumar Pradhan, M.A. Khan, V.K. Painkra and M.L. Sharma -------------------------------- 477-479
Analysis of factors associated with the technological gap in adoption of recommended production technology of
black gram among tribal farmers of Jashpur district (Chhattisgarh)
—Virendra Kumar Painkra, M.A. Khan, S.K. Pradhan and M.L. Sharma ------------------------------ 481-483
Major weed species in finger millet
—Srishti Pandey, H.L. Sonboir and Damini Thawait ---------------------------------------------------------- 485-486
Impact of weed management practices on weed control, nodulation, rhizobium population and yield in soybean
—Bhumika Patel1, V.K. Gupta, Rajendra Lakpale and Pritee Awasthy ---------------------------------- 487-489
Probing behaviour of Nilaparvata lugens (Stal.) on rice plant as influenced by potash application
—Swati Sharma, Ashish Kumar Sharma and Damini Thawait---------------------------------------------- 491-493
Evaluation of newer insecticides against white backed plant hopper (Sogatella furcifera Horvath) of rice crop.
—Swati Sharma, Ashish Kumar Sharma, Sanjay Sharma and Damini Thawait ------------------------ 495-498
Effect of p solublizing bacteria on yield of wheat and nutrient availability in acid soil in Varanasi reason
—Rahul Kumar and Priyanka Sharma ---------------------------------------------------------------------------- 499-500
Effect of post emergence herbicide on growth and yield of finger millet
—Srishti Pandey, Damini Thawait, Pooja Mandal and Sarita Painkra ------------------------------------ 501-504
Page 3
________________________________________________ Journal of Plant Development Sciences Vol. 6 (3) : 357-363. 2014
FIELD PERFORMANCE OF SWIETENIA MACROPHYLLA KING. SAPLING IN
MUNICIPAL GARBAGE AS THE POTTING MEDIA FOR REFORESTATION IN
THE TROPICS
Vidyasagaran, K.,1 Ajeesh, R. and Vikas Kumar*
1Department of Forest Management and Utilization
College of Forestry, Kerala Agricultural University, KAU, Thrissur, Kerala-680656 (India)
*Email: [email protected] Abstract : The term ‘garbage’ used internationally to describe waste materials arising from domestic, trade, commercial,
industrial, agricultural and other related activities and from public services. It has created a real threat not only to the living
environment but also for the cultivation of crops as well as afforestation. The present investigation was conducted to study
the influence of two weeks decayed or stored waste materials as component potting media on the growth and vigour of
Swietenia macrophylla (Mahogany) seedlings. The survival rate was ranged from 96 per cent to 99 per cent among various
treatments studied. Mixture of soil, partially decayed tea waste and sand was recorded the maximum height in nursery and
T1 (Control - Soil: Sand: cow dung) recorded maximum collar diameter (9.35 mm). With regards to height (155.62 cm) and
diameter (14.2 mm), the maximum performance was registered in potting media containing soil and partially decayed
Municipal waste (T2) in sapling level. Height and diameter increment at nursery level after eighth month showed the
maximum increase was in T7 (28.32 per cent) and -3.53 per cent as compared to the control (T1) in seedling level and
maximum increment per cent in the plantation was recorded in T2 (45.28) and T4 (49.55) for height and diameter
respectively. The combined use of soil with garbage result in the production high quality planting material and the effect of
plantation development were very less.
Keywords: Swietenia macrophylla, potting media, survival rate, diameter, height, increment percentage
INTRODUCTION
wietenia mcrophylla (Meliaceae) is the promising
spices in the round wood. It is able to tolerate a
very wide range of environmental conditions and is
found naturally in both tropical dry and wet forest
types. The economic importance of timber may due
to the attractive light reddish colour and high
durability. During the past few years the demand for
mahogany was tremendously increased. It has special
attention due to the wood quality, workability and
less insect attack. In the recent times Mahogany
gained a wide acceptance among the tree growers in
Kerala. In Kerala, despite the favorable agroclimatic
and edaphic conditions and the concomitant
production potential, the forest plantations contribute
marginally to meet the state wood demand (less than
25%) reported by Krishnankutty, (1990).
Establishing forest plantations to meet the ever-
increasing demand for tree products have been a long
standing tradition in the tropics (Evans, 1990). Apart
from alleviating the pressure on the primary forest,
plantations offer continuous production of wood
materials through intensive management practices.
Besides the direct economic benefits the ecological
dimensions, plantation forestry have attained greater
importance in the recent times in view of the
invaluable contribution they provide in regulating
atmospheric CO2 emission and there by playing a
dominant role in mitigating climatic change (IPCC,
2007). The natural regeneration and establishment
were only scarce. So the production of quality
material was a challenging topic and that is the
reason for the selection of this species.
Municipal solid waste is a heterogeneous mass of
discarded waste material of industrial and
commercial activities of human being. They are
normally non-flowing materials such as plastic, paper
metal, glass, kitchen wastes and market wastes
(Sharma, 2002). Spooner (1971) has reported that
solid waste comprise countless different materials
like dust, food waste, packaging in the form of paper,
metals, plastic, glass pieces, discarded clothing and
furnishings, garden waste and hazardous and
radioactive wastes. With the looming urbanization
and changes in lifestyle and food habits, municipal
solid waste has been proliferating rapidly and its
composition keeps changing periodically (Umpathy,
2003). Solid waste management is the effort of
removing and disposing all the unwanted material
through a carefully, planned and judicious use of
means. Shah, (2000) reiterated the planning,
financing, construction and operation of facilities for
the collection, transportation, recycling and final
disposition of solid waste. It is based on principles
such as engineering, economics, public health,
conservation, aesthetics, environmental considera-
tions and social and ethical issues.
The research studies conducted elsewhere revealed
that the waste materials like municipal garbage could
be used for cultivation of vegetables and ornamentals
particularly when supplemented with some nutrients.
But information regarding the effect of these solid
wastes on the growth and vigour of tree seedlings
either in the nursery or in the plantation are very
scanty. Scientific information on the influence of
municipal garbage on growth behavior of seedlings
will be extremely useful for the production of healthy
seedlings in the nursery at low cost, same time
S
Page 4
358 VIDYASAGARAN, K., AJEESH, R. AND VIKAS KUMAR
paving a way for the easy disposal of these waste
materials.
Hence, the present investigations were carried out in
the College of Forestry, Kerala Agricultural
University, Vellanikkara. The overall objective of
this study was to determine the effects of two weeks
decayed or stored waste materials as component
potting media on the survival, growth and vigour of
Mahogany seedlings in the nursery and media
influence on field. We addressed three specific
questions: (1) Did municipal garbage as potting
media affect survival and growth of Swietenia
macrophylla seedlings? (2) Did municipal garbage as
potting media affect growth in plantation level of
Swietenia macrophylla?
MATERIAL AND METHOD
In the present investigation, it is proposed to study
the effect of two weeks decayed or stored waste
materials as component potting media on the survival
rate and field performance of Mahogany seedlings.
The experiment was conducted at College of
Forestry, Kerala Agricultural University and
Vellanikara during the period 2009-2012. The
nursery area is located at 40 meters above mean sea
level at 10032’N latitude and 76
026’E longitude. The
area experiences a warm and humid climate with
distinct rainy season. Mature mahogany seeds were
collected from Mananthavady, Wayanad district. The
seeds/pods were brought to the college nursery and
dried under partial shade. Seeds/pods were extracted
for the study. Seeds were sown in standard nursery
beds. Uniform vigorous seedlings were transplanted
in polythene bags of 10”x5” size filled with different
treatment media and arranged in separate rows in the
green house. Watering was done regularly.
The following 7 potting media were prepared by
thoroughly mixing the components.
T1 - Soil: Sand: cow dung (1:1:1 ratio- control
treatment)
T2- Soil: partially decayed Municipal waste (1:1)
T3 - Soil: partially decayed Coir waste (1:1)
T4- Soil: partially decayed Tea waste (1:1)
T5 - Soil: partially decayed Municipal waste: Sand
(1:1:1)
T6 - Soil: partially decayed Coir waste: Sand (1:1:1)
T7 - Soil: partially decayed Tea waste: Sand (1:1:1)
The experiment was laid out in Complete
Randomized Block Design (CBD) with three
replications. A total of one thousand and fifty
seedlings were kept for conducting growth studies.
The seedlings after transplanting to the polybags
were kept under green house conditions. Necessary
plant protection measures were also adopted.
Initial establishment after one week of planting and
final survival rate were recorded. The seedlings were
kept in 50% shade house about eight months for its
proper care and protection from seedling mortality.
The height and collar diameter at monthly intervals
were collected using scale and digital vernier caliper
respectively. An experimental plot was established to
study the growth performance of Mahogany
seedlings in the field. Field observations were
undertaken 70 seedlings planted in Randomized
block design at a spacement of 2 x 2 m. Growth in
height and diameter of seedlings was taken in the
field at monthly intervals up to one year after
planting in the field.
Statistical Analysis
Complete Randomized Block experimental design
was used for all analyses performed in the
experiment. All treatments were replicated four
times. Data were analyzed using SPSS (version 20.0,
SPSS Institute, Chicago, IL, USA). The shoot height
and collar diameter were statistically analyzed using
one-way ANOVA with LSD test for multiple
comparisons (a=0.05).
RESULT
The observations on the initial survival rate after one
week of planting and final survival rate after eight
months of planting of the seedlings of mahogany are
given below in Fig 1. The survival rate was ranged
from 96 per cent to 99 per cent among various
treatments studied. Treatment T4 [Soil: partially
decayed tea waste (1:1)] and T7 [Soil: partially
decayed Tea waste: Sand (1:1:1)] showed 2 to 4 per
cent mortality. However, T3 [Soil: partially decayed
Coir waste (1:1)] and T6 [Soil: partially decayed
Coir waste: Sand (1:1:1)] showed relatively low rate
of mortality. Leaf fall and yellowing were more
prominent in T4 and T7.
Fig 1. Survival rates of seedlings in different intervals under various treatments of Swietenia macrophylla
seedlings
Page 5
JOURNAL OF PLANT DEVELOPMENT SCIENCES Vol. 6 (3) 359
Significant variation was observed among various
treatments with regard to height of seedlings.
However, it was not conspicuous at different
intervals up to the end of the study. Treatment T7
[Soil: partially decayed Tea waste: Sand (1:1:1)]
recorded the maximum height of 56.10 cm, which
was immediately followed by T5 [Soil: partially
decayed Municipal waste: Sand (1:1:1)], and T2
[Soil: partially decayed Municipal waste (1:1)].
Whereas treatment T3 [Soil: partially decayed Coir
waste (1:1)] showed the lowest value (36.73 cm). It
indicated that the influence of potting media on
height growth.
Table 1. Height (cm) under different treatments of Swietenia macrophylla at monthly intervals in nursery
Months Treatments
T1 T2 T3 T4 T5 T6 T7
Jul 18.42b
16.69d
12.50f
17.44c
16.65d
15.21e
21.90a
Aug 24.75d
25.41c
18.54g
21.82e
26.23b
19.59f
27.13a
Sept 29.46d
32.55c
20.80f
29.52d
34.71b
22.46e
35.86a
Oct 30.92e
37.26c
22.30g
32.79d
38.89b
25.45f
44.57a
Nov 32.80e
38.94c
23.27g
34.07d
42.79b
26.74f
46.02a
Dec 36.98d
41.61c
24.29f
36.61d
46.77b
29.59e
48.00a
Jan 40.24d
46.35c
27.86f
39.60d
49.58b
34.45e
52.74a
Feb 43.72d 48.78
c 31.05
g 41.87
e 52.02
b 36.73
f 56.10
a
** Significant at 0.01 levels
Means with same letter as superscript are homogeneous
Significant variation was also observed among
various treatments with regard to collar diameter of
seedlings at various months (Table 2). Treatment T1
[Soil: Sand: cow dung (1:1:1)] recorded maximum
collar diameter (9.35 mm) at the end of the study.
Treatment T4 [Soil: partially decayed Tea waste
(1:1)] was on par with treatment T5 [Soil: partially
decayed Municipal waste: Sand (1:1:1)]. Treatment
T3 [Soil: partially decayed Coir waste (1:1)]
recorded lowest value (5.97 mm) in collar diameter.
With regards to the advancing intervals, significant
variation was observed among treatments at the end
of the study period when compared to the initial
phase.
Table 2. Mean diameter (mm) under different treatments of Swietenia macrophylla at monthly intervals in
nursery
Months Treatments
T1 T2 T3 T4 T5 T6 T7
Jul 2.38d
2.61b
2.01e
2.41d
2.47c
2.40d
2.68a
Aug 3.68b
3.73b
2.70e
3.88a
2.93d
2.80de
3.48c
Sept 5.01b
5.86a
3.85f
4.14e
5.89a
3.39d
4.64c
Oct 6.00b
6.13a
4.27d
5.59c
6.13a
4.16e
6.10ab
Nov 6.27b
6.63a
4.74c
6.12b
6.72a
4.65c
6.65a
Dec 6.69c
7.40a
5.34e
7.07b
7.50ab
5.65d
7.28a
Jan 8.36b
7.88c
5.85e
8.15bc
8.13bc
6.39d
8.69a
Feb 9.35a 8.20
b 5.97
d 8.33
b 8.46
b 6.77
c 9.02
a
** Significant at 0.01 levels
Means with same letter as superscript are homogeneous
Performance of sapling planted in field revealed
significant difference in height due to the effect of
various potting media. The availability of nutrients
in growing substrate greatly affects the growth of
seedlings. With regards to height, the maximum
performance (155.62 cm) was registered in T2 [Soil:
partially decayed Municipal waste (1:1)] at the end
of study period (Table 3) and the least (59.75 cm)
height occurred in T6 [Soil: partially decayed Coir
waste: Sand (1:1:1)]. With regards to the height of
the seedlings in the field, it increased from 75.59
(T3) to 155.61 (T2) at the end of the study. In the
case of height, the treatment with maximum height in
the beginning did not show the maximum height at
the end of the study. In general increase in height at
different intervals was not significant up to the end of
the study i.e. 12 months.
Table 3. Height (cm) under different treatments of Swietenia macrophylla at monthly intervals in plantation
Months Treatments
T1 T2 T3 T4 T5 T6 T7
April 60.38bc
60.17bc
47.39a 64.17
c 62.17
bc 51.67
ab 70.63
c
Page 6
360 VIDYASAGARAN, K., AJEESH, R. AND VIKAS KUMAR
May 66.83b 64.67
b 48.99
a 69.42
b 64.33
b 52.00
a 69.42
b
June 68.86b 76.32
b 50.37
a 73.12
b 65.92
b 52.50
a 72.92
b
Jul 74.03bc
84.24c 52.63
a 78.43
bc 67.50
b 53.17
a 73.72
bc
Aug 77.77bc
92.49c 53.67
a 84.82
bc 69.50
b 53.83
a 74.55
b
Sept 81.90bc
104.92d 54.92
a 94.90
cd 70.50
bc 54.33
a 75.25
b
Oct 85.98bc
110.80d 55.83
a 99.42
cd 71.58
ab 54.83
a 76.26
ab
Nov 90.98bc
112.90c 57.33
a 104.08
c 72.98
ab 55.50
a 72.98
ab
Dec 95.48bc
116.27c 65.42
a 109.53
c 74.00
ab 56.17
a 79.25
ab
Jan 99.62bc
126.91d 67.48
a 114.39
cd 75.58
ab 57.50
a 80.25
ab
Feb 103.92bc
142.44d 71.07
a 128.55
cd 76.50
ab 58.50
a 84.00
ab
March 107.12c 155.62
d 75.59
ab 140.51
d 78.58
ab 59.75
a 89.15
bc
** Significant at 0.01 levels
Means with same letter as superscript are homogeneous
The collar diameter was reported in the range of 5.5
mm to 30.1 mm. A greater collar diameter (14.2) was
recorded for T2 [Soil: partially decayed Municipal
waste (1:1)] and lowest values of collar diameter
(5.5) was reported for T6 [Soil: partially decayed
Coir waste: Sand (1:1:1)] at the beginning of the field
performance (Table 4). The treatment with maximum
collar diameter (30.1) T4 [Soil: partially decayed Tea
waste (1:1)] and least (13.3) value recorded for T6
[Soil: partially decayed Coir waste: Sand (1:1:1)] at
the end of study period. There was no significant
increase in collar diameter at different intervals from
the beginning to the end of the study.
Table 4. Mean diameter (mm) under different treatments of Swietenia macrophylla at monthly intervals in
plantation
Months Treatments
T1 T2 T3 T4 T5 T6 T7
April 12.4c 14.2
c 9.0
b 12.4
c 7.8
ab 5.5
a 7.5
ab
May 13.3c 15.0
c 9.5
b 14.0
c 8.4
ab 5.9
a 8.6
ab
June 13.9c 16.0
c 10.2
b 15.8
c 9.4
b 6.1
a 9.5
b
Jul 14.7c 17.1
c 10.9
b 17.8
c 10.4
b 6.8
a 10.6
b
Aug 15.2c 18.4
cd 11.3
b 18.9
d 11.2
b 7.3
a 11.3
b
Sept 15.8c 19.2
cd 11.7
b 19.7
d 11.9
b 8.2
a 12.2
b
Oct 16.7cd
20.2de
12.4ab
21.5e 13.9
bc 9.1
a 12.9
abc
Nov 17.2c 21.9
d 13.0
ab 23.1
d 14.5
bc 10.0
a 13.8
abc
Dec 17.5b 23.2
c 13.3
ab 25.3
c 15.0
ab 10.7
a 14.2
ab
Jan 18.2b 24.1
c 13.7
a 27.1
c 15.3
ab 11.6
a 14.7
ab
Feb 19.1b 25.4
c 14.0
a 29.2
c 15.7
ab 12.4
a 15.4
ab
March 20.1b 26.4
c 14.4
a 30.1
c 16.3
ab 13.3
a 16.0
ab
** Significant at 0.01 levels
Means with same letter as superscript are homogeneous
The increment percent calculated for the growth in
height and diameter in nursery level at the end of the
study. The availability of nutrients in growing
substrate greatly affects the growth of seedlings.
With regards to height and diameter increment at
nursery level after eighth month showed the
maximum increase was in T7 (28.32 per cent) and -
3.53 per cent as compared to the control (T1) (Fig 2).
The least (-28.98 and -36.15 %) height and collar
diameter respectively was registered in T3.
Fig 2. Increment percentage in height and collar diameter under different treatments of Swietenia macrophylla
in the nursery
Page 7
JOURNAL OF PLANT DEVELOPMENT SCIENCES Vol. 6 (3) 361
The increment percent was also calculated for the
growth in height and diameter in plantation level at
the end of the study. It indicated that maximum
increment per cent in the plantation was recorded in
T2 (45.28) and T4 (49.55) for height and diameter
respectively. The least increment was observed in T6
(-44.22 and -33.83) respectively for height and
diameter as compared with control (T1) (Fig 3).
Fig 3. Increment percentage in height and collar diameter under different treatments of Swietenia macrophylla
in plantations
DISCUSSION
Disposal of solid waste has a major problem in the
country, especially in Kerala as the availability of
land fill sites have diminished and requirements for
making landfills environmentally acceptable have
driven up the costs substantially. Reuse of organic
wastes in agriculture holds promise in general, since
they offer a locally available fertility resource, and
their removal provides an effective and
environmentally acceptable option of waste disposal.
The present study investigates the effect of municipal
garbage and industrial waste as a component of
potting media on the growth and vigour of mahogany
in nursery as well as in the field.
Partially decomposed municipal garbage and
Industrial waste when used as a component potting
media were not significantly influenced the survival
rate of seedlings. Survival of seedlings was ranged
from 95 to 100 per cent. Survival was found
maximum in both treatments T2 [Soil: partially
decayed Municipal waste (1:1)] and T3 [Soil:
partially decayed Coir waste (1:1)]. It could be stated
that survival rate was directly proportional to the
period of decomposition of garbage. Gopikumar et
al. (2002) have conducted a study to find out the
effect of garbage and coir dust on establishment
and growth of seedlings of Tectona grandis,
Ailanthus triphysa and Albizia falcataria. The study
revealed seedlings when planted in potting media of
soil: sand: cowdung and soil: coir: dust recorded 100
per cent success with regard to both initial
establishment and final survival rate. Gopikukar,
(2009) reported the potting media containing
municipal garbage, initial establishment were found
to be good in Dalbergia latifolia.
A balanced rooting medium that contains an
adequate supply of nutrients is essential for plants to
attain maximum growth and development. Balanced
rooting media greatly affects the plant height and
availability of growing substrate with the supplement
of essential nutrients is essential for attaining
maximum plant height (Ikram et al. 2012). It was
observed from this experiment that, compared to
other media, municipal garbage should be considered
high ranking as a potting medium for plant height.
Results showed that coconut coir waste, tea waste
alone and in combination with soil contributed to
produce maximum plant height. Plant height is also
greatly affected by the environment, especially root
medium. Results indicated that using different
substrates in differing proportion as potting mix had
different effects on plant height. With regards to
height, maximum value was recorded by treatment
T7 [Soil: partially decayed Tea waste: sand (1:1:1)]
in mahogany. This is in agreement with the findings
of other research trials as represented by Adersh
(2001) in teak. Similar results were also observed
from the studies of Herrera et al. (2008), Mehmood
et al. (2013), Ribeiro et al. (2000), Sharifian et al.
(2014), Tariq et al. (2012) and Wilson et al. (2002).
Reported that addition of cowdung can improve soil
physical propertied and also nutrient availability and
this may be the probable reason for the better growth
of seedlings in potting media containing cowdung
(Adersh, 2001). Treatment with sand and coir pith
(T3) represented lowest height. Vidyasagran et al.,
2014 reported the use of mixture of soil, sand and
municipal garbage can optimizes the quality of
mahogany seedlings in nursery.
Plants exhibiting maximum stem diameter with
strong vigor can be used successfully. Collar
diameter of the seedlings at end of the study revealed
a different response to various potting media applied.
Here maximum values were registered in both
treatment T1 [Soil: Sand: cow dung (1:1:1 ratio-
control treatment)] and T2 [Soil: partially decayed
Municipal waste (1:1)]. However minimum collar
Page 8
362 VIDYASAGARAN, K., AJEESH, R. AND VIKAS KUMAR
diameter was recorded in treatment T3 for
mahogany. Addition of coir waste to soil proved less
influence on collar diameter and height. Sharifian et
al. (2014) have noticed greater shoot weight of sugar
maple seedlings when grown in green house
medium. The nutrient content in the potting media
have a high effect in the growth increment in
seedlings. The partly decomposed garbage has high
nutrient content and air space for the conduction of
air and water. It may the reason for the increment in
the growth. Similar observations were reported by
many research trials. Mohan et al. (1991) have
reported that a combination of soil, sand and FYM in
the ratio 1:1:1 increased the height and dry matter
production of seedlings of Swetenia macrophylla and
Dalbergia latifolia. Gopikumar, (2009) reported
Dalbergia latifolia showed a positive response on
growth and vigour in terms of shoot growth
parameters were found to be most promising when
the seedlings were grown in potting media containing
4 weeks decomposed municipal garbage and soil:
sand: cowdung.
The use of garbage waste for the preparation of
potting media provides plants with significant
quantities of essential nutrients, which should be
taken into account in fertirrigation. This is an
important result, in economic term, the production of
quality seedlings were ensured, the cost of
production may be decreased and the reduction in
environmental pollution. The study revealed that the
use of garbage with soil can provide high seedling
survival rate for Swietenia macrophylla, good
drainage, water holding capacity, aeration and
optimum nutrient, ultimately lead to the production
of good stoke and mitigate environmental pollution.
The experimental trial in plantation showed, there
was no significant effect for the potting media.
CONCLUSION
Urban waste materials are not always adequately
used in current commercial, afforestation practices,
such as nurseries, despite the possible immediate
benefits from using them, especially if they are
readily available and less expensive than traditional
substrates like peat, vermiculite etc. This work shows
that the utilization of municipal garbage as potting
media at nurseries has proven to be a useful
procedure to obtain suitable growing media for the
propagation of commercially important tree species
Swietenia macrophylla (Mahogany) seedlings, which
are frequently used for afforestation in tropics. In
general, plant growth and nutrition were enhanced by
using the municipal solid waste-based compost for
this purpose. The use at nursery of this kind of
domestic refuse could contribute to solve two
important problems: waste disposal (which is
becoming a serious problem in many countries) and
limit in ecological problems (mining for sand and
peat).
ACKNOWLEDGEMENT
We are thankful to the Environmental Management
Agency, Kerala for the financial support throughout
the project implementation period.
REFERENCES
Adersh, M. (2001). Municipal garbage as a
component of potting media for seedlings of
selected forest tree species. M.Sc. Thesis, Kerala
Agricultural University, Thrissur.
Evans, J. (1990). Planted forests of the wet and dry
tropics, their variety, nature and significance. New
for., 17: 25-36.
Gopikumar, K. (2009). Effect of garbage on
performance of rosewood ( Dalbergia latifolia)
seedlings in the nursery. International Journal of
Plant Sciences, 4 (2) : 346-351.
Gopikumar, K., Minichandran and
Vidyasagaran, K. (2002). Growth performance of
selected tropical forest tree species as influenced by
potting media containing garbage. Advances in
Forestry Research in India. (ed. Prakash, R.).
International Book Distributors. Dehra Dun, 149p.
Herrera, F.; Castillo, J.E.; Chica, A.F. and
Bellido, L.L. (2008). Use of municipal solid waste
compost (MSWC) as a growing medium in the
nursery production of tomato plants, Bioresource
Technology, 99: 287 – 296.
Ikram, S., Habib; U. and Khalid, N. (2012). Effect
of different potting media combinations on growth
and vase life of Tuberose (Polianthes Tuberosa
Linn.). Pakistan Journal of Agricultural Sciences,
49(2): 121-125.
IPCC, (2007): Climate Change 2007: The Physical
Science Basis. Contribution of Working Group I to
the Fourth Assessment report of the
Intergovernmental Panel on Climate Change
[Solomon, S., D. Qin, M. Manning, Z. Chen, M.
Marquis, K. B. Averyt, M. Tignor and H. L. Miller
(eds.)]. Cambridge University Press, Cambridge,
United Kingdom and New York, NY, USA. 996p.
Krishnankutty, C.N. (1990). Demand and supply of
wood in Kerala and their future trends. Research
Report 67. Kerala Forest Research Institute, Peechi,
Kerala, 66p.
Mehmood, T.; Ahmad, W.; Ahmad, K.S.; Shafi,
Y.; Shehzad, M.A. and Sarwar M.A. (2013).
Comparative Effect of Different Potting Media on
Vegetative and Reproductive Growth of Floral
Shower (Antirrhinum majus L.). Universal Journal
of Plant Science, 1(3): 104 – 111.
Mohan, S.; Prasa, K.G. and Gupta, G.N. (1991).
Fertilizer response of selected social forestry species
under varying soil texture. The Indian Forester, 111:
49 – 57.
Ribeiro, H.M.; Vasconcelos, E. and dos Santos,
J.Q. (2000). Fertilisation of potted geranium with a
Page 9
JOURNAL OF PLANT DEVELOPMENT SCIENCES Vol. 6 (3) 363
municipal solid waste compost. Bioresource
Technology, 73: 247 – 249.
Shah, K.L. (2000). Basics of solid and hazardous
waste management technology, Prentice hall, USA.
Sharifian, Z.; Mood, A.A.M. and Mohamadi, N. (2014). Effect of different ratios of municipal solid
waste compost on growth parameters and yield of
Marigold (Calendula officinalis Moench.) and Daisy
(Bellis Perennis L.). International journal of
Advanced Biological and Biomedical Research, 2(1):
43 – 50.
Sharma, P.C. (2002). Energy from municipal waste:
An overview with special reference to India.
Tree India Environ. J. 16: 1-9.
Spooner, C.S. (1971). Solid Waste Management in
Recreational Forest Areas. EPNOSWWP
Publication. S. Wales, pp 81-95.
Tariq, U.; Rehman, S.U.; Khan, M.A.; Younis, A.;
Yaseen, M. and Ahsan, M. (2012). Agricultural and
municipal waste as potting media components for the
growth and flowering of Dahlia hortensis ‘Figaro’.
Turkish Journal of Botany, 36: 378 - 385.
Umapathy, A. (2003). Rational practices for
environmental conservation. Environ. Sci. Engng, I:
11-17.
Vidyasagran, K.; Ajeesh R. and Vikas Kumar. (
2014). Use of municipal garbage for the production
of quality Swietenia macrophylla King. Seedlings.
Nature Environment and Pollution Technology . Vol.
13, No.4 (In Press).
Wilson, S.B.; Stoffella, P.J. and Graetz, D.A. (2002). Development of compost based media for
containerized perennials. Scientia horticulturae, 93:
311 – 320.
Page 10
364 VIDYASAGARAN, K., AJEESH, R. AND VIKAS KUMAR
Page 11
________________________________________________ Journal of Plant Development Sciences Vol. 6 (3) : 365-374. 2014
MICROPROPAGATION OF AN ENDANGERED MEDICINAL HERB OCIMUM
CITRIODORUM VIS.
Anamika Tripathi1, N.S. Abbas
2 and Amrita Nigam
1
1School of Sciences, Indira Gandhi National Open University, Maidan Garhi, New Delhi
2Department of Biology, Bhaskaracharya College of Applied Sciences, University of Delhi, New Delhi
Email: [email protected] Abstract: An efficient protocol has been developed for rapid micropropagation of Ocimum citriodorum Vis., an endangered
medicinal herb. The cotyledons were excised from the in vitro germinating seedlings and used as explants for the present
study. The explants yielded the highest frequency of 87.49% shoot regeneration with an average shoot length of 4.98 cm on
Murashige and Skoog (MS) medium supplemented with 1 mg l-1 6- benzylamino purine (BAP) + 0.1 mg l-1 napthalene
acetic acid (NAA) + 500 mg l-1 casein hydrolysate (CH) + 25 mg l-1 adenine sulphate (AS). Alteration from the optimal
concentration of BAP resulted in the formation of callus. Regenerated microshoots were separated and rooted on MS
medium containing NAA (0.5 mg l-1). Well-developed complete plantlets were transferred onto plastic cups containing
sterile soil and humus (1:1). Subsequently the acclimatized plantlets were successfully grown in garden. The regenerated
plants were morphologically identical and exhibited similar growth characteristics as compared to the donor plants.
Cytological studies of the regenerants revealed no change in chromosome numbers. Thus, regeneration protocol
demonstrated in the present study provides a basis for the germplasm conservation and investigation of its medicinally active
constituents.
Keywords: Cotyledonary explant, cytology, histological observations, ocimum citriodorum
INTRODUCTION
cimum citriodorum Vis. (Lemon basil) belongs
to the family Lamiaceae, is rich in aromatic
essential oils and valuable for its medicinal, volatile
and culinary properties (Venugopal and Rao, 2011).
It is a hybrid between basil (Ocimum basilicum) and
African Basil (Ocimum americanum) (Janarthanam
and Sumathi, 2012). Lemon basil grows upto 20-40
cm in height. It flowers in late summer to early fall
and bears white flowers. Its leaves are similar to basil
leaves, but narrower. Seeds form on the plant after
flowering and dry on the plant itself. Lemon basil is a
popular herb in Arabian, Laotian, Persian and Thai
cuisine. It is primarily grown in Northeastern Africa
and Southern Asia, for its strong lemon fragrance in
cooking and in the preparations of antioxidant tea
bags (Janarthanam and Sumathi, 2012). It is helpful
to ease the people suffering from early ejaculation,
late menstruation, breast milk, works as a gas
cleanser in the human body, helpful in removing
fever (Epriliati and Ginjom, 2012) and inhibits
hepatocarcinogenesis (Tripathi, 2011).
Ocimum plants possess essential oil, which contains
biologically active constituents that are insecticidal,
nematicidal, fungistatic, antimicrobial or antioxidant
(Janarthanam and Sumathi, 2012). These properties
can be attributed to the predominant essential oil
constituents, such as estragol, eugenol, linalool, citral
and 1-8, cineole
(Stanko et al., 2010a). It was
observed that essential oil obtained from the lemon
basil inhibits the growth of Staphylococcuss aureus.
Its essential oil is effective against many other food
borne pathogenic bacteria also such as, Enterococcus
faecalis, Enterococcus faecium, Proteus vulgaris and
Staphylococcus epidermis (Stanko et al., 2010a).
The conventional method for the propagation of
Ocimum species is through seed germination and
stem cuttings. However, poor germination of the
seeds ( 10%) due to season dependency (Saha et al.,
2014) and susceptibility to seedling blight and root
rot diseases (Siddiqui and Anis, 2009) as well as
unusually longer time (28 days or more, Sulistiarini,
1999) required for the rooting from stem cuttings,
restricts its multiplication. Therefore, it is necessary
to develop an in vitro rapid and reproducible protocol
for the large scale production of such medicinally
important plant (Venugopal and Rao, 2011). Ideally,
the medicinal plants should have the same genetic
make-up as of the selected high-yielding clones. As
seedling progeny of Ocimum shows variability due to
cross pollinating nature of the plant (Gopi et al.,
2006), the in vitro micropropagation could prove an
effective tool for obtaining the species with high
progeny uniformity (Asghari et. al., 2012). In vitro
plant regeneration of Ocimum citriodorum from leaf
(Venugopal and Rao, 2011) and nodal segment
(Venugopal and Rao, 2011; Janarthanam and
Sumathi, 2012)
have been reported earlier.
Janarthanam and Sumathi (2012) reported that the
highest percentage of shoot formation with maximum
number of shoots per culture was obtained from the
nodal explants of O. citriodorum on Murashige and
Skoog (1962) medium augmented with 1 mg l-1
BAP
and 0.025 mg l-1
indole acetic acid (IAA) and rooting
of the shoot was accomplished when 0.5 mg l-1
indole
butyric acid (IBA) was alone present with the basal
medium
(Janarthanam and Sumathi, 2012).
Venugopal and Rao (2011) reported that the higher
frequency of shoot formation was obtained from leaf
and nodal explants in MS medium containing BAP
and IBA. However, to date, there is no report on in
vitro studies of O. citriodorum through cotyledonary
O
Page 12
366 ANAMIKA TRIPATHI, N.S. ABBAS AND AMRITA NIGAM
explant. The present study is the first report to
describe a simple, rapid, reproducible, economical
and high frequency regeneration protocol for the in
vitro micropropagation of O. citriodorum using
cotyledonary explants and the subsequent
establishment of these plants in soil.
MATERIAL AND METHOD
Plant material and culture conditions
Seeds of O. citriodorum were collected from the two
year old plants growing in the beds of Botanical
garden of University of Delhi, Delhi, India. These
seeds were cleaned thoroughly under running tap
water, followed by washing with teepol detergent
solution and then with sterile distilled water. The
cleaned seeds were surface sterilized with 0.2% (w/v)
mercuric chloride (HgCl2) for 5 min and finally the
traces of sterilant were removed by repeatedly
washing in sterile distilled water. All subsequent
operations were carried out in a laminar air flow
chamber. Thereafter, seeds were germinated on MS
(1962) medium supplemented with 3% sucrose and
solidified with 0.8% agar. No plant growth regulators
(PGRs) were added. The seeds were incubated for 1
month and cotyledons excised from these aseptically
germinating seedlings were used as explants.
The explants were cultured on MS medium
supplemented with one of the four cytokinins
namely, BAP, kinetin (Kn), thidiazuron (TDZ) and
N6- (- 2 isopentenyl) adenine (2iP) at different
concentrations (0.5, 1.0, 1.5, 2.0 mg l-1
) with their
adaxial face in contact with the culture medium. The
best PGR for the shoot regeneration was determined
based on the regeneration rate. After selecting BAP
as the best PGR for direct shoot regeneration, further
experiments were carried out to assess the influence
of NAA, CH and AS on the shoot regeneration. All
plant growth regulators were obtained from Sigma
Aldrich (USA). Salts and other chemicals were
obtained from Qualigens, Glaxo and SRL, Mumbai
(India). Sucrose (3%, w/v) as carbon source was
added to the media. The pH of the medium was
adjusted to 5.8 using 0.1 N NaOH or 0.1 N HCl.
Approximately, 20 ml media was dispensed in each
150 25 cm test tubes (Borosil, India), plugged with
non absorbent cotton wrapped in two-layered muslin
cloth and sterilized by autoclaving at 1.06 kg cm-2
at
121 for 15 min. The cultures were maintained on
continuous light emitted from fluorescent
incandescent tubes (40 W, Phillips, Kolkata, India)
for 16 h light followed by 8 h dark period in a culture
room at 25 ± 2 temperature with a relative
humidity of 55 ± 5 %.
Rhizogenesis and acclimatization of regenerated
plantlets
Occasional rooting was observed in shoot
proliferation cultures that were left for over 5 weeks.
However, for proper rooting the microshoots with 4-6
leaves (2-3 cm) were harvested and transferred to
hormone free MS medium for 2 weeks to eliminate
any carry over effect of cytokinins (Shibli et al.,
1997). Elongated shoots (about 4-5 cm in length)
were then carefully transferred to the MS medium
supplemented with NAA (0.1-1.0 mg l-1
), IBA (0.1-
1.0 mg l-1
) and IAA (0.1-1.0 mg l-1
). MS basal
medium was used as control. Cultures were incubated
under the same conditions as mentioned above.
Well developed plantlets were carefully removed and
washed thoroughly in running tap water to remove
agar. Further, they were treated with 1% bavistin
(BASF, Mumbai, India) solution to prevent any
fungal infection. Thereafter, they were transferred to
plastic pots (5 cm diameter) containing autoclaved
soil: humus (1:1). Subsequently, acclimatization was
achieved by covering the plastic pots with polythene
bags to maintain the humidity. The plants were
irrigated with one-tenth of MS basal salt solution
devoid of sucrose and inositol. After 1 week, 3-5
holes were made in polythene bags and plants were
irrigated after every 4 days. The potted plants were
maintained in the culture room. After 45 days, the
plantlets were transplanted to earthen pots (25 cm
diameter) containing garden soil. They were kept
under shade in a net house for another 2-3 weeks
before being transferred to field for developing into
mature plants. Pre-acclimatization or gradual plant
exposition to external environment could contribute
to the future survival of the plant under greenhouse
conditions (Dibax et al., 2010).
Recording of data and statistical analysis
The morphogenetic response of explants were
evaluated after 6 weeks of culture in terms of (i)
shoot inducing frequency of explants, (ii) average
number of shoots per explants and (iii) average shoot
length per explant. The following parameters were
considered for the rhizogenesis: (i) root inducing
frequency of shoots, (ii) average number of roots per
shoot and (iii) average root length. For in vitro
regeneration, the shoot inducing frequency of
explants, the average shoot length, root inducing
frequency of shoots and average root length has been
represented as mean values along with standard error
(mean ± SE). The mean values were calculated on the
basis of a minimum of 12 replicates and each
experiment was repeated twice. The data expressed
as mean ± SE was statistically analyzed using
ANOVA (Analysis of Variance) through SPSS
(Statistical Package for Social Sciences) version 16.0.
The differences between means were tested for
significance by Duncan’s multiple range test
(DMRT) at p=0.05.
Histological studies
For histological observations regenerating explants
were excised and fixed in a mixture of
formalin: acetic acid: ethanol (1:1: 16) for 24 h
following dehydration in an ethanol/ xylene series.
Page 13
JOURNAL OF PLANT DEVELOPMENT SCIENCES Vol. 6 (3) 367
The material was infiltrated and embedded in paraffin
wax. Sections were cut on a rotary microtome at 7-
8µm thickness, dried onto slides, dewaxed in xylene
and rehydrated in a descending ethanol series.
Sections were stained with fast green and counter
stained with safranin. Slides were observed under a
Zeiss, Primo Star Microscope (Carl Zeiss Micro
Imaging GmbH, Gottingen, Germany) and suitable
sections were photographed using a Canon – G10
digital camera.
Scanning Electron Microscopy
To support the findings of in vitro studies scanning
electron microscopy was also performed for the in
vitro regenerated plantlets. Samples were fixed for 24
h with Karnowfsky’s fixative and stored in 0.1M
phosphate buffer (pH- 7.2). The tissues were critical
point dried and sputter coated with gold.
Observations and photographs were made on Leo-
435 VP variable pressure scanning electron
microscope (Co-operation Zeiss- Leica).
Cytological examination of mother plant and
regenerants
To determine the chromosome number of the
regenerants the root tips were collected. The root tips
were pre-treated with ice for 24 h at 4 . They were
fixed in freshly prepared Carnoy’s solution
(alcohol: acetic acid= 3:1) for 24 - 48 h and stored in
70% (v/v) ethanol at 4 (Wang et al., 2012). Fixed
root tips were subsequently washed 3-4 times with
distilled water and hydrolyzed in 1M HCl for 10 min
at 60 and then rinsed in distilled water (Mohammad
et al., 2013). Subsequently root tips were stained with
Feulgen stain for 1 hr. After washing, tips were
immersed in aceto-carmine and squash preparations
were made for the cytological studies. Cytogenetic
examination and chromosome counting were carried
out with a Zeiss, Primo Star Microscope equipped
with a Canon – G10 digital camera (Carl Zeiss
Micro Imaging GmbH, Gottingen, Germany). The
chromosome numbers of the regenerants were
compared with that of mother plant to prove that they
are genetically similar to their parent.
RESULT
Shoot induction and elongation
In order to establish an efficient in vitro regeneration
protocol for the commercial exploitation of this
important endangered herb, the explants were excised
from the aseptically germinating seedlings (Fig.1e).
The explants were inoculated on MS basal medium
as well as medium supplemented with various
concentrations (0.5, 1.0, 1.5, 2.0 mg l-1
) of cytokinins
(BAP, Kn, TDZ, 2iP). The explants cultured on the
MS basal medium, enlarged in size and became
necrotic after 2 weeks of inoculation. Addition of
cytokinin was essential for differentiation of multiple
shoots. Of the four cytokinins tested BAP was found
to be the best for the induction of shoots followed by
2iP, TDZ and Kn (Table 1). On MS media containing
BAP (1 mg l-1
), the explants initially enlarged from
its original size after 6 days of inoculation (Fig. 2a)
followed by the appearance of protuberances like
structure. Such structures differentiated into shoot
buds and subsequently gave rise to shoots on the
same media composition without an intervening
callus phase after 3-4 weeks of inoculation (Fig. 2b).
On altering the concentration of BAP from the
optimal level, calli were produced. In order to
enhance the morphogenic response, NAA was
incorporated in the MS medium with optimum
concentration of BAP. Significant increase in shoot
production was observed (62.49%), when NAA was
added to the medium at low concentration (0.1 mg l-
1), suggesting a synergistic effect of NAA on shoot
proliferation (Table 2). Higher concentration of NAA
(above 0.1 mg l-1
) in the medium resulted in the
production of callus. A remarkable threefold increase
in morphogenic response could be achieved (Table
2) when adenine sulphate and casein hydrolysate
were incorporated in MS medium with BAP and
NAA. Thus the maximum shoot regeneration
frequency (87.49 %) was observed on MS medium
containing BAP (1 mg l-1
) + NAA (0.1 mg l-1
) + CH
(500 mg l-1
) + AS (25 mg l-1
) with an average of 6.04
shoots per explant having an average shoot length of
4.98 cm after 4-5 weeks of culture (Table 2 and Fig.
2b- g).
Page 14
368 ANAMIKA TRIPATHI, N.S. ABBAS AND AMRITA NIGAM
Fig. 1 (a-e): A schematic presentation of the cotyledonary explants from seedling of O. citriodorum: (a) An
inflorescence of the mother plant from which seeds were collected; (b) Seeds on the MS basal medium; (c)
Germinating seedlings after 2 weeks of inoculation; (d) Explant as it looks before excision from the seedling; (e)
Excised cotyledonary explant (CE)
Table 1: Effect of different concentrations of cytokinins on multiple shoot induction from the cotyledonary
expalnts of Ocimum citriodorum
Plant growth regulators (mg l-1
) No. of cultures forming
shoots (%)
No. of shoots/ explant Shoot length (cm)
BAP 0.5 0a 0a 0a
1.0 29.16c 4.0 ± 0.0de 3.78 ± 0.31cde
1.5 0a 0a 0a
2.0 0a 0a 0a
Kn 0.5 0a 0a 0a
1.0 0a 0a 0a
1.5 20.83bc 4.41 ± 0.12e 4.20 ± 0.50e
2.0 16.66bc 3.83 ± 1.17abc 3.65 ± 0.21bcd
TDZ 0.5 24.99bc 2.75 ± 0.35b 3.82 ± 0.03de
1.0 12.49ab 2.75 ±0.35b 3.45 ± 0.21bcd
1.5 20.83bc 3.41 ± 0.12cde 3.62 ± 0.45bcd
2.0 0a 0a 0a
2iP 0.5 0a 0a 0a
1.0 16.66bc 3.0 ± 0.70bc 3.30 ± 0.07bc
1.5 20.83bc 3.0 ± 0.00bc 3.40 ± 0.28bcd
2.0 25.00bc 2.83 ±0.24b 3.24 ± 0.16b
Mean values in a column followed by different letters are significantly different as determined by SPSS at p =
0.05 according to DMRT
Page 15
JOURNAL OF PLANT DEVELOPMENT SCIENCES Vol. 6 (3) 369
Table 2: Effect of CH and AS on multiple shoot induction from the cotyledonary explants of Ocimum
citriodorum in the MS medium containing optimum concentration of BAP and NAA.
Plant growth regulators (mg l-1
) No. of cultures forming
shoots (%)
No. of shoots
/explants
Shoot length (cm)
BAP NAA CH AS
1.0 0.1 - - 62.49a 4.16±0.57a 4.03±0.19a
1.0 0.1 500 25 87.49b 6.04±0.06b 4.98±0.00b
1.0 0.1 700 50 79.16ab 5.95±0.007b 4.66±0.07b
Mean values in a column followed by different letters are significantly different as determined by SPSS at p =
0.05 according to DMRT
Root induction and acclimatization of plantlets
The in vitro induced shoots were placed on MS basal
medium as well as on the medium supplemented with
auxins (IBA, IAA and NAA) at various permutation
and combinations. Shoot failed to produce roots in
the MS basal medium. No significant results were
obtained in the MS medium supplemented with
different concentrations (0.1 – 1.5 mg l-1
) of IBA and
IAA (data not shown).However, root primordial
emerged from the base of shoots after 2 weeks of
transfer on MS medium supplemented with NAA
(0.5 mg l-1
) (Fig. 2h). A maximum of 87.49% shoots
induced an average of 6.04 roots with an average root
length of 4.77 cm after 3-4 weeks of transfer on MS
medium augmented with NAA (0.5 mg l-1
) (Table 3
and Fig. 2i, j). Higher concentration of NAA
drastically reduced the root inducing frequency
(Table 3). Plantlets with well developed shoots and
roots were removed from the culture tubes,
thoroughly washed and transferred to the thermo cups
containing sterile soil and humus (1:1) (Fig. 2k). The
plants were hardened by following the procedure
stated in material and methods and subsequently
transferred to the garden soil under natural
environment (Fig. 2l). About 95% survival frequency
was observed for the in vitro regenerated plantlets.
The plants were green, healthy and phenotypically
similar to the mother plant.
Table 3: Effect of different concentrations of NAA on root induction from the microshoots obtained from the
cotyledonary explants of Ocimum citriodorum
Concentration of NAA
(mg l-1
)
No. of cultures forming
roots (%)
No. of roots/ microshoot Root length (cm)
0.1 16.66a 1.25±0.25a 1.20±0.10a
0.5 87.49c 6.04±0.20c 4.77±0.04d
1.0 41.66b 3.20±0.20b 4.21±0.07c
1.5 20.83a 1.80±0.37a 3.18±0.09b
Mean values in a column followed by different letters are significantly different as determined by SPSS at p =
0.05 according to DMRT
Page 16
370 ANAMIKA TRIPATHI, N.S. ABBAS AND AMRITA NIGAM
Fig. 2 (a-l): Direct organogenesis through cotyledonary explants of O. citriodorum: (a) Enlargement of the
explant after 5 days of inoculation on the MS medium containing BAP (1 mg l-1
); (b) Initiation of shoot
formation after 2 weeks of inoculation on the MS medium containing BAP (1 mg l-1
) + NAA (0.1 mg l-1
) + CH
(500 mg l-1
) + AS (25 mg l-1
); (c) Differentiation of multiple shoots after 2-3 weeks of inoculation; (d) Enhanced
shooting after 3-4 weeks of culture on the same medium; (e) Excised single shoot growing well on the same
medium composition after 1 week of subculture; (f) Rapid proliferation and multiplication within 2 weeks; (g)
Elongation of shoot after 3 weeks; (h) Root induction from the excised shoots after 2-3 weeks of transfer on the
MS medium containing NAA (0.5 mg l-1
); (i) Profuse rooting after 3-4 weeks of transfer on the root induction
medium; (j) Plantlet showing healthy shoots and roots just before hardening; (k) 1 month old in vitro regenerated
plant proliferating in the pot containing sterile soil: humus (1:1); (l) Tissue culture raised plants well established
in the field after 3 months of transfer
Histological observations
Histological studies were carried out during a period
of two week culture to analyse the regeneration
process. During the first two days no clear
histological changes were detectable (Fig. 3a). The
first visible changes thereafter consisted of the setting
of a cell differentiation process in the epidermal and
sub-epidermal layers of the explants. Epidermal cells
divided periclinally and anticlinally producing both
further epidermal cells and a new subepidermal layer
(Fig. 3b). This process led to the formation of clusters
of smaller daughter cells that differed from the
mother ones by their thinner wall and densely stained
nuclei and cytoplasm. These particular cell clusters
formed meristemoids (M) (Fig. 3b). The arrangement
of cells in these bulges, their shape, size and
development of tracheary elements (Te) (Fig. 3b)
suggested that these were the site of origin of shoot
primordia. After 1 week of culture, formation of
shoot bud (Sb) with leaf primordial (lp) was observed
(Fig. 3c). A transverse section of 2 weeks old culture
showed shoot bud (Sb), first leaf primordial (lp1) and
second leaf primordial (lp2) with bulges of midrib
(mr) (Fig. 3d).
Page 17
JOURNAL OF PLANT DEVELOPMENT SCIENCES Vol. 6 (3) 371
Fig. 3 (a-d): Histological evidences of regeneration of complete plantlet from cotyledonary explants of O.
citriodorum: (a) Cotyledonary leaf explants freshly prepared from 5 day old seedling showing stellar region (SR)
and cortical region (CR); (b) High magnification of 3 days old culture showing the presence of dedifferentiated
cells (DC) in the epidermal and sub-epidermal tissues, initiation of formation of first meristemoids (M) and
tracheary element (Te); (c) Longitudinal section of 1 week old culture showing shoot bud (Sb) and leaf
primordial (lp); (d) Transverse section of 2 week old culture showing shoot bud (Sb), first leaf primordium (lp1),
second leaf primordium (lp2) with bulges of midrib (mr)
Scanning Electron Microscopy (SEM) SEM observations of the regenerating explant
revealed typical shoot formation with an apex and
shoot primordia. The shoot primordium was covered
by epidermis, built of more or less equal sized cells.
Shoot bud formation was initiated from the explants
as small nodular outgrowth without any apparent
callus stage. This developing outgrowth eventually
led to the formation of shoot buds (Fig. 4b).The
formation of buds of different size could be observed
in the developmentally active region of the
cotyledonary explants, thus documenting that they
have the much sought after potential for in vitro plant
regeneration ability in this plant species. On the
surface of the regenerated leaf, glandular trichomes
were observed (4c). The trichomes consisted of a
stalk cell, a neck cell and a pear shaped secretory cell
(capitate type II). Thus, these observations confirmed
the results of in vitro studies.
Fig. 4 (a-c): Scanning electron micrograph showing the development of shoot bud and leaf from the cotyledons
of O. citriodorum: (a) SEM of upper surface of the explants after 5-6 days of culture showing callus like
structure; (b) Shoot bud; (c) Surface of in vitro regenerated leaf showing trichomes (Tr)
Cytological analyses
The chromosome number has been found to be 2n =
72 from both regenerants (Fig. 5a) and mother plant
(Fig. 5b). In the present study, cytogenetic analysis
did not reveal any signs of abnormal mitosis in
dividing cells from the root tips of in vitro
regenerated plantlets. Although plants regenerating in
culture medium may show variability (Chakravarty
and Sen, 1992).The plantlets regenerating from the
cotyledons in the present study appear to be uniform
and genetically stable.
Page 18
372 ANAMIKA TRIPATHI, N.S. ABBAS AND AMRITA NIGAM
Fig. 5 (a-b): Cytological analysis of O. citriodorum: (a) 72 chromosomes of a metaphase cell from a root tip
squash of a regenerant; (b) Root tip squash showing chromosomes of the donor plant.
DISCUSSION
Development of direct shoot regeneration protocol
from cotyledons of O. citriodorum is one of the
important requisitions toward clonal mass
multiplication for commercial and pharmaceutical
application. Obtaining regenerants of same genetic
composition is yet another significant parameter
toward this direction. In the present study, the
plantlets were regenerated directly from the
cotyledons of in vitro raised seedlings of O.
citriodorum. MS medium was used for the in vitro
studies as it is the most appropriate and widely used
medium in dicotyledonous morphogenic processes
due to high NO3-
and NH4+
concentration and
proportion between these nitrogen forms (Dibax et
al., 2010). Of the four cytokinins, viz. BAP, Kn, TDZ
and 2iP tested, BAP proved to be the best both in
terms of percentage morphogenic cultures as well as
average shoot number per explant. Significance of
BAP in inducing multiple shoots has already been
reported in different species of Ocimum like, O.
basilicum (Sahoo et al., 1997), O. sanctum
(Singh and
Sehgal, 1999), O. gratissimum (Gopi et al., 2006), O.
citriodorum (Janarthanam and Sumathi, 2012)
and O.
basilicum (Shahzad et al., 2012). Thus, our results
are in consistence with the earlier reports. The
promotory effect of BAP in the present study over
other cytokinins could be due to its easy
permeability, increased affinity for active cell uptake,
less resistance to the enzyme cytokinin oxidase, or
receptor abundance in its perception apparatus which
interacts with the coupling elements in the signal
transduction chain
(Burch and Stuchbury, 1987).
Moreover, BAP if added exogenously shortens the
duration of S phase of cell division through
recruitment of latent origin of DNA replication both
in vitro and in vivo (Francis and Sorell, 2001).
Addition of growth regulators such as auxins to the
culture is extremely important, since they are able to
start cell division and control the growth processes
and cell elongation (Asghari et al., 2012). In the
present study also the morphogenic response
enhanced by the incorporation of NAA in the
medium containing optimum concentration of BAP.
This suggested synergistic effect of NAA on the
shoot proliferation from the explant. This could be
due to the fact that auxin in combination with
cytokinin, leads to rapid cell division, forming a large
number of relatively small and undifferentiated cells
(Mendoza and Kaeppler, 2002). Besides it, auxin to
cytokinin ratio modulates the cell division, cell
elongation and plant regeneration (Sahu et al., 2013).
The number of shoot per culture was decreased when
BAP concentration was increased from its optimal
level (1 mg/l). This may be due to the toxicity of
BAP at higher concentration which might lead to
genetic, physiological and morphological changes,
resulting in a reduction of the proliferation rate in
vitro (Narayanswamy, 1977).
The multiplication and establishment of cotyledonary
explant was further improved by the addition of AS
and CH. This could be due to the fact that adenine in
the form of adenine sulphate can stimulate cell
growth and greatly enhance shoot formation
(Murashige, 1974) by providing an available source
of Nitrogen to the cell. This nitrogen can be taken up
more rapidly than inorganic Nitrogen (Thom et al.,
1981). Our results confirmed the efficiency of CH in
in vitro growth which could be due to its high
concentration of glutamine that balances the shortage
of amino acid synthesis when the medium has a
phosphorous deficiency (Miel, 1985).
In the present study, rooting of the shoots was
induced in the MS medium supplemented with NAA.
Similar results were recorded in O. sanctum (Begum
et al., 2000) and O. basilicum also (Pattnaik and
Chand, 1996). This could be probably due to fact that
NAA reduces the induction period (Washida et al.,
2004) as well as increases the biomass (Kusmapudi et
al., 2010) by inducing proliferation and lateral root
Page 19
JOURNAL OF PLANT DEVELOPMENT SCIENCES Vol. 6 (3) 373
formation (Nandgopal and Kumaria, 2007; Sudha and
Seeni, 2001).
From the histological studies it is evident that O.
citriodorum displayed the direct pattern of
regeneration. The present study revealed the time
course of the organogenesis and the triggering of cell
division that leads to the formation of a complete
plantlet. Shoot primordia were observed after 3-5
days of culture on the inductive media, it may imply
that BAP activates cell division of the competent
cells (Mendoza et al., 1993).
The regenerants have been further revalidated as
genetically uniform and similar to the mother plant
by chromosome counting. Cytogenetic analysis can
provide information about abnormal mitosis or
changes in ploidy levels (Radic et al., 2005). In the
present study cytogenetic analysis did not reveal any
signs of abnormal mitosis in dividing cells from the
root tips of in vitro regenerated plantlets. The base
number of Ocimum has been suggested as x =12
(Stanko et al., 2010b). O. citriodorum is probably an
allohexaploid (2n = 6x = 72) as referred by Paton and
Putievsky (1996). Our results are confirmatory with
the reports of Mukharjee et al. (2005) and Stanko et
al. (2010b) who observed 2n = 72. However, some
researchers observed altered chromosome numbers
also, like Paton and Putievsky (1996) who reported
2n = 64 for the same species.
CONCLUSION
The present study has demonstrated the feasibility of
a direct regeneration and clonal propagation protocol
to produce true-to-type plants of O. citriodorum. To
the best of our knowledge, this is the first report of
successfully inducing plantlets from the cotyledons
of O. citriodorum. The ability of reliably producing
true-to-type plants, offers a promising tool for its
structural and functional genomics, as well as
biotechnological studies.
ACKNOWLEDGEMENT
Anamika Tripathi is thankful to Prof. Ved Pal Singh,
Department of Botany, University of Delhi, Delhi,
for providing laboratory facilities and Indira Gandhi
National Open University, Maidan Garhi, New Delhi,
for providing fellowship as Research & Teaching
Assistant and Senior Research & Teaching Assistant.
REFERENCES
Asghari, F.; Hossieni, B.; Hossani, A. and Habib
S. (2012). Effect of explants source and different
hormonal combinations on direct regeneration of
basil plants (O. basilicum L.). Australian Journal of
Agricultural Engineering, 3 (1): 12-17.
Begum, F.; Amin, N. and Azad A.K. (2000). In
vitro clonal propagation of holy basil- Ocimum
sanctum L. Plant Tissue Culture ,10: 31-37.
Burch, L.R. and Stuchbury, T. (1987). Activity and
distribution of enzymes that interconvert purine
bases, ribosides and ribotides in the tomato plant and
possible implications in cytokinin metabolism.
Physiologia Plantarum, 69: 283- 288.
Chakravarty, B. and Sen, S. (1992). Chromosome
and nuclear DNA in regenerants of Scillaindica
(Roxb.) Baker derived from two explants sources.
Cytologia, 57: 41-46.
Dibax, R.; Quisen, R.C.; Bona, C. and Quoirin, M. (2010). Plant regeneration from cotyledonary
explants of Eucalyptus camaldulensis Dehn and
histological study of organogenesis in vitro. Brazilian
Archives of Biology and Technology, 53 (2) 311-318.
Epriliati, I. and Ginjom, I.R. (2012) Bioavailability
of phytochemicals, Phytochemicals - A Global
Perspective of Their Role in Nutrition and Health, Dr
Venketeshwer Rao (Ed.). InTech.
Francis, D. and Sorell, D.A. (2001). The interphase
between the cell cycle and plant growth regulators- a
mini review. Plant Growth Regulators, 33: 1-12.
Gopi, C.; Sekhar, Y.N. and Ponmurugan, P. (2006). In vitro multiplication of Ocimum
gratissimum L. through direct regeneration. African
Journal of Biotechnology, 5(9):723-726.
Janarthanam, B. and Sumathi, E. (2012). Plantlet
regeneration from nodal explants of Ocimum
citriodorum Vis. Bangladesh Journal of Scientific
and Industrial Research, 47(4): 433-436.
Kusmapudi, S.; Selvakkumar, C.; Senthil, A.K.
and Beddireddi, S.L. (2010). In vitro root culture of
O. sanctum L. and evaluation of its free radical
scavenging activity. Plant Cell, Tissue and Organ
Culture, 101: 105-109.
Mendoza, M.G. and Kaeppler, H.F. (2002). Auxin
and sugar effects on callus induction and plant
regeneration frequencies from mature embryos of
Wheat (Triticum aestivum L.) In Vitro Cellular and
Developmental Biology- Plant, 38: 39- 45.
Miel, F.B.; Guignard, J.L.; Bury, M. and Agier, C. (1985). Glutamine as an active component of casein
hydrolysate: Its balancing effect on plant cells
cultured in phosphorus deficient medium. Plant Cell
Report, 4: 161- 163.
Mohammad, A.; Moieni, A. and Badi, H.N. (2013).
Morphological, physiological, cytological and
phytochemical studies in diploid and colchicines-
induced tetraploid plants of Echinacea purpurea (L.).
Acta Physiologiae Plantarum, 35: 2075-2083.
Murashige, T. (1974). Plant propagation through
tissue culture. Annual Review of Plant Physiology,
25:135–166.
Murashige, T. and Skoog F. (1962). A revised for
rapid growth and bioassays with tobacco tissue
cultures. Physiol. Plant, 15: 473- 497.
Nandgopal, S. and Kumari, B.D.R. (2007).
Effectiveness of auxin induced in vitro culture in
chicory. Journal of Central European Agriculture, 8
(1): 73-80.
Page 20
374 ANAMIKA TRIPATHI, N.S. ABBAS AND AMRITA NIGAM
Narayanswamy, S. (1977). Regeneration of plants
from tissue cultures. In: Applied and Fundamental
Aspects of Plant Cell Tissue and Organ Culture,
Ornamental Species, Volume 5, McGraw-hill
Publishing Company, USA, pp 3-9.
Paton, A. and Putievsky, (1996). Taxonomic
problems and cytotaxonomic relationships between
and within varieties of Ocimum basilicum and related
species (Labiatae). Kew Bulletin, 51: 509-524.
Pattnaik, S. and Chand, P.K., (1996). In vitro
propagation of the medicinal herbs O. americanum L.
syn. O. canum Sims. (hoary basil) and O. sanctum L.
(holy basil). Plant Cell Reports, 15: 846- 850.
Radic, S.; Prolic, M.; Pavlica, M. and Pevalek,
K.B. (2005). Cytogenetic stability of Centaurea
ragusina long term culture. Plant Cell Tissue and
Organ Culture, 82: 343-348.
Saha, S.; Sengupta, C. and Ghosh P. (2014).
Molecular and phytochemical analyses to assess
genetic stability in alginate- encapsulated
microshoots of O. gratissimum L. following in vitro
storage, Nucleus, DOI 10.1007/s13237-014-0107-y
Sahoo, Y.; Pattnaik, S.K. and Chand, P.K. (1997).
In Vitro clonal propagation of aromatic medicinal
herb Ocimum basilicum (Sweet Basil) by axillary
shoot proliferation. In Vitro Cellular Developmental
Biology- Plant, 33: 293-296.
Sahu, A.R.; Rath, S.C. and Panigrahi, J. (2013). In
vitro propagation of Aerva lanata (L.) Juss. ex
Schult. through organogenesis, Indian Journal of
Biotechnology, 12: 260-264.
Shahzad, A.; Faisal, M.; Ahmad, N.; Anis, M.;
Alatar, A. and Hend, A.A. (2012). An efficient
system for in vitro multiplication of Ocimum
basilicum through node culture. African Journal of
Biotechnology, 11 (22): 6055- 6059.
Shibli, R.A.; Ajlouni, M. M.; Jaradat, A.;
Aljanabi, S. and Shatnawi, M. (1997).
Micropropagation in wild pear (Pyrussyrica),
Scientia Horticulturae, 68: 237-242.
Siddiqui, I.; and Anis, M. (2009). Morphogenic
response of the alginate encapsulated nodal segment
and antioxidative enzymes analysis during
acclimatization of O. basilicm L. Jouranl of Crop
Science and Biotechnology, 12 (4): 233-238.
Singh, N.K. and Sehgal, C.B. (1999).
Micropropagation of Holy Basil (Ocimum sanctum
Linn.) from young inflorences of mature plants. Plant
Growth Regulation, 29: 161- 166
Stanko, K.C.; Orli, S.; Politeo, O.; Strikić, F.;
Kolak, I. and Satovic, Z. (2010a). Composition and
antibacterial activities of essential oils of seven
Ocimum taxa. Food Chemistry, 119: 196–201.
Stanko, K.C.; Liber, Z.; Besendorfer, V.;
Javornik, B.; Bohanec, B.; Kolka, I. and Satovic,
Z. (2010b) Genetic relations among basil taxa
(Ocimum L.) based on molecular markers, nuclear
DNA content and chromosome number. Plant
Systematics and Evolution, 285: 13-22.
Sudha, C.G. and Seeni, S. (2001). Establishment
and analysis of fast growing normal root culture of
Decalepis arayalpathra, a rare endemic medicinal
plant. Current Science, 81: 371-374.
Sulistiarini, D. (1999). Ocimum gratissimum L. In:
Oyen, LPA, NaguyenXuan Dung (eds.) Plant
Resource of South East Asia, No. 19: Essential Oils
Plants. Prosea Foundation, Bogor, Indonesia, pp.
140-142.
Thom, M.A.; Maretzki, K.E. and Sakai, W.S. (1981). Nutrient uptake and accumulation by
sugarcane cell culture in relation to growth cycle.
Plant Cell Tissue and Organ Culture, 1:3–14.
Tripathi, A. (2011). Anticarcinogenic potential of
some medicinal plants, The Botanica, 59 (61): 169-
175.
Venugopal, L.G. and Rao, A.P. (2011). In vitro
propagation and callus induction of endangered
medicinal herb Ocimum citriodorus. World Congress
on Biotechnology, Biotechnology-2011.
Wang, Q.M.; Gao, F.Z.; Gao, X.; Zou, F.U.; Sui,
X.; Wang, M.; Hui, Y.J. and Wang, L. (2012).
Regeneration of Clivia miniata and assessment of
clonal fidelity of plantlets. Plant Cell Tissue and
Organ Culture, 109: 191-200.
Washida, D.; Shimomura, K.; Takido, M. and
Kitanaka, S. (2004). Auxins affected ginsenoside
production and growth of hairy roots in Panax hybrid.
Biological and Pharmaceutical Bulletin, 27: 657-660.
Page 21
________________________________________________ Journal of Plant Development Sciences Vol. 6 (3) : 375-377. 2014
EVALUATION OF TGMS LINE OF SAFFLOWER (CARTHAMUS TINCTORIUS L.)
AT RAIPUR
Nirmala Bharti Patel and Rajeev Shrivastava
Department of Genetics and Plant Breeding,
Indira Gandhi Krishi Vishwavidyalaya, Raipur (C.G.)
Abstaract : Safflower is an often cross pollinated oilseed crop. The oil of safflower contains lenoleic and oleic acid
supposed to be the best for human health. Number of spiny or non spiny varieties of safflower has been developed throught
the India. Now there is constant platue in the yield, varieties A-1, Bhima and JSF-1 are some of the high yielding varieties
their yield level is not crossed by most of the newly developed varieties. This constant yield platue in safflower can be break
down by exploitaion of heterosis, through development of hybrid varieties. To develop male sterile lines number of genetic
tools such as CMS, GMS and now TGMS lines are in use and under testing. The major constraint in hybrid development
through GMS is maintanence of male sterile lines and required skill hence not popular. At Nimbkar Agricultural Research
Institute (NARI), Phaltan (Maharastra), thermo genic male sterile (TGMS) lines TMS-3-6-7-9 in safflower has been
identified. Its seed has been send to Raipur for its evaluation for pollen sterility and its performance under rice based
cropping system at Raipur.
Keywords : Carthamus tinctorius, crop, safflower
INTRODUCTION
afflower (Carthamus tinctorius L.) is grown
mainly as edible oilseed crop during winter and
spring seasons, under rainfed irrigation conditions.
India shares first rank in area and production with
50.6% share in the world area under safflower and
36.6% share in the world production (Anjani, K.
2012). There has been a decreasing trend in safflower
area and production in the world since 1987, despite
impressive improvement in productivity from
559kg/ha during 1987-88 to 890 kg/ha during 2008-
09 (Damodaran and Hegde, 2010).
The productivity level has reached near plateau in the
last one decade (1999-2008) due to various reasons
like moisture stress, poor soil nutrient status, salinity
and damage due to insect pests and diseases. These
constraints togather with limited genetic diversity
with low genetic advance and variation in expression
of yield and its components in different environments
are some of the major limitations to progress for
achieveing quantum jump in seed yielding
cultivars.Getting high jump in productivity at a rapid
pace under adverse growing conditions is the real
challenge to safflower researchers (Anjani, K. 2012).
Exploitation of heterosis is one of the major way to
break the yield platue. High degree of heterosis was
reported in safflower for number of characters like
yield (177%) and oil yield (80%). The major ways to
develop hybrids in safflower are through genetic
male sterility system (GMS) in troduced by Heaton
and Knowles, (1980) and Joshi et al., (1983) , CGMS
system introduced by Hill (1989) and use of TGMS
lines. The TGMS system is more feasible for this
crop.
MATERIAL AND METHOD
TGMS line (TMS-3-6-7-9) received from Nimbkar
Agricultural Research Institute (NARI, Phalton) was
evaluated at Raipur. The TGMS line was sown on
23rd
November, 2012 at Research cum Instructional
Farm of IGKV, Raipur. The normal agronomical
package of practices were applied. The plot size was
3X3 sq m, with a spacing 45 X 20 cm apart. After
flowering the flowers were morphologically as well
as cytologically examined for pollen sterility. As the
temperature was raised the pollen behaviour of
TGMS line was recorded. The pollen sterility was
tested by bagging the flower as well as by I, KI
solution under microscope.
RESULT AND DISCUSSION
The flowering in safflower crop varieties generally
varies from 80-110 days, depends upon the rosette
period of the variety and responsible for early and
delayed floering of the varieties. In TGMS line TMS-
3-6-7-9 the rosette period was for 20 days hence the
crop flowered in arround 80 days after sowing.
Initial morphological study of the flower
The flowers were small and their opeing was also
very small and few florets were emerged from the
flower. The cpitulum was small to medium in size.
The anthers coming out from them was thin and
rudementry, donot showed presence of any pollens
either visually at field or under microscope in the
laboratory, under Iodean- Potassium Iodied solution.
No sign of the pollens were observed in cytological
study at initial flowering stage. After four days there
was 99.9% sterility were observed, which remains
99.8% till 25th
Februarywhen the temperature was
29.8OC. After it the atmospheric temperature
becomes gradually incresing and the pollen behavor
was observed as in table-1.
Pollen study at frequent intervals
After 10 days of first blooming the number of
flowers were increased. The temperature during this
S
Page 22
376 NIRMALA BHARTI PATEL AND RAJEEV SHRIVASTAVA
period was between 29-30OC. From 2
nd week of
March the cytological studies indicated the presence
of 18% pollen fertility, which reached up to 32 % on
20th
March 2013 (Table-1,2). The meterological data
during the period indicated that from last week of
February the Maximum temperature started
increasing and reached up to 32.3 OC and in the third
week of March the temperature shoot up upto
36.4OC, which reaches up to 38 in the end of March
(table-3).
Similarly the five flowers were bagged by butter
paper bags at frequent interval inorder to study the
pollen sterility through selfing. No seed setting was
recorded till 1st March (Table -2). But with increase
in atmospheric temperature the average seed setting
was recorded from 5 to 9 seeds per capitulum up to
20th
March when the temperature was 36.4OC.
The study indicated negative corelation between
pollen sterility and the raised in environmental
temperature, in low temperature the TGMS line TMS
3-6-7-9 had no pollen formation, but as soon as the
temperature increases the sterility reduces and
formation of fertile pollen grains starts. In low
temperature or during winter flowering, the TGMS
line TMS-3-6-7-9 showed 100% rudimentary anthers
without pollen grains and worked as the male sterile
line, and can be used as female parent in hybrid seed
production programme at Raipur. Whereas, with the
gradual increase in the temperature appearance of
fertile pollen begins and as the temperature goes
above 32 OC, the fertile reached up to 32%. This
indicated that in higher temperature seed
multiplication of this line can be done, as in higher
temperature this line performs normal fertile line.
Table 1: Results of I-KI test for pollen sterility at Raipur.
S.No Date of evaluation of Pollen grains for
fertility
% Fertility % Sterility
1 12.2.2013 (Flower initiatiion stage) 0.2 99.8%
2 16.2.2013 0.1 99.9%
3 25.2.2013 0.2 99.8%
4 1.3.2013 0.3 99.7%
5 10.3.2013 18 82
6 15.3.2013 30 70
7 20.3.2013 32 68
Table 2: Resuts of selfing of flowers by bagging at Raipur.
S.No Date of evaluation of Pollen grains for
fertility
No. of flowers bagged % of seed setting
1 12.2.2013 (Flower initiatiion stage) 5 Nil
2 16.2.2013 5 Nil
3 25.2.2013 5 Nil
4 1.3.2013 5 Nil
5 10.3.2013 5 5 seeds (average)
6 15.3.2013 5 5 seeds (average)
7 20.3.2013 5 9 seeds (average)
Table 3: Meterological data of the station during the study.
Meteorological week Temp. in C Rainfall
(mm)
No. of
Rainy days
Sunshine hr. RH
Min. Max. Min.
(%)
Max. (%)
32. Feb 05-11 16.8 30.0 0.2 0 6.7 44 86
33. 12-18 16.4 29.7 11.6 2 6.7 47 87
34. 19-25 14.6 29.8 0.8 0 9.9 36 84
35. 26-04 13.8 32.3 0.0 0 10.0 22 79
36.Mar. 05-11 14.8 34.3 0.0 0 9.6 19 71
Page 23
JOURNAL OF PLANT DEVELOPMENT SCIENCES Vol. 6 (3) 377
37. 12-18 20.4 33.8 0.0 0 6.1 31 70
38. 19-25 20.2 36.4 0.0 0 8.3 22 66
39. 26-01 22.7 38.1 0.0 0 7.8 21 62
Fig-1: Study of pollen sterility in I-KI solution under microscope.
Fig-2: Flower of the TGMS line TMS-3-6-7-9.
REFERENCES
Anjani, K. (2012). Genetic improvement in
Safflower: possible avenues. Safflower research and
development in the world: Status and strategies, lead
papers, Indian Society of oilseeds research, DOR,
Hyderabad pp: 1-26.
Damodaran, T. and Hegde, D.M. (2010). Oilseeds
situations: A statistical compendium 2010. DOR,
Hyderabad, India p.486.
Heaton, T.C. and Knowles, P. F. (1980).
Inheritance of male sterility in safflower. Crop Sci.,
22: 520-522.
Hill, A.B. (1989). Hybrid safflower breedin. In:
Proceedings of second International Safflower
Conference. (Eds. Ranga Rao, V. and Ramchandram,
M.), Hyderabad, India, pp. 169-170.
Joshi, B.M., Nerkar, Y.S. and Jambhale, N.D. (1983). Induced male sterilityin safflower. J
Maharastra Agril. University, 8 (2): 194-196.
Page 24
378 NIRMALA BHARTI PATEL AND RAJEEV SHRIVASTAVA
Page 25
________________________________________________ Journal of Plant Development Sciences Vol. 6 (3) : 379-383. 2014
COMPARATIVE CYPSELAR FEATURES OF TWO SPECIES OF TAGETES
(TAGETEAE-ASTERACEAE) AND THEIR TAXONOMIC SIGNIFICANCE
Bidyut Kumar Jana and Sobhan Kumar Mukherjee
Taxonomy and Biosystematics Laboratory, Department of Botany, University of Kalyani,
Kalyani-741235, Nadia, West Bengal, India.
Email: [email protected] , sobhankr@gmailcom Abstract : Morphological and anatomical studies of cypselas in Tagetes lucida L. and Tagetes tenuifolia L. have been-
carried out in details with the help of light microscope. Some morphological features like cypselar surface hairs,
carpopodium, detachment area, pappus bristles have potential value for characterization. Anatomically, phytomelanin layer
is present in the mesocarpic region and which is continuous in case of Tagetes tenuifolia and discontinuous in case of
Tagetes lucida. In the cypsela of Tagetes lucida, testa and endosperm layers are uniseriately arranged, whereas in Tagetes
tenuifolia, testal layer is uniseriately arranged but endosperm layer is biseriately arranged. Based on the above mention
morpho - anatomical features, an artificial key to the studied taxa has been constructed.
Keywords: Diacritical features; tageteae; asteraceae
INTRODUCTION
he tribe Tageteae contains 32 genera and
approximately 270 species, which are found
mostly in the South-Western USA and Mexico
(Jeffrey, 2007). According to the observation of
Loockerman et al.(2003), this tribe has
approximately 216 New World species with a center
of diversity in the Mexican highlands. According to
Strother (1977), the genus Tagetes belongs to the
Tribe Tageteae (Asteraceae) comprising of 50
species which are distributed in warmer parts of
America. The name of this tribe was proposed by
Cassini (1819), but the tribe was previously included
in the tribe Heliantheae. Tageteae are generally
annual or perennial herbs, although some members
are shrubby or suffrutescent (Loockerman et al.,
2003). The most stricking character of this tribe is
the presence of pellucid glands containing aromatic
oils on the leaves and phyllaries. According to the
opinion of Soule (1993), a number of species of
Tagetes are used as medicinal beverages, or sold as
green herbs or vegetables in Latin America. Majority
of the earlier taxonomist including Cassini, (1829);
Lessing (1832); De Candolle (1836); had been placed
this tribe within the subfamily Asteroideae. Bremer
(1987, 1994); has mentioned this group as a distinct
tribe, which is closely related with the tribe
Heliantheae sensu lato. Strother (1977) has placed
this tribe into two sub tribes. Pectis is a genus,
which is placed within the first subtribe and
remaining genera have been included under 2nd
sub
tribe. In spite of being a fairly a large genus in
Tageteae, the cypselar morphological and anatomical
features have not been studied in details. The aims of
this study is to elaborate the detailed morpho-
anatomical features of cypselas of this genus, with
the help of light microscope.
MATERIAL AND METHOD
Mature, identified, cypselas of Tagetes lucida and
Tagetes tenuifolia were collected from Botanischer
Garten der Universitat Zurich with the collection
number-XX0Z-20031315 and XX0Z-20110213
respectively. Cypselas were process, following the
work of Mukherjee and Sarkar (1994). For
anatomical studies techniques of Johansens (1940)
were followed with Safranin and lightgreen and
ultimately mounted in Canada balsum.
RESULTS AND DISCUSSION
Tagetes lucida
Cypselar Morphology (Fig.1 A-G, 3 A-D)
Cypsela homomorphic, 7 mm x 0.05 mm including
awn, 5 mm x 0.05 mm excluding awn, black,
obovate, margin entire, straight, upper part truncate
whereas lower part tapered. Ellipsoidal in cross
sectional configuration. Surface pubescent. Surface
hair appressed to ascending in orientation with the
surface, made up of body and basal cells. Body cells
of surface hair with biseriately forked type. The tip
portion of body cells arranged at different plain.
Within the surface 16 ribs present, alternating with
furrow. Furrows wider than ribs.At the upper portion
of cypsela, stylopodium present, inconspicuous, fully
immersed into the nectar. Pappus awn like,
represented by ear like structure. With in the surface,
phytomelanin layer observed. At the basal region of
cypsela, carpopodium present, narrow than the base,
symmetric, quadrangular. Carpopodial cells with
thick-walled, pentangular, not pitted, arranged in
single row.
Cypselar Anatomy (Fig.1 H-I) Cypsela elliptic in cross sectional configuration. Ribs
present; 16 in number, in conspicuous. Cypselar wall
0.03 mm and 0.02 mm wide at ribs and furrow
T
Page 26
380 BIDYUT KUMAR JANA AND SOBHAN KUMAR MUKHERJEE
region respectively. Pericarp thick, differentiated into
epicarp and mesocarp. Epicarp uniseriate, made up of
thin walled, rectangular, compactely arranged,
parenchyma cells, provided with cuticle. Internal to
the epicarp mesocarp present, homogenous, made up
of compactely arranged, more or less pentangular,
sclerenchyma cells. In between the epicarp and
mesocarp, phytomelanin layer present,
discontinuously arranged. Testa attached with
cypselar wall, made up of thick walled, horizontally
placed, parenchyma cells, uniseriately arranged.
Endosperm persists in mature cypsela, uniseriate,
made up of, barrel shaped, parenchyma cells,
uniseriately arranged. Mature embryo occupies a
major part of cypsela, cotyledons 2 in number,
arranged at right angle to the axis of cypsela,
containing 12 resin ducts ( 6 ducts in each
cotyledon).
Tagetes tenuifolia
Cypselar morphology (Fig. 2 A-E, 3 E-G)
Cypsela homomorphic, 15 mm x 1 mm including
awn, 9 mm x 1 mm excluding awn, dark brown,
linear, straight. Surface pubescent, surface hair
adpressed to ascending in orientation, made up of
body and basal cells. The tip portion of body cell
with biseriately forked type, situated in a different
plane. Within the surface, phytomelanin layer exist.
Stylopodium inconspicuously developed. At the
upper portion of cypsela, pappus present; awn like,
homomorphic, yellow brown, arranged in a single
circle. At the basal region of cypsela, carpopodium
present; symmetric, more or less rounded.
Carpopodial cells with thick walled, arranged in 3
rows.
Cypselar anatomy (Fig. 2 F-G)
Cypsela more or less elliptic in cross sectional
configuration. Pericarp thick, on an average 0.02
mm, differentiated into epicarp and mesocarp.
Epicarp uni-seriately arranged, parenchymatous.
Internal to the epicarp, mesocarp present; made up of
continuously arranged, sclerenchyma cells. Just
below the epicarpic region, phytomelanin layer
present, continuously arranged. Testa attached with
cypselar wall, approximately 0.005 mm, made up of
crusted layer of parenchyma cells, uni-seriately
arranged. Endosperm persists in mature cypsela,
thick walled, parenchymatous, biseriately arranged.
Mature embryo occupies a major part of cypsela,
cotyledons 2 in number, arranged oblique to the axis
of cypsela, containing 6 resin ducts (3 ducts in each
cotyledon).
1 mm. A,B,C. 0.1 mm. D,H. 0.05 mm E,F,g,I
Fig.1: Cypselar morpho-anatomy of the species Tagetes lucida
1.A-G: Cypselar morphology: A-Cypsela, B-Upper part, C-Lower part, D- Surface showing hairs, E-An intact
surface hair, F-Surface showing phytomelanin deposition, G-Carpopodial cells; 1.H-I: Cypselar anatomy: H-
Diagramatic view, I-Cellular view.
Page 27
JOURNAL OF PLANT DEVELOPMENT SCIENCES Vol. 6 (3) 381
1 mm A,B 0.1 mm C,D, F 0.05 mm E,G
Fig.2: Cypselar morpho-anatomy of the species Tagetes tenuifolia
1.A-E: Cypselar morphology: A-Cypsela, B-Basal part, C-Surface hair, D- Part of pappus, E-Carpopodial
cells; F-G- Cypselar anatomy: F-Diagramatic view, G-Cellular view.
Abbriviations: Ep-Epicarp, Me-Mesocarp, Pl-Phytomelanin layer, T-Testa, Scl-Sclerenchyma, E-Endosperm,
RD-Resin duct, V.C.-Vellicular cavity
Page 28
382 BIDYUT KUMAR JANA AND SOBHAN KUMAR MUKHERJEE
Fig. 3. Micro photographs of studied cypselas.
3. A-D- Tagetes lucida: A-Cypsela, B-Pappus, C-Surface, D-Carpopodium; E-G- Tagetes tenuifolia: E-
Cypsela, F-Surface showing hairs, G- Basal portion of cypsela, showing carpopodium
Table 1: Comparative morpho-anatomical features of studied cypselas
Tagetes lucida Tagetes tenuifolia
1. Cypsela homomorphic, 7 mm x 0.05 mm
including awn, 5 mm x 0.05 mm excluding
awn.
1. Cypsela homomorphic, 15 mm x 1 mm including
awn, 9 mm x 1 mm excluding awn
2. Cypsela black in colour 2. Cypsela dark brown in colour
3. Cypsela obovate in shape 3. Cypsela linear in shape
4. Surface containing 16 ribs 4. Surface containing 4 ribs
5. Carpopodium quadrangular in shape 5. Carpopodium more or less rounded in shape
6. Carpopodial cells are arranged in single row 6.Carpopodial cells are arranged in three rows
7. Testa uni-seriately arranged, parenchymatous,
horizontally placed.
7.Testa uni-seriately arranged, made up of crusted layer
of parenchyma cells.
8. Endosperm uni-seriately arranged,
parenchymatous.
8.Endosperm bi-seriately arranged, parenchymatous.
9. Cotyledons placed at right angle to the axis of
cypsela
9.Cotyledons placed obliquely to the axis of cypsela
10. Each cotyledon containing 6 resin ducts 10.Each cotyledon containing 3 resin ducts
The studied cypselas are homomorphic. Surface is
pubescent. Surface hair is twin type, ascending in
orientation with the surface, made up of body and
basal cells. This type of surface marking is also
present in case of Tagetes minuta, of this tribe
(Mukherjee and Sarkar, 1999). Pappus is an
important taxonomic character of cypsela. Pappus is
also present in Tagetes minuta, of this tribe. General
morphology of the cypsela of this species is more or
less equal with some primitive members of the
tribe Senecioneae. In this connection, Mukherjee
(1992), has mentioned a connecting link between
the tribe Tageteae and Senecioneae. Not only the
tribe Senecioneae, it is also related with the tribes of
other Heliantheae Allianee Group ( Panero and Funk,
2002; 2008; Funk et al,2009; Cawford and Tadesse,
2014; Pandey et al, 2014). According to the
information of Bremer (1996) this group has been
treated as a subtribe in Helenieae. The similarity
between the tribe Tageteae and Heliantheae are as
follows
1. Presence of awn like pappus
Page 29
JOURNAL OF PLANT DEVELOPMENT SCIENCES Vol. 6 (3) 383
2. Presence of phytomelanin layer
3. Mode of arrangement of mechanical tissue
(Sclerenchyma tissue) in the pericarpic zone.
4. Nature of testa and endosperm.
From this above mention observation, it may be
concluded that, the tribe Tageteae is closely related
with the tribes of other Heliantheae Allianea Group
such as Heliantheae, Helenieae, Eupatorieae,
Bahieae, Coreopsideae, Madieae, Millerieae,
Perityleae, Polymnieae due to the presence of awns
and phytomelanin pigment etc.
Key to the studied cypselas
1a. Cypsela 7 mm x 0.05 mm including awns and 5
mm x 0.05 mm excluding awns; obovate;
carpopodial cells uniseriately arrange;
phytomelanin layer discontinuously arranged; testal
layer made up of horizontally placed, parenchyma
cells; endosperm layer uni-seriately
arranged.............................................. Tagetes lucida
1b. Cypsela 15 mm x 1 mm including awn, 9 mm x
1 mm excluding awn; linear; carpopodial cells
triseriately arrangeme; phytomelanin layer
continuously arranged; testal layer made up of
crusted layer of parenchyma cells; endosperm layer
biseriately arranged.......................Tagetes tenuifolia
ACKNOWLEDGEMENT
We are thank ful to Dr. Peter Enz, Curator,
Botanischer Garten der Universitat Zurich (Z),
Switzerland, for his kind help and cooperation,
regarding the free shipment of authentic botanical
specimens for our study.
REFERENCES
Bremer, K. (1987). Tribal interrelationships of the
Asteraceae. Cladistics 3: 210–253.
Bremer, K. (1994). Asteraceae Cladistics and
Classification. Portland Oregon: Timber Press.
Bremer, K. (1996). Major clades and grades of the
Asteraceae. In D. J. Hind and H. J. Hind and H. J.
Beentije (eds.), Compositae :Systematics.
Proceedings of the International Compositae
Conference, Kew, 1994 (D. J. N. Hind. Editor - in -
chief), Vol. 1 :1 - 7. Royal Botanic Gardens, Kew.
Cassini, H. (1819). Sixieme memoire sur la famille
des Synantherees, contenant les caracteres des
tribus. J. Phys. Chim. Hist. Nat. Arts 88: 150-163,
189-204.
Cassini, H. (1829). Tableau synoptique des
Synantherees. Annales des Sciences Naturelles. Paris
17: 387–423.
Crawford, D.J. and Tadesse, M. (2014). The
phytomelanin layer in traditional members of Bidens
and Coreopsis and phylogeny of the Coreopsideae
(Compositae). Nordic. J. Bot. 32: 80-91.
Decandolle, A. P. (1836). Compositae, Part I. In
Prodromus Systematis Naturalis Regni Vegetabilis,
vol. 5. Paris: Treuttel and Wurtz.
Dennis, J, Loockerman, Billie L. Turner, and
Robert K. Jansen (2003). Phylogenetic relationships
within the Tageteae (Asteraceae) based on nuclear
ribosomal ITS and chloroplast ndhF gene sequences.
Systematic Botany 28 (1):191–207.
Funk, V.A., Susanna, A., Stuessy, T.F. and
Robinson, H. (2009). Classification of Compositae.
In: Funk, V.A., Susanna, A., Stuessy, T.F. and Bayer,
R.J. (eds.). Systematics, Evolution and
Biogeography of Compositae. 171-192, Vienna,
IAPT.
Johansen, D. A. (1940). Plant Microtechnique. Mc
Graw Hill, New york.
Kadereit, J. W. and Jeffrey, C. (Eds.). (2007).
Flowering Plants: Eudicots- Asterales. In Kubitzki,
K. (Ed.). The Families and Genera of Vascular
Plants. Vol. VIII, Springer, Berlin, Germany.
Lessing, C. F. (1832). Synopsis Generum
Compositarum. Berlin: Duncker and Humblot
Mukherjee, S. K. and Sarkar A. K. (1999).
Diacritical features of cypsela in Tagetes minuta L.
of the tribe Tageteae (Asteraceae) with the aid of LM
and SEM. Int. J. Mendel,16 (1-2), 9-10.
Mukherjee, S. K. and Sarkar, A. K. (1994).
Morpho – anatomical studies of cypselas in some
members of the tribe Inuleae (Asteraceae) witht he
help of SEM. J. Natl. Bot. Soc. 48 : 19 -39.
Mukherjee. S. K. (1992). Carpological Studies in
Compositae. Ph.D thesis, Kalyani University, W. B.,
India. (Unpublish).
Pandey, A.K., Stuessy, T.F. and Mathur, R.R. (2014). Phytomelanin and systematic of the
Heliantheae Allianee (Compositae). Plant. Div. Evol.
131 (1-2): 1-21.
Panero, J.L. and Funk, V.A. (2002). Toward a
phylogenetic subfamilial classification for the
Compositae (Asteraceae). Proc. Biol. Soc.
Washington. 115: 909-922.
Panero, J.L. and Funk, V.A. (2008). The value of
sumpling anomalous taxa in phylogenetic studies:
major clades of the Asteraceae revealed. Mo 1.
Phylogenet. Evol. 47: 757-782.
Soule, J. A. (1993). The Biosystematics of Tagetes.
Doctoral Dissertation. University of Texas. Austin.
Strother, J. L. (1977). Tageteae - Systematic
Review. In V. H. Heywood et as. (eds), The Biology
and Chemistry of the Compositae, Vol. 2. 769 - 783.
Academic Press, London.
Page 30
384 BIDYUT KUMAR JANA AND SOBHAN KUMAR MUKHERJEE
Page 31
________________________________________________ Journal of Plant Development Sciences Vol. 6 (3) : 385-388. 2014
BUD GROWTH AND POSTHARVEST PHYSIOLOGY OF GLADIOLUS AND
CHRYSANTHEMUM-A REVIEW
K. Elavarasan1, M. Govindappa
3 and Badru Lamani
2
1Department of Extension, Extension Inspector,Regional Coffee Research Station, Coffee Board,
Govt. of India, Thandigudi, Kodaikanal, Dindigul (Tamil Nadu) –624216
Email: [email protected] 2Department of Agronomy, Regional Coffee Research Station, Coffee Board, Govt. of India,
Thandigudi, Kodaikanal, Dindigul (Tamil Nadu) –624216 3Department of Plant Physiology, Regional Coffee Research Station, Coffee Board, Govt. of India,
Thandigudi, Kodaikanal, Dindigul (Tamil Nadu) –624216 Abstract: This paper deals with mechanism of flower bud growth and postharvest physiology of gladiolus and
chrysanthemum. Both gladiolus and chrysanthemum are leading cut flowers trade in India as well as World. A spike of
gladiolus occurs of an acropetal sequence of stage of bud development on a single axis. A critical stage in flower bud growth
in the spike of gladiolus is initiated by gibberellic acid and sustained by sucrose. The important role of continued and
sequential basipetalis starch hydrolysis in the gladiolus petals could be to maintain by constant osmotic as well as a sink
potential in the growing area of the petal. In case of, Chrysanthemum flower fresh and dry weights of the ray florets increase
until the capitula is fully open. The soluble protein content declines after opening of capitula. The maximal activity of this
enzyme and acid invertase coincide with the period of highest increment in fresh and dry weight. Postharvest senescence of
gladiolus and chrysanthemum depends mainly of theirmethods of harvesting, transporting and increase the longevityof
flowers. Two factor play a major role in regulating the vase life of cut flower are carbohydrate supply and water balance.
This can be achieves through using of sucrose along with any of the following chemicals CoCl2, NiCl2, FeCl2 and AgNO3.
Keywords: Gladiolus, chrysanthemum, bud growth, postharvest, physiology, vase life
INTRODUCTION
an has selected flowers for their beauty, hues,
shapes, scents and keeping quality. In India,
flowers are generally cut without stalk and used as
fresh. Wreaths of jasmine, marigold, crossandra,
tuberose, chrysanthemum, rose and champak are
offered in temples and also used for personal
adornments. The physiology of senescence of
flowers grown in India is meagre. It is only recently
that floral decorations as practiced in the developed
countries have gained popularity in our country.
With its varied agro climatic conditions and
relatively low cost of production, India has immense
opportunities not only to meet the local demands of
both traditional and vase flowers but also a high
potential for export trade. Lack of enterprise, lack of
technical ideas,improper standardized method of
growing and harvesting flowers of internationally
acceptable quality, problems of packing and transport
and also a practically nonexistent production base
have been major impediments in realizing this goal.
Improvement in the quality of blooms has
necessitated research into the basic and applied
aspects of flower physiology in some of the major
international centres of flower production such as
Netherlands, UK, USA and Israel. There is a
resurgence of interests in India to broaden the
technical base and enthuseentrepreneurs to take up
export of flowers. In India, 27122 Million metric
tonnes of flowers are exported and its worth of Rs.
423.4 crores (APEDA, 2014). Research in several
aspect of flower initiation, flower bud development
and opening, sex expression, pollination biology and
physiology of senescence in a large number of plants,
especially ornamentals has been carried out for the
past three decades in ICAR, New Delhi and several
other science universities. In this paper, the main
findings on mechanism involved in flower bud
growth and on postharvest physiology of gladiolus
and chrysanthemum are reviewed.
Mechanism of flower bud growth in gladiolus and
chrysanthemum
A spike of gladiolus presentsa nature’s own flower
arrangement. It is ideal material for bud opening
studies. The occurrence of an acropetal sequence of
stage of bud development on a single axis makes it
possible to carry out several studies. The spike bears
buds in two rows (distichous arrangement) with the
telescoping of the outer bracts over one another (Fig
1.). The elongation of the flowering axis between the
budsloosens and separates the outer bract from the
axis. The fresh weight of corolla increases 16 times
and the dry weight by seven times and the outer bract
separates out until the corolla attains its full
expansion (Rao, 1979; Balaet al., 1986). The spike
harvest one week before the first floral bud opens
and which need exogenous supply of sugars
subsequent flower growth and opening (Rao and
Mohanram, 1981). The growing corolla continues to
import sugars throughout its development. The
function of sugar is not directly involved in the
metabolism. A part of the accumulated sugar in the
petals is secreted as nectar. In gladiolus, this occurs
at anthesis. The petal belonging to the buds with
unseparated outer bracts were observed to contain
M
Page 32
386 K. ELAVARASAN, M. GOVINDAPPA AND BADRU LAMANI
abundant starch in the ground parenchyma only(Rao
and Mohanram, 1980).Bala (1982) reported that α-
amylase and acid invertase activities increase with
the progression of corolla development and have a
positive correlation with the amount of
carbohydrates. The decline in starch in late
developmental stages can be correlated with the
sharp rise in α-amylase activity and reducing content.
The system of overlapping outer bracts which
completely enclose the flower buds and their gradual
separation represents a system programmed for
sequential exposure of successive buds to light and
stimulation of α-amylase, to permit an orderly
development of buds (Mohanramet al., 2004). Rao
(1982) illustrated that the outer bract acts as a natural
qualitative light filter and regulate the production of
α-amylase and petal growth by a red/far-red control.
α-amylase is formed exclusively in the petal
epidermis on perception of light.A crucial structural
and biochemical role of the epidermis in the percept
on of light leading to petal growth has been
recognized. Rao (1979, 1982) has observed that the
epidermal cells of petals of gladiolus possess
microlenses. These are formed by the outwardgrowth
of the outer radial wall of the epidermal cells causing
the formation of curved structure, which thicker in
the middle than edges. These microlense act to focus
light specifically on to the nucleus which situated in
the central zone of inner radial wall of the epidermal
cells.A critical stage in flower bud growth in the
spike of gladiolus, which is initiated by gibberellic
acid and sustained by sucrose, has also been
identified by Rao and Mohanram, (1986). One
important role of continued and sequential basipetal
starch hydrolysis in the gladiolus petals could be to
maintain a constant osmotic as well as a sink
potential in the growing area of the petal, in spite of
water uptake(Rao and Mohanram, 1980).
Chrysanthemum is only flower next to rose in
importance as cut flower in world trade. It comes in
various sizes and shapes and has an unmatched
wholesomeness and elegance. Pardhasaradhi (1985)
had made a detailed study of the growth of
chrysanthemum capitulam using different stages. His
finding revealed that the fresh and dry weights of the
ray florets increase until the capitulum is fully open.
The soluble protein content declines after opening of
capitulam. The maximal activity of this enzyme and
acid invertase coincide with the period of highest
increment in fresh and dry weight. Amylase activity
has increase in the florets till the half open flower
stage. Ethylene production is low during initial
stages of development of the capitulum and increase
with age (Fig 2.). Anelegant method has been
developed in this laboratory to study the expansion
of ray florets. This consist of floating ray florets (9 to
9.5mm) of Chrysanthemum morifoliumvarjyotsna
removed from the outer most whorl of young
capitulam and it can be taken into petri-plates
containing 30 ml of the test solution (Pardhasaradhi
and Mohanram, 1987). Using this technique it has
been shown that KCL causes upto 33% increase in
elongation. The value for GA3 and sucrose when
used individually are 39.8 and 28.9% increase in
elongation respectively. Maximum growth response
(82.8%) is recorded in combination of
KCL+GA3+sucrose. It is inferred that the increased
turgor resulting from sucrose promoted potassium
uptake along with GA3caused tissue extensibility
accounts for the enhanced floret growth. Ray floret
expansion is also retarded by Trimethyl Ammonium
Chloride (CCC), an inhibitor of gibberellin
biosynthesis. Pardhasarathi (1985) implied that
endogenous gibberellins are involved in ray floret
growth. The CCC effect can be overcome by
simultaneous application of GA3.
Postharvest physiology of flower
Flowers naturally lose moisture and colour fade with
limited time. While flowers like jasmine and
tuberose turn brown and dry, in some plants mass
shedding of petal occurs. Although majority of
flower are short lived, there are orchids such as
Phalaenopsisshilleriana in which a flower may stay
fresh on the plant for as long as four months as it
waits for the specific insect pollinator (Molisch,
1938). In most of plants petal wither, the sepals drop
and the stamens dry up following pollination. A clear
understanding of the causes of senescence should
help in developing methods of harvesting,
transporting and increase the longevity of gladiolus
and chrysanthemum. Two factor play a major role in
regulating the vase life of cut flower are
carbohydrate supply and water balance. Injury at the
cut end or growth of microorganism in the lumen of
xylem vessels (physical blockage) or accumulation
of microbial secretions and metabolic by products
(physiological blockage) could prevent absorption
which resulted in severe water deficit. Cut flower
longevity is also curtailed by ethylene (Chandra and
Mohanram, 1980). Investigation ofpostharvest
physiology of chrysanthemum and gladiolus has
shown that addition of a respirable substrate like
sucrose and antimicrobial agent (streptomycin and 8-
hydroxyl quinoline citrate)willprolongthe vase life
(Mohanram and Rao, 1977).
Flower senescence
Senescence of flowers is strongly promoted by
ethylene. Ethylene induced senescence of carnation
flowers was reported by Crocker and Knight (1908).
It prevents opening of young blossoms, causes
closure of opened flowers and fading of petals.
Pollination also causes fading of flowers and it has
been inferred that the senescence of the flower is
triggered by pollen-auxin stimulated ethylene
production (Burg and Dijkman, 1967). Similar,
finding was also identified by Lang (1961) in rose
and gladiolus.Antiethylene compounds such as
CoCl2, NiCl2, FeCl2 and AgNO3 promote the vase-
life and increase the size of the cut capitula in
chrysanthemum and marigold (Chandra et al, 1981).
Page 33
JOURNAL OF PLANT DEVELOPMENT SCIENCES Vol. 6 (3) 387
Use of sucrose along with CoCl2, NiCl2, FeCl2 and
AgNO3causes a further increment in vase life of
gladiolus by 20-24 days as compare to 7-8 days in
water (Fig 3.).
Fig 1. Flower bud growth in Gladiolus development Fig 2. Initial stages of development of capitulam in
chrysanthemum
Fig 3. Gladiolus kept under sucrose solution
CONCLUSION
This is brief account of the work carried out by
ICAR and other science research departments, has
shown the various ongoing and completed
experiments. We also recognized the need to
understand the science behind empirical indigenous
practices of growing, harvesting and storage of
gladiolus and chrysanthemumto put it on a sound
basis for exporting oriental flowers to the rest of the
world. And also reviewed brief subject related to the
basis of flower growth and wish to develop
techniques to prolong the shelf life of harvested
flower and we find a little information available in
India mostly based on ongoing experimentation and
systematic analysis.
REFERENCES
APEDA, [Agriculture and Processed Food
products Export Development Authority] (2014).
APEDA Home page (online) Export of commercial
flower from India in the year 2012-13,
http://www.apeda.gov.in/apedawebsite/index.asp
(Jan 2014).
Bala, R. (1982). Growth and opening of flower buds
in Gladiolus: some physiological and biochemical
aspects. M.phil. Dissertation, Univ. of Delhi, New
Delhi, India.
Bala, R.; Rao, I.V.R., and Mohanram, H.Y. (1986). Influence of stamens, gibberellic acid and
sucrose on corolla growth in gladiolus. J. Pl. Physiol.
122: 87-92
Page 34
388 K. ELAVARASAN, M. GOVINDAPPA AND BADRU LAMANI
Burg, S.P. and Dijkman, M.J. (1967). Ethylene and
auxin participation in pollen induced fading of vanda
orchid blossoms. Pl. Physiol. 42: 1648-1650.
Chandra, G. and Mohanram, H.Y. (1980).
Senescence of flowers.J. Scient. Ind. Res. 39: 337-
341.
Chandra, G.; Reddy, K.S. and Mohanram, H.Y. (1981). Extension of vase life cut marigold and
chrysanthemum flower by use of cobalt
chloride.Indian J. expl. Biol.19: 150-154.
Crocker, W. and Knight, L.I. (1908). Effect of
illuminating gas ethylene upon flowering
carnation.Bot. Gaz. 46: 259-276.
Lang, A. (1961). Auxins in flowering.In
Encyclopaedia of plant physiology. (Ed.). W.
Ruhland. 14: 909-950
Mohanram, H.Y. and Rao, I.V.R. (1977).
Prolongation of vase life of Lupinushartwegiiby
chemical treatment.Sci. hort. 7: 377-382.
Molisch, H. (1938). The longevity of plants.Science
press, Lancaster, Pennsylvania, USA.
Pardhasaradhi, P. (1985). Physiology of
development and senescence of capitula in
chrysanthemum.Ph. D. Thesis, Univ. of Delhi., New
Delhi, India.
Pardhasaradhi, P. and Mohanram, H.Y. (1987).
Correlated changes in carbohydrate levels and
associated enzyme activities during development and
senescence of ray florets in chrysanthemum. Proc.
Indian Acad. Sci. (Pl. Sci.).97(5): 377-384.
Rao, I.V.R. (1979). Postharvset physiology of the
spike and regulation of flower development in
gladiolus.Ph.D. Thesis, Univ. of Delhi, New Delhi,
India.
Rao, I.V.R. (1982). Mechanism of flower growth
and opening, a case study of gladiolus. Sci. Acad.
Medals for young scientists- lectures, pp 125-147
(New Delhi: Indian National Science Academy).
Rao, I.V.R and Mohanram, H.Y. (1980). Light-
mediated amylase synthesis in the petal epidermis of
gladiolus.Proc. Indian Acad. Sci. (Pl. Sci.).89: 323-
330.
Rao, I.V.R and Mohanram, H.Y. (1981).
Interaction of gibberellins and sucrose in flower bud
opening in gladiolus Indian J. Expl Biol.17(4): 447-
448
Rao, I.V.R and Mohanram, H.Y. (1986). Water
stress induced requirement of gibberellic acid for
flower bud growth and opening in gladiolus. J. Pl.
Physiol.122: 181-186.
Page 35
________________________________________________ Journal of Plant Development Sciences Vol. 6 (3) : 389-395. 2014
MOLECULAR CHRACTERIZATION OF CHRYSANTHEMUM
(CHRYSANTHEMUM MORIFOLIUM RAMAT) GERMPLASM USING RAPD
MARKERS
Deeksha Baliyan, Anil Sirohi, Devi Singh, Mukesh Kumar, Sunil Malik
and Manoj Kumar Singh
Sardar Vallabhbhai University of Agriculture & Technologym Meerut 250110 (UP), India Abstract: Genetic variation among 24 chrysanthemum cultivars was examined by RAPD markers. A total of 79 fragments
was produced with 10 RAPD primers and out of which 64 (81.01%) were found polymorphic and 15 bands (18.99%)
monomorphic. The number of polymorphic fragments varied from 4.0 (OPF13) to 15 (OPF06) with an average of 7.9 bands
per primer. The PIC was varied from 0.10 to 0.66 with an average .50, MI varied from o.36 to 6.99 with an average 2.92 and
RP value was noted in the ranged from 5.17 to 14.50 with an average 9.40. UPGMA clustering revealed two major group (
Group1 and Group 2) and these further devided into seven clusters. Among the 24 genotypes, Poncho, Terri, Rangoli, Sweta,
Ravikiran and Nanco are divergent and may be useful for breeding programme. Results suggested that RAPDs are highly
useful for assessing the genetic diversity analysis among the chrysanthemum germplasm and parental selection studies in
chrysanthemum.
Keywords: Chrysanthemum, molecular chracterization, RAPD markers, genetic diversity
INTRODUCTION
hrysanthemum is the second largest cut flower
after rose among the ornamental plants (Kumar
et al., 2006). Several species of chrysanthemum are
ornamental and grown in gardens for their large,
showy, multi colored flowers (Anon 1950). Now a
day, ornamental plants market demands new
cultivars for different characteristics (Minano et al.,
2009). However, the information for higher flower
yield and yield contributing parameters is limited.
Genetic improvement and development of new
varieties in chrysanthemum is very difficult due to
genome complexity, high level of heterozygocity,
occurrence of inbreeding depression, self
incompatibility and high rate of failure of many
crosses. (Wolff and Peter-van Rijn, 1993) . In newly
developed varieties, systematic identification and
characterization of cultivars is extremely important
in horticultural crops in order to protect the plant
breeders right (Kumar, et al., 2006). It is also
interesting in particularly in chrysanthemum where
many varieties are unknown. (Martin et al, 2002)
Therefore, it is necessary to estimate the genetic
variation and mode of inheritance of different plant
parameters in order to select diverse parents for
productive breeding programs in chrysanthemum.
Morphological characterization is labor intensive and
the phenotypic plasticity of plants makes
environment variation a major problem. It is a
simple technique to assess genetic variation in
genotypes under normal growing environment. (Fu et
al., 2008 and Condit, 1955). Therefore, molecular
markers are considered as useful tools for
identification of plant cultivars. The number of
molecular markers has been used to detect the
variation in ornamental plants (Rout and Mohapatra,
2006). Out of which RAPD is widely used due to
easily available markers.
In the present study, our objectives were to assess the
genetic diversity in twenty four released varieties of
chrysanthemum by using RAPD markers to
identified diverse genotype for breeding programme.
MATERIAL AND METHOD
Plant material
A total of 24 genetically diverse genotypes of
chrysanthemum were obtained from NBRI,
Lucknow, IARI, New Delhi) (Table 1). Young leaves
were collected from the field, put into labeled
envelopes, and stored in an ice box for transport to
the laboratory. In the laboratory the leaves were
stored at –20°C in a freezer until their DNA was
extracted.
Table. 1: Qualitative traits of 24 genotypes of chrysanthemum
S.
No. Genotypes Growth habit Flower colour Disc colour
Type of
Flower
Maturity
group
1 Gaity
Upright and
Medium Pink Yellow Double Mid
2 Kundan Upright and Tall Yellow * Double Late
3 Santa Dina Upright and Tall Dark pink Orange Semi Double Mid
4 Selection-69 Spreading and tall Pink Yellow Double Late
5 Selection-44
Spreading and
Dwarf
Bronze with yellow
margin Yellow Semi Double Mid
C
Page 36
390 DEEKSHA BALIYAN, ANIL SIROHI, DEVI SINGH, MUKESH KUMAR, SUNIL MALIK AND MANOJ
KUMAR SINGH
6
White
Prolific Upright and Tall White Light yellow Double Mid
7 Terry
Upright and
Medium Bronze Yellow Semi Double Early
8 Nanaco Upright and Tall Yellow * Double Early
9 Rangoli Upright and Dwarf Dark pink Yellow Semi Double Mid
10 Kirti
Spreading and
Medium White Yellow Semi Double Early
11 Ravi Kiran Upright and Tall Red with pink margin Dark red Semi Double Mid
12 Sonoton Upright and Tall Dark pink Yellow Single Early
13 Sweeta Upright and Tall Light pink * Double Mid
14 Poncho
Spreading and
Medium Orange Orange Single Mid
15
Basmati
Yellow Upright and Tall Dark Yellow * Double Mid
16 Kamaudi Upright and Tall Mauve * Double Late
17 Delilah
Upright and
Medium Pink Yellow Semi Double Mid
18
Ratlam
Selection Upright and Tall
White with cremish
center * Double Mid
19 SKC-83 Upright and Dwarf Pink Yellow Single Early
20
White
Bouquet
Upright and
Medium
White with cremish
center * Double Early
21
Reagan
Yellow Upright and Tall Pink Yellow Double Mid
22
Mother
Teresa Upright and Dwarf
White with cremish
center Yellow Double Early
23 Birbal Sahni Upright and Tall White * Double Mid
24 Fish Tail
Upright and
Medium White * Double Mid
DNA extraction and RAPD analysis
Total genomic DNA was extracted from fresh and
young leaf tissues following CTAB method (Doyle
and Doyle, 1990). The quality of DNA was checked
on 0.8% agarose gel and DNA concentration was
determined using a Bio-Rad’s Smart SpecTM
Plus
spectrophotometer.
Molecular data analysis
Data generated by using 10 RAPD primers on 24
chrysanthemum genotypes were scored in binary
format and further analyzed as described previously
(Kumar et al., 2009). Besides this, PIC
(polymorphism information content) Botstein et al.
(1980), marker index (MI) (Milbourne et al., 1997)
and Resolving Power (Rp) (Prevost and Wilkinson’s,
1999) were also calculated.
RESULT
RAPD Analysis
Diversity analysis based on RAPD fingerprinting
showed that the total number of polymorphic bands,
number of monomorphic bands, PIC, marker index
(MI) and resolving power (Rp) obtained for each
primer are shown in the Table 3 and comparative list
is presented in the Table 1&3. A total of 79 bands
were detected using 10 RAPD primers on the basis of
the presence (1) or absence (0) of the bands, out of
these 15 were monomorphic and 64 were
polymorphic thus generating 80.01% polymorphism
(Table 2) among the 24 genotypes included in the
investigation. Amplification patterns of various
RAPD primers are shown in Figure 2a&b. RAPD
DNA bands varied between 4 (OPF-13) and 15
(OPF-06) with an average of 7.9 bands per primer.
The maximum number of polymorphic bands (13
bands) was obtained using OPF-06 primer. The
average number of polymorphic bands was 6.4 per
primer. The molecular size of the bands amplified
using ten primers were in the range of 100-2100 bp
(Table 2).
Polymorphic Information Content (PIC) i.e. the value
of a marker for detecting polymorphism within a
population, depending on the number of detectable
alleles and the distribution of their frequency were
calculated for individual primers. PIC values for
RAPD primers ranged from 0.10 for OPD-08 to 0.66
for OPF-17, with an average of 0.50. Thus the study
indicated that the RAPD primer OPF-17 used in the
study was most polymorphic. Primers OPF-06, OPJ-
08, OPC-15 and OPF-14 had PIC values more than
average and therefore, may well be considered to be
well spread over the entire genome randomly. The
marker index (MI) varied between 0.36 (OPD-08)
and 6.99 (OPF-06) with average marker index of
2.92.The resolving power (RP) varies between 5.17
(for OPF-17) and 14.50 (OPF-06) with an average
value of 9.40.
Page 37
JOURNAL OF PLANT DEVELOPMENT SCIENCES Vol. 6 (3) 391
All the 79 bands, generated from 10 RAPD primers,
were subjected to calculate the genetic similarity
index (RAPD-GS) among the 24 genotypes. Genetic
similarities were calculated using the Nei-Li
similarity co-efficient. Significant genetic variation
was found among all chrysanthemum genotypes with
the GS value ranging from 0.59 to 0.94 (Table 5). Of
the 24 pair wise combinations generated by
chrysanthemum genotypes, the highest genetic
similarity was found between genotype Terry and
genotype Nanaco, and genotype Reagan Yellow and
genotype Birbal Sahni; while the lowest genetic
similarity 0.59 was observed between genotype
Selection-69 and genotype Mother Teresa. UPGMA
clustering method for dendrogram construction and
cultivar differentiation indicated that all 24
genotypes of chrysanthemum were discriminated
successfully by RAPD markers. All the 24 genotypes
of chrysanthemum were classified into two main
groups (Group 1 and Group 2) at the coefficient of
GS=0.70 (Figure 1). Group 1 and Group 2 divided
further to give a total of Seven clusters, as described
under. Group 1 divided into two clusters (Cluster I
and Cluster II) at the coefficient of GS=0.73. Cluster
I further subdivided into two sub clusters (Cluster Ia
and Cluster Ib) at the coefficient of GS=0.83. Cluster
Ia included 4 genotypes namely, Ratlam Selection,
Reagan Yellow, Delilah and Kamaudi. Cluster Ib
comprised of 3 genotypes viz., SKC-83, Birbal Sahni
and Basanti Yellow. Cluster II subdivided into two
sub clusters (Cluster IIa and Cluster IIb) at the
coefficient of GS=0.75. Cluster IIa included only a
single genotype Poncho; while Cluster IIb included 5
genotypes, viz., Sweeta, Sonoton, Fish Tail, Ravi
Kiran and Nanaco. Group 2 further divided into two
clusters (Cluster III and Cluster IV) at the coefficient
of GS=0.81. Cluster III contained only two
genotypes, Kirti and Mother Teresa. Cluster IV
divided into two sub clusters (Cluster IVa and
Cluster IVb) at the coefficient of GS=0.82. Cluster
IVa included just one genotype, Terry. Cluster IVb
included most of the genotypes (eight) namely,
Rangoli, Selection-44, Kundan, Selection-69, Santa
Dina, White Prolific, White Bouquet and Gaity.
Table 2: Analysis of RAPD markers.
Components RAPD
Total number of Primers used 10
Polymorphic markers all
Total number of bands amplified 79
Average number of bands per primer 7.9
Maximum number of bands amplified by a single primer 15
Number of polymorphic bands 64
Percentage of polymorphic bands (%) 81.01
Average number of polymorphic bands per primer 6.4
Maximum number of polymorphic bands amplified by a primer 13
PIC
maximum
minimum
average
0.66
0.10
0.50
Marker Index (MI)
maximum
minimum
average
6.99
0.36
2.92
Resolving power (Rp)
maximum
minimum
average
14.50
5.17
9.40
Size of PCR product 0.1-2.1kbp
Page 38
392 DEEKSHA BALIYAN, ANIL SIROHI, DEVI SINGH, MUKESH KUMAR, SUNIL MALIK AND MANOJ
KUMAR SINGH
Taable 3: RAPD Primer code, no. of polymorphic alleles, no. of monomorphic alleles & PIC, MI and Rp value
of 24 chrysanthemum genotypes S.No. Primer code Polymorphic
bands Monomorphic
bands
Diversity
index (PIC)
Marker
Index
(MI)
Resolving Power
(Rp)
1 OPF-06 13 2 0.62 6.99 14.5
2 OPC-07 7 0 0.50 3.49 8.42
3 OPJ-08 11 2 0.62 5.81 13.17
4 OPD-08 5 2 0.10 0.36 13.25
5 OPK-11 4 2 0.33 0.88 8.75
6 OPF-13 2 2 0.37 0.37 5.92
7 OPJ-13 5 2 0.52 1.84 8.25
8 OPF-14 7 1 0.65 4.01 9
9 OPC-15 5 2 0.62 2.21 7.58
10 OPF-17 5 0 0.66 3.29 5.17
Fig. 1: Dendrogram showing clustering of 24 chrysanthemum genotypes constructed using UPGMA based on
Jacquard’s similarity coefficient obtained from RAPD analysis.
Table 4: List of RAPD primers
S.No. Primer Code Sequence Make
1. OPF-06 5’GGGAATTCGG3’ IDT
2. OPC -07 5’GTCCCGACGA3’ IDT
3. OPJ-08 5’CATACCGTGG3’ IDT
4. OPD-08 5’GTGTGCCCCA3; IDT
5. OPK-11 5’AATGCCCCAG3’ IDT
6. OPF-13 5’GGCTGCAGAA3’ IDT
7. OPJ13 5’CCACACTACC3’ IDT
8. OPF14 5’TGCTGCAGGT3’ IDT
9. OPC-15 5’GACGGATCAG3’ IDT
10. OPF17 5’AACCCGGGAA3’ IDT
Page 39
JOURNAL OF PLANT DEVELOPMENT SCIENCES Vol. 6 (3) 393
M 1 2 3 4 5 6 7 8 9 10 11 12 13 14 15 16 17 18 19 20 21 22 23 24
Fig. 2a: RAPD profiling pattern of 24 chrysanthemum genotypes with OPF-06 primer
Figure 2b. RAPD profiling pattern of 24 chrysanthemum genotypes with OPJ-08 primer
Table 5: Similarity matrix generated by Jaccard’s similarity coefficient for 24 genotypes of chrysanthemum
obtained from RAPD analysis.
C1 C2 C3 C4 C5 C6 C7 C8 C9 C10 C11 C12 C13 C14 C15 C16 C17 C18 C19 C20 C21 C22 C23 C24
C1 1 C2 0.91 1
C3 0.85 0.86 1
C4 0.85 0.81 0.82 1
C5 0.89 0.87 0.91 0.81 1
C6 0.89 0.9 0.86 0.78 0.87 1
C7 0.91 0.85 0.86 0.81 0.9 0.8 1 C8 0.92 0.86 0.85 0.82 0.86 0.81 0.94 1
C9 0.82 0.81 0.82 0.8 0.86 0.84 0.81 0.77 1
C10 0.8 0.81 0.75 0.75 0.76 0.86 0.76 0.75 0.82 1
C11 0.86 0.8 0.81 0.78 0.82 0.85 0.85 0.86 0.78 0.78 1
C12 0.82 0.81 0.8 0.82 0.81 0.78 0.81 0.82 0.77 0.72 0.83 1
C13 0.76 0.8 0.73 0.68 0.77 0.85 0.72 0.71 0.73 0.84 0.77 0.71 1 C14 0.76 0.75 0.68 0.68 0.72 0.72 0.77 0.73 0.76 0.78 0.77 0.76 0.8 1
C15 0.68 0.72 0.66 0.61 0.67 0.7 0.7 0.66 0.71 0.76 0.67 0.71 0.8 0.9 1
C16 0.7 0.73 0.65 0.62 0.66 0.76 0.63 0.62 0.67 0.75 0.66 0.64 0.78 0.76 0.86 1
Page 40
394 DEEKSHA BALIYAN, ANIL SIROHI, DEVI SINGH, MUKESH KUMAR, SUNIL MALIK AND MANOJ
KUMAR SINGH
C17 0.7 0.73 0.7 0.7 0.68 0.76 0.63 0.62 0.75 0.7 0.68 0.7 0.73 0.73 0.78 0.8 1
C18 0.73 0.72 0.71 0.66 0.72 0.7 0.75 0.71 0.71 0.73 0.72 0.71 0.77 0.85 0.87 0.78 0.78 1 C19 0.73 0.7 0.68 0.63 0.7 0.67 0.72 0.71 0.66 0.68 0.72 0.71 0.75 0.82 0.85 0.76 0.68 0.9 1
C20 0.67 0.66 0.67 0.62 0.68 0.63 0.66 0.62 0.65 0.64 0.66 0.64 0.66 0.76 0.76 0.67 0.7 0.81 0.83 1
C21 0.71 0.72 0.76 0.63 0.77 0.7 0.7 0.68 0.71 0.63 0.72 0.68 0.67 0.7 0.75 0.68 0.78 0.8 0.77 0.81 1
C22 0.67 0.68 0.67 0.59 0.68 0.66 0.63 0.62 0.67 0.7 0.63 0.62 0.68 0.76 0.81 0.72 0.75 0.83 0.81 0.85 0.89 1
C23 0.75 0.73 0.75 0.65 0.76 0.71 0.71 0.7 0.7 0.64 0.76 0.7 0.68 0.73 0.76 0.7 0.77 0.83 0.81 0.82 0.94 0.87 1 C24 0.68 0.65 0.66 0.66 0.65 0.62 0.65 0.63 0.63 0.66 0.67 0.63 0.67 0.75 0.77 0.71 0.71 0.85 0.87 0.83 0.82 0.86 0.86 1
DISCUSSION
Molecular traits based diversity
Polymorphic genetic markers have wide potential
applications in plant improvement programmes as a
means for varietal and parentage identification,
evaluation of polymorphic genetic loci affecting
quantitative economic traits, and genetic mapping. A
total of 79 bands were detected using 10 RAPD
primers in the present study, out of these 15 were
monomorphic and 64 were polymorphic (Table 2),
thus generating 81.01% polymorphism. The results
of polymorphism generated by RAPD in
chrysanthemum genotypes were in close conformity
with those of earlier investigators (Wolff. and Peters,
1993; Wolff, 1996; Martin, et al., 2002, Kumar, et
al., 2006. The maximum number of polymorphic
bands (13 bands) was obtained using OPF-06 primer.
The average PIC, MI and Rp values for RAPD
primers were 0.50, 2.92 and 9.40 respectively. RAPD
primers except OPF-13 are significantly efficient in
analysis considering the values of PIC and Rp.
In the present study, a dendrogram was constructed
based on the basis of RAPD markers which showed
81.01 per cent of the bands observed were
polymorphic between the 24 chrysanthemum
genotypes. This seems to be relatively high when
compared to the reports of other RAPD studies, e.g.
in Brassica spp (Demeke et.al., 1992), Alternaria spp
(Wilkie et.al., 1993) Sorghum (Tao et al.1993),
Alfalfa (Yu and Nguyen, 1994), celery (Yang and
Quiros, 1993) and Sweet Potato (Connolly et.al.,
1994). One of the reasons for this high level of
polymorphism could be that the intra-specific
variation in chrysanthemum is extensive. The other
reason could be that we have used primers with 60 to
70% GC content, whereas some other workers,
including Yamamoto et al. (1994) have included
primers with less GC content also in their studies.
Fukuoka et al. (1992) observed an increase in the
number of bands with increasing GC content of the
primers. They got an average of 0.8 bands per primer
with 40 per cent, 6.1 bands with 50 per cent and 8.6
bands with 60 per cent GC content. The explanation
for this correlation between the GC content of the
primer and the number of bands is that the stability
of base complementation is high when G is pairing
with C by three hydrogen bonds than the
complementation of A with T by two hydrogen
bonds.
CONCLUSION
In the present study, RAPD analysis provided good
insight of genetic diversity. UPGMA analysis clearly
separated the genotypes into distinct groups.
Therefore, the present study suggested that molecular
markers could be used to achieve a reliable
evaluation and robust characterization of the species
diversity. Present study showed that some genotypes
like Poncho, Terri, Rangoli, Sweta, Ravikiran and
Nanco were more diverse than others and these
genotypes could be a good alternative source for
fruitful chrysanthemum breeding program.
REFERENCES
Anon (1950). The wealth of India, Raw Materials,
CSIR, New Delhi. 2, 143-148.
Botstein D, White RL, Skolnick M, Davis RW (1980). Construction of genetic linkage map in man
using restriction fragment length polymorphisms.
Am J Hum Genet 32, 314–331.
Condit, I.J. (1955). Fig varieties: a monograph.
Hilgardia Berkeley 23, 323–538.
Connolly, A. G., Woodwin, I. D., Cooper, M. and
DeLacy, I. H. (1994). Interpretation of randomly
amplified polymorphic DNA marker data for
fingerprinting sweet potato (Ipomoea batatas L.)
genotypes. Theor. Appl. Genet. 88: 332–336.
Demeke, T., Adams, R. P. and Chibbar, R. (1992).
Potential taxonomic use of random amplified
polymorphic DNA (RAPD) : a case study in
Brassica. Theor. Appl. Genet. 84: 990–994.
Doyle, J.J., Doyle, J.L. (1990). Isolation of plant
DNA from fresh tissue. Focus 12, 13-15
Fu, X.P., Ning, G.G., Gao, L.P., Bao, M.Z. (2008).
Genetic diversity of Dianthus accessions as assessed
using two molecular marker systems (SRAPs and
ISSRs) and morphological traits. Sci. Hortic. 117,
63–270
Fukuoka, S., Hosaka, K. and Kamijima, O.
(1992). Use of random amplified polymorphic DNAs
(RAPDs) for identification of rice accessions. Jpn. J.
Genet. 67: 243–252
Kumar, S, Prasad, K.V. and Choudhary, M.L.
(2006). Detection of genetic variability among
chrysanthemum radiomutants using RAPD markers.
Current Science 90(8): 1108-1113
Kumar V, Sharma S, Sharma AK, Sharma S,
Bhat KV (2009). Comparative analysis of diversity
Page 41
JOURNAL OF PLANT DEVELOPMENT SCIENCES Vol. 6 (3) 395
based on morpho-agronomic traits and microsatellite
markers in common bean. Euphytica 170: 249-262.
Martin, C and Benito M.E.G. (2005) Survival and
genetic stability of Dendranthema grandiflora Tzelev
shoot apices after cryopreservation by vitrification
and encapsulation-dehydration. Cryobiology 51:281-
289.
Milbourne, D., Meyer, R., Bradshaw, J. E., Baird,
E., Bonar, N., Provan, J., Powell, W. and Waugh,
R. (1997). Comparison of PCR-based marker
systems for the analysis of genetic relationships in
cultivated potato. Mol. Breeding. 3(2): 127-136.
Minano, H.S., Gonzalez-Benito. M.E. and Martin,
C (2009). Molecular characterization and analysis of
somaclonal variation in chrysanthemum cultivars
using RAPD markers. Scientia Hort. 122: 238-243.
Naidu NV, Satyanarayana A (1991). Studies on
genetic divergence over environments in mung bean.
Indian J Genet 51, 454–460.
Prevost A, Wilkinson M (1999). A new system of
comparing PCR primers applied to ISSR
fingerngerprinting of potato cultivars Theor. Appl.
Genet. 98: 107-112.
Rout GR; Mohapatra A. (2006). Use of molecular
markers in ornamental plants: A Critical Reappraisal.
European Journal of Horticultural Sciences 71: 53-
68.
Tao, Y., Mananers, J. M., Ludlow, M. M. and
Henzell, R. G. (1993). DNA polymorphisms in
grain sorghum (Sorghum bicolor (L.) Moench). Theor. Appl. Genet. 86: 679–688.
Wilkie, S. E., Issac, P. G. and Slater, R. J. (1993).
Random amplified polymorphic DNA (RAPD)
markers for genetic analysis in Allium.. Theor. Appl.
Genet. 86 (4) : 497–504.
Wolff, K. and Rijn, J.P. (1993). Rapid detection of
genetic variability in chrysanthemum
(Dendranthema grandiflora. Tzvelev) using random
primers. Heredity. 71: 335-341.
Wolff, K., (1996). RAPD analysis of sporting and
chimerism in chrysanthemum. Euphytica 89:159-
164.
Yamamoto, T., Nishikawa, A. and Oeda, K.
(1994). DNA polymorphism in Oryza sativa L.
amplified by arbitrary primer PCR. Euphytica. 78:
143–148.
Yang, X. and Quiros, C. (1993). Identification and
classification of celery cultivars with RAPD markers.
Theor Appl Genet 86: 205-212.
Yu, L. X. and Nguyen, H. T. (1994). Genetic
variation detected with RAPD markers among
upland and lowland rice cultivars (Oryza sativa
L.)Theor. Appl. Genet. 87: 668–672.
Page 42
396 DEEKSHA BALIYAN, ANIL SIROHI, DEVI SINGH, MUKESH KUMAR, SUNIL MALIK AND MANOJ
KUMAR SINGH
Page 43
________________________________________________ Journal of Plant Development Sciences Vol. 6 (3) : 397-403. 2014
ASSESSMENT OF GENETIC DIVERSITY IN CHRYSANTHEMUM
(CHRYSANTHEMUM MORIFOLIUM RAMAT) USING MICROSATELLITE
MARKERS
Deeksha Baliyan, Anil Sirohi, Devi Singh, Mukesh Kumar, Sunil Malik,
and Manoj Kumar Singh
Sardar Vallabhbhai University of Agriculture & Technologym Meerut 250110 (UP), India Abstract: The genetic diversity among 24 chrysanthemum cultivars was investigated by 07 Simple Sequence Repeats
(SSRs). A total of 16 bands were produced out of which 15 bands were found polymorphic and 01 band monomorphic. The
number of polymorphic fragment varied from 02 (RM1) to 03 (RM433) with an average 2.14 fragment per primer and
percent polymorphism varied from 66.75 to 100% with an average of 93.75%. The PIC varied from 0.42 to 0.95 with an
average of 0.74. The RP and MI ranged from (0.83 to 0,57) to (4.0 and 2.76) with an average (2.03 and 0.57) respectively.
The UPGMA clustering revealed two major groups and found considerable amount of genetic diversity. Among the 24
cultivars, Ravikiran, Selection 44, Kundan, Terri, Sonton and Poncho are divergent and may be used for breeding
programme Results suggested that SSRs are highly useful for assessing the genetic diversity analysis among the
chrysanthemum germplasm and parental selection studies in chrysanthemum.
Keywords: Chrysanthemum, molecular charecterization, SSR marker, genetic diversity
INTRODUCTION
hrysanthemum (Dendranthema grandiflorum
syn. Chrysanthemum morifolium) is one of the
most important ornamental crops in the world and it
has been cultivated more than 2000 years (Martin
and Benito, 2005). It is a genus of about 30 species
of herbs and shrubs, which are all perennial
flowering plants in the family Asteraceae or
Compositae. The cultivated chrysanthemum is
originally native of Asia (China and Japan) and
northeastern Europe. It is the second largest cut
flower after rose among the ornamental plants
(Kumar et al., 2006). Several species of
chrysanthemum are ornamental and grown in
gardens for their large, showy, multi colored flowers
(Anon 1950). Now a day, ornamental plants market
demands new cultivars for different characteristics
(Minano et al, 2009). However, the information for
higher flower yield and yield contributing parameters
is limited. Genetic improvement and development of
new varieties in chrysanthemum is very difficult due
to genome complexity, high level of heterozygocity,
occurrence of inbreeding depression, self
incompatibility and high rate of failure of many
crosses. (Wolff and Peter-van Rijn, 1993). In newly
developed varieties, identification and
characterization of cultivars is extremely important
in order to protect the plant breeders right (Kumar, et
al., 2006). It is also interesting particularly in
chrysanthemum where many varieties are unknown.
Therefore, it is necessary to estimate the genetic
variation and mode of inheritance of different plant
parameters in order to select diverse parents for
productive breeding programs and to compliment
traditional breeding efforts in chrysanthemum.
Morphological characterization is labor intensive and
the phenotypic plasticity of plants makes
environment variation a major problem. It is a simple
technique to assess genetic variation in genotypes
under normal growing environment. (Fu et al, 2008
and Condit, 1955). Therefore, molecular markers are
considered as useful tools for identification of
cultivars.
Among the available molecular markers,
microsatellites commonly known as simple sequence
repeats (SSRs) have been widely used due to highly
polymorphic, heterozygous conserved sequences
which can be used as co-dominant markers. ( Rallo et
al., 2000, Cipriani et al., 2002 and Rajora and
Rahman, 2002). The aim of the study was to assess
the genetic diversity among 24 chrysanthemum
cultivars grown in Northern India
MATERIAL AND METHOD
Plant material and field experiment
A total, 24 genetically diverse genotypes of
chrysanthemum were obtained from NBRI,
Lucknow, IARI, New Delhi. (Table 1). Young leaves
were collected from the field of Horticultural
Research Centre (HRC), put into cultivar named
envelopes, and stored in an ice box for transport to
the laboratory. In the laboratory the leaves were
stored at –20°C in a freezer until their DNA was
extracted.
Table 1: Qualitative traits of 24 genotypes of chrysanthemum
S.
No. Genotypes Growth habit Flower colour Disc colour
Type of
Flower
Maturity
group
1 Gaity
Upright and
Medium Pink Yellow Double Mid
C
Page 44
398 DEEKSHA BALIYAN, ANIL SIROHI, DEVI SINGH, MUKESH KUMAR, SUNIL MALIK, AND MANOJ KUMAR SINGH
2 Kundan Upright and Tall Yellow * Double Late
3 Santa Dina Upright and Tall Dark pink Orange Semi Double Mid
4 Selection-69 Spreading and tall Pink Yellow Double Late
5 Selection-44
Spreading and
Dwarf
Bronze with yellow
margin Yellow Semi Double Mid
6
White
Prolific Upright and Tall White Light yellow Double Mid
7 Terry
Upright and
Medium Bronze Yellow Semi Double Early
8 Nanaco Upright and Tall Yellow * Double Early
9 Rangoli Upright and Dwarf Dark pink Yellow Semi Double Mid
10 Kirti
Spreading and
Medium White Yellow Semi Double Early
11 Ravi Kiran Upright and Tall Red with pink margin Dark red Semi Double Mid
12 Sonoton Upright and Tall Dark pink Yellow Single Early
13 Sweeta Upright and Tall Light pink * Double Mid
14 Poncho
Spreading and
Medium Orange Orange Single Mid
15
Basmati
Yellow Upright and Tall Dark Yellow * Double Mid
16 Kamaudi Upright and Tall Mauve * Double Late
17 Delilah
Upright and
Medium Pink Yellow Semi Double Mid
18
Ratlam
Selection Upright and Tall
White with cremish
center * Double Mid
19 SKC-83 Upright and Dwarf Pink Yellow Single Early
20
White
Bouquet
Upright and
Medium
White with cremish
center * Double Early
21
Reagan
Yellow Upright and Tall Pink Yellow Double Mid
22
Mother
Teresa Upright and Dwarf
White with cremish
center Yellow Double Early
23 Birbal Sahni Upright and Tall White * Double Mid
24 Fish Tail
Upright and
Medium White * Double Mid
DNA extraction and SSR analysis
Genomic DNA extraction and further microsatellite
analysis was performed as described earlier (Kumar
et al., 2009). Details of SSR primers used are
provided in Table 3.
Molecular data analysis
Data generated by using 10 microsatellites primers
on 24 chrysanthemum genotypes were scored in
binary format and further analysed as described
previously (Kumar et al., 2009). Besides this, PIC
(polymorphism information content) Botstein et al.
(1980), marker index (MI) (Milbourne et al. 1997)
and Resolving Power (Rp) (Prevost and Wilkinson’s,
1999) were also calculated.
RESULT
The genetic data generated through SSR profiling
among 24 cultivars, a total of 16 bands were detected
using 7 SSR primers, out of which only one was
monomorphic and 15 were polymorphic (Table 2).
Amplification patterns of various SSR primers are
shown in Figure 1. SSR DNA bands varied between
2 (RM447, RM284, RM1, RM152 and RM259) and
3 (RM408 and RM433), with an average of 2.29
bands per primer. The maximum numbers of
polymorphic bands (3 bands) were obtained using
RM408 and RM433 primers (Fig 2a&b). The
average number of polymorphic bands was 2.14 per
primer. In the present study, 93.75% polymorphism
was obtained by SSR assay. PIC value for SSR
ranged from 0.42 (RM408) to 0.95 (RM1, thus
highly polymorphic), with an average of 0.74. The
marker index (MI) ranged from 0.57 (RM 408) to
2.76 (RM433), with average of 1.57. The resolving
power (RP) varied between 0.83 (RM1) and 4
(RM408) with an average value of 2.03.
Page 45
JOURNAL OF PLANT DEVELOPMENT SCIENCES Vol. 6 (3) 399
All the 16 bands, generated from 7 SSR primers,
were subjected to calculate the genetic similarity
index (SSR-GS) among the 24 genotypes. Genetic
similarities were calculated using the Nei-Li
similarity co-efficient. Significant genetic variation
was found among all chrysanthemum genotypes with
the GS value ranging from 0.13 to 0.96 (Table 5). Of
the 24 pair wise combinations generated by
chrysanthemum genotypes, the highest genetic
similarity was found between genotypes Gaity and
Selection-69; and genotypes Sonoton and Sweeta;
while the lowest genetic similarity was observed
between genotype Gaity and genotype Ratlam
Selection. The UPGMA clustering method for
dendrogram construction and cultivar differentiation
indicated that application of SSR assay classified all
the 24 genotypes of chrysanthemum into two main
groups (Group 1 and Group 2) at the coefficient of
GS=0.50 (Figure 1). Group 1 and Group 2 further
divided in to seven clusters, as described under.
Group 1 divided into 2 main clusters (Cluster I and
Cluster II) at the coefficient of GS=0.68. Cluster I
further divided into two sub clusters (Cluster Ia and
Cluster Ib) at the coefficient of GS=0.85. Cluster Ia
included just two genotypes namely, Ratlam
Selection and SKC-83. Cluster Ib included six
genotypes namely, Kamaudi, Delilah, Reagan
Yellow, Mother Teresa, Basanti Yellow and Poncho.
Cluster II divided into two sub clusters (Cluster IIa
and Cluster IIb) at the similarity coefficient of
GS=0.73. Cluster IIa contained only one genotype,
Ravi Kiran. Cluster IIb comprised of six genotypes,
viz., Sonoton, Sweeta, Fish Tail, Kirti, Rangoli and
Nanaco. Group 2 divided into 2 main clusters
(Cluster III and Cluster IV) at the coefficient of
GS=0.62. Cluster III included two genotypes,
Selection-44 and Kundan. Cluster IV divided into 2
sub clusters (Cluster IVa and Cluster IVb) at the
coefficient of GS=0.76. Cluster IVa comprised only
a single genotype, Terry. Cluster IVb included six
genotypes, viz., White Bouquet, Santa Dina, White
Prolific, Birbal Sahni, Selection-69 and Gaity.
Table 2: Analysis of SSR markers.
Components SSR
Total number of Primers used
7
Polymorphic markers
all
Total number of bands amplified
16
Average number of bands per primer
2.29
Maximum number of bands amplified by a single primer
3
Number of polymorphic bands
15
Percentage of polymorphic bands (%)
93.75
Average number of polymorphic bands per primer
2.14
Maximum number of polymorphic bands amplified by a primer
3
PIC
maximum
minimum
average
0.95
0.42
0.74
Marker Index (MI)
maximum
minimum
average
2.76
0.57
1.57
Resolving power (Rp)
maximum
minimum
average
4
0.83
2.03
Size of PCR product
0.4-1.0kbp
Page 46
400 DEEKSHA BALIYAN, ANIL SIROHI, DEVI SINGH, MUKESH KUMAR, SUNIL MALIK, AND MANOJ KUMAR SINGH
Fig. 1: Dendrogram showing clustering of 24 chrysanthemum genotypes constructed using UPGMA based on
Jacquard’s similarity coefficient obtained from SSR analysis.
M 1 2 3 4 5 6 7 8 9 10 11 12 13 14 15 16 17 18 19 20 21 22 23 24
Fig. 2a: SSR profiling pattern of 24 chrysanthemum genotypes with RM408 primer
Fig. 2b: SSR profiling pattern of 24 chrysanthemum genotypes with RM433 primer
M 1 2 3 4 5 6 7 8 9 10 11 12 13 14 15 16 17 18 19 20 21 22 23 24
Page 47
JOURNAL OF PLANT DEVELOPMENT SCIENCES Vol. 6 (3) 401
DISCUSSION
The term SSR (simple sequence repeat markers)
microsatellite was coined by Litt and Luty (1989).
These markers essentially belong to the repetitive
DNA family. Fingerprints generated by the
corresponding primers are also known as
oligonucleotide fingerprints. Microsatellites or short
tandem repeats/simple sequence repeats
(STRs/SSRs) consist of 1 to 6 bp long monomer
sequences which are repeated several times. In the
present study, a total of 16 bands were detected using
07 SSR primers, out of which only one was
monomorphic and 15 were polymorphic (Table 2).
SSR bands varied between 2 (RM447, RM284, RM1,
RM152 and RM259) and 3 (RM408 and RM433),
with an average of 2.29 bands per primer. The
maximum numbers of polymorphic bands (3 bands)
were obtained using RM408 and RM433 primers.
The average number of polymorphic bands was 2.14
per primer thus generated 93.75% polymorphism .
This seems to be relatively high when compared to
the reports of other SSR studies, e.g. in Gerbera
hybrida (Gong and Deng, 2012), Pelargonium
(Becher et.al., 2000). In our study, SSR markers gave
more polymorphism then RAPD markers which has
been earlier used by some workers in
chrysanthemum (Kumar et al., 2006, Baliyan et al,
2014). It might be due to that microsatellite markers
are more informative than RAPD markers.
Therefore, it is highly polymorphic, consistant and
co-dominant markers which provide excellent
markers for clone and cultivar identification in
poplars. (Rehman and Rajora, 2002), (Dayanadan et
al. 1998; Rehman et al. 2000; Rajora and Rehman
2002), as well as in a number of agricultural and
horticultural plants (Becher et al. 2000; Li et al.,
2000). . The primer RM1, was observed to be highly
polymorphic (PIC value of 0.95). The average PIC,
MI and Rp values for SSR primers were 0.74, 1.57
and 2.03 respectively. Depending upon the value of
PIC, MI and Rp, it may be concluded that most of the
SSR primers except RM1 were highly significant in
analysis. Through SSR assay (Fig 1), the 24
chrysanthemum genotypes were divided into seven
clusters. The information on SSR analysis in
chrysanthemum in literature is not available.
Table 3. SSR Primer code, no. of polymorphic alleles, no. of monomorphic alleles & PIC, MI and Rp value of
24 chrysanthemum genotypes
S.No. Primer code Polymorphic
bands
Monomorphic
bands
Diversity
index
PIC
Marker
Index
(MI)
Resolving
Power
(Rp)
1 RM447 2 0 0.73
1.47 2
2 RM284 2 0
0.82
1.64 1.67
3 RM408 2 1
0.42
0.57 4
4 RM433 3 0
0.92
2.76 1.67
5 RM1 2 0
0.95
1.90 0.83
6 RM152 2 0
0.57
1.14 2.08
7 RM259 2 0
0.75
1.50 2
Table 4: List of SSR primers
S.No. Primer
Code
Forward Sequence Reverse Sequence Make
1. RM 447 CCC TTG TGC TGT CTC
CTC TC
AGC GGC TTC TTC TCC TCC
TC
IDT
2. RM 284 ATC TCT GAT ACT CCA
TCC AT
CCT GTA CGT TGA TCC
GAA GC
IDT
3. RM 408 CAA CGA GCT AAC TTC
CGT CC
ACT GCT ACT TGG GTA
GCT GA
IDT
4. RM 433 TGC GCT GAA CTA AAC
ACA GC
AGA CAA ACC TGG CCA
TTC AC
IDT
Page 48
402 DEEKSHA BALIYAN, ANIL SIROHI, DEVI SINGH, MUKESH KUMAR, SUNIL MALIK, AND MANOJ KUMAR SINGH
5. RM 1 ‘GCA AAA ACA CAA TGA
AAA AA’
GCG TTG GTT GAC CTG AC’ IDT
6. RM 152 GAA ACC ACC ACA CCT
CAC CG
CCG TAT ACC TTC TTG
AAG TA
IDT
7. RM 259 TGG AGT TTG AGA GGA
GGG
CTT GTT GCA TGG TGC
CAT GT
IDT
Table 5: Similarity matrix generated by Jaccard’s similarity coefficient for 24 genotypes of chrysanthemum
obtained from SSR analysis.
C1 C2 C3 C4 C5 C6 C7 C8 C9 C10 C11 C12 C13 C14 C15 C16 C17 C18 C19 C20 C21 C22 C23 C24
C1 1
C2 0.56 1
C3 0.88 0.69 1
C4 0.96 0.63 0.81 1
C5 1 0.56 0.88 0.84 1
C6 0.69 0.75 0.81 0.63 0.69 1
C7 0.88 0.56 0.75 0.84 0.88 0.56 1
C8 0.75 0.69 0.88 0.81 0.75 0.69 0.88 1
C9 0.75 0.44 0.63 0.81 0.75 0.44 0.88 0.75 1
C10 0.63 0.19 0.5 0.56 0.63 0.44 0.5 0.38 0.62 1
C11 0.56 0.43 0.44 0.5 0.56 0.38 0.56 0.44 0.69 0.91 1
C12 0.63 0.19 0.5 0.56 0.63 0.31 0.63 0.5 0.75 0.88 0.84 1
C13 0.5 0.44 0.63 0.44 0.5 0.56 0.5 0.63 0.5 0.62 0.69 0.96 1
C14 0.69 0.25 0.56 0.63 0.69 0.38 0.69 0.56 0.69 0.81 0.88 0.84 0.81 1
C15 0.56 0.38 0.44 0.5 0.56 0.25 0.56 0.44 0.56 0.69 0.75 0.81 0.69 0.88 1
C16 0.69 0.25 0.56 0.63 0.69 0.38 0.69 0.56 0.69 0.81 0.88 0.93 0.81 1 0.88 1
C17 0.63 0.19 0.5 0.56 0.63 0.31 0.62 0.5 0.75 0.75 0.81 0.88 0.62 0.81 0.69 0.81 1
C18 0.13 0.44 0.5 0.31 0.38 0.31 0.38 0.5 0.5 0.5 0.56 0.62 0.62 0.56 0.69 0.56 0.75 1
C19 0.16 0.31 0.63 0.44 0.5 0.44 0.5 0.62 0.62 0.62 0.69 0.75 0.75 0.69 0.56 0.69 0.88 0.88 1
C20 0.5 0.31 0.63 0.44 0.5 0.44 0.5 0.62 0.62 0.62 0.69 0.75 0.75 0.69 0.56 0.69 0.88 0.88 1 1
C21 0.5 0.31 0.63 0.44 0.5 0.44 0.5 0.62 0.62 0.62 0.69 0.75 0.75 0.69 0.56 0.69 0.88 0.88 1 1 1
C22 0.38 0.44 0.5 0.31 0.38 0.31 0.38 0.5 0.5 0.5 0.56 0.62 0.62 0.56 0.69 0.56 0.75 1 0.88 0.88 0.88 1
C23 0.5 0.31 0.63 0.44 0.5 0.44 0.5 0.62 0.62 0.62 0.69 0.75 0.75 0.69 0.56 0.69 0.88 0.88 1 1 1 0.88 1
C24 0.5 0.31 0.63 0.44 0.5 0.44 0.5 0.62 0.62 0.62 0.69 0.75 0.75 0.69 0.56 0.69 0.88 0.88 1 1 1 0.88 1 1
CONCLUSION
In the present study, SSR-based analysis provided
good insight of genetic diversity. On the other hand,
SSR data, UPGMA analysis clearly separated the
genotypes into distinct groups. Therefore, the present
study suggested that microsatellite markers should be
used in order to achieve a reliable evaluation and
robust characterization of chrysanthemum
germplasm. Present study showed that some
genotypes like SKC-83, Ratlam Selection, Gaity, and
Selection-69 were more diverse than others and these
genotypes could be a good alternative source for
fruitful chrysanthemum breeding program.
REFERENCES
Anon (1950) The wealth of India, Raw Materials,
CSIR, New Delhi. 2, 143-148.
Becher, S.A.; Steinmetz, K.; Weising, K.; Boury,
S.; Peltier, D.; Renou, J.P.; Kahl, G.; and K.
Wolff (2000). Microsatellit for cultivar
indentification in Pelargonium. Theor. Appl. Genet.
101:643-651
Botstein D, White RL, Skolnick M, Davis RW (1980) Construction of genetic linkage map in man
using restriction fragment length polymorphisms.
Am J Hum Genet 32, 314–331.
Baliyan, D., Sirohi, A. Kumar, M., Kumar V.,
Sharma, S. and Sharma, S (2014) Comparative
genetic diversity analysis in chrysanthemum: A pilot
study based on morpho-agronomic traits and ISSR
markers. Scientia Hort. 167: 164-168
Cipriani, G., Marrazzo, MT, Marconi, R.,
Cimato, A and Testolin, R (2002) Microsatellite
markers isolated in olive are suitable for individual
fingerprinting and reveal polymorphism within
ancient cultivars (Olea europaea L.). Theor. Appl.
Genet. 104: 223-228
Page 49
JOURNAL OF PLANT DEVELOPMENT SCIENCES Vol. 6 (3) 403
Condit, I.J. (1955). Fig varieties: a monograph.
Hilgardia Berkeley 23, 323–538.
Dayanandan, S.; Rajora, O.P. and K. S. Bawa (1998). Isolation and characterization of
microsatellite in trembling aspen (Populus
tremuliodes). Theor. Appl. Genet. 96: 950-956
Fu, X.P., Ning, G.G., Gao, L.P., Bao, M.Z., (2008).
Genetic diversity of Dianthus accessions as assessed
using two molecular marker systems (SRAPs and
ISSRs) and morphological traits. Sci. Hortic. 117,
63–270
Gong, L and Deng, Z. (2012). Selection and
application of SSR markers for variety
discrimination, genetic similarity and relation
analysis in gerbera (Gerbera hybrid). Scientia Hort.
138: 120-127
Kumar, S, Prasad, K.V. and Choudhary, M.L. (2006). Detection of genetic variability among
chrysanthemum radiomutants using RAPD markers.
Current Science 90(8): 1108-1113
Kumar V, Sharma S, Sharma AK, Sharma S,
Bhat KV (2009). Comparative analysis of diversity
based on morpho-agronomic traits and microsatellite
markers in common bean. Euphytica 170: 249-262.
Li, C.D.; Rossnazel, B.G. and G.J. Scoles (2000).
The Development of oat microsatellite markers and
their use in identifying relationship among Avena
species and oat cultivars. Theor. Appl Genet.
101:1259-68
Litt, M. and Luty, J. A. (1989). A hypervariable
microsatellite revealed by in vitro amplification of a
dinucleotide repeat within the cardic muscle actin
gene. Am J Hum Genet. 44: 397-401.
Martin, C and Benito M.E.G. (2005) Survival and
genetic stability of Dendranthema grandiflora Tzelev
shoot apices after cryopreservation by vitrification
and encapsulation-dehydration. Cryobiology 51:281-
289
Milbourne, D., Meyer, R., Bradshaw, J. E., Baird,
E., Bonar, N., Provan, J., Powell, W. and Waugh,
R. (1997). Comparison of PCR-based marker
systems for the analysis of genetic relationships in
cultivated potato. Mol. Breeding. 3(2): 127-136.
Minano, H.S., Gonzalez-Benito. M.E. and Martin,
C (2009) Molecular characterization and analysis of
somaclonal variation in chrysanthemum cultivars
using RAPD markers. Scientia Hort. 122: 238-243
Prevost A, Wilkinson M (1999). A new system of
comparing PCR primers applied to ISSR
fingerprinting of potato cultivars Theor. Appl. Genet.
98: 107-112.
Rahman, M. H. Dayanandan, S. and O.P. Rajora (2000). Microsatellite DNA Markers in Populus
tremuloides. Genome 43:293-297.
Rahman, M.H. and O.P. Rajora (2002).
Microsatellite DNA fingerprinting differentiation and
genetic relationship of clones, cultivars and varieties
of six poplar species from three sections of the genus
Populus. Genome 45:1083-1094.
Rallo, P., Dorado, G. and Martin A (2000)
Development of single sequence repeats (SSRs) in
olive tree ( Olea europaea L.). Theor. Appl. Genet.
101: 984-989
Rajora, O.P. and M.H. Rahman (2002).
Microsatellite DNA and RAPD finger printing,
identification and genetic relationship of hybrid
poplar (Populus x Canadensis) cultivars. Theor.
Appl. Genet 106(3): 470-477
Wolff, K. and Rijn, J.P. (1993) Rapid detection of
genetic variability in chrysanthemum
(Dendranthema grandiflora. Tzvelev) using random
primers. Heredity. 71: 335-341.
Wolff, K., Schoen, E.D. and Rijn, J.P. (1993b)
Optimizing the generation of random amplified
polymorphic DNAs in chrysanthemum. Theor. Appl.
Gent. 86: 1033-1037.
Page 50
404 DEEKSHA BALIYAN, ANIL SIROHI, DEVI SINGH, MUKESH KUMAR, SUNIL MALIK, AND MANOJ KUMAR SINGH
Page 51
________________________________________________ Journal of Plant Development Sciences Vol. 6 (3) : 405-411. 2014
PHENOLOGICAL BEHAVIOUR OF SELECTED TREE SPECIES IN TROPICAL
DECIDUOUS FOREST OF HASTINAPUR REGION IN WESTERN U.P.
Narendra Pal Singh*, R.C. Arya, Narendra Pratap Singh and Vinay Pratap Singh
*Department of Botany, Meerut College, Meerut (U.P.) Abstract : Vegetative and reproductive phenology of 20 selected tree species in tropical deciduous forest of Hastinapur
region in western U.P. was monitored through fortnightly visit during November 2009 to December 2011 revealed that there
exists a strong seasonality for leaf flush, leaf fall, flowering and fruiting phenophases. A considerable variation was found in
leaf flushing, leaf fall, flowering and fruiting behaviour that could be partly attributed to biotic and abiotic factors. Peak
activity of leaf fall and leaf emergence that occurred in the early dry period, could be to take full advantage of the first rainy
season for vegetative growth and reproduction. Interphenophases duration between phenological events varied for different
selected dominant tree species. The fruiting phenology follows closely the flowering phenology. The duration of maturation
of leaves was the shortest, while that of fruit ripening was the longest.
Keywords: Hastinapur, phenology, tree species, tropical deciduous forest, etc.
INTRODUCTION
henology is the study of the timing of recurring
biological events, among phases of the plant
species, which provide a background for collecting
and synthesizing detailed quantitative information on
rhythms of plant communities. Tropical plants with
their high level of species diversity display
phenological events such as leaf drop, leaf flush,
flowering and fruiting, etc. in relation to time and
space. (Singh and Singh, 1992). Phenology patterns
are most diverse and least understood. Studies from
different parts of world have shown that climatic
factors are mainly responsible for vegetative and
reproductive phenology at both community and
species level. Phenology of the tropical forest tree
species is not well understood, although water stress
is most frequently cited as a primary factor
responsible for the timing of phenological events
(Singh and Singh, 1992). However, various
phenological events are triggered by rainfall, water
availability, temperature, photoperiod, duration of
dry spell and change in day length. The composition
of tree species, their periodic straightification, and
life span are some important analytic aspects of a
plant community. Plant phenology has great
significance because it not only provides knowledge
of plant growth pattern and development as well as
the effects of environment and selective pressure on
flowering and fruiting behaviour (Zhang et al.,
2006). Plant phenology are the result of interaction of
biotic and abiotic factors over evolutionary time and
through natural selection, the biotic and abiotic
factors have entrained rhythemicity in plant life that
results in appropriate of flowering, fruiting and leaf
flushing and efficient growth and reproduction ( Van
Schaik et al.,1993).
The forests of Hastinapur, Meerut district of Uttar
Pradesh west are facing various biotic, abiotic and
anthropogenic pressures. Considering all the
associated problems, it was found necessary to study
the forest resources of Hastinapur, which not only
protect the environment but also provide the basic
needs of community residing in nearby areas, but the
recent growing demand of growing population and
tourism activities in this area has created various
disturbances in the existing forest resulting in loss of
phytodiversity and other natural resources thereby
affecting the phenology of plants.
Objectives: The study describes the phenological
patterns of the dominant tree species in tropical
deciduous forest of Hastinapur region. Parameters
considered for analysis of phenology are production
of young leaves, maturation of leaves, abscission of
leaves, production of young flowers, maturation of
flowers (Anthesis), abscission of flowers, production
of young fruits, maturation of fruits, ripening of
fruits.
MATERIAL AND METHOD
Study Area: The study site is located at 36.4 km
north east to Meerut (Western Uttar Pradesh). It lies
at 29.17 °N, 78.02 °E longitudes. Hastinapur forest
region is of dry thorn type. The species forming the
scrub vegetation are Zizyphus xylopyra, Zizyphus
mauritiana, Butea monosperma, Prosopis juliflora
etc. as far as the structure and function of these forest
are concerned. The elevation of Hastinapur is
roughly 205 meters above the sea level. The
temperature ranges from 35° C to 43° C in summers
while remain between 20° C and 30° during winters.
There are three different major seasons in
Hastinapur, Meerut: summer season (April to mid
June), winter season (November to February) and
monsoon season (June to September). October-
March constitute the transition month, between the
monsoon and winter season and between the winters
and summer seasons. Annual average rainfall is
145mm. About 85% of the total rainfall is observed
during the rainy seasons (south- west monsoon). The
soil of the forest contains sand, silt and clay in
different proportions. The soils of the forest were
alkaline in nature. The vegetation is at its zenith
during the monsoon season because of high humidity
and moderate temperature. The forest of study site is
P
Page 52
406 NARENDRA PAL SINGH, R.C. ARYA, NARENDRA PRATAP SINGH AND VINAY PRATAP SINGH
suffering from various disturbances such as grazing,
burning and cutting etc.
Methodology: Three sites were selected for
phenological study. All the individual of selected tree
species with a girth of 31cm and above were marked
with a metal tag. Each site was visited once a
fortnight from November, 2009 to December, 2011
to record the change for the 9 phenological events
namely production of young leaves (YL), maturation
of leaves (ML), abscission of leaves (AL),
production of young flowers (YF1), maturation
(anthesis) of flowers (MF1), abscission of flowers
(AF1), production of young fruits (YFr), maturation
of fruits (MFr) and ripening of fruits (RFr).
During the fortnightly visits, marked individual were
qualitatively characterized for these 9 phenological
events (Prasad and Hegde, 1986) and phenostage of
each species was determined by considering the
status of majority of individuals. In the case of
species represented by only a few individuals, those
present in nearby areas were observed to confirm the
phenological status of that species. For each selected
dominant tree species, majority of individuals
observed phenophages event on a sampling date was
recorded. The duration of phenological events in a
species was computed by obtaining the number of
days required for the completion of an event from the
date of the fortnightly visit when the event was first
observed. For each species, interphenophase
duration, i.e. period between successive phenological
events, were then obtained.
Table-2.5: Tree species, vegetation type (VT) and interphenophase duration (days).
S.N. Tree Species VT Interphenophase duration (days)
YL-
ML
ML-
AL
YF1-
MF1
MF1-
AF1
YFr-
MFr
MFr-
RFr
1 Acacia nilotica D 29 278 29 28 58 153
2 Acacia farnesiana D 30 283 31 27 49 151
3 Acacia catechu D 34 267 34 30 47 161
4 Ailanthus excelsa D 33 279 35 30 30 43
5 Albizia lebbeck D 29 278 27 22 179 61
6 Bauhinia purpurea SE 31 301 20 22 59 89
7 Butea monosperma D 30 285 23 25 30 80
8 Bauhinia racemosa D 32 287 27 29 37 67
9 Bauhinia variegata D 29 285 28 27 41 69
10 Cassia fistula D 25 268 29 26 136 125
11 Dalbergia sissoo D 30 289 19 21 38 48
12 Diospyros cordifolia D 20 296 23 24 61 38
13 Eucalyptus globulus E - - 29 28 36 41
14 Prosopis juliflora D 24 298 29 26 36 79
15 Pongamia pinnata E - - 20 26 72 68
16 Phoenix sylvestris E - - 18 46 129 117
17 Pithecelobium dulce D 25 283 22 29 75 51
18 Tectona grandis D 29 281 29 34 62 65
19 Heterophragma
adenophyllum
D 34 302 35 75 31 73
20 Zizyphus xylopyra D 38 282 25 23 125 116
Page 53
JOURNAL OF PLANT DEVELOPMENT SCIENCES Vol. 6 (3) 407
Figure-2.1: Monthly Average Rainfall and Dew Point Time Series of Meerut.
Figure-2.2: Monthly Average Time Series of Temperature.
Page 54
408 NARENDRA PAL SINGH, R.C. ARYA, NARENDRA PRATAP SINGH AND VINAY PRATAP SINGH
Figure-2.3 (a & b): Variation in different interphenophases of dominant tree species.
RESULT AND DISCUSSION
Leaflessness or leaf shading nature (deciduousness)
in trees is ill defined; the precise quantification of
leaflessness has been least attempted and no
convenient categorisation is available (Kushwaha
and Singh, 2005). Currently the terminology used to
describe phenological functional types lacks
uniformity. In most phenological studies,
terminology varies with the investigator and the
climatic conditions of the habitat studied (Singh and
Kushwaha, 2005).
In present study, on the basis of leaf shading nature
we categorized 16 tree species namely Acacia
nilotica, Acacia farnesiana, Acacia catechu,
Ailanthus excelsa, Albizia lebbeck, Butea
monosperma, Bauhinia racemosa, Bauhinia
variegata, Cassia fistula, Dalbergia sissoo,
Diospyros cordifolia, Prosopis juliflora,
Pithecelobium dulce, Tectona grandis,
Heterophragma adenophyllum and Zizyphus
xylopyra as deciduous species, three tree species
namely Eucalyptus globulus, Pongamia pinnata,
Phoenix sylvestris as evergreen and one namely
Bauhinia purpurea as semi- evergreen species
(Table-2.1).
Foliage phenology: In the present study, we
observed that leaves emerge and mature during the
period with minimal rainfall, high temperature and
increasing day length in all three sites and leaves
abscission occurs when the temperature begins to
decrease and day length is short. The duration of leaf
maturation varied from 20 days (Diospyros
cordifolia) to 38 days (Zizyphus xylopyra). The
period between maturation and abscission of leaves
ranged from 267 days (Acacia catechu) to 302 days
(Heterophragma adenophyllum) (Table-2.1).
Leaf Initiation: Leaf flushing was also a periodic
phenomenon in all the selected 20 dominant tree
species with considerable variation. Among 20
species observed, 11 species namely Acacia nilotica,
Acacia farnesiana, Ailanthus excelsa, Albizia
lebbeck, Butea monosperma, Bauhinia racemosa,
Bauhinia variegata, Dalbergia sissoo, Prosopis
juliflora, Pithecelobium dulce and Heterophragma
adenophyllum leaf initiation started in March, two
species namely Cassia fistula and Zizyphus xylopyra
leaf initiation started in June, two species namely
Diospyros cordifolia and Tectona grandis leaf
initiation started in February whereas in Acacia
catechu in April and Bauhinia purpurea in January.
There was a complete absence of leaf flushing in
most of the selected tree species from September to
January except Bauhinia purpurea (semi- evergreen)
which showed leaf initiation in January.
Leaf Flush Duration: Single episodic of leaf flush
and leaf fall occurred in all selected deciduous tree
species during the annual cycle. Wide diversity
existed among the species in terms of duration of leaf
flush. 11 species (Acacia nilotica, Acacia farnesiana,
Ailanthus excelsa, Albizia lebbeck, Butea
monosperma, Bauhinia racemosa, Bauhinia
variegata, Dalbergia sissoo, Prosopis juliflora,
Pithecelobium dulce and Heterophragma
adenophyllum) produced new leaves through March-
April, two species (Cassia fistula and Zizyphus
Page 55
JOURNAL OF PLANT DEVELOPMENT SCIENCES Vol. 6 (3) 409
xylopyra) produced new leaves through June- August
and two species (Diospyros cordifolia and Tectona
grandis) produced new leaves through February-
April. Bauhinia purpurea (semi- evergreen)
produced new leaves through January- February. It
was also observed that a few individual of each
species continued to leaf flush in later month also.
The three evergreen tree species (Eucalyptus
globulus, Pongamia pinnata and Phoenix sylvestris)
showed leaves exchanging. These tree species
exchanged leaves because leaf- flushing usually
occurs shortly before or immediately after the
completion of leaf shading during the early or mid
dry season.
Leaf fall: Leaf fall initiation was a periodic activity
in all selected dominant tree species; the onset of leaf
fall initiation was different in all selected tree
species. In mostly selected tree species leaf shading
began in late October with peak in November and
December. Many deciduous tree species were
leafless in February, whereas a few of them were
almost leafless in March for a short duration.
However three evergreen tree species (Eucalyptus
globulus, Pongamia pinnata and Phoenix sylvestris)
showed no concentrated leaf fall during the study
period.
The reason behind the emergence and maturation of
leaves in dry season could be due to increased
daylength, rise of temperature and change in
photoperiod which favours to maximise the
photosynthesis and vegetative growth ( Kushwaha
and Singh, 2005; Bajpai et al., 2012; Thakur et al.,
2013). Seasonal changes in photoperiod and
thermoperiod are generally coupled and their joint
action may control growth rhythm of trees. The
summer flushing enables tree species to activate
canopy development before the monsoon rainfall
begins and to make maximum use of short rainy
season for productivity. Increasing photoperiod along
with rising temperature may cause starch to sugar
conversion in roots and stems and osmotic
adjustment in bud tissues of the summer flushing
tree; this may induce bud break through increased
water absorption and availability of sugar (Borchert,
1994). Osmotic adjustment in fine roots may also
have a role in increased water absorption from the
soil during the dry season, helping rehydration of
stem. The role of photoperiod has also been
confirmed by Rivera et al., (2002) who reported that
spring flushing in tropical semi deciduous trees is
induced by an increase in photoperiod of 30 minutes
or less. They further suggested that production of
new foliage shortly before the rainy season is likely
to optimise the synthetic gain in tropical forests with
relatively short growing season. This was also
supported by Elliot et al., (2006) and Kushwaha and
Singh, (2005).
The leaf fall was concentrated in cool and dry winter
months i.e. from October to February. Prasad and
Hegde, (1986) observed a similar pattern of leaf fall
in tropical deciduous forest in Bandipur Tiger
Reserve, Southern Indian region. Raich and Borchert,
(1982) suggested that leaf fall during the dry season
was directly influenced by the decline in soil
moisture and increase in water stress condition. The
result was also in conformity with Singh and Singh,
(1992) who reported that initiation of leaf fall
coincides with the onset of the post monsoon low
temperature dry period and can be a mechanism
maintaining turgidity of shoots. In the present study,
marked asynchrony occurred in selected tree species
with respect to leaf flush completion, initiation and
completion of leaf fall and the extent of leafless
period. The wide difference in duration of leaf flush
and timing of leaf fall observed amongst tree
functional groups, exposed to same regime of
climatic conditions, may be caused by the variation
among the components of the soil- plant- atmosphere
continuum that determine tree water status. The
variation in the onset of monsoon, amount and
distribution of rainfall during the annual cycle may
affects the factors regulating the soil- plant-
atmospheric water continuum, resulting in change in
asynchrony/synchrony (Kushwaha and Singh, 2005).
Borchert, (1994) hypothesized that in the dry forest,
within species asynchrony in trees is guided by
differences in water availability and hence tree water
is likely to cause the observed variation in
phenology. Global climate change may force
variation in timing, duration and synchronisation of
phenological events (e.g. date of initiation and
completion of leaf flush, leaf fall and leafless period)
in the tropical forests (Raich, 1995). Although
progress has been made in understanding the drivers
of leaf phenology at the molecular level (Yoshida,
2003), a picture of leaf onset and senescence
mechanisms is only beginning to emerge.
Reproductive Phenology: We have selected and
observed 20 selected tree species in 3 different sites
of Hastinapur, Meerut during the study. All the tree
individual of each selected species showed high
variability in production of flowers and fruits in
terms of quantity and frequency.
Flowering Activity: Flowering continued in
different selected tree species throughout the year.
However , two peak period of flowering were
distinguished; the first peak in the month of March
and April when Acacia nilotica, Acacia farnesiana,
Acacia catechu, Ailanthus excelsa, Albizia lebbeck,
Butea monosperma, Bauhinia racemosa, Bauhinia
veriegata, Cassia fistula, Dalbergia sissoo,
Diospyros cordifolia, Prosopis juliflora,
Pithecelobium dulce and Zizyphus xylopyra exhibited
initiation in response to increasing length of
photoperiod. The second peak of flowering was
observed in November when Acacia farnesiana,
Albizia lebbeck, Bauhinia purpurea and
Heterophragma adenophyllum produced flower.
Acacia nilotica and Acacia farnesiana and Albizia
lebbeck showed two peaks in flowering. They
Page 56
410 NARENDRA PAL SINGH, R.C. ARYA, NARENDRA PRATAP SINGH AND VINAY PRATAP SINGH
showed first in April but Acacia farnesiana and
Albizia lebbeck showed second peak in November
while Acacia nilotica in September. The duration of
flower maturation and abscission varied in different
selected species. The duration of flower maturation
varied from 18 days (Phoenix sylvestris) to 35 days
(Ailanthus excelsa and Heterophragma
adenophyllum). The period between maturation and
abscission of flower ranged from 21 days (Dalbergia
sissoo) to 75 days (Heterophragma adenophyllum)
(Table-2.1)
Fruiting Activity: In the present study of Hastinapur
forest sites, most tree species (Acacia nilotica,
Acacia farnesiana, Acacia catechu, Ailanthus
excelsa, Albizia lebbeck, Butea monosperma,
Bauhinia racemosa, Bauhinia veriegata, Dalbergia
sissoo, Diospyros cordifolia, Eucalyptus globulus,
Prosopis juliflora, Pongamia pinnata, Pithecelobium
dulce) peak fruit ripening activity in monsoon period.
But in some species (Cassia fistula, Phoenix
sylvestris, Tectona grandis, Heterophragma
adenophyllum and Zizyphus xylopyra) fruit ripening
begins in post monsoon period and continues up to
the end of cool and dry winter period, that may be
due to the difference in fruit maturation activity of
different species as reported for sub- tropical forests
in North- Eastern India (Kikim and Yadav, 2001).
Fruit maturation and abscission period varied in
different selected tree species. In the case of fruit, the
duration of maturation varied from 30 days
(Ailanthus excelsa and Butea monosperma) to 179
days (Albizia lebbeck). The period between
maturation and abscission of fruits ranged from 41
days (Eucalyptus globulus) to 161 days (Acacia
catechu). During the study it is observed that the
fruiting phenology follows closely the flowering
phenology most of the tree species. Interphenophase
duration between different phenological events
varied for different species. It was shortest for
maturation of leaves and longest for ripening of fruits
(Table-2.1).
Trees are highly variable among the individual in the
quantity of flowers and fruits produced, and even the
frequency of reproduction (Bullock, 1982; Sarukhan
et al., 1984). Vegetative and reproductive
developments are strongly interrelated in all plants,
but in trees these relationships are considerably more
complex than in herbaceous plants because of the
structural complexity of the shoot system. In contrast
to herbaceous plants, flower development in many
trees is not continuous from flower induction to
anthesis, but may become temporarily arrested at
some intermediate stage. Final development of
flower buds and anthesis will occur many months
after flower initiation. This functionally important
distinction has not been adequately considered in
many discussions of flowering in tree (Borchert,
1983). At present, available evidence suggests that
carbohydrate levels as well as the balance between
plant growth regulators in vegetative buds are
involved in the control of flower induction (Zeevaart,
1976). The combination of all biotic and abiotic
factors establishing conditions favorable for flower
initiation and development varies with the species-
specific position of the inflorescence within a tree's
branch system and with the seasonal pattern of
vegetative and reproductive growth. Like all other
aspects of tree development, the phenology of
flowering is determined partly by genetic, partly by
environmental factor (Borchert, 1983). Various
physiologically active sites or sinks (e.g. leaf buds
and leaves, flower buds and flowers, and fruit) may
compete for water, nutrients and metabolites
(Lieberman, 1982), and such internal competition
may lead to the partitioning in time of plant functions
like leafing and flowering. Tropical dry region trees
exhibit considerable diversity in seasonal water
relation (Borchert et al., 2005). Interaction between
water availability, tree structure and ecophysiological
characteristics leads to varying phenological patterns.
Selected deciduous tree species (including Bauhinia
purpurea, a semi- evergreen species) present in the
study sites exhibited four basic patterns of flowering
in relation to leaf flushing as described by Kikim and
Yadav, (2001); (a) Flowering before leaf flushing in
Butea monosperma, Cassia fistula and Zizyphus
xylopyra. (b) Simultaneous flowering and leaf
flushing in Prosopis juliflora, (c) Flowering soon
after leaf flushing in Bauhinia racemosa, Bauhinia
veriegata, Dalbergia sissoo, (d) Flowering long after
leaf flushing in Acacia nilotica, Acacia farnesiana,
Acacia catechu, Ailanthus excelsa, Albizia lebbeck,
Bauhinia purpurea, Diospyros cordifolia Tectona
grandis and Heterophragma adenophyllum.
However, Singh and Kushwaha (2006) recognized
five flowering types in 119 tropical tree species.
In several species initiation of fruit ripening begins in
post-monsoon period and continues up to the end of
cool and dry winter period that may be due to the
difference in fruit maturation activity of different
species as reported for sub-tropical forests in north-
eastern India (Kikim and Yadava 2001). In our study,
some tree species (Cassia fistula, Tectona grandis,
Heterophragma adenophyllum and Zizyphus
xylopyra) fruit ripening begins in post monsoon
period and continues up to the end of cool and dry
winter period. Thus fruit dehiscence of tree species
coincides with the onset of monsoon to allow optimal
germination (Singh and Singh, 1992; Singh and
Kushwaha, 2006). The pattern of fruiting activity
maintains the availability of fruits to herbivores
throughout the year. In the present study the edible
fruits of Acacia nilotica, Acacia farnesiana, Acacia
catechu, Ailanthus excelsa, Cassia fistula and
Zizyphus xylopyra are available in winter season
whereas those of Bauhinia purpurea, Butea
monosperma, Dalbergia sissoo and Diospyros
cordifolia are available in summer season to the wild
animals.
Page 57
JOURNAL OF PLANT DEVELOPMENT SCIENCES Vol. 6 (3) 411
REFERENCES
Bajpai, O., Kumar, A., Mishra, A. K., Sahu, N.,
Behera, S. K., & Chaudhary, L. B. (2012).
Phenological Study of Two Dominant Tree
Species in Tropical Moist Deciduous Forest from the
Northern India. International Journal of Botany,
8(2), 66-72.
Borchert, R. (1983). Phenology and control of
flowering in tropical trees. Biotropica, 81-89.
Borchert, R. (1994). Induction of rehydration and
bud break by irrigation or rain in deciduous trees of
a tropical dry forest in Costa Rica. Trees, 8(4), 198-
204.
Borchert, R., Renner, S. S., Calle, Z., Navarrete,
D., Tye, A., Gautier, L., & von Hildebrand, P. (2005). Photoperiodic induction of synchronous
flowering near the Equator. Nature, 433(7026), 627-
629.
Bullock, S. H. (1982). Population structure and
reproduction in the neotropical dioecious tree
Compsoneura sprucei. Oecologia, 55(2), 238-242.
Elliott, S., Baker, P. J., & Borchert, R. (2006).
Leaf flushing during the dry season: the paradox
of Asian monsoon forests. Global Ecology
and Biogeography, 15(3), 248-257.
Kikim, A., & Yadava, P. S. (2001). Phenology of
tree species in subtropical forests of Manipur
in north eastern India. Tropical Ecology,
42(2), 269-276.
Kushwaha, C. P., & Singh, K. P. (2005). Diversity
of leaf phenology in a tropical deciduous forest in
India. Journal of Tropical Ecology, 21(1), 47-56.
Lieberman, D. (1982). Seasonality and phenology in
a dry tropical forest in Ghana. The Journal of
Ecology, 70, 791-806.
Prasad, S. N., & Hegde, M. (1986). Phenology and
seasonality in the tropical deciduous forest of
Bandipur, South India. Proceedings: Plant
Sciences, 96(2), 121-133.
Reich, P. B., & Borchert, R. (1982). Phenology and
ecophysiology of the tropical tree, Tabebuia
neochrysantha (Bignoniaceae). Ecology,
294-299.
Reich, P. B. (1995). Phenology of tropical forests:
patterns, causes, and consequences. Canadian
Journal of Botany, 73(2), 164-174.
Rivera, G., Elliott, S., Caldas, L. S., Nicolossi, G.,
Coradin, V. T., & Borchert, R. (2002).
Increasing day-length induces spring
flushing of tropical dry forest trees in the absence of
rain. Trees, 16(7), 445-456.
Sarukhan, J., Martinez-Ramos, M., & Pinero, D. (1984). Analysis of demographic variability at
the individual level and its population
consequences. Perspectives on plant population
ecology/edited by Rodolfo Dirzo and Jose
Sarukhan.
Singh, J. S., & Singh, V. K. (1992). Phenology of
seasonally dry tropical forest. Current science,
63(11), 684-689.
Singh, K. P., & Kushwaha, C. P. (2005). Paradox
of leaf phenology: Shorea robusta is a semi
evergreen species in tropical dry deciduous.
Current Science, 88(11).
Singh, K. P., & Kushwaha, C. P. (2006). Diversity
of flowering and fruiting phenology of trees in a
tropical deciduous forest in India. Annals of Botany,
97(2), 265-276.
Thakur, M., Santvan, V.K., Nigam, A. (2013).
Phenological investigation of tree species of
Darlaghat wildlife sanctuary, Solan (H. P.),
Asian journal of experimental of experimental
biological sciences, 4(3), 455-460.
Van Schaik, C. P., Terborgh, J. W., & Wright, S.
J. (1993). The phenology of tropical forests: adaptive
significance and consequences for primary
consumers. Annual Review of Ecology and
Systematics, 353-377.
Yoshida, S. (2003). Molecular regulation of leaf
senescence. Current opinion in plant biology,
6(1), 79-84.
Zeevaart, J.A (1976). Physiology of flower
formation. Annual Review of Plant Physiology,
27(1), 321-348.
Zhang, G., Song, Q., & Yang, D. (2006). Phenology
of Ficus racemosa in Xishuangbanna,
Southwest China. Biotropica, 38(3), 334-
341.
Page 58
412 NARENDRA PAL SINGH, R.C. ARYA, NARENDRA PRATAP SINGH AND VINAY PRATAP SINGH
Page 59
________________________________________________ Journal of Plant Development Sciences Vol. 6 (3) : 413-416. 2014
EFFECT OF ZINC AND IRON APPLICATION ON YIELD AND ACQUISITION OF
NUTRIENT ON MUSTARD CROP (BRASSICA JUNCIA L.)
Anuj Kumar, Satendra Kumar, Pradeep Kumar* and Pramod Kumar
Department of Soil Science, College of Agriculture Sardar Vallabhbahi Patel University of
Agriculture and Technology, Meerut 250 110
*Email : [email protected]
Abstract: The field experiment was conducted on Pusa Bold variety of Mustard with 10 treatments in RBD in rabi season-
2009-10 at Crop Research Centre of, Sardar Vallabhbhai Patel University of Agriculture and Technology; Meerut (U.P).
Maximum primary branches (11.05), secondary branches (31.33), Siliqua per plant (545.35), number of seed per Siliqua
(13.55), seed weight per plant 30.38 g and test weight (1000 seed weight, 6.50 g) were recorded, the biological yield was
observed highest (114.80 q ha-1) and the grain yield was also (23.40 q ha-1) in T9{100 per cent NPK (RDF) + Zn @ 25 Kg
ha-1 (B) + Fe @ 25 Kg ha-1 (B)}. The maximum Stover yield noticed 91.40 q ha-1 as compared to T1 (control) (40.82 q ha-1.),
highest total nitrogen uptake by mustard crop, recorded 97.87 kg/ha, in case of phosphorus and potassium uptake by mustard
crop was also observed 21.82 kg/ha and 152.82 kg/ha , respectively. The all over present investigation shows that the
maximum yield attributes was found when zinc and iron was applied basal with recommended dose of fertilizers.
Keywords: Mustard, micronutrient, uptake Kg ha-1
INTRODUCTION
ndia is one of the leading oil seed producing
country in the world. Rapeseed and mustard are
the main oil seed crops grown in rabi season in India.
Oil seeds the second largest agricultural commodity
after cereals in India. Its production was 7.20 tonnes
from 6.3 m ha mainly confined with the states viz.,
Rajasthan, Uttar Pradesh, Haryana, Madhya Pradesh,
Gujarat, West Bengal, Assam, Bihar, and Punjab.
Among the states, Uttar Pradesh alone produces
about 13.78 per cent of total mustard production
from 14.03 per cent area, whereas, Rajasthan on top
with 48.64 per cent production from 45.06 per cent
area in India during 2008-09.
Iron is critical for chlorophyll formation and
photosynthesis. Chlorophyll is the small "sun-panels"
which the plants use to harvest energy from the sun
and gives plants green pigment. Photosynthesis is the
process during which the actual sun- rays are
harvested. Iron is also used by enzymes to regulate
transpiration in plants. This transpiration process
allows nutrients to reach all parts of the plants.
Without iron the above functions would not work.
Since these functions are essential for plant growth,
iron is an essential element. So there is a need to
focus on these nutrients, especially zinc as it is one of
the most important micronutrient. While, applying
with iron and NPK. Zinc deficient soil can be found
throughout the world and are normally associated
with low soil organic matter and alkaline of soil.
Zinc deficiencies are corrected in most cases by
applying a granular Zinc (ZnSO4.7H2O) fertilizer.
Growth of winter crops in the soils is adversely
affected due to reduction in zinc availability at low
temperatures.
Although zinc can be applied as foliar application in
emergency measure, greatest yields are obtained
when it is applied to the soil. Soil application of zinc
is normally made at the seeding of crop. Sometimes,
Zn deficiency appears due to the low amount of Zn
as recommended and low temperature as required
during the crop growth. Deficiency of zinc can also
appear after seeding of the crop in soils with high
phosphorus contents. Zinc sulphate improves
phosphorus utilization and regulates plant growth
and increase leaf size, promotes silking, hastens
maturity and increase to test weight.
MATERIAL AND METHOD
A field experiment was conducted during the rabi
season of 2008-09 at the crop research center of
SVBPUAT, Meerut. The soil was sandy loam with
pH 8.36 and low in organic carbon 0.36per cent,
available N (79.80) , available K (165.30) and
medium in available P (14.80) kg ha-1
and sufficient
amount of Zn and Fe (0.49 and 12.25 ppm). The
treatments T1-Control (without fertilizers), T2-100
per cent NPK @ 80,60,40 Kg ha-1 (RDF), T3- 100
per cent NPK (RDF) + Zn @ 25 Kg ha-1
(B), T4- 100
per cent NPK (RDF) + Zn (F), T5- 100 per cent NPK
(RDF) + Fe @ 25 Kg ha-1 (B), T6- 100 per cent NPK
(RDF) + Fe (F), T7- 100 per cent NPK (RDF) + Zn
@ 25 Kg/ha (B) + Fe (F), T8- 100 per cent NPK
(RDF) + Zn (F) + Fe @ 25 Kg ha-1 (B), T9- 100 per
cent NPK (RDF) + Zn @ 25 Kg ha-1 (B) + Fe @ 25
Kg ha-1 (B) and T10 - 100 per cent NPK (RDF) +
Zn (F) + Fe (F)were laid out in RBD in the three
replications. The calculated quantity of Zn and Fe
was applied as based as well as foliar at first and
second irrigation as per treatment 30 and 60 DAS,
respectively. Indian mustard variety Pusa Bold was
sown at 30 cm row spacing using 4 kg seed ha-1
.
I
Page 60
414 ANUJ KUMAR, SATENDRA KUMAR, PRADEEP KUMAR AND PRAMOD KUMAR
RESULT AND DISCUSSION
Effect on growth and yield and yield attribute of
mustard
The data on growth parameters and yield and yield
attribute of mustard are presented in Table 1 and 2.
Various plant growth parameter of mustard crop are
affected by varying the method of application of
micronutrients during the crop season. The plant
height was significantly influence by the different
method of zinc and iron application at all the growth
stages. Plant height is an index of good vegetative
growth. The maximum plant height 98.25 cm at 60
DAS and 196.25 cm at harvest was observed in T9
[100 per cent NPK (RDF) + Zn @ 25 Kg ha-1 (B) +
Fe @ 25 Kg/ha (B)] treatment, i.e. 36.45 and
26.20per cent increase in plant height were observed
at 60 and 147 DAS, respectively (Table 2). Primary
branches increase with advancement of crop age the
maximum branches was observed in T9 (11.05) at 60
DAS significantly, when zinc and iron applied basal
and foliar (Table 1). The similar results were also
reported by Meena et al. (2006), Chaudhary et al.
(2007), Yadav et al. (2007) and Ravi et al. (2008).
Maximum number of secondary branches at 60 DAS
(31.33) and at harvest 147 DAS (34.67) were
recorded in T9 [100 per cent NPK (RDF) + Zn @ 25
Kg/ha (B) + Fe @ 25 Kg/ha (B)]. (Table 1)
significantly increase in number of branches per
plant as compared to T1 attributed to increase in
absorption and translocation of assimilation and
stimulation graphical and lateral meristems to grow
result supported by Husain and Kumar (2006).
The numbers of Siliqua per plant at harvesting
highest (545.35), number of seed per Siliqua was
recorded maximum in T9 (13.55). The highest length
of Siliqua found 5.20 cm (Table- 2), treatment in
which recommended dose of fertilizer were applied
along with zinc and iron application as basal. The
significant increase in number of Siliqua per plant
and number of seed per Siliqua as compared to
T1(Control). It is evident that zinc and iron element
play an important role in plant, similar results were
reported by Sudhakar et al. (2002) and Husain and
Kumar (2006). Significantly result was observed,
when zinc and iron was applied basal along with
RDF (T9) in seed weight per plant and 1000 seed
weight (6.50g) the result was supported by Sudhakar
et al. (2002), and Zizala et al. (2008).
Yield attributes
The grain yields of mustard in different treatments
are significant; when zinc and iron are applied alone
and with combination significantly increased the
grain yield. The highest grain yield was recorded in
T9 (23.40 q/ha) followed by T7 and T8 gave grain
yield 22.14 and 20.45 qha-1
. i.e. 145, 132 and 115 per
cent increased in grain yield by T9, T7 and T8,
respectively over control. (Table 2). Similar
observation were also recorded by Saxena et al.
(2005), Kumar et al. (2006), Meena et al. (2006),
Chaudhary et al. (2007), Jatl and Mehra (2007),
Yadav et al. (2007) and Ravi et al. (2008). Similarly
the Stover yield was recorded significantly maximum
in T9 (91.40 q ha-1
) followed by T7, T8 and T10
gave values 87.74, 79.25 and 75.82 q ha-1
,
respectively. The stover yield was observed 123,
114, 94 and 86 per cent higher as compared to T1
(control). These results are supported by the findings
of Saxena et al. (2005), Chaudhary et al. (2007), Jat
and Mehra (2007) and Chandra and Khandelwal
(2009).
Nutrient uptake
The data on N, P and K uptake by grain of mustard
are presented in Table 3. Total uptake of NPK by
mustard crop was maximum recorded with RDF
along with zinc and iron applied as basal. The total
nitrogen uptake was recorded significantly highest in
T9. Total phosphorus uptake was found maximum in
T9 followed by T7 over control , and the total
potassium uptake by mustard crop was also in
highest in T9 over the maximum per cent in increase
of nutrient was recorded 191, 236 and 222 per cent
NPK, respectively over control. The result are
supported by Malewar et al. (2001), Giri et al.
(2003), Kumar et al. (2006), Meena et al. (2006),
Chaudhary et al. (2007), Jat and Mehra (2007), Ravi
et al. (2008), Zizala et al. (2008) and Chandra and
Khandelwal (2009).
CONCLUSION
It is concluded from that investigation the application
of recommended dose of fertilizer (100per cent NPK)
@ 80: 40: 40 recorded better grain yield (11.90 q ha-
1) of mustard crop. The highest grain yield (23.40 q
ha-1
) was obtained in the treatment consisting the
basal application of zinc and iron along with 100per
cent nitrogen, phosphorus and potash
(Recommended dose of fertilizer) (T9). The addition
of Zn and Fe as basal @ 25 Kg/ha along with 100per
cent NPK (RDF) prone super ion to foliar application
of Zn and Fe along with 100per cent NPK (RDF) in
terms of yield and other parameters of mustard crop.
On an average highest total uptake of NPK recorded
97.54, 21.82, and 152.82 Kg ha-1
, respectively in
treatment T9 followed by T7. Similarly maximum
total uptake of zinc and iron were recorded 251.76
and 2314.53 g ha-1
respectively in T9 followed by T7.
Page 61
JOURNAL OF PLANT DEVELOPMENT SCIENCES Vol. 6 (3) 415
Table: 1: Effect of zinc and iron application on number of primary and secondary branches/plant in mustard.
Treatment primary
branches/plant
secondary
branches/plant
30 DAS 60 DAS 60 DAS At harvest
T1 1.50 4.75 11.33 13.33
T2 1.58 5.75 23.00 25.33
T3 1.61 7.97 23.33 25.67
T4 1.56 6.65 20.00 23.33
T5 1.46 7.35 22.33 25.00
T6 1.50 6.15 20.00 22.33
T7 1.57 10.25 24.67 27.67
T8 1.74 8.50 22.00 24.33
T9 1.76 11.05 31.33 34.67
T10 1.72 8.17 23.67 27.00
S Em (±) 0.10 0.30 1.68 1.61
CD (P=0.05) N.S. 0.91 5.04 4.81
Table 2: Effect of zinc and iron application on yield and yield attributes of mustard crop.
Treatment Grain
yield
(q ha-1
)
Stover
yield
(q ha-1
)
Biological
yield
(q ha-1
)
Plant
height
(cm)
No. of
siliqua/
plant
No.
seed/
siliqua
Length
of
siliqua
(cm)
Seed
weight/
plant (g)
1000-
seed
weight
(g)
T1 9.53 40.82 50.35 155.50 295.25 7.95 3.50 9.45 5.20
T2 11.90 56.52 68.42 160.67 390.60 8.40 4.02 12.10 5.40
T3 17.94 74.14 92.08 177.25 485.40 10.15 4.62 17.10 5.65
T4 13.90 71.43 85.33 169.25 460.45 9.45 4.40 14.11 5.55
T5 14.00 74.14 88.14 170.25 478.75 9.65 4.55 15.20 5.80
T6 12.20 66.91 79.11 165.00 415.15 8.90 4.36 13.50 5.85
T7 22.14 87.74 109.88 188.25 522.50 12.20 4.90 28.78 6.35
T8 20.45 79.25 99.70 182.00 505.75 11.95 4.85 25.32 6.20
T9 23.40 91.40 114.80 196.25 545.35 13.55 5.20 30.38 6.50
T10 19.28 75.82 95.10 180.25 490.65 10.75 4.75 20.51 6.00
S Em ± 0.40 0.51 0.59 2.34 4.00 0.16 0.16 0.29 0.14
CD
(P=0.05)
1.19 1.52 1.77 7.01 11.97 0.48 0.48 0.87 0.40
Table 3: Effect of zinc and iron application on Total NPK uptake (kg/ha) by mustard crop.
Treatments Nitrogen uptake (kg/ha) Phosphorus uptake(kg/ha) Potassium uptake (kg/ha)
T1 23.53 6.47 47.25
T2 34.71 11.21 90.21
T3 47.69 17.10 92.95
T4 44.03 18.65 116.00
T5 43.39 15.62 119.01
T6 38.86 13.58 105.94
T7 60.46 19.89 148.83
T8 55.93 17.88 134.34
T9 67.19 21.82 152.82
T10 54.28 17.69 124.09
S Em ± 6.43 0.26 10.55
CD (P=0.05) 19.25 0.78 31.59
Page 62
416 ANUJ KUMAR, SATENDRA KUMAR, PRADEEP KUMAR AND PRAMOD KUMAR
REFERENCES
Chandra, D. and khandelwal, R.B. (2009). Effect
of zinc and phosphorus on yield, nutrient uptake and
oil content of mustard grown on the gypsum –treated
sodic soil. J. Indian soci. Soil Sci., 57 (1): 66-70.
Chaudhary, H.C., Khan, S. and Uttam, S.K.
(2007). Effect of N, P, S and Zn nutrition and
moisture conservation practices on nutrient uptake,
quality and yield of rainfed Indian mustard in eroded
soil. Indian Agriculture, 53 (3/4): 125-130.
Giri, M.D., Hamid, A., Giri, D.G., kumar,R.P. and
Sajid, M. (2003). Effect of irrigation and sources of
iron on quality and uptake of nutrients of mustard. J.
soils and crops, 13 (1):131-134.
Husain, M.F.and Kumar,R. (2006). Influence of
sowing dates application of zinc on the performance
of mustard in South-West semi arid zone of Uttar
Pradesh. International J. Agriculture Sci., 2(2):601-
604.
Jat, J.R. and mehra,R.K. (2007). Effect of sulphur
and zinc on yield, macronutrient content in and
uptake by mustard Haplustepts. J. Indian soci.soil
sci., 55 (2): 190-195.
Kumar,N.,Singh,S.and Singh,V. (2006). Effect of
Iron and Sulphur levels on yield, oil content. and
their uptake by on Indian mustard (Brassica juncea).
Indian J.Agronomy, 51(1):63-64.
Malewar,G.V., Kate, S.D., Waikar, S.L. and
Isnail, S. (2001). Interaction effects of zinc and
boron on yield, nutrient uptake and quality of
mustard (Brassica juncea L.) on a typic Haplustert. J.
Indian soci. Soil sci., 49(9):763-765.
Meena, M. C., Patel, K. P. and Rathod, D. D.
(2006). Effect of Zinc, Iron and Sulphur on mustard
in loamy sand soil, Indian J. Fertilizer, 2(5):55-58.
Ravi, S., channel, H.T.,Hebsur, N.S.,Patil,B.N.and
Dharmatti, P.R. (2008). Effect of sulphur, zinc and
iron nutrition on growth, yield, nutrient uptake and
quality of safflower (carthamus tinctorius L.).
Karnataka J.agric.sci., 21 (3): 382-385.
Saxena,K.K.,Kumar,A.and Verma,H.R. (2005).
Growth,yield and oil content of mustard (Brassica
juncea L.) as influenced by application of
phosphorus and iron. Farm Sci J. 14(1): 97-98.
Sudhakar,P.C.,Chandel,R.S. and Singh,K. (2002).
Effect of sulphur, iron and silicon on the growth and
yield of irrigated mustard. Annals of Agricultural
Res., 23 (3): 483-485.
Yadav,R.b.,Singh,R.V., Singh, H.R. and yadav,
H.S .(2007). Effect of different levels of zinc and
sulphur on Indian mustard (Brassica juncea L.). crop
res. Hisar, 33 (43): 74-76.
Zizala,V.J.,jadav,N.B. and Gorfad,P.S. (2008).
Effect of sulphur and zinc on yield, quality and its
concentration on mustard. Asian J. soil sci., 3 (1):
173-177.
Page 63
________________________________________________ Journal of Plant Development Sciences Vol. 6 (3) : 417-420. 2014
EFFECT OF TIME AND METHOD OF BUDDING IN BER
(ZIZYPHUS MAURITIANA LAMK.)
Gokaran Meena and M.M. Syamal
Department of Horticulture, Institute of Agricultural Sciences, B.H.U., Varanasi (U.P.) 1, Department of Department of Horticulture, Institute of Agricultural Sciences,
B.H.U., Varanasi (U.P.) 2 Department of Department of Horticulture, Institute of Agricultural Sciences, B.H.U.,
Varanasi (U.P.)
Email: [email protected]
Abstract: Ring budding gave better response than patch and shield budding with respect to bud take, bud sprouting and
vegetative growth followed by patch budding, while shield budding showed poor response. Budding performed on 15th June
showed better response with respect to all the character studied followed by 30th June and budding done on 15th April
showed poor response. On the basis of the above observation, it is concluded that there is tremendous possibilities of
commercialization of asexual propagation in ber by adopting ring budding performed on 15th June followed by 30th June.
Keywords: Ring budding, patch budding, shield budding, bud sprouting
INTRODUCTION
er is botanically known as Zizyphus mauritiana
Lamk. and belongs to the family Rhamnaecae or
buckthorn family, which has about 50 genera and
more than 600 species. The genus Zizyphus has been
derived from Zizoof, which is the Arabic name of the
fruits (Baily, 1947). Ber fruits are within the reach of
poor people. It is, therefore, rightly known as “poor
man‟s fruit”. This fact assumes greater significance
in view of our determination to fight the prevailing
malnutrition among the masses. Ber fruits is very
nutritious and rich source of Vitamin „C‟ (76-117
mg/100 g pulp) next only to Aonla and guava and
also contains fair quantity of vitamin „A‟ (55.0
mg/100g pulp).
Ber is propagated both by sexual and asexual or
vegetative means. In India, seedling tress comprise a
large population in old orchards and the fruit thus
produced are inferior in size and quality. Vegetative
propagation is an important method to overcome
these constraints and obtain fruits of desired cultivar.
Different methods of vegetative propagation such as
cutting, layering and budding have been found to be
the best method for propagation. Different types of
budding viz. Shield, patch, ring and flute have been
tried. Among various method of budding, ring, patch
and „T‟ budding is commonly used in Ber.
In recent years demand for ber plant has increased
manifold. This has necessitated standardization of
technique for commercial propagation of ber plants.
In the present investigation it was tried to improve
upon the budding technique in ber in different time
interval.
MATERIAL AND METHOD
Experimental site The horticulture experimental garden is located in
South- Eastern part of Varanasi city at 250 81‟ North
longitude and 800 30‟ East longitude and about
128.93 meters above the mean sea level.
Preparation of nursery bed
To make the condition of field nearly uniform for
seed germination, sufficient amount of FYM and
sand were added to the nursery bed. The height of the
raised bed was kept 15 cm above ground level.
Seed showing in nursery
Before sowing the seeds were soaked in water for the
24 hours. The seed sowing was done in accordance
with time of sowing in nursery beds. The seeds were
sown at a depth of 5 cm at a distance of 25x15cm.
Mulching
After seed sowing the nursery bed was mulched with
layer of dry grasses and sprinkler irrigation was done
daily till germination of seed. After seed
germination, the grass- mulch was removed
carefully.
Budding: The seedling which attained budding
thickness (0.5cm) after 90,120 and 150 days were
considered for budding. The patch and shield
methods of budding were employed all the time of
budding.
Observations: The following observations were
noted for experiment:-
Number of days taken by bud to sprout
The days were counted from the date of bud-
sprouting from each individual plant in each
treatment and the average number of days required
was recorded.
Per cent of bud sprouting
To observe the percentage sprouting of bud, each
plant was observed carefully and number of plant
showing bud take was recorded in each treatment.
B
Page 64
418 GOKARAN MEENA AND M.M. SYAMAL
Number of leaves per shoot
The number of leaves of sprouted shoot was recorded
by counting fully expanded leaves at an interval of
30 days.
RESULT AND DISCUSSION
Budding method
Plant materials consisted of 9-12 month-old uniform
jamun seedlings. Plants were grown in the raised
nursery beds at the Horticulture experimental garden,
Banaras Hindu University. Budding operation was
performed immediately after arrival of the section –
shoot at the site where the budding operation was to
be performed. In patch budding a rectangular patch
of bark was removed completely from the root stock
and a patch of bark of the same size containing a bud
of the desired variety was placed there. The
procedure was completed by tying the patch with
polythene strip leaving the bud open to grow.
The second method of budding was shield. The “T-
bud” designation arises from the T- like appearance
of the incision in the stock, whereas the “shield –
bud” name is derived from the shield like appearance
of the bud when it is ready for insertion into the
stocks. The budding was performed at a height of 18
to 20 cm from the ground on rootstock. A straight cut
of the similar length as bud had, was made into the
bark of the rootstock with the help of a budding
knife. The bark around the cut was slightly loosened
from the wood and the bud was carefully inserted
into the incision. As soon as the operation was
become over, the bud was tied with the polythene
stripes of 150 gauge thickness and about 25 mm
width. The similar budding method was employed by
Singh et al., (1967) and Parik (1987).
Effect of budding method and time on days
required for sprouting of buds in Ber
Data pertaining to effect of budding method and time
on days required for sprouting of buds in ber have
been presented in Table1 clearly indicate that there
was a considerable variation in main plot treatment.
The budding methods were found statistically
significant in affecting this character. The minimum
number of 22.37 days was recorded for bud to sprout
with ring budding followed by 24.33 and 26.50 days
with patch and shield budding respectively. Thus,
ring budding gave 1.96 days earlier bud sprouting
than patch and 4.13 days earlier than shield budding
was recorded. Difference between the mean values of
ring, patch and shield budding was statistically
significant. Time of budding also showed significant
variations, which varied from 21.07 to 27.23 days.
Budding performed on 15th
June took minimum
number of days (21.07) for sprouting followed by
30th
June (22.65), 30th
May (24.08). 15th
May (25.10
days), 30th
April (22.23 days). In all the cases
significant variations were recorded. The similar
results were observed by Joolka and Rindhe (2000).
The interaction effect between method of budding
and different time taken in the experiment is
statistically non- significant (Table 2)
Per cent bud sprouted at different methods and
times of budding in ber
The data per cent bud sprouted at different methods
and times of budding in ber have been presented in
Table 3. The data recorded clearly indicate that
maximum bud sprouting of 77.22 per cent was
recorded in ring budding, followed by 66.67 and
49.94 per cent in patch and shield budding
respectively. Analysed data showed significant
differences in all the three cases. Time of budding
varied from 36.67 to 84.44 per cent. The budding
done on 15th
June exhibited maximum sprouting
(84.44 %), which significant differ with 30th
June
(80%), 30th
May (70%), 15th
May (63.64%), 30th
April (52.22%) and 15th
April (36.67%).
Interaction of method and time of budding showed
significant influence on per cent bud sprouting as
shown in Table 4. The ring method of budding gave
maximum sprouting of 93.33 per cent which was
done on 15th
June as compared to other method and
time ob budding. The minimum (20%) bud sprouting
was observed with shield budding done on 15th
April,
which significantly differed with other treatments.
Among the three method of budding, ring and patch
budding showed significantly better response as
compared to shield budding with all the timing of
operations. Similar results have also been by
Kaundal and Deol (1990) where 71.89 to 75.85 per
cent budding success was obtained with modified
ring budding method compared to 63.39 to 64.22 per
cent with patch budding in guava.
Effect of methods and time of budding on number
of leaves of sprouted shoot at successive stage of
growth Data pertaining to number of leaves as influenced by
time and method of budding are presented in Table 5
and clearly show that ring budding produced
significantly maximum number of leaves as compare
to patch and shield budding at 30, 60, 90 and 120
days after budding. The time of budding also showed
significant response in this respect. Significantly
maximum numbers of leaves were counted, when
budding was performed on 15th
June followed by 30th
June at all the four stages of observations. The
minimum numbers of leaves were recorded in 15th
April budding. The interaction on both the factors
also exhibited significant response at 30,60, 90 and
120 days after budding It was found that maximum
number of leaves shoot was found with ring
budding, when it was done on 15th
June. The similar
result was observed by Mawani and Singh (1992) in
ber, also reported that maximum number of leaves
per shoot was found when ring, patch and shield
budding was carried out on 15th
June.
Page 65
JOURNAL OF PLANT DEVELOPMENT SCIENCES Vol. 6 (3) 419
Table 1: Effect of budding method and time on days required for sprouting of buds in Ber.
S.no Method of Budding Sprouting of buds (days)
1. Ring Budding 22.37
2. Patch Budding 24.33
3. Shield Budding 26.50
SEm±
CD at 5%
0.15
0.60
S.no Time of Budding Sprouting of buds (days)
1. 15th
April 27.23
2. 30th
April 26.28
3. 15th
May 25.10
4. 30th
May 24.08
5. 15th
June 21.07
6. 30th
June 22.65
SEm±
CD at 5%
0.18
0.51
Table 2: Interaction effect between method and time of budding on days required for sprouting of buds in ber
S.no Time of budding Ring Patch Shield Mean
1. 15th
April 25.26 27.31 29.12 27.23
2. 30th
April 24.19 26.22 28.42 26.28
3. 15th
May 23.29 24.69 27.32 25.10
4. 30th
May 21.59 23.93 26.73 24.08
5. 15th
June 19.10 20.89 23.23 21.07
6. 30th
June 20.81 22.94 24.19 22.65
Mean 22.37 24.33 26.50
SEm±
CD at 5% (M x T)
0.31
N.S.
SEm±
CD at 5% (T x M)
0.30
N.S.
CD at 5% (M x T) = N.S. (Difference between methods of budding at same level of time of budding)
CD at 5% (T x M) = N.S. (Difference between times of budding at same level of method of budding)
Table 3: Per cent bud sprouted at different methods and times of budding in ber
S.no Method of Budding Per cent bud Sprouting
1. Ring Budding 77.22
(61.48)
2. Patch Budding 66.67
(54.76)
3. Shield Budding 49.94
(44.94)
SEm±
CD at 5%
0.45
1.75
S.no Time of Budding Per cent bud Sprouting
1. 15th
April 36.67
(37.29)
2. 30th
April 52.22
(46.26)
3. 15th
May 63.34
(52.71)
4. 30th
May 70.00
(56.71)
5. 15th
June 84.44
(66.74)
6. 30th
June 80.00
(63.44)
SEm±
CD at 5%
0.35
1.00
Page 66
420 GOKARAN MEENA AND M.M. SYAMAL
Table 4: Interaction effect between method and duration of budding on per cent sprouting in ber.
S.no Time budding Method of budding Mean
Ring Patch Shield
Per cent of
sprouting
Per cent of sprouting Per cent of
sprouting
1. 15th April 53.33
(46.89)
36.67
(37.29)
20.00
(26.56)
36.91
2. 30th April 66.67
(54.76)
53.33
(46.89)
36.67
(37.29)
46.31
3. 15th May 76.67
(61.14)
66.67
(54.76)
46.67
(43.11)
53.00
4. 30th May 83.33
(65.88)
73.33
(58.89)
53.33
(46.89)
57.22
5. 15th June 93.33
(75.00)
86.67
(68.61)
73.33
(58.89)
67.50
6. 30th June 90.00
(71.56)
83.33
(65.88)
66.67
(54.76)
64.07
SEm±
CD at 5% (M x T)
0.70
2.28
SEm±
CD at 5% (T x M)
0.60
1.73
CD at 5% (M x T) = (Difference between methods of budding at same level of time of budding)
CD at 5% (T x M) = (Difference between times of budding at same level of method of budding)
Table 5: Effect of methods and time of budding on number of leaves of sprouted shoot at successive stage of
growth. S.no Period of observation T1 T2 T3 T4 T5 T6 Mean SEm± CD at 5%
1. 30 days after
budding
M1 3.67 4.12 4.42 5.10 5.87 5.31 4.75 M 0.09 0.37
M2 2.59 3.00 3.43 3.77 4.54 3.98 3.55 T 0.08 0.24
M3 2.27 2.77 3.11 3.59 4.11 3.96 3.30 M x T 0.16 N.S.
Mean 2.84 3.30 3.65 4.15 4.84 4.42 T x M 0.14 N.S.
2. 60 days after
budding
M1 17.49 17.66 21.50 21.97 24.55 23.22 21.07 M 0.19 0.73
M2 16.09 16.52 19.84 21.01 23.38 21.80 19.77 T 0.08 0.24
M3 12.32 13.67 18.68 19.70 22.54 21.53 18.07 M x T 0.23 0.80
Mean 15.30 15.95 20.01 20.89 23.49 22.18 T x M 0.14 0.42
3. 90 days after
budding
M1 36.12 36.86 41.19 42.01 44.59 43.32 40.68 M 0.09 0.35
M2 31.66 32.84 38.21 39.95 42.40 41.36 37.74 T 0.07 0.20
M3 27.95 29.40 35.65 37.07 39.71 38.91 34.78 M x T 0.14 0.45
Mean 31.91 33.03 38.35 39.68 42.23 41.20 T x M 0.12 0.34
4. 120 days
after budding
M1 47.69 48.87 63.64 55.16 57.77 56.38 53.25 M 0.10 0.40
M2 43.65 45.31 50.15 51.68 54.94 53.67 49.90 T 0.05 0.15
M3 38.59 40.89 46.43 49.15 52.29 51.09 46.41 M x T 0.13 0.45
Mean 43.31 45.02 50.07 52.00 55.00 53.71 T x M 0.09 0.25
M= Method of budding, M x T = Difference between methods of budding at same level of time of budding
T= Time of budding, T x M = Difference between times of budding at same level of method of budding
N.S. = Non significant
ACKNOWLEDGMENT
The authors are highly grateful to Department of
Horticulture, Institute of Agricultural Sciences,
B.H.U., Varanasi (U.P.) for providing necessary
facilities and for financial support.
REFERENCES
Bailey, L.H. (1947). The standard cyclopedia of
Horticulture, Macmillan & Co., New York, pp.3547-
8
Joolka, N.K. and Rindhe, A.B. (2000). A note on
the effect of method and time of budding on bud take
in kinnow mandarin. Hariyana Journal of
Horticulture science, 15:54-56
Kaundal, G.S. and Deol, I.S. (1990). Budding
technique in clonal propagation og guava.
Horticultural Journal, 231: 186-191
Mawani, P.B. and Singh, S.P (1992). Effect of
method and time of budding on budding success in
ber cv. Umran. Horticultural Journal, 5:31-35.
Page 67
________________________________________________ Journal of Plant Development Sciences Vol. 6 (3) : 421-423. 2014
RESPONSE OF HYBRID RICE (ORYZA SATIVA L.) TO INTEGRATED NUTRIENT
MANAGEMENT (INM) IN PARTIALLY RECLAIMED SODIC SOIL
A.K.S. Parihar, Suresh Kumar and Adesh Kumar
Department of Soil Science and Agricultural Chemistry, Narendra Deva University of Agriculture and
Technology Kumarganj, Faizabad-224 229 U.P. INDIA
Abstract : The field experiment was carried out at Instructional Farm of Narendra Deva University of Agriculture and
Technology, Kumarganj, Faizabad (U.P.) during Kharif season of 2010 and 2011 to study the response of hybrid rice to
Integrated Nutrient Management on grain yield, nutrient uptake and economics of various treatments and their effect on
physico-chemical properties of soil after harvest of the crop. The experiment was carried out on silt loam soil having pH 8.9,
EC 0.4 dSm-1 organic carbon 3.6mg kg-1, Available N 194.00, P2O5 14.46and K2O 246.80 kg ha-1. The Seven treatments of
integrated nutrient management practices (T1 -100% NPK, T2 -75% NPK T3 -50% NPK, T4 -75%NPK +25%FYM-N, T5 -
50%NPK +50%FYM-N T6 -25%NPK+75%FYM-N and T7 -100%FYM-N) were tested in randomized block design,
replicated thrice. The maximum grain yield (69.26 qha-1), straw yield (83.22qha-1), nutrient uptake of N (155.32 kg ha-1), P
(44.15 kgha-1), K (158.23kgha-1) were recorded with the application of 75%NPK +25%FYM-N (T4) which were
significantly superior over 75%NPK and 50% NPK + 50 % FYM-N, minimum was recorded with 100 % N through FYM.
The maximum gross income Rs. 70489.0 ha-1 was recorded with 75%NPK +25%FYM-N (T4) followed by 100%NPK ( T1).
Keywords : INM, hybrid rice, sodic soil
INTRODUCTION
ice (Oryza sativa L.) being one of the richest
starch food is consumed by about half of the
world’s population. India ranks second position in
production of rice among the food grain, and half of
the world population subsist on rice by receiving the
highest (26.2%) calories intake from it (FAO 2009).
Uttar Pradesh is the largest rice growing state after
West Bengal in the country, where rice grown over
an area of 5.69 m ha with production and
productivity of 11.80 mt and 2060 kg ha-1
,
respectively. Area under hybrid rice in India is about
2.5 m ha which is very low as compared to other
growing countries, viz China and Japan. Hybrid rice
gave about 20-25% more yield than promising high
yielding commercial rice varieties. Salt-affected soils
are those soils, which have an excess of soluble salts
or an excess of exchangeable sodium (Na+) or both in
root zone to an extent, which can adversely affect
crop growth or completely inhibit production of most
of the crops. Excessive amount of salts in the root
zone besides inducing toxicity, create physiological
imbalance in growing plants. The Use of adequate
dose of organic source coupled with chemical
fertilizers is expected to ensure optimum growth
conditions under intensive agriculture using rice
hybrid. It is well established that the applied organic
resources not only increase soil fertility but also
improve soil physical conditions which help for
proper growth of plants. Majumdar, et. al. (2007)
reported that Integrated use of FYM and inorganic
fertilizers significantly improve the yield as well as
N, P and K uptake by paddy. They also reported that
the integrated use of inorganic and organic fertilizers
also improve the water holding capacity, aeration,
permeability, soil aggregation, nutrient availability
and decreasing bulk density. Keeping in view, the
present investigation was aimed to study the effect of
integrated nutrient management on hybrid rice in
partially reclaimed sodic soil.
MATERIAL AND METHOD
The field experiment was conducted on Silt loam
(sodic soil) at Instructional Farm of Narendra Deva
University of Agriculture & Technology, Narendra
Nagar (Kumarganj), Faizabad (U.P.) situated at
26.470 latitude and 81.12
0 longitude with an
elevation of about 113m from mean sea level in the
Gangetic eastern Uttar Pradesh for two consecutive
years (2010 and 11) to study the effect of Integrated
Nutrient Management (INM) on hybrid rice (Oryza
sativa L.) in partially reclaimed sodic soil. The mean
annual rainfall is 1200 mm. The soil of experimental
site (0-15 cm) had pH (1:2.5) 8.9, EC 0.40 m dSm-1
at 250C, organic carbon 3.6 mg kg
-1, available N
194.0, P2O5 14.46 and K2O 246.80 kgha-1
. Seven
treatment combinations consisted (T1) 100% NPK,
(T2) 75% NPK, (T3) 50% NPK, (T4) 75% NPK+25%
FYM-N, (T5) 50% NPK+50%FYM-N (T6) 25%
NPK+75% FYM-N and (T7) 100% N through FYM.
The experiment was laid out in a randomized block
design replicated thrice. Hybrid rice variety ARIZE-
6444 was taken as test crop. The total N, P and K
contents in grain and straw were analyzed as per
standard procedures described by Jackson (1973).
The uptake of N, P and K were computed by
multiplying with total nutrient concentration in grain
and straw with corresponding yields of the crop. The
soil samples were analyzed for pH, organic carbon,
available N, P and K by standard methods described
by Jackson, 1973.
RESULT AND DISCUSSION
Yield and yield attributes
The pooled data presented in table-1 revealed that the
grain and straw yield of rice increased with the
R
Page 68
422 A.K.S. PARIHAR, SURESH KUMAR AND ADESH KUMAR
application of NPK along with Farmyard manure.
The maximum grain (69.26 qha-1
) and straw (83.22
qha-1
) were recorded with the application of 75%
NPK + 25% FYM which was significantly superior
to 75% NPK (54.20 qha-1
), and 50% NPK+ 50%
FYM (58.48 qha-1
) treatment and statistically at par
with the application recommended NPK (100%NPK)
treatments. This may be due to fact that slowly
released nutrients through FYM and applied
inorganic fertilizer helped to produce higher yield of
rice. The per cent increase in grain yield of rice was
higher under 75% NPK+ 25% FYM- N over 100%
NPK, 75% NPK, 50% NPK + 50% FYM-N 3.58
21.60 and 15.56% respectively. The yield of rice was
lowest under 100% N through FYM-N. On the basis
of pooled mean data of two years, the superiority of
the treatment may be arranged as: T4 > T1 >T5 >T2 >
T6 > T3 and T7 in case of grain yield of rice. These
results are also corroborated by majority of workers
Singh et. al. (2004) and Sowmpya et. al. (2011).
Nutrient Uptake
The N, P and K uptake were improved with the
application of 75% NPK+ 25% FYM-N followed by
100% NPK applied through chemical fertilizer by
hybrid rice during both the year of investigation
(Table 2). Minimum uptake values of the N, P and K
were recorded with 100 % N through FYM.
Majumdar et al. (2007) also reported that N, P and
K uptake by paddy and various forms of N in soil
increased significantly by application of fertilizer N
alone with Farmyard manure.
Soil properties and Nutrients Contents in Soil
Application of 75% NPK with chemical fertilizer
along with 25% N through farmyard manure slightly
decreased the soil pH over 100% NPK through
chemical fertilizer but the difference among these
was not significant (Table 3). However, the EC value
was decreased with increasing the application
farmyard manure. The minimum EC (0.24 dSm-1
)
value was observed with the application of 100 % N
through farmyard manure followed by 25% NPK +
75%FYM-N. Incorporation in increasing amount of
FYM with decreasing value of NPK through
inorganic fertilizer slightly improved the organic
carbon. The increase in soil organic carbon with the
use of FYM has also been reported by Yadvinder–
Singh et al. (2004), Balwinder–Kuamr et al. (2008).
Available N, P and K status of soil after harvest of
the crop increased considerably with the application
75% NPK through chemical fertilizer + 25% N
through farmyard manure (Table 2). The maximum
build up of available N,P and K (175.10, 16.75 and
251.12 kg ha-1
respectively) were obtained with
conjunctive use of 75% NPK+ 25% FYM-N which
was significantly superior over 75% NPK applied
through chemical fertilizer and at par 100% NPK
applied through chemical fertilizer. Dixit and Gupta
(2000) reported similar increase in N, P and K
contents of soil under conjoint application of FYM
and inorganic fertilizers as compared to inorganic
fertilizers alone. An organic material like FYM from
a protective cover on sesquioxide and this facilitates
reduction in the phosphate fixation capacity of soil.
The beneficial effect of FYM on available potassium
may be described to the reduction in potassium
fixation, solubilization and release of potassium due
to organic matter with clay.
Economics
The cost of cultivation increased when farmyard
manure applied to supplement the recommended
nitrogen (Table 3). The highest net return (Rs.
42024.67) and cost benefit (1.47) ratio were workout
with the application of 75% NPK+ 25% FYM-N
followed by 100% NPK applied through chemical
fertilizer (Rs. 43242.61).The minimum net return
(Rs.37528.18) and cost benefit ratio (0.12) computed
with the application of 100 % N through Farmyard
manure.
CONCLUSION
Incorporation of farmyard manure in combination
with chemical fertilizers could maintain sustainable
hybrid rice yield as well as fertility in the partially
reclaimed sodic soils. Application of farmyard
manure increased the availability of nutrient content
of the soil as compared to the chemical fertilizer. For
obtaining the higher grain yield of hybrid rice the
crop may be fertilized with 75% NPK + 25 % FYM.
Table 1: Effect of various treatments on yield and f economics of various treatments of hybrid rice crop (mean
of two years).
Treatments Yield (qha-1
) Cost of
cultivation
(Rs.)
Gross
return
(Rs.)
Net return
(Rs.)
B:C
ratio
Grain Straw
T1 100% NPK 66.64 81.15 25723.60 68025.4 42301.8 1.64
T2 75% NPK 54.20 66.52 24695.38 54424.3 29728.9 1.20
T350% NPK 43.26 54.35 23666.75 43503.0 19836.25 0.84
(T4) 75% NPK+25% FYM-N 69.26 83.22 28465.76 70611.2 42145.44 1.48
(T5) 50% NPK+50%FYM-N 58.48 78.25 31687.88 60567.0 28879.22 0.91
(T6) 25% NPK+75% FYM-N 48.15 57.25 34507.13 48909.3 14402.17 0.42
(T7) 100% N through FYM 42.40 51.15 37528.20 43256.0 5727.8 0.15
CD (P=0.05) 5.38 6.69
Page 69
JOURNAL OF PLANT DEVELOPMENT SCIENCES Vol. 6 (3) 423
Table 2: Effect of various treatments on uptake of nutrients by rice crop (mean of 2010& 2011).
Treatment Nutrient uptake (kgha-1
)
N P K
T1 100% NPK 144.83 36.44 154.01
T2 75% NPK 104.15 26.86 113.99
T350% NPK 75.77 20.64 85.05
(T4) 75% NPK+25% FYM-N 155.32 44.15 158.23
(T5) 50% NPK+50%FYM-N 130.54 31.01 135.87
(T6) 25% NPK+75% FYM-N 92.92 24.31 97.60
(T7) 100% N through FYM 74.42 20.42 85.17
Table 3: Effect of various treatments on the soil fertility after harvest of hybrid rice (mean of 2010 & 2011).
Treatments pH
(1:2.5)
EC
(dSm-1
)
Organic
carbon
(mg kg-1
)
Available
N
(kg ha-1
)
Available
P2O5
(kg ha-1
)
Available
K2O
(kg ha-1
)
T1 100% NPK 8.83 0.38 2.6 173.10 15.00 248.20
T2 75% NPK 8.87 0.39 2.5 153.50 14.60 223.00
T350% NPK 8.89 0.39 2.6 136.20 13.38 206.10
(T4) 75% NPK+25% FYM-N 8.77 0.35 3.3 175.10 16.75 251.12
(T5) 50% NPK+50%FYM-N 8.71 0.28 3.5 156.75 16.01 239.40
(T6) 25% NPK+75% FYM-N 8.65 0.27 3.6 141.30 15.22 234.10
(T7) 100% N through FYM 8.60 0.24 3.8 138.00 14.02 231.85
CD (P=0.05) 0.67 0.04 0.2 1.64 2.01 2.78
REFERENCES
Balvinder Kumar, Gupta, R.K. and Bhandari,
A.L. (2008). Soil fertility changes after long- term
application of organic manure and crop residues
under rice-wheat system. Journal of the Indian
Society of soil science 56, 80-85.
Dixit, K.G. and Gupta, B.R. (2000). Effect of
farmyard manure, chemical and biofertilizer on yield
and quality of rice. Journal of the Indian Society of
Soil Science 48, 773-780.
Jackson, M. L. (1973). Soil Chemical Analysis.
Prentice Hall of India, Pvt. Ltd. New Delhi.
Majumdar, B.: Venkateshi, M.S. and Saha, R. (2007). Effect of nitrogen FYM and non-symbiotic
nitrogen fixing bacteria on yield, nutrient uptake and
soil fertility in upland rice (Oryza sativaL.) . Indian J.
Agri. Sci., 77 (6): 335-339.
Singh Yadvinder, Singh Vijay, Khind, C. S.,
Gupta, R.K., Meelu, O.P, Pasq Uvin E. (2004).
Long term effect of organic input on yield and soil
fertilizer in rice- wheat rotation. Soil Science Society
of America Journal, 68 (3): 845-853.
Sowmya, C., Ramana, M.V., Mahender Kumar (2011). Effect of systems of rice cultivation and
nutrient management options on yield, nutrient
uptake and economics of rice. Crop Research
(Hissar), 42: 1/2/3, 6-9.
Page 70
424 A.K.S. PARIHAR, SURESH KUMAR AND ADESH KUMAR
Page 71
________________________________________________ Journal of Plant Development Sciences Vol. 6 (3) : 425-435. 2014
CULTIVATION OF MEDICINAL PLANTS IN NATURAL ECOSYSTEM IN
GUJARAT (INDIA): CONSTRAINTS AND CONSERVATION NEED
*Vikas Kumar, Sreejith Babu, Amit Kumar Revale, Rajesh Kumar Meena, Manas Kumar
Ranjan and B.S. Desai
*College of Forestry, Kerala Agricultural University, Thrissur-680656, Kerala
Navsari Agricultural University, Navsari, Gujarat- 396450 *Email: [email protected]
Abstract : The present paper deals briefly about cultivation of medicinal plant of Gujarat. The number of plant species
yielding raw materials used by the industry on regular basis and/or in substantially large quantities is put at around 143
species. Among these, 78 species occur wild in forests or other forms of natural vegetation, 23 species grow as weed, 42
species are grown as cash crop for other plant based products and 22 species are cultivated as medicinal crop. There has been
a tremendous increase in the production of herbal medicines and other items in recent years. These include such important
sources of raw materials as Aegle marmelos, Commiphora wightii, Emblica officinalis, Eucalyptus, Mentha viridis,
Terminalia arjuna, Terminalia bellirica, Terminalia chebula, Withania somnifera and Zingiber officinalis. Few effects have
been made to highlight the problems encountered for necessary constraints and conservation need to medicinal plants in this
state.
Keywords: Medicinal plant, conservation, cultivated, natural vegetation, Gujarat
INTRODUCTION
ujarat State is the western-most part of India.
Gujarat is situated on the western coast of the
country having longest coastline. It lies between
latitude 20°07" to 24°43' N and longitude 68°10" to
74°29' E. The geographical area of the State is
196,022 km2, which constitutes 5.96% of the
country's geographical area (FSI, 2009). The forest
cover in the state is poor but it has fairly rich
biodiversity. The state comprise of less than 10%
forest land of its geographical area. According to
different studies on floral diversity, 2205 species of
angiospermic plants belonging to 905 genera of 156
families have been recorded so far. Out of 2205 plant
species, 748 plants were identified as medicinally
important (Uma Devi, 1988). According to a study
conducted by the Forest Department on status of
medicinal plants in different forest types and agro-
climatic zones, 915 medicinal plants are distributed
across the state (Anon, 2002). The World Health
Organization (WHO) has estimated that 80%
population of developing countries relies upon
traditional medicinal-mostly plant drugs-for their
primary health care needs (Fransworth and Soejarto,
1991).
MATERIAL AND METHOD
A survey was carried out during Aug., 2011 to July,
2013 to collect information on the basis of cultivated
of medicinal plants in different parts of Gujarat state.
While collecting information on ethno medicinal
plants, parts used, main area of natural occurrence,
resources and demand such information have been
gathered from the village chiefs, medicine man, and
even local man and women and cultivators using
semi-structured questionnaires. Analysis of data was
made with the help of group discussions among
different age classes of local communities that
include both the genders of the society.
RESULT
The number of medicinal plants in India, both
indigenous and introduced, has been variously put at
between 3,000 to 3,500 species of higher plants. The
Glossary of Indian Medicinal Plants has listed around
3,000 plants (Asolkar et al., 1992; Chopra et al.,
1956, 1974). Two thousand five hundred plants have
been reported to be used in ethno-medicine (Jain,
1991). Out of these the plants providing largely
and/or regularly used raw materials by Indian Drug
and Pharmaceutical Industry restricts to 265. This
figure includes the raw materials imported from other
countries, some of which such as liquorices,
henbane, cassia bark, galangal, ephedra, long pepper
and star anise are used in appreciably large
quantities. The occurrence of these medicinal plants
and availability of raw materials derived from them
is as follows.
Plants occurring wild in forests, grassland, aquatic
and desert ecosystems or associated with other forms
of natural vegetation in Gujarat (Table 01): The
number of such plants is around 78. These include
such important sources of raw materials as
Commiphora wightii, Emblica officinalis, Gloriosa
superba, Pterocarpus marsupium, Rauvolfia
serpentine, Terminalia arjuna, Terminalia bellirica
and Terminalia chebula. The plants where the raw
materials are leaf, flower, fruit, seed, exudates or
other renewable part also suffer if the collection
method is destructive.
Plants growing as weed or have run wild in Gujarat
state (Table 02). Twenty three species of plants in
this category provide the raw materials. Some of
G
Page 72
426 VIKAS KUMAR, SREEJITH BABU, AMIT KUMAR REVALE, RAJESH KUMAR MEENA,
MANAS KUMAR RANJAN AND B.S. DESAI
these such as Abutilon indicum, Cassia tora, Ocimum
basilicum, Phyllanthus amarus, Tephrosia purpurea
and various species of Datura have large demand.
These plants usually occur in fallow agricultural
land, along road and railway tracts, in gardens and
orchards, on dust and organic dumps, ponds, marshes
and other waste places. Some of these are escapes
from cultivation or colonizers of secondary scrub
springing up in cleared or degraded forest land.
Plants cultivated as ornamentals or as cereal, fruit,
vegetable, spice, oil seed, essential oil or other cash
crop: fourty two plants in this category are also the
source of medicinal raw materials (Table 03 and
Table 04). The raw material in these cases is either
the product for which the plant is being cultivated
such as clove, cinnamon, castor seed, turmeric or a
by-product such as bael fruit, ashoka bark and Jamun
seed.
Plants cultivated as medicinal crop: Twenty two or
so medicinal plants are under regular and/or large
scale cultivated (Table 05). The major among there
are Aloe vera, Rauvolfia serpentine and Withania
somnifera.
DISCUSSION
Most of medicinal plants, even today, are collected
from wild. The continued commercial exploitation of
these plants has resulted in receding the population
of many species in their natural habitat. Vacuum is
likely to occur in the supply of raw plant materials
that are used extensively by the pharmaceutical
industry as well as the traditional practitioners.
Consequently, cultivation of these plants is urgently
needed to ensure their availability to the industry as
well as to people associated with traditional system
of medicine. If timely steps are not taken for their
conservation, cultivation and mass propagation, they
may be lost from the natural vegetation forever. In
situ conservation of these resources alone cannot
meet the ever increasing demand of pharmaceutical
industry (Singh and Gautam, 1997). It is, therefore,
inevitable to develop cultural practices and propagate
these plants in suitable agroclimatic regions.
Commercial cultivation will put a check on the
continued exploitation from wild sources and serve
as an effective means to conserve the rare floristic
wealth and genetic diversity.
It is necessary to initiate systematic cultivation of
medicinal plants in order to conserve biodiversity
and protect endangered species. In the
pharmaceutical industry, where the active medicinal
principle cannot be synthesized economically, the
product must be obtained from the cultivation of
plants. Systematic conservation and large scale
cultivation of the concerned medicinal plants are thus
of great importance. Efforts are also required to
suggest appropriate cropping patterns for the
incorporation of these plants into the conventional
agricultural and forestry cropping systems. Initiatives
have already been taken by various agencies
involved in conservation activities. A National Board
of Medicinal Plants has been set up; one of whose
activities is conservation. The Ministry of
Environment and Forestry is funding an All-India
coordinated project on conservation of endangered
plant species (Raghupathy, 2001). Cultivation of this
type of plants could only be promoted if there is a
continuous demand for the raw materials. There are
143 major medicinal plants that can be cultivated in
Gujarat and have established demand for their raw
material or active principles in the international
trade. It is also necessary to develop genetically
superior planting material for assured uniformity and
desired quality and resort to organized cultivation to
ensure the supply of raw material at growers end.
Hence, small scale processing units too have to be
established in order that the farmer is assured of the
sale of raw material. Thus, cultivation and processing
should go hand in hand in rural areas. The
Cultivation Vrs Collection of Medicinal Plants from
Forest.
Cultivation Collection from forest
1. Cultivation of medicinal plants can be
controlled according to the need of market demand.
2. In cultivation, use of good varieties of
planting materials, use of fertilizers and insecticide
yield maximum amount of produce from smaller
area.
3. The quality of medicinal produce can be
assured by improved method of cultivation and
harvesting.
4. In cultivation the mixing of other produce
with desired produce can be checked.
1. Collection of medicinal forest produce
depends on various agencies starting from primary
collectors to stockiest. Hence there is least control
over all these agencies.
2. Here the yield is very poor and larger area
involves smaller amount of medicinal produce.
3. The quality of medicinal produce cannot be
achieved while collection from wild. The collectors
collect the produce without seeing their maturity.
4. There is always chance of mixing of several
other produce with desired produce.
For developing the medicinal plants sector, there is a
need to: 1) document indigenous uses of medicinal
plants, 2) certify raw material for quality control, 3)
develop and improve the agro-technology for
valuable medicinal plants, 4) officially recognize and
protect the customary laws of indigenous people, 5)
prepare a clear policy for granting permits for
cultivation within stipulated time, 6) conduct regular
research and training on better harvesting and
processing techniques, 7) investigate various
Page 73
JOURNAL OF PLANT DEVELOPMENT SCIENCES Vol. 6 (3) 427
pathological agents infecting medicinal plants, 8)
setup a community-based management of medicinal
plants farming and marketing, 9) analyze the market
policies, 10) monitor and evaluate the status of
medicinal plants with the assistance of local
communities, 11) conserve the critical habitats of
rare medicinal plant species, and 12) share benefits
judiciously arising from local people's knowledge on
medicinal plants. These attempts may reduce
dependency on wild resource base, and generate
alternative income opportunities for the rural and
underprivileged communities [KIT 2003; Kala 2005;
Kaushik and Dhiman 1999 and Olsen and Larsen
2003].
The medicinal plants sector can be improved if the
agricultural support agencies would come forward to
help strengthen the medicinal plants grower and if
research institutions would help the plant growers by
improving their basic knowledge about cultivation
practices [Prajapati et al., 2003]. Awareness and
interest of farmers, supportive government policies,
assured markets, profitable price levels, access to
simple and appropriate agro-techniques, and
availability of trained manpower are some of the key
factors for successful medicinal plants cultivation
[KIT 2004]. The diffusion of any available scientific
knowledge on medicinal plants should be made
operational by a network structure of
communication. Currently there are number of herbs
which are used in curing diseases but are not
documented in details due to a lack of
communication and relatively low frequency of their
uses. The traditional uses of low profile and lesser
known medicinal plants should also be documented
to disseminate their therapeutic efficacy by preparing
well acceptable medicines and also to reduce the
pressure on over-exploited species.
Gujarat is a treasure house of a wide variety of
medicinal plants. Some species are found wild, while
a number of species have been domesticated by the
farmers. Many species have been grown in
homesteads and become part of traditional home
remedies. A limited number of species are
commercially cultivated though a few more have
potential for large-scale production. The important
natural and cultivating medicinal plants are discussed
here highlighting the importance, medicinal and
other uses activity.
Terminalia arjuna: The bark is useful in fractures,
ulcers, urethrorrhoea, leucorrhoea, diabetes, vitiated
conditions of pitta, anaemia, cardiopathy, fatigue,
asthma, bronchitis, tumours, internal and external
haemorrhages, cirrhosis of the lever and
hypertension. It is used in fractures and the powdered
bark is taken with milk. The bark powder is diuretic
and has a general tonic effect in cases of cirrhosis of
liver. The bark has been considered by the ayurvedic
physicians as well as by modern practitioners as a
cardiac tonic. It is given as a decoction with milk
(NRF, 1998).
T. bellirica : The fruit is used in bronchitis,
strangury, sore throat, diseases of eye, nose, heart
and bladder, hoarseness and piles. It forms an
important constituent of the ayurvedic drug
‘triphala’. Furit has anticancerous and flower has
spermicidal activity. Bark is mild diuretic. Fruit is
astringent, antidropsical, antileprotic,
antiinflammatory, antidiarrhoeal, antibilious,
stomachic, antiasthmatic, tonic, anticephalgic,
bechic, anthelmintic and attenuant. Kernel is
narcotic. Semi-ripe fruit is purgative. Gum is
demulcent (Husain et al, 1992).
Terminalia chebula: In unani system, it is used as a
blood purifier. The pulp of the fruit is given in piles,
chronic diarrhoea, dysentery, costiveness, flatulence,
asthma, urinary disorders, vomiting, hiccup,
intestinal worms, ascites and enlarged spleen and
liver. Powder of the fruit is used in chronic ulcers
and wounds, carious teeth and bleeding ulceration of
the gums. The bark is a good cardiac tonic. Fruits are
astringent, purgative, tonic, carminative, alternative
and antispasmodic. Flowers and fruits are antiviral
and hypoglycaemic. Wood is oxytocic and
hypothermic (Husain et al, 1992). Similar study of
‘Haritaki’ (fruits of Terminalia chebula) can be cited
as an example where seven varieties originated from
different parts of India have been attributed with
different types of therapeutic properties (Pandey and
Chunekar, 1995).
Asparagus racemosus: Asparagus is a climbing
undershrub with widespread applications as diuretic,
cooling agent and an excellent safe herbal medicine
for ante-natal care. It is useful in nervous disorders,
dyspepsia, diarrhoea, tumours, inflammations,
vitiated conditions of vata and pitta, burning
sensation, hyperdipsia, ophthalmopathy,
nephropathy, hepatopathy, strangury, scalding of
urine, throat infections, tuberculosis, cough,
bronchitis, gleet, gonorrhoea, leucorrhoea, leprosy,
epilepsy, fatigue, hyperacidity, colic haemorrhoids,
hypertension, abortion, agalactia, cardiac and general
debility (Warrier et al, 1993). Its powder boiled with
milk is generally used to prevent abortion. It
increases milk production in cows and buffaloes. It
preparations in milk helps in increasing breast milk
in lactating women. Its proper use helps in avoiding
excessive blood loss during periods. It clears out
infections and abnormalities of uterine cavity and
hence it is used to rectify infertility in women. The
leaves are used to prepare toilet soaps. The plant has
also ornamental value both for indoor and out door
decorations (Syamala, 1997).
Datura metel: The plant and fruit are spasmolytic,
anticancerous and anthelmintic. Leaves and seeds are
inhaled in whooping cough, asthma and other
respiratory diseases. Root, leaf and seed are
febrifuge, antidiarrhoeal, anticatarrhal and are used
in insanity, cerebral complications and skin diseases.
Datura is the chief commercial source of hyoscine
available from natural source. Hyoscine, in the form
Page 74
428 VIKAS KUMAR, SREEJITH BABU, AMIT KUMAR REVALE, RAJESH KUMAR MEENA,
MANAS KUMAR RANJAN AND B.S. DESAI
of hyoscine hydrobromide, is used as a pre-
anaesthetic in surgery, child birth, ophthalmology
and prevention of motion sickness. It is also
employed in the relief of withdrawal symptoms in
morphine and alcoholic addiction, paralysis agitans,
postencephaletic parkinsonianism and to allay sexual
excitement. Hyoscyamine and its salt hyoscyamine
sulphate and hyoscyamine hydrobromide are used in
delerium, tremour, menia and parkinsonianism (Kaul
and Singh, (1995).
Piper longum: Its roots also have several medicinal
uses. The root is useful in bronchitis, stomach ache,
diseases of spleen and tumours . The root and fruit
decoction are used in acute and chronic bronchitis
and cough. It contains the alkaloid piperine which
has diverse pharmacological activities, including
nerve depressant and antagonistic effect on
electroshock and chemo-shock seizures as well as
muscular incoordination. Piperine is hypotensive,
antipyretic, analeptic, and nerve stimulant (Warrier et
al, 1995).
Rauvolfia serpentine: In Ayurveda it is also used for
the treatment of insomnia, epilepsy, asthma, acute
stomach ache and painful delivery. It is used in
snake-bite, insect stings, and mental disorders. It is
popular as "Madman's medicine" among tribals.
'Serpumsil’ tablet for high blood pressure is prepared
from Rauvolfia roots. Reserpine is a potent
hypotensive and tranquillizer but its prolonged usage
stimulates prolactine release and causes breast
cancer. The juice of the leaves is used as a remedy
for the removal of opacities of the cornea. Serpentine
group comprising serpentine, sepentinine, alstonine
etc is mostly antihypertensive. (Husain, 1993).
Aegle marmelos: Every part of the tree is medicinal
and useful. The roots are used in many Ayurvedic
medicines for curing diabetes and leprosy. It is an
ingredient of the ‘dasamoola’. The Bark is used to
cure intestinal disorders. Leaves contain an alkaloid
rutacin which is hypoglycaemic. ‘Two leaves before
breakfast’ is said to keep diabetes under control.
Leaves and fruits are useful in controlling diarrhoea
and dysentery. Fruit pulp is used as ‘shampoo’ and
cooling agent. ‘Bael sharbat’ is prepared by mixing
the fruit pulp with sugar, water and tamarind juice,
which is very useful for stomach and intestinal
disorders. The rind of the fruit is used for dyeing and
tanning. The aromatic wood is used to make pestles
in oil and sugar mills and also to make agricultural
implements (Rajarajan, 1997).
Phyllanthus emblica: It goes in combination in the
preparation of triphala, arishta, rasayan, churna and
chyavanaprash. Seed is used in asthma, bronchitis
and biliousness. Tender shoots taken with butter milk
cures indigestion and diarrhoea. Leaves are also
useful in conjunctivitis, inflammation, dyspepsia and
dysentery. The bark is useful in gonorrhoea,
jaundice, diarrhoea and myalgia. The root bark is
astringent and is useful in ulcerative stomatitis and
gastrohelcosis. The dried fruits have good effect on
hair hygiene and used as ingredient in shampoo and
hair oil. The fruit is a very rich source of Vitamin C
(600mg/100g) and is used in preserves as a nutritive
tonic in general weakness (Dey, 1980).
Withania somnifera: Its roots, leaves and seeds are
used in Ayurvedic and Unani medicines, to combat
diseases ranging from tuberculosis to arthritis. Roots
are prescribed in medicines for hiccup, several
female disorders, bronchitis, rheumatism, dropsy,
stomach and lung inflammations and skin diseases.
Its roots and paste of green leaves are used to relieve
joint pains and inflammation. It is also an ingredient
of medicaments prescribed for curing disability and
sexual weakness in male. Aswagandha powder (6-
12g) twice a day along with honey and ghee is
advised for tuberculosis in Sushruta Samhita. It also
provides sound sleep (Prakash, 1997).
Azadirachta indica: Every part of the tree, namely
root, bark, wood, twig, leaf, flower, fruit, seed,
kernel and oil has been in use from time immemorial
in the Ayurvedic and Unani systems of medicine. It
is valuable as an antiseptic, used in the treatment of
small pox. Small twigs are used as tooth brushes and
as a prophylactic for mouth and teeth complaints.
Extract from the leaves are useful for sores, eczema
and skin diseases. Boiled and smashed leaves serve
as excellent antiseptic. Decoction of leaves is used
for purifying blood. Neem oil is used in soaps,
toothpaste and as a hair tonic to kill lice. Seed is used
in snake bite. Extracts of neem seed oil and bark
check the activity of male reproductive cells and
prevents sperm production. Neem seed oil is more
effective than the bark for birth control. Neem based
commercial products are also available for diabetes
treatment (Nimbola, JK-22), contraceptive effect
(Sensal, Nim-76) and mosquito/ insect repelling
(Tewari, 1992; Parmer and Katkar, 1993;
Pushpangadan et al, 1993; Mariappan, 1995).
Gloriosa superba: The roots and rhizomes are used in
traditional system of medicine. A paste of the root is
also used as an anodyne; applications in bites of
poisonous insects, snake bites, scorpion sting,
parasitic skin diseases and leprosy (Nadkarni, 1954;
Chaudhuri and Thakur; 1994).
Gmelina arborea: The whole plant is medicinally
very important. It promotes digestive power,
improves memory, overcomes giddiness and is also
used as an antidote for snake bite and scorpion sting.
Roots are useful in hallucination, fever, dyspepsia,
hyperdipsia, haemorrhoids, stomachalgia, heart
diseases, nervous disorders, piles and burning
sensation. Bark is used in fever and dyspepsia. Leaf
paste is good for cephalagia and leaf juice is a good
wash for foul ulcers and is also used in the treatment
of gonorrhoea and cough. Flowers are recommended
for leprosy, skin and blood diseases. In south India
the bark of the tree is used by arrack manufacturers
to regulate the fermentation of toddy. The plant is
also grown in garden or avenues (Dey, 1984;
Sivarajan and Indira, 1994).
Page 75
JOURNAL OF PLANT DEVELOPMENT SCIENCES Vol. 6 (3) 429
Bauhinia variegate: In traditional medicine, Bauhinia
is extensively used in glandular diseases and as an
antidote to poison. The drug is also reported to be
useful in dysentery, diarrhoea, piles and worms
(Kurup et al, 1979). Root is carminative and antidote
for snakebite. Bark, flower and root promote
suppuration. Bark and bud are astringent and
vermifuge (Husain et al, 1992).
Constraints
The Gujarat Forest Department has identified some
constraints in the development of medicinal plant
sector. These are as follows;
Inadequate information on availability on selected
species and resource assessment.
Lack of scientific farming for authentic source of raw
material and bulk availability.
Poor interest in the people regarding conservation
issues and scope of sustainable development due to
lack of awareness.
Lack of marketing avenues and infrastructure. There
is also a total absence of processing and
manufacturing units.
Lack of proper survey of medicinal plants and
documentation of local health traditions and
practices.
Inadequate financial support for commercial
ventures.
Absence of Non- Government Organizations
working exclusively on this field and an effective
extension service.
Lack of Directory of village/ traditional medicinal
men/farmers/ traders/entrepreneurs involved in
medicinal plant sector in different parts of the state
for networking and co-ordination.
Inadequate trained and skilled manpower for
medicinal plant related activities.
Conservation needs
With the impact of various influencing factors the
medicinal flora of the Gujarat is on the decline in
terms of Biological, (physiological, phonological,
regeneration) ecological (habitat-genepool,
modification and alteration, hotspots,
phytogeography) and conservation aspects (ex-situ,
in-situ, in-vitro). With regards to this significant
group of plants adequate research and development
(R & D) support using recent techniques of scientific
and technological advances (S & T) is required.
Following provides the various aspects and priorities.
1. Inventorization and characterization
Development of baseline database on species
and genetic diversity of specific sites.
Taxonomic characterization using recent trends
(biochemical, DNA, RFLP, PCR, etc.
Cytological Palynological tools).
Manpower (capacity building).
Funding mechanism (collaborative).
2. Monitoring and Assessment
Development of cost effective methodology for
quantitative assessment of specific site.
Application of remote sensing (RS) and GIS
(Geographic Information System) technology in
identifying critical habitats at landscape level.
Conforming RS and GIS database with ground
truthing.
3. Ex-situ conservation
Development of nursery and planting technology
for rare and threatened taxa.
Development of gene bank (field oriented) on
targer species.
Networking for coordination and collaboration
at inter disciplinary and inter institutional levels.
Application of cost effective ways of conserving
biological parts of medicinal flora (possibly
through innovations and inventions at grassroots
level).
4. In-situ Conservation
Development of microhabitats, endemic centres,
hotspots. A separate Working Plan Circle in
forest Department may be constituted.
Application of recent trends in the field of
biodiversity conservation to the existing
preservation plots, sacred gives and specific sites
falling under various other key area o9f
conservation, for example, 86 National Parks
(PKs) and 480 Wildlife Sanctuaries (WLs) of the
country.
Table 1: Medicinal plants growing in forests, grasslands, running or stationary water bodies, deserts and other
forms of natural vegetation.
Name of the plants Part used Main area of natural
occurrence
Resources Demand
1 2 3 4 5
Acacia catechu STBK, EXT North, West & Central India;
upto 800m
Poor (VU) Med
Acacia nilotica GM, BK Maharashtra, Gujarat, Pajab
and Rajasthan
Good High
Ailanthus excelsa STBK West Bengal, Bihar, Orissa
and Gujarat
Fair Med
Aegle marmelos FR/RT Central & South India; upto
1000m
Good (*) High
Alangium salvifolium SD Rajasthan, Gujarat, Poor Low
Page 76
430 VIKAS KUMAR, SREEJITH BABU, AMIT KUMAR REVALE, RAJESH KUMAR MEENA,
MANAS KUMAR RANJAN AND B.S. DESAI
Maharashtra
Albizia lebbek STBK Throught India upto 1500m Fair High
Alhagi pseudalhagi WP Haryana, Rajasthan, Gujarat;
arid plains
Poor (VU) Low
Argyriea nervosa RT Throught India, sun-hill
regions
Good Med
Azadirachta indica Panchang Maharashtra, Gujarat and
Madhya Pradesh
Good V. High
Bacopa monnieri WP Throught Indian plains Fair Med
Bambusa arundinacea Vanshlochan Gujarat, Assam Good Med
Bauhinia variegata STBK Central & South India; Uttar
Pradesh & Tamil Nadu
Good V. High
Bombax ceiba Mochras (GM) Throught India upto 1200m Fair High
Butea monosperma RT, FL West Bengal, Madhya
Pradesh and Rajasthan
Good V. High
Caesalpinia crista SD Throught India upto 1000m Good Med
Careya arborea STBK Rajasthan, Gujarat Good Med
Casearia esculenta STBK Madhya Pradesh, Gujarat Fair Low
Cassia fistula FR, LF Throught India upto 1250m Good High
Celastrus paniculata FR Throught India upto 1200m Good Med
Centella asiatica WP Throught India upto 1000m Good V. high
Chlorophytum spp. RT Western and Central India,
arid plains
Poor (VU) Med
Cocus nucifera FR
(Endosperm)
Kerala, Andhra Pradesh,
Karnataka and Gujarat
Fair High
Coleus forskoholii RT Kumaon hills (UA), 600-
1200m
Fair Med
Commiphora wightii GM Rajsthan, Gujarat, arid hills
and bet
V. Poor (EN) High
Crateva nuevala STBK, FR Saputara (Gujarat),
Maharashtra
Fair Mar
Desmodium
gangeticum
RT North and Central India, sub-
hills
Good Med
Dioscorea bulbifera RH Throught India, sub-hill
regions
Good Low
Dioscorea deltoidea RH J&K, HP. UA, 1500-2500m Poor (VU) V. high
Dolichandrone falcata STBK Western and Central India,
arid plains
Poor Mar
Emblica officinalis FR Northern and Central
India,upto 1000m
Good V. high
Fagonia cretica WP Haryana, Rajasthan, Gujarat,
arid plains
Fair Mar
Ficus benghalensis BK, HB Northern and Central India,
upto 1000m
Good Med
Ficus racemosa STBK Northern and Central India,
upto 1000m
Good Med
Ficus tsiela STBK Banascatha (Gujarat) V. Poor Mar
Garcinia indica FR Maharashtra, Karnataka, W.
Ghats
Fair Med
Gloriosa superba RT/ SD Throught India upto 1000m Good (*) High
Gmelina arborea RT, BK, ST Sikkim, Assam and Central
India
Good V. High
Gymnema sylvestre LS/RT Andhra, Karnataka, TN,
Kerala Plains
Fair (*) Med
Helicteres isora FR Northern and Central India,
upto 1000m
Good mar
Hemidesmus indicus RT Karnataka, Kerala; Ghat,
Coastal forest
Fair (*) Med
Holarrhena STBK Throughout India, Sub-hill Good High
Page 77
JOURNAL OF PLANT DEVELOPMENT SCIENCES Vol. 6 (3) 431
antidysenterica regions
Leptadenia reticulata RT Gujarat, Rajasthan,
Maharashtra, arid plains
Fair High
Limonia acidum FR Gujarat, Rajasthan Fair Med
Madhuca indica FR, FL Bihar, UP, MP Good High
Madhuca longifolia FR/SD Central and South-eastern
India
Good High
Mallotus philippensis FR hair Throught India upto 1100m Good Med
Melia azedarach STBK Throught India upto 1800m Good V. High
Mimusops elengi STBK South India and North-
eastern
Fair High
Moringa concanensis STBK Throught India upto 1200m V. Poor (*) Med
Moringa oleifera STBK Billawar (J & K), Dhinodar
hill (Gujarat) and Ganjam
(Orissa)
Good V. High
Mucuna pruriens SD Throught India upto 1500m Fair High
Oroxylum indicum RT UP,Bihar, Gangetic Plains Good Low
Phoenix dactylifera FR Throught India upto 1500m Poor Low
Pongamia pinnata SD Throught India upto 1200m Fair Med
Pterocarpus
marsupium
WD UP, MP, Bihar, Jharkhand
and Chattisgarh
Fair Med
Putranjiva roxburghii RT, SD Gujarat, Maharashtra Fair Low
Pterocarpus
santalinus
WD Andhra, TN, Eastern Ghats,
Dry hills
V. Poor (EN) High
Rauwolfia serpentina RT Throughout India, sub-hill
regions
Fair (*) High
Santalum album Heartwood Mysore (Karnataka), Andhra
Pradesh and Tamil Nadu
V. Poor (*) V. High
Sapindus laurifolius FR Gujarat, Madhya Pradesh Fair Low
Semecarpus
anacardium
FR Tamil Nadu, Gujarat, Kerala Fair Low
Shorea robusta GM Madhya Pradesh, Gujarat V. Poor High
Sterculia urens GM Andhra, Maharashtra and
Gujarat
Good Med
Sterospermum
personatum
RT, BK Throught India upto 1500m Good Low
Strychnos potatorum SD Throught India upto 1000m Rare Low
Syzygium cumini SD Karnataka, Bihar, Gujarat and
Madhya Pradesh
Good V. High
Tamarindus indica FR Karnataka, Tamil Nadu,
Gujarat and Andhra Pradesh
Good Med
Tecomella undulata STBK West Rajasthan, Gujarat and
Maharashtra
Poor (VU) Med
Tectona grandis STBK, FR Central and Southern India Good High
Terminalia arjuna STBK Throught India upto 1000m Good Med
Terminalia bellirica STFR Throught India upto 600m Good Med
Terminalia chebula FR HP, UA, UP, Jharkhand and
MP upto 800m
Good V. high
Tinospora cordifolia ST Throught India upto 800m Good (*) V. high
Thespesia populnea STBK Coasts of Indian Peninsula
and in mangrove swamps
Fair Low
Vitex negundo LS/FR Throught India upto 1000m Good High
Woodfordia fruticosa FL Throughout India, foothills
upto 1500m
Good High
Wrightia tomentosa SD Throughout India, upto
1000m
Fair Mar
Zanthoxylum armatum FR J&K, HP, UA, Upto 800-
1300m
Poor (VU) Med
Page 78
432 VIKAS KUMAR, SREEJITH BABU, AMIT KUMAR REVALE, RAJESH KUMAR MEENA,
MANAS KUMAR RANJAN AND B.S. DESAI
Abbreviations and legends to tables 01 to 05.
Vegetative parts used: RT- Root; BK- bark; RTBK-
root bark; ST- stem; STBK- stem bark, LF- leaf; FL-
flower; FR- fruit; SD- seed; GM- gum,oleoresin;
WP- whole plant; HB- herb (aerial parts).
Resources: Good- No decline foreseen; Fair- May
decline if there is increase in current rate of
collection; Poor- Already declining; V. Poor-
Declining sharply and may exhaust shortly; Rare-
Almost exhausted in the wild; (*)- Declined in wild
but progressively cultivated.
Threat categories (IUCN): CR- Critically
Endangered; EN- Endangered; VU- Vulnerable.
Demand (in Drug & Pharmaceutical and export
industry): Mar (Marginal)- less than 100 MT per
annum (P.a.); Low- between 100 to 500 MT P.a. ;
Med (Medium)- 500 to 2500 MT P.a.; High- 2500-
5000 MT P.a.; V. High (Very High)- above 5000 MT
P.a.
Table 2: Medicinal Plants growing as weed or under run wild conditions in secondary forest scrub, fallow
agricultural land, orchards, organic dumps, along rail track or roads, in and around stagnant water bodies and
other waste places
Name of the plants Part used Main area of natural occurrence Resources Demand
1 2 3 4 5
Abution indicum WH, SD Throughout Indian plains Good Med
Acalypha indica WP Throughout Indian plains Good Mar
Achyranthus aspera WP Throughout Indian plains Good Low
Andrographis
paniculata
HB UP, Bihar, W. Bengal, Gangetic
plains
Fair (VU) (*) High
Boerhavia diffusa RT Throughout India, asending to
1000m
Good High
Calotropis gigantea RTBK West Rajasthan, Gujarat & South
India
Poor Mar
Cassia occidentalis SD Throught India upto 1200m Good Med
Cassia tora SD Throught India upto 1200m Good Med
Curculigo orchioides RT Throughout India, under mango
groves
Fair (VU) High
Cyperus rotundus Tuber Throught India upto 1200m Good High
Datura strantonium LS/SD W. Himalayas, Southern hills upto
1500m
Good Med
Eclipta prostrata WP Throughout India, moist & marshy
loc.
good High
Justicia adhatoda LF, WP Throught India upto 1800m Fair Low
Gymnema sylvestre RT/LS Andhra, TN & Kerala upto 1000m Fair Med
Lepidium sativum SD Throughout India,often cultivated Good Low
Mimosa pudica SD Northern & Central Himalayan
foothills
Fair Mar
Ocimum basilicum HB Throught India upto 1200m Fair Med
Ocimum canum SD Throught India upto 1000m Good High
Phyllanthus amarus HB Peninsular & South India, plains Good High
Psoralea crylifolia SD UP, Bihar, Chattisgarh, plains Fair (*) High
Solanum surattense WP/RT Throught Indian plains Good High
Sphaeranthus indieus
FL Bihar, Jharkhand, Chattisgarh, plains Fair Low
Tephrosia purpurea WP Northern & Western plains Good Low
Table 3: Plants cultivated as avenue trees, embankment stabilizers, hedges or ornamentals in parks and gardens
and yielding herbal raw materials
Plant Part Areas where cultivated Demand
Abution indicum SD Throughout India as flowering herb High
Acacia nilotica STBK/GM North, West & Central India on
embankments
High
Aegle marmelos RT/FR Throughout India, around temples &
villages
High
Alstonia scholaris STBK Throughout India as avenue tree Mar
Annona squomosa LF, SD Throughout India as flowering herb Med
Azadirachta indica LS/STBK/SD Throughout India as avenue tree High
Page 79
JOURNAL OF PLANT DEVELOPMENT SCIENCES Vol. 6 (3) 433
Cassia fistula FR (pulp) Throughout India as avenue tree High
Cassia occidentalis LF, SD Throughout India Med
Catharanthus roseus HB/RT Throughout India as flowering herb V. High
Clitorea ternatea FL/FR Southern & Eastern India as flowering
shrub
Mar
Clerodendron serratum RT Throughout India as flowering herb Med
Clerodendron
multiflorum
RT, LF Throughout India as flowering herb High
Commiphora wightii GM Throughout India V. High
Euphoebia nerifolia WP Throughout India as flowering herb Low
Gmelina arborea RT Throughout India as avenue tree Med
Helicteres isora FR Throughout India as flowering tree Low
Holarrhena
antidysenterica
BK, SD Throughout India as flowering tree Low
Lawsonia alba LF, SD Throughout India as flowering herb High
Moringa oleifera FR/SD Throughout India as avenue tree Med
Nyctanthes arbortristis LS,FL Throughout India as flowering tree Low
Saraca india STBK TN, Karnataka & Kerala as flowering tree High
Syzygium cumini SD Throughout India as avenue tree High
Terminalia arjuna LS, STBK Throughout India as avenue tree High
Thespesia populnea FL, FR As flowering tree in Indian gardens Low
Vitex negundo LF Gujarat, Madhya Pradesh, Karnaatakaa Low
Woodfordia fruticosa FL West Bengal, Gujarat Low
Xeromphis spinosa FR Andhra Pradesh, Western India Low
Zizyphus spp. RT Hotter parts of northern and peninsular
india
Med
Table 4: Plants grown as agricultural, horticultural or industrial or industrial crops and also yielding important
herbal raw materials
Plant Crop Medical part Demand
Allium sativa Garlic (Lahsun) Bulb/Oil V. High
Amorphophalus campanulatus Sooran Corm Mar
Anethum sowa Indian Dill (Sowa) Seed, Seed oil V. High
Carica papaya Papaya (Papita) Latex (Pepain) V. High
Cocos nucifera Coconut (Narial) Kernel,Oil High
Curcuma longa Turmeric (Haldi) Root High
Foeniculum vulgare Fennel (Saunf) Fruit Med
Lawsonia inermis Mehndi (Henna) Leaf High
Memordica charantia Karela Leaf, Seed Low
Ricinus communis Eranda (Castor) Root/Oil Med
Sesamum indicum Sesamum (Til) Seed/Oil High
Trichosanthes dioica Patol, Parval Leaf/Fruit Low
Trigonella foenum-graceum Fenugreek (Methi) Seed Low
Zingiber officinalis Ginger (Sonth) Rhizome V. High
Table 5: Plants cultivated exclusively as medicinal crop
Plant Part used Areas where cultivated Demand
Alpiania galanga Rhizomes Bhuj (Gujarat) Med
Aloe vera LF (Juice) Coastal areas of Saurashtra (Gujarat) V. High
Asparagus racemosus RT Anand (Gujarat) Med
Brassica nigra SD Waghai (Gujarat) High
Chlorophytum
boriwilianum
RT Waghai (Gujarat) V. High
Cichorium intybus SD Amreli (Gujarat) Low
Citrus medica FR Valsad (Gujarat) V. High
Curcuma zedearia Rhizomes Amreli, Mesana (Gujarat) Med
Cymbopogon martinii WP Anand (Gujarat) High
Dioscorea floribunda RH Dang (Gujarat) High
Page 80
434 VIKAS KUMAR, SREEJITH BABU, AMIT KUMAR REVALE, RAJESH KUMAR MEENA,
MANAS KUMAR RANJAN AND B.S. DESAI
Eucalyputus spp. LF, Oil South Gujarat V. High
Gloriosa superba RT/SD Dang (Gujarat) Med
Hibiscus rosasinensis FL Surat, Navsari (Gujarat) High
Mentha viridis WP Bhavnagar (Gujarat) V. High
Momordica charantia FR North and Central Gujarat Med
Nerium indicum RT Junagadh (Gujarat) Med
Piper longum FR, RT Surat, Navsari (Gujarat) V. High
Rauwolfia serpentina RH Navsari, Bhavnagar (Gujarat) Low
Ricinus communis RT, LF Surendranagar (Gujarat) Med
Trapa bispinosa FR Bharuch, Kheda (Gujarat) Low
Trichosanthus dioica WP Banaskantha (Gujarat) Low
Withania somnifera RT Ratanmahal (Gujarat) High
Zingiber officinalis HB Navsari, Bhavnagar (Gujarat) V. High
CONCLUSION
The observations made in the foregoing discussion
indicate that through there are problems facing the
medicinal plant raw material resource in Gujarat;
there is enough scope for its development to meet the
requirements of Drug and Pharmaceutical Industry.
Concerted multi-disciplinary efforts are required to
execute large scale production of materials from both
wild and cultivated sources. The augmentation and
supplies of raw materials obtained from the plants
growing in forests, specially those originated from
trees and shrubs, may better be left with the foresters
who may undertaken in-situ conservation, restocking
and forestation with desirable species. Medicinal and
aromatic plants play a very important role in the life
support systems and well being of mankind. In Dang
forest division there is an over-exploitation of forest
area specially the medicinal aromatic plant species
and a large number of species are endangered due to
a combination of over-harvesting and habitat
destruction. MAP’s are being overused and degraded
due to lack of local control over the resources, social
and cultural traditions. However, with the increase in
population and associated poverty in the present area,
people are compelled to over harvest resources for
commercial purpose and also for their traditional use.
Research and development studies on domestication
of wild plants and introduction on certain exotics
have been going on at a number of governments,
non-government and academic agencies since long
but the success in large scale cultivation could be
obtained in only a few cases. There appears to be a
lack of coordination among various workers and
between organizations engaged in the development
of medicinal plant resources as also between these
and the farmer who is the ultimate agency to
undertake the job and deliver the goods.
ACKNOWLEDGEMENT
The present study revealed was part of MSc. course
programme, funded by the Gujarat Ecology
Commission and assigned by Navsari Agricultural
University, Navsari, Gujarat (India). Authors also
thankful to all teaching faculty of College of
Forestry, specially thanks to Dr. S.K. Jha, Dr. S.K.
Sinha, Dr. N.S. Thakur and Dr. B.S. Desai, Assit.
Prof. of ACHF, Navsari because without him our
research work would not have been completed.
Summary
Gujarat has on floral diversity, 2205 species of
angiospermic plants belonging to 905 genera of 156
families have been recorded so far. Out of 2205 plant
species, 748 plants were identified as medicinally
important. The number of plant species yielding raw
materials used by the industry on regular basis and/or
in substantially large quantities is put at around 143.
Among these, 77 occur wild in forests or other forms
of natural vegetation, 23 grow as weed, 42 are grown
as cash crop for other plant based products and 22
are cultivated as medicinal crop. There has been a
tremendous increase in the production of herbal
medicines and other items in recent years. This paper
makes an appraisal of present status of raw material
resources and discusses prospects of its development.
Effects have been made to highlight the problems
encountered for necessary constraints and
conservation need to medicinal plants in Gujarat
state.
REFERENCES
Anon. (2002). Medicinal Plants of Gujarat (Draft
final report), GEER Fondation Gandhinagar, Gujarat
State Forest Department.India.
Asolkar, L.V. et al. (1992). Second Supplement to
Glossary of Medical Plants. (CSIR) NISCOM. New
Delhi.
Chaudhuri, P.K. and Thakur, R.S. (1994).
Gloriosa superba: A review. curr. Res. Med. Arom.
Plants, 16(1):51-64.
Chopra, R.N. et al. (1956). Glossary of Indian
Medicinal Plants, CSIR, New Delhi.
Chopra, R.N. et al. (1974). Supplement to Glossary
of Indian Medicinal Plants, CSIR, PID, New Delhi.
Dey, A.C. (1980). Indian Medicinal Plants Used in
Ayurvedic Preparations. Bishen Singh, Mahendra
Pal Singh, Dehra Dun-24(8): 201. 202p.
Page 81
JOURNAL OF PLANT DEVELOPMENT SCIENCES Vol. 6 (3) 435
Dey, R.B.K.L. (1984). The indigenous drugs of
India. International Book Distributors, Dehradun.
India. 387p.
Farnsworth, N.R. and Soejarto, D.D. (1991).
Global importance of medicinal plants. Covservation
of medicinal plants (Akerala, D., Heywood, V. and
Synoge, H.,eds.). Cambridge University Press,
Cambridge, U.K.
FSI. (2009). Indian states of Forest Report, pp. 82-
85.
Husain, A. (1993). Medicinal Plants and their
cultivation. CIMAP, Lucknow, India. 460p.
Husain, A.; Virmani, O.P.; Popli, S.P.; Misra,
L.N.; Gupta, M.M.; Srivastava, G.N.; Abraham,
Z. and Singh, A.K. (1992). Dictionary of Indian
Medicinal Plants. CIMAP, Lucknow, India. 546p.
Jain, S.K. (1991). Dictionary of Indian Folk Lore
Medicine and Ethno-botany. Deep Publications, New
Delhi.
Kala, C.P. (2005). Indigenous uses, population
density, and conservation of threatened medicinal
plants in protected areas of the Indian Himalayas.
Conservation Biology, 19:368-378.
Kaul, B.H. and Singh, C. (1995). Datura. In Chadha
K. L. and Gupta, R. (Ed.). 1995.
Kaushik, P. and Dhiman, A.K. (1999). Medicinal
Plants and Raw Drugs of India. Bishen Singh
Mahendra Pal Singh, Dehradun.
KIT. (2003). Cultivating a Healthy Enterprise. In
Bulletin 350 Royal Tropical Institute, Amsterdam,
The Netherlands.
KIT. (2004). Searching Synergy. In Bulletin 359
Amsterdam: Royal Tropical Institute.
Kurup, P.N.V.; Ramdas, V.N.K. and Joshi, P. (1979). Handbook of Medicinal Plants. New Delhi.
Mariappan, V. (1995). Neem for the Management of
Crop Diseases. Associated Publishing Company,
New Delhi. pp.220.
Nadkarni, A.K. (1954). Indian Materia Medica,
Bombay.
NRF. (1998). Nagarjuna Research Foundation.
Chengazhuneer Kizhangu. Express week dt. 2/5/98.
Olsen, C.S. and Larsen, H.O. (2003). Alpine
medicinal plant trade and Himalayan mountain
livelihood strategies. The Geographical Journal,
169:243.
Pandey, G.S. and Chunekar, K.C. (1995).
Bhavaprakash Nighantu. Chaukhamba Acad.,
Varanasi.
Parmar, B.S. and Ketkar, C.M. (1993).
Commercialisation. In Neem Research and
Development (Randhava, N. S. and Parmar B. S.),
SBS publication No.3, Society of Pesticide Science,
India. pp 270-283.
Prajapati, N.D.; Purohit, S.S.; Sharma, A.K.;
Kumar, T. (2003). A Handbook of Medicinal Plants.
Jodhpur: Agrobios.
Prakash, K.S. (1997). Indian Ginseng. Science
Express dt. 17.06.97, p.8.
Pushpangadan, P.; Rajasekharan, S. and Biju,
S.D. (1993). Vep. (Malayalam). Tropical Botanic
Garden and Research Institute, Palode, Kerala. p.64.
Raghupati, L. (2001). Conservation and Sustainable
use of Medicinal Plants. Cuurent Issues in
Himalayan Medicinal Plants. Gyanodya Prakashan,
Nainital,India.
Rajarajan, S. (1997). The secrets of Bael tree.
Science Express dt. 8.7.97, p.8.
Siivarajan, V.V. and Indira, Balachandran. (1994). Ayurvedic drugs and their Plant Sources.
Oxford and IBH Pub. Co., p.315.
Singh, B.M. and Gautam, P.L. (1997).
Bioresources of Medicinal and Aromatic Plants in
India, Their conservation and related Issues.
Kurukshetra, XLVI (3): 9-13.
Syamala, B. (1997). Asparagus- An antacid and
uterine tonic. Science Express dt. 1.7. p-8.
Tewari, D.N. (1992). Monograph on Neem
(Azadirachta indica A. Juss). International Book
Distributors, Dehra Dun, India.
Uma Devi. (1988). Identification and status survey
of medicinal plants of Gujarat, Ph.D. the submitted to
Dept. Of Biosciences, South Gujarat University,
Surat, Gujarat, India.
Warrier, P.K.; Nambiar, V.P.K. and Ramankutty,
C. (1993). Indian Medicinal Plants. Vol. 1. Orient
BlackSwan, Universities press, Madras.
Warrier, P.K.; Nambiar, V.P.K. and Ramankutty,
C. (1995). Indian Medicinal Plants. Vol. 3. Orient
BlackSwan, Universities press, Madras.
Page 82
436 VIKAS KUMAR, SREEJITH BABU, AMIT KUMAR REVALE, RAJESH KUMAR MEENA,
MANAS KUMAR RANJAN AND B.S. DESAI
Page 83
________________________________________________ Journal of Plant Development Sciences Vol. 6 (3) : 437-441. 2014
RESPONSE OF PHOSPHORUS AND WEED CONTROL MEASURES ON YIELD
AND YIELD CONTRIBUTING CHARACTERS OF CHICKPEA
(CICER ARIETINUM L.)
Prem Nath1, Satendra Kumar
2, J.K. Verma
3, Amar Nath
4 and Arvind Kumar
5
Department of Agronomy, Narendra Deva University of Agriculture and
Technology Kumarganj, Faizabad 1Email: [email protected]
Abstract: The field experiment was conducted during the rabi season of 2005-06 at Agronomy Research Farm at Narendra
Deva University of Agriculture and Technology, Narendra Nagar (Kumarganj) Faizabad, U.P. to, study the “Effect of
phosphorus and weed control measures on growth and yield of chickpea (Cicer arietinum L.)” variety udai (KPG-59).
Sixteen-treatment combinations comprised of four levels of phosphorus (control, 20, 40 and 60 kg P2 O5 ha-1 ) and four
treatment of weed control measures (weedy check, Hand weeding at 30 DAS, pendimethline at 1 kg ha-1 and rice straw
mulch) were tested in Randomized Block design with three replications . Growth and yield attributes as well as root length,
number of take were affected significantly due to increase the phosphorus levels. However, weed density and weed dry
weight were decreased significantly with increasing levels of root nodules and nodules dry weight, nitrogenase activity and
nitrogen and phosphorus up phosphorus. Among the weed control measures, hand weeding at 30 DAS found promising to
reduce the weed density as well as weed dry weight. Hand weeding at 30 DAS proved its superiority over other methods of
weed control in respect of all the growth characters and yield attributes as well as grain and straw yield of chickpea crop
followed by pendimethline at 1.0 kg ha-1. On the basis of economics the highest net return was recorded under the effect of
Hand weeding at 30 DAS alone has been found most remunerative which was recorded the highest net income rupee
invested of Rs 3.52
Keyword: Chickpea, phosphorus levels, weeds control measures
INTRODUCTION
he pulses in the dietary to the mankind make
high edible protein which contains essential
amino acid to meet the optimum protein requirement
of vegetation population. The pulses fix the
atmospheric nitrogen into the soil thereby enriching
the soil with nitrogen at no extra cost among the
winter season pulses. Chickpea has diversified use
such as dal, basan, fresh green seeds for vegetable
and fresh green leaves for sag for human
consumption and feeding to animals. It is considered
to have medicinal effect and it is used for blood
purification, chickpea contains 18- 22 % protein, 52-
70 % carbohydrate, 4- 10 % fat and sufficient
quantity of minerals and vitamins. Besides, being a
rich source of protein it is also considered important
for sustainable agriculture, improves the physic-
chemical characteristics and biological properties of
soil and function as mini nitrogen factory. Chickpea
(Cicer arietinum L) is one of the important pulse
crops of rabi season. The chickpea is grown in India
on an area of 8.81 mha, with production of 6.68
mt.which amounts 65 and 68 per cent of the global
area and production respectively (Ali et al., 2003). In
Uttar Pradesh, it is cultivated on an area of 868 lakh
hectares with an annual production of 828.4 lakh
tones. Thus, the average productivity of chickpea in
Uttar Pradesh is very low out of several reasons for
low productivity, soil fertility status and inadequate
weed management may be considered are major
constraints. Phosphate fertilization of chickpea of
promotes of growth nodulation and enhance yield.
Phosphorus imparts hardiness to shoots, improves
grain quality, regulate the photosynthesis govern
physio-biocamical processes and also helps in root
enlargement, nodule production and there by
increases nitrogen fixation. Weed control is achieved
through direct methods and by adopting indirect
methods such as altered land preparation, soil
moisture regulation, planting methods and fertility
management, manual weeding at 25 and 40 days
after sowing increased seed yield of chickpea by 170
per cent over weedy check (Shekhawat and Sharma,
1988). Mulch also increased the grain yield and straw
yield of Gram as reported by (Chaudhary et al.
2003).
MATERIAL AND METHOD
The field experiment was conducted during rabi
season, 2005-2006 at Agronomy Research Farm of
Narendra Deva University of Agriculture and
Technology, Narendra Nagar (Kumarganj) Faizabad
(U. P.) India. The field study was planned and layout
in randomized block design. Chickpea was sown in
second fortnight of October and was harvested in the
second fortnight of March. The soil of the
experimental field was poor in available nitrogen and
medium in phosphorus and potassium with alkaline
in reaction. The organic carbon content in the soil
was 0.34 per cent. During crop season, the maximum
T
1&
3 Ph.D. Scholar,
5M.Sc.(Ag), Department of Agronomy,
2Associate Professor, Department of Soil Science,
S.V.P. University of Agriculture and Technology Meerut, 4Lecturer (Soil Science) KNIPSS, Sultanpur
Page 84
438 PREM NATH, SATENDRA KUMAR, J.K. VERMA, AMAR NATH AND ARVIND KUMAR
temperature varied from 21.80C to 35.0
0C. The
maximum rainfall of 24.2 mm was recorded in the
month of October and total rainfall received during
the crop period was 69.5 mm. The sunshine hours
ranges from October 2.6 to 9.9 hours. Relative
humidity was the maximum 78% in the month of
October respectively. Chickpea variety Udai (KPG-
59) was sowing in furrows opened by Kudal at the
spacing of 30 cm apart using 80 kg seed ha-1
. Soil of
the experimental site has been classified as sandy
loam and field was drained and leveled. Soil samples
were collected at random from different parts of
experimental field (16 places) with the help of a soil
auger to a depth of 0-22.5 cm prior to the fertilizer
application. The collected soil samples were mixed
together and a composite sample was drawn and
analyzed. A basal dose of 20 kg nitrogen through
urea was applied uniformly to all plots. The
observations pertaining to yield and yield contributes
were recorded at harvest. Weed population was
studied with the help of a quadrate (50cm x 50cm)
placed in second row in the different corners of the
plot in different observations. The populations counts
were taken at different stages of crop growth i.e. 30,
60, 90 DAS and at harvest sampled plants were dried
in sun and subsequently into oven at 700C till
constant weight were obtained.
RESULT AND DISCUSSION
Growth attribute
Plant height : Phosphorus levels per hectare and
weed control measures markedly influenced the plant
height at all the crop growth stages in the year (Table
1). The plants grow slowly up to 60 days and there
after a fast growth rate was observed up to 90 days
stage. Plant height was affected significantly by
different phosphorus levels, except at 20 kg P2O5 ha-1
(P1) at all the stages of crop growth except 30th
and
60th
day stages. At30th
and 60th
day stages plant
height was recorded at par due to various phosphorus
levels. Among all the phosphorus treatments, higher
plant height was recorded at w0(P3) at all the stages
and lowest with control (P0). Phosphorus 60 kg P2O5
ha-1
(P3) recorded significantly higher plant height on
all the lower levels of phosphorus at 90 and at
harvest stages of crop growth.
The effect of different weed control measures on
plant height is depicted. Plant height was affected
significantly due to various weed control measures at
all the stages of crop growth, except at 30th
day crop
stage. Among all the weed control treatments, height
was recorded in mulch (w3) and lowest in weedy
check (w0) treatments at all the stages of crop
growth. All the weed control measures did not
observe significant difference as compare to weedy
check (w0) at all the stages. Hand weeding (w1) and
pendimethaline @1.0 kg ha-1
(w2) being at par with
weedy check (w0) at 90 day of crop growth. Mulch
(w3) recorded significantly higher plant height as
compare to all the weed control measure at all the
stages of crop growth except at 30 day stage.
Dry matter accumulation plant-1
(g) Phosphorus levels per hectare and weed control
measures markedly influenced the dry matter
accumulation (gm.) at all the crop growth stages in
the year (Table 2). In general, dry matter
accumulation increased with increased with
increasing in crop age. Lower doses of phosphorus
resulted in substantially less dry matter as compared
to all other treatments. Phosphorus at 20 kg P2O5 ha-1
(P1) being at par with other higher level of
phosphorus at 30th
and at harvest recorded
significantly more crop dry matter as compared to
weedy check (w0 ). Phosphorus 40 kg P2O5 ha-1
(P2)
being at par with 60 kg P2O5 ha-1
(P3) recorded
significantly more crop dry matter as compared to
lower phosphorus levels at 60 DAS. At 60 kg P2O5
ha-1
(P3) recorded significantly more crop dry matter
as compared to lower phosphorus levels at 90 DAS.
Among weed control measures, weedy check (w0)
resulted in significantly less dry matter accumulation
as compared to all other treatments, at all the stages
of crop growth. All the weed control measures being
at par resulted in significantly higher dry matter
accumulation at all the stages of crop growth as
compared to weedy check (w0).
Yield attributes
Number of pods plant-1
: The number of pods plant-1
was affected significantly by different phosphorus
levels of phosphorus. Among all the phosphorus
levels, highest number of pods plant-1
was recorded
at 60 kg P2O5 ha-1
(P3) which was significantly higher
as compare with all lower levels, varying weed
control measures recorded more number of pods
plant-1
as compared to weedy check. Among weed
control measures, hand weeding (W1) being at par
with pendimethaline 1.0 kg ha-1
(W2) recorded
significantly higher number of pods plant-1
as
compare to mulch (W3) and weedy check (W0)
treatments.
Number of grains pod-1
: Number of grains pod-1
was affected significantly by different phosphorus
levels. Among all phosphorus levels, maximum
number of grains pod-1
was recorded at 60 kg P2O5
ha-1
(P3) which was significantly higher as compare
to other lower levels. All the weed control measures
resulted in significantly higher number of grains pod-
1 as compared to weedy check (W0) where all the
weed control measures found at par.
Grain weight plant-1
: The perusal of data revealed
that phosphorus at 60 kg P2O5 ha-1
(P3) recorded
significantly higher grain weight plant-1
as compare
to lower levels of phosphorus. It is evident from the
data given in table-1 that different weed control
measurers did not influence the grain weight plant-1
significantly.
Page 85
JOURNAL OF PLANT DEVELOPMENT SCIENCES Vol. 6 (3) 439
Test weight (100 grain weight (g): It is evident
from the data given in table -1 that different level of
phosphorus and weed control measures did not
influence the test weight significantly.
Number of pods plant-1
, number of grains pod-1
and
grain weight plant-1
only were influenced
significantly by various levels of phosphorus and
weed control measurers (table-1). Phosphorus at 60
kg P2O5 ha-1
(P3) recorded significantly higher
number of pods plant-1
, number of grains pod-1
and
grain weight plant-1
than lower levels of phosphorus.
These treatments may provide sufficient phosphorus
for the growth of crop as well as yield contributing
characters like number of pods plant-1
, number of
grains pod-1
and grain weight plant-1
. saraf et al.,
(1997), Saini and Faroda (1998), Amar Nath et al.
(2004), Meena et al. (2006) reported similar result.
Effect on yield: The perusal of the data revealed that
phosphorus 40 kg P2O5/ha (P2) being at par with 60
kg P2O5/ha (P3) resulted in significantly higher grain
yield as compared to lower phosphorus levels.
Among weed control measures, weedy check (W0)
resulted significantly less grain yield as compared to
rest of the treatments. Among weed control
measures, hand weeding (W1) showed significantly
higher grain yield as compared to other weed control
measures. The perusal of the data revealed that
phosphorus 40 kg P2O5/ha (P2) being at par with 60
kg P2O5/ha (P3) resulted in significantly higher straw
yield as compared to lower phosphorus levels. The
control (P0 recorded) the significantly less straw
yield among all the treatments. Among weed control
measures, weedy check (W0) resulted in significantly
less straw yield as compared to all other weed control
measures while hand weeding (W1) treatments being
at par with pendimethaline 1.0 kg/ha (W2) showed
significantly higher straw yield as compared to other
weed control measures. The different levels of
Phosphorus weed control measures did not influence
the harvest index of chickpea.
Phosphorus 40 kg P2O5/ha (P2) being at par with 60
kg P2O5/ha (P3) was found most promising and
significant increase in the grain yield of crop as
compared with other phosphorus treatments. The
positive response of chickpea crop to phosphorus 40
kg P2O5/ha (P2) in most of the yield contributing
characters has reflected to obtaining higher grain
yield (table-2). This may also be due to provide
sufficient phosphorus for required growth factors
under these treatments resulted in higher grain yield.
Similar result also reported by Parihar (1990), Enania
and Vyas (1995), Saraf et al. (1997). Bahadur et al.
(2002), Meena et al. (2003), Amar Nath et al. (2004),
Pyare and Dwivedi (2005), Khan et al. (2005),
Meena et al. (2006).
Table 1: Effect of phosphorus and weed control measures on weed density (m-2
)
Crop growth stage (DAS)
Treatment 60 90 At harvest
Phosphorus (Kg P2O5/ha)
P0 6.61(44.25) 7.21(56.25) 6.44(44.75)
P1 6.25(39.50) 6.49(45.75) 5.24(29.25)
P2 5.22(27.50) 5.65(33.75) 4.55(22.00)
P3 4.90(24.25) 4.46(21.25) 3.83(15.75)
SEm± 0.01 0.20 0.21
CD (0.05) 0.29 0.58 0.60
Weed control measures
W0 6.59(44.25) 7.84(63.75) 6.45(44.25)
W1 5.21(27.50) 4.10(17.50) 3.56(13.25)
W2 5.49(30.75) 4.90(24.50) 4.25(18.50)
W3 5.69(33.00) 6.97(51.25) 5.81(35.75)
SEm± 0.10 0.20 0.21
CD (0.05) 0.29 0.58 0.60
Table-2: Effect of phosphorus and weed control measures on weed dry weight accumulation (g m-2
)
Treatment
Crop growth stage (DAS)
60 90 At harvest
Page 86
440 PREM NATH, SATENDRA KUMAR, J.K. VERMA, AMAR NATH AND ARVIND KUMAR
Phosphorus (Kg P2O5/ha)
P0 9.65 10.98 12.41
P1 8.06 9.13 10.34
P2 7.80 8.90 10.14
P3 7.44 8.48 9.94
SEm± 0.36 0.44 0.54
CD (0.05) 1.03 1.27 1.56
Weed control measures
W0 9.82 11.13 12.49
W1 7.73 8.49 9.77
W2 7.67 8.72 10.00
W3 7.67 9.16 10.57
SEm± 0.36 0.44 0.54
CD (0.05) 1.03 1.27 1.56
Table-3: Effect of phosphorus and weed control measures on yield contributing character of chickpea.
Treatment Number of pod-
plant-1
Number of grains
pod-1
Grain weight plant-1
Test weight (100 grain
weight (g)
Phosphorus (Kg P2O5/ha)
P0 35.04 1.40 9.30 19.25
P1 39.42 1.54 10.15 19.25
P2 44.00 1.55 10.50 19.35
P3 50.42 1.70 11.44 19.62
SEm± 1.25 0.04 0.24 0.18
CD (0.05) 3.62 0.12 0.68 NS
Weed control measures
W0 30.17 1.39 10.17 19.22
W1 49.92 1.65 10.48 19.59
W2 46.42 1.61 10.40 19.41
W3 42.37 1.54 10.34 19.37
SEm± 1.25 0.04 0.24 0.18
CD (0.05) 3.62 0.12 NS NS
Table-4: Effect of phosphorus and weed control measures on grain and straw yield and harvest index of
chickpea.
Treatment Grain yield (q/ha) Straw yield (q/ha) Harvest index (%)
Phosphorus (Kg P2O5/ha)
P0 16.19 24.09 40.01
P1 19.26 26.94 41.21
P2 21.28 30.75 41.74
P3 22.93 31.42 42.61
SEm± 0.67 0.93
CD (0.05) 1.94 2.67
Weed control measures
Page 87
JOURNAL OF PLANT DEVELOPMENT SCIENCES Vol. 6 (3) 441
W0 17.15 24.5 40.21
W1 22.24 31.52 41.99
W2 20.88 29.38 41.06
W3 19.38 27.8 40.86
SEm± 0.67 0.93
CD (0.05) 1.94 2.67
P0- 0 kg P2 O5, P1- 40 kg P2 O5, P3- 60 40 kg P2 O5,
W0- weedy check, W1- Hand weeding 30 DAS, W2-Pendimethalin 1.0 kgha-1
(pre-Em.),W4- Rice straw mulch 5
cm thick (post Em.)DAS- Days After Sowing.
CONCLUSION
It may be concluded that for achieving higher yield
and better weed management of the chickpea, the
crop may be fertilized with 40 kg P2O5 ha-1
and
weeded manually at 30 days after sowing.
REFERENCES
Ali, M. Kumar, S. and singh N.B. (2003). Chickpea
research of India. Indian. Institute of Pulse Res.,
pp.99-118.
Amar Nath, Tripathi,P.N. and Rajkumar (2004).
Effect of nitrogen, phosphorus and Rhizobium
inoculation on growth, yield, nutrient uptake and
quality of fababean.Ann. Pl. soil Res. 6 (1):95-96.
Bahadur, M.M., Ashrofuzaman, M. Kabir, M.A.,
Chaudhary, M.F. and Majumdar, D.A.N. (2002).Response of chickpea varieties to different
levels of phosphorus.Crop Res., Hisar23 (3): 293-
299.
Chaudhary, R.S., Patnaik, U.S. and Das,A. (2003).
Efficacy at mulches in covering monsoonal moisture
for rabi crops. J. Indian society of soil sciences, 51
(4): 495-498.
Enania, A.R. and Vyas, A.K. (1995).Response of
chickpea (Cicerarietinum L.) to phosphorus and zink
fertilization in calcareous soil of Rajasthan.Indian
J..Agron. 40 (4): 704-706.
Khan, M.S.S., Abdul, L., Muhammad, R., Tahir,
S. andLatufat, P. (2005).Effect of seed inoculation
and phosphorus fertilizer on yield of chickpea in
semi-arid areas of NWFP.Indian J. plant Sci., 4 (4):
591-594.
Meena, L.R., Singh, R.K. and Gautam, R.C. (2003). Yield and nutrient uptake of chickpea
(Cicerarietinum L.) as influenced by moisture
conservation practices, phosphorus levels and
bacterial inoculation.Legume, Res. 26 (2) 109-112.
Meena, L.R., Singh, R.K. and Gautam, R.C. (2006). Effect of moisture conservation practices,
phosphorus levels and bacterial inoculation on
growth and economics of chickpea (Cicerarietinum
L) Legume, Res. 29 (1):68-72.
Parihar, S.S. (1990). Yield and water requirement of
chickpea (Cicerarietinum L) as influenced by
irrigation and phosphorus.Indian J. Agron. 35 (3):
251-257.
Pyare, Ram and Dwiwedi, D.P. (2005). Yield
economics and quality of chickpea (Cicerarietinum
L.) as affected by row spacing and phosphorus doses
under limited irrigation.
Saraf C.S., Shiva Kumar,B.G. and patil, R.R. (1997). Effect of phosphorus, sulphur and seed
inoculation on performance of chickpea
(Cicerarietinum L.).Indian J. Agron. 42 (2): 323-328.
Saini, S.S. and Faroda, A.S. (1998).Response of
chickpea (Cicerarietinum L.) genotype H.86-143 to
seed rates and fertility levels.Indian J.. Agron.43 (1):
90-94.
Shekhawat, M.S. and Sharma, P.K. (1988).Chemical weed control in chickpea.Indian J.
weed sci. 20 (2): 102-103.
Page 88
442 PREM NATH, SATENDRA KUMAR, J.K. VERMA, AMAR NATH AND ARVIND KUMAR
Page 89
________________________________________________ Journal of Plant Development Sciences Vol. 6 (3) : 443-446. 2014
VARIABILITY AND GENETIC PARAMETERS FOR GRAIN YEILD AND ITS
QUALITY ATTRIBUTES IN CMS BASED RICE HYBRIDS (ORYZA SATIVA L.)
Madhuri Grace Minz, Deepak Sharma, Alice Tirkey, Fakeer Chand Sao, Laxmi Singh and
Hadassah Ch.
Department Genetics and Plant Breeding,College of Agriculture, Raipur-492012 (Chhattisgarh) Abstract: The present investigation is carried out to the genetic parameters for yield and its quality attributes in eighteen rice
hybrids. Analysis of variance revealed significant differences for all traits under study. The characters viz. biological yield
per plant(g), grain yield per plant(g), number of unfilled spikelet/plant, number of filled spikelet/plant, productive
tiller/plant, spikelet fertility%, pollen fertility %, kernel length breadth ratio and harvest index. High GCV and PCV were
recorded for traits viz., followed by biological yield/plant, grain yield/plant, number of unfilled spikelet/plant, number of
filled spikelet/plant, productive tiller/plant, spikelet fertility%, pollen fertility%, kernel length breadth ratio and harvest
index. High heritability coupled with high genetic advance as percent of mean was registered for grain yield/plant(g),
number of unfilled spikelet/panicle, number of filled spikelet/panicle, productive tiller/plant, tiller/plant, spikelet fertility %,
pollen fertility %, kernel length breadth ratio, harvest index, brown rice length breadth ratio, flag leaf area(cm2), hundred
seed weight(g), plant height(cm), head rice recovery percentage, flag leaf length(cm), kernel length(cm), brown rice(cm),
leaf area index, paddy length breadth ratio, paddy breadth(cm) suggesting preponderance of additive gene action in the
expression of these characters.
Keywords: Variability, Heritability, Genetic advance, Hybrid rice
INTRODUCTION
ice is one of the most important cereal crops of
the world meeting the dietary requirements of
the people living in the tropics and sub-tropics.
Quantum jumped in yield improvement has been
achieved in rice with the development of high
yielding heterotic hybrids under commercial
cultivation. However, being the staple food of the
population in india, improving its productivity has
become a crucial importance. Knowledge on the
nature and magnitude of genetic variation governing
the inheritance of quantitative characters like yield
and its components is essential for effecting genetic
improvement. A critical analysis of genetic
variability is a prerequisite for initiating any crop
improvement programme and for adopting of
appropriate selection techniques.(Ravindra et
al.,2012).
A paradigm shift in the rice (Oryza sativa L.)
breeding strategies from quantity centered approach
to quality oriented effort was inevitable, since India
has not only become self sufficient in food grain
production but also is the second largest exporter of
quality rice in the world (Sreedhar et al.,2005).
Improvement in grain quality that does not lower
yield is the need of hour at present context in order to
benefit all rice grower and consumers. Like grain
yield, quality is not easily amenable to selection due
to its complex nature. Lack of clear cut perception
regarding the component traits of good quality rice is
one of the important reasons for the tardy progress in
breeding for quality rice varieties. For the
development of high yielding varieties with good
quality the information on variability and genetic
parameters of grain quality attributes and their
association with each other including grain yield is
necessary to formutate suitable breeding strategies
for grain quality improvement. In the present
investigation, an attempt has been made to elucidate
information on nature and magnitude of genetic
variation observed for yield and yield component and
quality attributes in certain parents and rice
hybrids.(Venkata Subbaiah et al., 2011).
MATERIAL AND METHOD
The experimental material used in the study
consisted of nine parents and 18 F1 hybrid
combinations of rice grown in a completely
randomized block design with two replications at
Research Farm, Department of Genetics and Plant
Breeding, Indira Gandhi Krishi Vishwavidyalaya,
Raipur, Chhattisgarh. About 21 days old seedling of
each genotype were transplanted in single row a
standard spacing 20 × 20 cm was adapted for
planting and ten plants were planted. Single plant per
hill was planted. Recommended package of practices
were followed during the crop growth period.
The treatment means for all the characters were
subjected to analysis of variance technique on the
basis of model proposed by Panse and
Sukhatme(1961).The genotypic (GCV) and
Phenotypic (PCV) coefficient of variation was
calculated by the formulae given by Burton
(1952).Heritability in broad sense[h2
(b)] was
calculated by the formula given by Lush (1940) as
suggested by Johnson et al.(1955). From the
heritability estimates, the genetic advance (GA) was
estimated by the following formula given by Johnson
et al. (1955).
RESULT AND DISCUSSION
Analysis of variance revealed the significant
differences among the genotypes for all the traits
R
Page 90
444 MADHURI GRACE MINZ, DEEPAK SHARMA, ALICE TIRKEY, FAKEER CHAND SAO, LAXMI SINGH
AND HADASSAH CH. indicating the sufficient scope for further
improvement (Table 1 and 2).The range of mean
variation observed among yield components and
kernel quality characters in parents revealed that
highest range of mean variation was noticed for
biological yield per plant and head recovery rice%,
whereas the range was found to least for hundred
seed weight and elongation ratio, respectively(Table
1 and 2).
The PCV estimates were higher than GCV for all the
traits, indicating the influence of environment for the
expression of these traits. The difference between
PCV and GCV estimates were relatively low for
traits viz., days of 50% flowering, panicle
length(cm), hulling %, milling %, paddy length(cm),
brown rice length(cm), brown rice breadth(cm),
kernel length(cm), elongation ratio(cm) indicating
less environmental influence on these traits. The
characters viz., tiller per plant, productive tiller per
plant, no. of filled spikelet per panicle, no. of unfilled
spikelet per panicle, spikelet fertility %, pollen
fertility %, biological yield per plant(g), grain yield
per plant(g), harvest index, kernel length breadth
ratio, showed higher estimates of GCV and PCV
therefore, simple selection can be practiced for
further improvement of these characters. This was in
conformity with the finding of Sharma et al.(2006)
for total number of productive tillers per plant and
Singh et al.(2000) for harvest index in rice. Moderate
estimates of PCV and GCV values were recorded for
plant height(cm), flag leaf length(cm), flag leaf
area(cm2), leaf area index, hundred seed weight(g),
head recovery rice %, paddy length(cm), paddy
breadth(cm), brown rice length breadth ratio, kernel
breadth(cm). These results were in consonance with
the findings of Kundu et al.(2008) for hundred seed
weight.
High heritability values were recorded for all the
characters except elongation ratio(cm) in the
generation indicating the least influence of
environment on expression of kernel quality
characters. These findings were in consonance with
the reports made earlier in rice by Kundu et al.
(2008) and Deepa Sarkar et al. (2006). High
heritability coupled with high genetic advance as per
cent of mean were recorded for plant height(cm),
tiller per plant, productive tiller per plant, flag leaf
length(cm), flag leaf area (cm2), leaf area index,
number of filled spikelet per panicle, number of
unfilled spikelet per panicle, spikelet fertility %,
pollen fertility %, hundred seed weight(g), biological
yield per plant(g), grain yield per plant (g), harvest
index, head recovery rice %, paddy breadth(cm),
paddy length breadth ratio, brown rice breadth(cm),
brown rice length breadth ratio, kernel breadth(cm),
kernel length breadth ratio, in case of hybrids
indicating the additive gene effects in the genetic
control of these traits and can be improved by simple
selection in the present breeding material. Similar
kind of observations were reported by Kundu et
al.(2008) for number of grains per panicle, Deepa
Sankar et al.(2006) for plant height, total number of
productive tillers per plant, number of grains per
panicle, test weight and grain yield per plant. The
present study revealed that, days of 50% flowering,
panicle length(cm), hulling %, milling %, paddy
length(cm), brown rice length(cm), brown rice
breadth(cm), kernel length(cm), elongation ratio(cm)
were less influenced by environment and high
heritability coupled with high genetic advance
indicating that most likely the heritability is due to
additive gene effects and selection may be effective
for these characters based on phenotypic values in
order to obtain maximum genetic gain for yield
improvement in rice by simple selection process.
Table 1: Analysis of variance for grain yield and its contributing characters in rice
Source of
variation
df DF PH TP PTP FLL FLA LAI PL
R
eplications
1 0.19 0.35 1.89 3.63 5.76 2.76 0.004 1.01
Genotypes 26 24.01** 449.41
**
26.78** 26.94** 31.34** 70.54** 1.420** 7.62**
Error 26 0.68 1.86 1.70 1.28 0.90 1.38 0.042 1.12
*Significant at P= 0.05 level;**Significant at 0.01 level
DF:Days of 50%Flowering; PH:Plant height; TP:Tiller per plant; PTP:Productive tiller per plant; FLL:Flag leaf
length; FLA:Flag leaf area; LAI:Leaf area index; PL:Panicle length
Source of
variation
df NFP NUP PF% SF% HW BY GY HI
Replications 1 322.63 263.88 1.27 0.79 0.00006
2
0.1 0.7 0.594
Genotypes 26 7479.6
7**
3525.33
**
631.59** 619.90*
*
0.33** 12023.1
**
1049.5*
*
138.150*
*
Error 26 69.01 84.68 5.15 4.63 0.02 1.4 0.5 0.60
*Significant at P=0.05 level;**Significant at 0.01 level.
Page 91
JOURNAL OF PLANT DEVELOPMENT SCIENCES Vol. 6 (3) 445
NFP:no.of filled spikelet per panicle; NUP:no. of unfilled spikelet per panicle; PF%:Pollen fertility %;
SF%:Spikelet fertility %; HW:Hundred seed weight; BY: Biological yield per plant; GY:Grain yield per plant;
HI:Harvest index.
Table 2: Analysis of variance for kernel quality characters in rice
Source of
variation
df H% M% HRR% PL PB PLBR BL BB
Replications 1 2.85 4.54 3.54 0.0025 0.00080 0.0060 0.00074 0.00017
Genotypes 26 7.65
**
18.99** 192.39** 0.5480*
*
0.13498
**
0.3249*
*
0.77322
**
0.13438*
*
Error 26 1.07 3.74 14.07 0.0019 0.00036 0.0004 0.00060 0.00019
*Significant at P=0.05 level;**Significant at 0.01 level.
H%:Hulling %; M%: Milling %; HRR%:Head recovery rice%; PL:Paddy length;
PB:Paddy breadth; PLBR:Paddy length breadth ratio; BL:Brown rice length; BB:Brown rice breadth.
Source of
variation
df BLBR KL KB KLBR ER
Replications 1 0.00025 0.0048 0.0008 0.00055 0.00857
Genotypes 26 0.78951** 0.4016** 0.1400** 1.060** 0.03172**
Error 26 0.00084 0.0012 0.0016 0.00657 0.00998
*Significant at P=0.05 level;**Significant at 0.01 level.
BLBR:Brown rice length breadth ratio; KL:Kernel length; KB: Kernel breadth; KLBR:Kernel length breadth
ratio; ER: Elongation ratio.
Table 3: Estimation of genetic variability and genetic parameters for different charcters
Character GCV % PCV % h2
GA
Days of 50% flowering 3.61 3.71 94.5 7.23
Plant height (cm) 15.85 15.92 99.2 32.52
Tiller per plant 31.01 33.03 88.1 59.57
Productive tiller per plant 34.73 36.42 90.9 67.70
Flag leaf length (cm) 15.20 15.63 94.5 30.39
Flag leaf area (cm2) 18.84 19.21 96.2 37.96
Leaf area index 11.95 12.30 94.3 23.72
Panicle length (cm) 7.34 8.50 74.5 13.05
No. of filled spikelet per panicle 41.35 41.73 98.2 84.39
No. of unfilled spikelet per panicle 46.24 47.37 95.3 92.99
Spikelet fertility % 28.68 28.92 98.4 58.52
Pollen fertility % 24.34 24.52 98.5 49.74
Hundred seed weight (g) 18.74 19.82 89.4 36.20
Biological yield per plant (g) 69.66 69.66 100.0 143.35
Grain yield per plant (g) 54.25 54.27 99.9 111.71
Harvest index 21.07 21.16 99.1 43.21
Hulling % 2.28 2.62 75.5 4.08
Milling % 3.98 4.86 67.1 6.72
Head recovery rice % 16.21 17.44 86.4 31.02
Paddy length (cm) 5.93 5.95 99.3 12.03
Paddy breadth (cm) 10.82 10.79 99.5 21.20
Paddy length breadth ratio 10.97 10.84 97.6 22.17
Brown rice length (cm) 9.39 9.38 99.8 19.11
Brown rice breadth (cm) 12.81 12.80 99.7 25.24
Brown rice length breadth ratio 18.82 18.80 99.8 37.95
Kernel length (cm) 7.58 7.56 99.4 15.34
Kernel breadth (cm) 14.51 14.35 97.9 28.43
Kernel length breadth ratio 22.01 21.87 98.8 43.83
Elongation ratio (cm) 9.54 6.89 52.1 9.38
Page 92
446 MADHURI GRACE MINZ, DEEPAK SHARMA, ALICE TIRKEY, FAKEER CHAND SAO, LAXMI SINGH
AND HADASSAH CH. REFERENCES
A.Kundu, B.K.Senepati, A. Bakshi and
G.S.Mandal (2008). Genetic variability of panicle
characters in tall indica aman rice. Oryza. Vol
45(4):320-323.
C.L.Sharma, C.H Misra, Kumar Kamales and
V.N.Pathak (2006). Genetic variability for seed
yield and its components in rice (oryza sativa L.).
International Journal of Plant Science Research. Vol
33:1-4.
H.W.Johnson, H.F.Robinson and R.E.Comstock (1955). Estimation of genetic and environmental
variability in soybean. Agronomy journal.Vol
47:314-318.
J.L.Lush (1940). Intra-sire correlation and
regression of offspring in rams as a method of
estimating heritability of characters. Proceedings of
American Society of Animal Product. Vol 33:292-
301.
K.Singh, S.B.Mishra, and P.B. Jha (2000).
Variability studies and interrelationship of some
quantitative traits in boro rice. Oryza. Vol 37(3):187-
190.
P. Deepa Sankar, A. Sheeba and J.
Anbumalarmathi (2006). Variability and character
association studies in rice (Oryza sativa L.).
Agricultural Science Digest. Vol.26(3):182-184.
P.Venkata Subbaiah, M. Reddi Sekhar,
K.H.P.Reddy and N.P.Eswara Reddy (2011).
Variability and genetic parameters for grain yield and
its components and kernel quality attriburtes in CMS
based rice hybrids (Oryza sativa L.).International
Journal of Applied Biology and Pharmaceutical
Technology. Vol 2(3):603-609.
P. Veerabadhiran, M. Umadevi, and R. Pushpam (2009). Genetic variability, heritability and genetic
advance of grain quality in hybrid rice. Madras
Agricultural journal. Vol 96(1-6):95-99.
S. Sreedhar, S. Vanisree, N.Kulakarni and
M.Ganesh (2005). Gene effects for certain physical
quality traits and grain yield in rice. Madras
Agricultural Journal. Vol 92(4-6):183-187.
T Vanaja and C. Luckins and Babu. 2006.
Variability in grain quality attributes of high yielding
rice varieties (Oryza sativa L.) of diverse origin.
Journal of Tropical Agriculture. Vol 44(1-2):61-63.
V.G.Panse and P.V.Sukhatme (1961). Statistical
methods for agricultural workers. 2nd
Edition ICAR,
New Delhi.pp:361.
V. Ravindra Babu, K. Shreya, Kuldeep Singh
Dangi, G.Usharani, P.Nagesh (2012). General
variability studies for qualitative and quantitative
traits in popular rice(Oryza sativa L.) hybrids in
india. International journal of scientific and research
publications. Vol 12(6):1-5.
Page 93
________________________________________________ Journal of Plant Development Sciences Vol. 6 (3) : 447-449. 2014
IDENTIFICATION OF COLD TOLERANT GENOTYPESAT SEEDLING STAGE IN
RICE (ORYZA SATIVA L.)
S.K. Verma1*
, M.S. Xalxo1, R.R. Saxena
1 and S.B. Verulkar
2
1. Department of Genetics and Plant Breeding, IGKV, Raipur - 492 012
2. Department of Plant Molecular Biology and Biotechnology, IGKV, Raipur - 492 012
*Email: [email protected] Abstract: In Chhattisgarh, rice is also grown during summer season in about 2 lakh hectares, mainly in areas with canal
irrigation. Usually the productivity during summer is higher than Kharif season. However, in this season the sowing is
usually done in the month of December or January during which the minimum temperature is low, which results in poor
seedling establishment, stunting, yellowing and mortality. To overcome the problem of damage caused by low temperature,
rice breeders have been making efforts to develop more cold-tolerant cultivars mainly at seedling stage.In this study, 17
different genotypes, including commonly grown varieties, were screened under field condition during December-January
2011 and 2012 during seedling stage at Research cum Instructional Farm, IGKV,Raipur (C.G.). The minimum temperature
during this period was below 10oC at-least for a12 days. Lines were evaluated on 1-9 score according to SES of rice,
IRRI.GenotypesSamleshwari,Annadaand R-RF-75 showed dark green leaf colourwith score 1, while Sahbhagidhan and IR-
84887-B-15 exhibited yellowing of leaf with score of 9 and 7, respectively. The result of this study is discussed in context of
breeding value and practical significance from farmers’ point-of-view.
Keywords: Rice Oryza sativa L., cold tolerance, seedling stage screening
INTRODUCTION
ice is important crop grown in different sets of
condition. The optimum temperature for seed
germination and early seedling growth is from 25 to
350C. Early seedling stage is important for
subsequent growth. In India when rice is grown
during Rabi season, there have a problem of low
temperature.Chhattisgarh is popularly recognized as
rice bowl of the country as rice is the principal crop
of thisstate but also grown during summer season in
about 2 lakh hectares where canal is used for
irrigation. Productivity of summer rice is usually
more than Kharif season. During summer season
sowing is usually done in the month of December to
January, where minimum temperature is low.Under
low temperature conditions, some common injuries
include poor germination, seedling stunting,
yellowing or withering, reduced tillering, delayed
heading, and sterility (Kaneda and Beachell, 1974;
Mackill and Lei, 1997; Nakagahraet al.,
1997;Andaya and Tai, 2007). To overcome the
problem of damage caused by low temperature, rice
breeders have been making efforts to developmore
cold-tolerant cultivars at seedling stage, mainly in
context of off-season crop in Chhattisgarh. Selection
of high cold tolerance genotypes is the most effective
way to prevent damage of the low temperature.This
study was therefore undertaken to screen selected
genotypes under low temperature during seedling
stage.
MATERIAL AND METHOD
In this study seventeen rice genotypes (table 1),
including commonly grown varieties, were evaluated
under field conditions during December / January
2011-12 and 2012-13, in RCBD with three
replications at Research cum Instructional Farm,
IGKV, Raipur(210 16
’ N and 81
0 36’ E at altitude of
289.6 meter above sea level). One row of each
genotype was sown on raised nursery bed with row
length of 75 cm and spacing of 10 cm between rows.
The minimum and maximum temperature during this
period, along with soil temperature is presented in fig
1. Lines were evaluated on 1-9 score according to
SES of rice, IRRI. Observations were recorded when
Sahbhagidhan exhibited the score of 9, at about 20-
25 days old seedlings.
SCALE (for seedling stage) 1 Seedlings dark green
3 Seedlings light green
5 Seedlings yellow
7 Seedlings brown
9 Seedlings dead
RESULT AND DISCUSSION
The analysis of variance indicated significant
variation in the reaction of genotypes to low
temperature. The genotype by year interaction was
non-significant, which indicated that the performance
of the genotypes were almost same during both the
years. The minimum temperature during the
experiment reached up to 6OC for 4-6 days, which
could clearly discriminate the genotypes for reaction
to low temperature at seedling stage. Screening at
this temperature is very much relevant for
Chhattisgarh state as the crop during Rabi/Summer is
usually exposed to around this temperature only. The
overall reaction of genotypes to low temperature is
presented in table 1. A perusal of table 1 revealed
that Samleshwari, Annada and R-RF-75 were
tolerant with dark green leaf color, while
Sahbhagidhan and IR-84887-B-15 exhibited
R
Page 94
448 S.K. VERMA, M.S. XALXO, R.R. SAXENA AND S.B. VERULKAR
yellowing of leaf with score of 9 and 7,
respectively(See fig 2). Sahbhagidhan showed very
high susceptibility to cold and exhibited more than
90 percent seedlings mortality. IR-64, MTU 1010,
IBD-1, Vandana andPoornima exhibited score of 3.
Because of cold, germination of these genotypes
(except Swarna and Swarna Sub-1) were not affected
and cold injury was observed only after about 15 day
of germination.
The tolerant genotypes can be promoted among the
farmers for Rabi/Summer season cultivation.
Farmers can use these genotypes for cultivation
during Rabi/Summer where temperature is very low
at the time of nursery preparation. The inheritance of
cold tolerance has been reported to be quantitative in
nature (Andaya and Mackill, 2003; Kurokiet al.,
2007; Shirasawaet al., 2012), so the populations
should be developed from these reported tolerant and
susceptible genotypes for identification of QTLs and
markers for further MAS based selections.
Fig. 1 Minimum and maximum temperature of air and soil during experimentin 2012-13
IR-84887-B-15 Sahbhagidhan Samleshwari
Fig. 2 Genotypes and its interaction with cold
Table 1.Reaction of genotypes to low temperature
S. No. Name of Genotypes Mean Cold Score (2011-12) Mean Cold Score (2012-13)
1 Danteshwari 3.0 2.3
2 Dagaddeshi 2.7 3.0
3 Mahamaya 2.0 2.3
4 Annada 1.0 1.0
5 Vandana 3.0 3.0
6 Poornima 3.0 3.0
7 Swarna 4.3 4.3
8 SwarnaSub-1 3.6 4.3
9 R-RF-69 3.0 2.3
10 R-RF-75 1.0 1.0
11 IR-84887-B-15 7.0 7.0
12 IR-83381-B-B-55-4 2.3 2.3
13 Sahbhagidhan 9.0 9.0
14 MTU 1010 3.0 3.0
15 IR 64 3.0 3.6
16 Samleshwari 1.0 1.6
17 IBD-1 4.3 3.7
0
5
10
15
20
25
30
35
20/1
2/…
22/1
2/…
24/1
2/…
26/1
2/…
28/1
2/…
30/1
2/…
01/0
1/…
03/0
1/…
05/0
1/…
07/0
1/…
09/0
1/…
11/0
1/…
13/0
1/…
15/0
1/…
17/0
1/…
19/0
1/…
21/0
1/…A
ir T
emp
era
ture
(0C
)
Max
Min
0
5
10
15
20
25
30
35
20/1
2/…
22/1
2/…
24/1
2/…
26/1
2/…
28/1
2/…
30/1
2/…
01/0
1/…
03/0
1/…
05/0
1/…
07/0
1/…
09/0
1/…
11/0
1/…
13/0
1/…
15/0
1/…
17/0
1/…
19/0
1/…
21/0
1/…
Soil
Tem
pe
ratu
re (
0C
)
Max
Min
Page 95
JOURNAL OF PLANT DEVELOPMENT SCIENCES Vol. 6 (3) 449
REFERENCES
Andaya, V.C. and Mackill, D.J. (2003). Mapping
of QTLs associated with cold tolerance during the
vegetative stage in rice. J. Expt. Bot., 54: 2579-2585.
Andaya, V.C. and Tai, T.H. (2007). Fine mapping
of the qCTS4 locus associated with seedling cold
tolerance in rice (Oryza sativa L.). Molecular
Breeding,20(4): 349-358.
Kaneda, C. andBeachell, H.M. (1974). Response of
indica-japonica rice hybrids to low temperatures.
SABRAO J.,6: 17-32.
Kuroki, M.; Saito, K.;Matsuba, S.;Yokogami, N.;
Shimizu, H.; Ando, I. and Sato, Y. (2007). A
quantitative trait locus for cold tolerance at the
booting stage on rice chromosome 8. Theor. Appl.
Genet.,115:593-600.
Mackill, D.J. and Lei, X.M. (1997). Genetic
variation for traits related to temperate adaptation of
rice cultivars. Crop Science,37: 1340-1346.
Nakagahra, M.; Okuno, K. and Vaughan, D.
(1997). Rice genetic resources: history, conservation,
investigative characterization and use in Japan. Plant
Molecular Biology,35: 69-77.
Shirasawa, S.; Endo, T.; Nakagomi, K.;
Yamaguchi, M. and Nishio, T. (2012). Delimitation
of a QTL region controlling cold tolerance at booting
stage of a cultivar, ‘Lijiangxintuanheigu’ in
rice, Oryza sativaL.Theor. Appl. Genet., 124(5): 937-
946.
Page 96
450 S.K. VERMA, M.S. XALXO, R.R. SAXENA AND S.B. VERULKAR
Page 97
________________________________________________ Journal of Plant Development Sciences Vol. 6 (3) : 451-454. 2014
INFLUENCE OF ORGANIC AND INORGANIC FERTILIZERS ON GROWTH,
YIELD AND ECONOMICS OF POTATO CROPS UNDER CHHATTISGARH
PLAINS
Eshu Sahu, D.A. Sarnaik, P.K. Joshi, Pravin Kumar Sharma and Smita Bala Barik
Department of Horticulture, Indira Gandhi Krishi Vishwavidyalaya, Raipur (C.G.)
Email: [email protected]
Abstract: The field experiment was conducted at the All India Coordinated Research Project on Potato , Indira Gandhi Krishi
Vishwavidyalaya, Raipur, Chhattisgarh during Rabi 2013-2014 in factorial randomized block design with fifteen treatment
combinations consisting of different levels of RDF as (75%, 100% and 150% NPK) and different organic fertilizers as (FYM,
PSB and Azotobacter) were replicated three times. Among the inorganic fertilizer treatments 150% RDF performed better
over other treatments, while in case of organic fertilizer treatments PSB + Azotobacter was found superior than others. The
interaction between organic and inorganic fertilizers was found differ non significantly. The results indicated that the highest
gross return (Rs 271480 ha-1), net return (Rs 192827.52 ha-1) and benefit: cost ratio (Rs 2.45) was obtained under 150% RDF
with PSB + Azotobacter.
Keywords: Potato, fertilizers, biofertilizers, yield
INTRODUCTION
otato (Solanum tuberosum L.) is one of the most
important vegetable crops having high production
per unit area and time. It can fulfill the requirement of
food for human consumption to a greater extent. It is a
rich source of carbohydrates (22.6 g/ 100g) as well as
starch (16.3 g/ 100 g) and protein. It is good source of
raw material for processing industries.
Potato produce higher yield from lesser span of time
resulting soil exhausting very rapidly. The repeatedly
cultivation of potato needs profuse application of
nutrients, currently most of the nutrient requirements
have fulfilled through inorganic fertilizers. The
continuous application of inorganic fertilizers affects
the soil health adversely whereas combination of
inorganic and organic fertilizer or pure organic
fertilizers may maintain soil health properly and
subsequentely improve soil quality, health in
sustainable manner (Densilin et al., 2010).
MATERIAL AND METHOD
The experiment was conducted at the All India
Coordinated Research Project on Potato, Indira
Gandhi Krishi Vishwavidylaya, Raipur (C.G.), in
winter season of 2013-14 to study the influence of
organic and inorganic fertilizers on growth and yield
of potato under Chhattisgarh plains. Fertilizer was
applied in the three level F1- 75%, F2- 100% and F3-
150% RDF, nitrogen was applied in the form of urea
75%, 100% and 150% N, half at planting and the
remaining half 30 days after planting the first earthing
up. Phosphorus in the form of single super phosphate
and potassium in the form of muriate of potash were
applied as basal dose. The organic fertilizers were
also used as per treatments. In treatment O1- no
organic manure, O2 - FYM @ 20 t/ha, O3 - PSB@
5kg/ha, O4 – Azotobacter @ 5kg/ha and O5 -PSB @
5kg/ha + Azotobacter @ 5kg/ha. It was applied in
ridges and furrows area then tuberlets were
immediately planted in the field at spacing of 60 X
20cm. Data were taken on the plant emergence, plant
height, number of shoots, number of leaves, number
of stolons, no of tubers per plant, fresh weight and dry
weight of tubers per plant, marketable tuber yield and
total tuber yield.
RESULT AND DISCUSSION
Influence of inorganic fertilizers Results of investigation under inorganic fertilizer
treatments revealed that growth parameters like plant
emergence at 30 DAP (%), plant height (cm), number
of shoots plant -1
, number of compound leaves plant-1
,
fresh weight of shoot plant -1
, dry weight of shoot
plant -1
were influenced with the increased per cent of
RDF. The highest values for all the above
parameters were recorded under the treatment in
which 150% RDF was applied (F3) and lowest value
recorded under the treatments 75% RDF. Higher dose
of NPK significantly increased the plant height.
Nitrogen is an essential element for cell division, cell
enlargements and it increases the protoplasm.
Phosphorus has got direct impact on shoot growth and
root development whereas, potassium is one of the
important constituents of cell and helps to provide
resistance against disease and pests. Similar results
had also been reported by Al Moshileh et al. (2005),
Banafar et al. (2005), Alam et al. (2007), Singh et al.
(2007), Nag et al. (2008), Najm et al. (2010), Patel
et al. (2010), Yadu (2011) and Baishya et al. (2013).
Yield parameters like number of tubers plant -1
, fresh
weight of tubers plant -1
, dry weight of tubers plant -1
,
marketable tuber yield and total tuber yield were also
influenced with the increased per cent of RDF. The
highest values for all the yield parameters were
recorded under the treatment in which 150% RDF
was applied (F3) and lowest value recorded under
75% RDF.. This might be due to the optimum
vegetative growth with the application of higher level
P
Page 98
452 ESHU SAHU, D.A. SARNAIK, P.K. JOSHI, PRAVIN KUMAR SHARMA AND SMITA BALA BARIK
of RDF, which ultimately responsible for
accumulation of higher photosynthetes in the
developing tubers and produced higher fresh weight
of tubers per plant. The results are conformity with
the findings of Al-Moshileh et al. (2005) and Yadu
(2011) observed that with the increase in RDF
application from 50 to 150 % brought about 176 and
119% increase in marketable tubers, respectively over
the control.
Influence of organic fertilizers
Results of investigation under organic fertilizer
treatments revealed that growth and yield parameters
like plant emergence at 30 DAP (%), plant height
(cm), number of shoots plant -1
, number of compound
leaves plant -1
, fresh weight of shoot plant -1
, dry
weight of shoot plant -1
, number of tubers plant -1
,
fresh weight of tubers plant -1
, dry weight of tubers
plant -1
, marketable tuber yield and total tuber yield
were found highest under the treatment O5 (PSB @ 5
kg/ha+ Azotobacter @ 5 kg/ha) and lowest value
recorded under no organic manure. This may be due
to the application of biofertilizers (PSB and
Azotobacter). Azotabacter fixed the nitrogen and
increased the availability of nitrogen from soil, crop
residue, as it was associated with crop. As phosphorus
is very less available to plant due to its high fixation
in soil, the PSB increases the availability of soil P and
also increases the release efficiency of P from the
organic resource. Due to this a sufficient amount of P
is made available to plant, which increase the tuber
yield. Similar results have been reported by Singh et
al. (2002), Nag (2008) and Verma et al. (2011).
The interaction between organic and inorganic
fertilizers was found differ non significantly.
Economics
Table 3 indicates highest net return (Rs 192827.52/ha)
and B:C ratio (2.45) in treatment combination F3O5
followed by F3O4 with corresponding values of Rs
187312.52/ha and 2.38 respectively. The minimum
net return (Rs 63319.62/ha) and B:C ratio (0.93) was
calculated for F1O1. On the basis of the present
results, it can be stated that the combined application
of PSB @ 5 kg/ha+ Azotobacter @ 5 kg/ha has may
be the best approach among all the treatments to
increase tuber yield and therefore, economic return
for the farmer. It can, therefore, be concluded that the
biofertilizers (PSB and Azotobacter) are a beneficial
sources of nutrients for sustainable organic agriculture
in crop that requires, high amounts of nutrients, like
potato.
Table1: Influence of organic and inorganic fertilizers on growth parameters of potato crops
Treatments Per cent
emergence
at 30 DAP
Plant
height
(cm)
Number of
compound
leaves plant-1
No of
shoots
plant-1
Fresh
weight of
shoots
plant-1
(g)
Dry
weight of
shoots
plant-1
(g)
INORGANIC
FERTILIZER
F1 – 75 % RDF 89.33 36.52 42.61 4.93 91.30 13.09
F2 – 100 % RDF 91.48 40.03 48.91 5.11 96.35 13.42
F2 – 150 % RDF 94.77 46.51 53.61 7.08 111.41 17.87
SEM± 1.02 0.98 1.64 0.18 3.37 0.42
CD 2.97 2.85 4.75 0.53 9.75 NS
ORGANIC
FERTILIZER
O1 – No organic manure 88.11 36.27 40.90 4.48 86.33 11.47
O2 – Organic manure
(FYM) @ 20 t/ha 91.47 38.99
47.31 5.36 94.37 14.24
O3 – PSB @ 5kg/ha 90.55 41.21 48.43 5.81 99.46 14.65
O4 – Azotobacter @
5kg/ha 92.03 43.39
50.89 6.16 106.72 16.10
O5 – PSB @ 5 kg/ha+
Azotobacter @ 5 kg/ha 93.35
45.24 54.33 6.74 111.57 17.53
SEM± 1.32 1.27 2.12 0.24 4.35 0.54
CD NS 3.68 6.14 0.69 12.59 NS
INORGANIC X
ORGANIC
FERTILIZERS
SEM± 2.28 2.19 1.64 0.41 7.53 0.94
CD NS NS NS NS NS NS
Page 99
JOURNAL OF PLANT DEVELOPMENT SCIENCES Vol. 6 (3) 453
Table2: Influence of organic and inorganic fertilizers on yield parameters of potato crops
Treatments No of tubers
plant-1
Fresh
weight of
tubers
plant-1
(g)
Dry weight
of tubers
plant-1
(g)
Marketable
tuber yield
q/ha
Total
tuber
yield
q/ha
INORGANIC FERTILIZER
F1 – 75 % RDF 7.68 221.70 49.63 164.23 177.91
F2 – 100 % RDF 8.50 299.79 54.47 202.44 211.81
F2 – 150 % RDF 10.58 348.38 63.51 237.88 244.83
SEM± 0.19 14.20 1.91 6.09 6.18
CD 0.54 41.13 5.55 17.63 17.89
ORGANIC FERTILIZER
O1 – No organic manure 7.75 223.60 48.13 158.43 170.46
O2 – Organic manure (FYM) @ 20
t/ha 9.18 264.13 53.22 181.19 190.79
O3 – PSB @ 5kg/ha 7.50 300.50 55.24 210.20 220.20
O4 – Azotobacter @ 5kg/ha 8.84 316.51 59.80 226.06 234.54
O5 – PSB @ 5 kg/ha+ Azotobacter
@ 5 kg/ha 11.32 345.01 62.97 231.70 241.60
SEM± 0.24 18.33 2.47 7.86 7.97
CD 0.69 53.09 7.16 22.76 23.09
INORGANIC X ORGANIC
FERTILIZERS
SEM± 0.41 31.74 4.28 13.61 13.81
CD NS NS NS NS NS
Table 3: Economics of potato as influenced by different organic and inorganic fertilizer treatments
Treatments Yield
(q/ha)
Cost of cultivation per ha Cost per ha Sale
price
(Rs/q)
Net
returns*
(Rs/ha)
B:C
Ratio Seed Fertilizer Cultivation Inputs Produce
F1O1 131.29 40000 5232.08 22738.30 67970.38 131290 1000 63319.62 0.93
F2O1 172.87 40000 6976.12 22738.30 69714.42 172870 1000 103155.58 1.47
F3O1 207.22 40000 10464.18 22738.30 73202.48 207220 1000 134017.52 1.83
F1O2 155.37 40000 10232.08 22738.30 72970.38 155370 1000 82399.62 1.12
F2O2 183.61 40000 11976.12 22738.30 74714.42 183610 1000 108895.58 1.45
F3O2 233.37 40000 15464.18 22738.30 78202.48 233370 1000 155167.52 1.98
F1O3 191.25 40000 10457.08 22738.30 73195.38 191250 1000 118054.62 1.61
F2O3 223.00 40000 12201.12 22738.30 74939.42 223000 1000 148060.58 1.97
F3O3 246.34 40000 15689.18 22738.30 78427.48 246340 1000 167912.52 2.14
F1O4 205.88 40000 10457.08 22738.30 73195.38 205880 1000 132684.62 1.81
F2O4 231.99 40000 12201.12 22738.30 74939.42 231990 1000 157050.58 2.09
F3O4 265.74 40000 15689.18 22738.30 78427.48 265740 1000 187312.52 2.38
Page 100
454 ESHU SAHU, D.A. SARNAIK, P.K. JOSHI, PRAVIN KUMAR SHARMA AND SMITA BALA BARIK
F1O5 205.70 40000 10682.08 22738.30 73420.38 205700 1000 132279.62 1.80
F2O5 247.59 40000 12426.12 22738.30 75164.42 247590 1000 172425.58 2.29
F3O5 271.48 40000 15914.18 22738.30 78652.48 271480 1000 192827.52 2.45
REFERENCES
Al-Moshileh, A.M., Errebhi, M.A. and Motawei
M.I. (2005). Effect of various potassium and nitrogen
rates and splitting methods on potato under sandy soil
and arid environmental conditions.Emir. J. Agric.
Sci.17(1): 01-09.
Alam, M.N., Jahan, M.S., Ali, M.K., Ashraf, M.A.
and Islam, M.K. (2007). Effect of Vermicompost
and Chemical Fertilizers on Growth, Yield and
YieldComponents of Potato in Barind Soils of
Bangladesh. Journal of Applied Sciences Research,
3(12): 1879-1888.
Baishya, L.K., Gupta, V. K., Lal, S. S., Das, B.K.
and Kumar, M. (2013). Effect of biofertilizers on
growth and yield of potato in north eastern hills of
india. Potato J. 32: 3-4.
Banafar, R.N.S. Billore, M. and Kushwah, S. S. (2005). Integrated plant nutrition approaches for
potato. Potato J. 32: 3-4.
Densilin D.M., Srinivasan S., Manju P. and Sudha
S. (2010). Effect of Individual and Combined
Application of Biofertilizers, Inorganic Fertilizer and
Vermicompost on the Biochemical Constituents of
Chilli. Journal Biofertilezers & Biopesticides 2:104.
Nag, G.P., Sarnaik, D.A., Verma, Satish K. and
Tamrakar S.K. (2008). Integrated nutrient
management in potato for Chhattisgarh plains. The
Orissa J. of Horticulture, Vol. 36 (2): 158-161.
Najm A.A., Haj Seyed Hadi M.R., Fazeli F., Taghi
Darzi M. and Shamorady R. (2010). Effect of
Utilization of Organic and Inorganic Nitrogen Source
on the Potato Shoots Dry Matter, Leaf Area Index and
Plant Height, During Middle Stage of Growth.
International Journal of Agricultural and Biological
Sciences 1:1.
Patel, C.K., Chaudhari, P.P., Patel, R.N. and Patel,
N.H. (2010). Integrated nutrients management in
potato based cropping system in North Gujrat. Poatao
J. 37(1-2): 68-70.
Singh,V., Chaurasia, S.P.R. and Sharma, J.S. (2002). An economic analysis of farm income
distribution on potato Specialized farms in Agra
district of Uttar Pradesh. India J. of Agri. Eco. 57(4):
741-750.
Singh, K.P., Singh, R.K., Singh, S.N., and Singh
V.K. (2007). Effect of fertilizer level, seed rate and
seed size on yield of potato in acidic soils of Manipur.
Potato J. 34(1-2): 93-94.
Verma, Satish, K., Asati B.S., Tamrakar, S.K.,
Nanda, H.C. and Gupta, C.R. (2011). Effect of
organic components on growth, yield and economic
returns in potato. Potato J. 38 (1):51-55.
Yadu D. (2011). Effect of varying levels of NPK
fertilizers and size of seed tubers on growth and yield
of potato (Solanum tuberosum L.) in Alfisol. M. Sc.
(Ag.) IGKVV Raipur.
Page 101
________________________________________________ Journal of Plant Development Sciences Vol. 6 (3) : 455-459. 2014
EFFECT OF DIFFERENT LEVELS OF FYM, PRESS MUD AND ZINC SULPHATE
APPLICATION ON SOIL PROPERTIES
Manmohan Sharma*, Y.K. Sharma, M.L. Dotaniya1 and
Pardeep Kumar
2
Department of Agricultural Chemistry and Soil Science, Gochar Mahavidhyalaya, Rampur
Maniharan, Uttar Pradesh, India 1Indian Institute of Soil Science, Bhopal- 462 038, India 2 Department of Soil Science, SVPUAT,Meerut-250110
*Email: [email protected] Abstract: An experiment was conducted during the years 2006-2007 and 2007-2008 at farmers field to find out the effect of
farm yard manure (FYM ), press mud and in combination of inorganic fertilizer zinc sulphate. The rice variety PRH 10 was
grown with thirteen treatments i.e.T1 = Control; T2 = FYM 5 t ha-1 +0.0 kg ZnSO4; T3 = FYM 5 t ha-1 +2.5 kg ZnSO4;
T4 = FYM 5 t ha-1 +5.0 kg ZnSO4; T5 = FYM 5 t ha-1 +7.5 kg ZnSO4; T6 = FYM 10 t ha-1 +0kg ZnSO4; T7 = FYM 10
t ha-1 +2.5 kg ZnSO4; T8 = FYM 10 t ha-1 +5.0 kg ZnSO4; T9 = FYM 10t ha-1 +7.5 kg ZnSO4; T10 = Press mud 5 t ha-1
+0.0 kg ZnSO4; T11 = Press mud 5 t ha-1 +2.5 kg ZnSO4; T12 = Press mud 5 t ha-1 +5.0 kg ZnSO4; T13 = Press mud 5 t
ha-1 +7.5 kg ZnSO4. After the crop harvest soil samples were analyzed for physico-chemical parameters. The results
showed that application of FYM and press mud in combination enhanced the soil organic carbon, available N, available P,
available K and DTPA extractable Zn in soil solution. The highest increment was observed in the application of FYM 10t
ha-1 +7.5 kg ZnSO4 compared to rest of the treatments. In conclusions, use of FYM and press mud with inorganic fertilizers
enhanced the plant nutrient level in soil solution for better crop yield.
Keywords: Farm Yard Manure (FYM), press mud, soil properties, zinc sulphate
INTRODUCTION
or India with a population of 17 percent of the
world’s population (1.1 billion) spread across
only 2.3% (329 m ha) of world’s area, this problem
has been giving a far greater challenge. Fertilizer
have played very important role in achieving the
objective of food security in India. Positive
interventionist policies of the government have
promoted consumption of fertilizer and production of
fertilizers. But irrational use of chemical fertilizers
gave up poor soil physical, chemical and biological
properties. In many cases agricultural productivity
stagnates or decline productivity, which is a
challenge for scientific community to solve the
problem (Dotaniya et al., 2014c). So, the researchers
think back old practices like use of crop residue,
farm waste, compost to maintain soil health and
sustainable crop yield. Use of sugarcane industry
byproduct for crop production, solve the storage
problem at industry level and improve the soil
properties (Dotaniya and Datta, 2014). The annual
availability sugarcane by-products is more than 45-
55 million tons bagasse and 8-10 million tons press
mud in India. On an average it contains, 2.5-5% in
bagasse and 5-15% sugar in press mud with
significant amount of Si, Ca, P2O5, MgO, Fe and
Mn, etc (Yadav and Solomon, 2006). Use of
chemical fertilizers in combination of organic waste,
enhanced the plant nutrients and enhanced the crop
yield (Meena et al., 2014). Sharma et al. (2000)
stated that the organic C content increased
significantly (6.8 g kg-1
) in cultivated soil over
uncultivated (5.19 g kg-1
) under long-term of
different cropping system. Singha (2003) reported a
decline in organic carbon as a result of continuous
application of N fertilizer alone irrespective of
cropping system and soil type. Balanced use of NPK
fertilizers either maintained or slightly enhanced the
organic C level over the initial values while the
beneficial effect of farmyard manure (FYM) in
improving organic C over control, N, NP and NPK
fertilizers was more pronounced on vertic Ustocherpt
(Coimbatore) Chromustert (Jabalpur) and Haplustert
(Bhubaneswar). Bhat et al. (1991) observed that
continuous recycling of crop residue (wheat straw 6 t
ha-1
and rice straw 12 t ha-1
) for seven year in rice-
wheat crop sequence significantly increased the
available nitrogen content of soil. In these views, we
have conducted a field study to find out the long term
effect of FYM and press mud on soil properties.
MATERIAL AND METHOD
The experiment was conducted during 2006-07 at
progressive farmer’s field at Dharki village of
District Saharanpur. Saharanpur district lies between
77015’E longitude and 27
010’ N altitude and is
situated at the attitude of about 275.05 meters above
mean sea level. The rice variety PRH 10 was crop
with thirteen treatments i.e.T1 = Control; T2 =
FYM 5 t ha-1
+0.0 kg ZnSO4; T3 = FYM 5 t ha-1
+2.5 kg ZnSO4; T4 = FYM 5 t ha-1
+5.0 kg ZnSO4;
T5 = FYM 5 t ha-1
+7.5 kg ZnSO4; T6 = FYM 10
t ha-1
+0kg ZnSO4; T7 = FYM 10 t ha-1
+2.5 kg
ZnSO4; T8 = FYM 10 t ha-1
+5.0 kg ZnSO4; T9 =
FYM 10t ha-1
+7.5 kg ZnSO4; T10 = Press mud 5 t
ha-1
+0.0 kg ZnSO4; T11 = Press mud 5 t ha-1
+2.5
kg ZnSO4; T12 = Press mud 5 t ha-1
+5.0 kg
ZnSO4; T13 = Press mud 5 t ha-1
+7.5 kg ZnSO4.
F
Page 102
456 MANMOHAN SHARMA, Y.K. SHARMA, M.L. DOTANIYA AND PARDEEP KUMAR
FYM and Press mud in different treatments were
applied 10 days before transplanting. The initial soil
properties like pH 7.86, organic carbon 0.63%,
phosphorus, potassium and zinc in low category. The
nutrient content of press mud and FYM was analyzed
and described in Table 1& 2. Different doses of zinc
sulphate were applied at the time of transplanting by
hand broadcasting in each plot. Recommended doses
of NPK were applied in all plots including control.
Half of dose of nitrogen was applied at the time of
planting and rest half dose was applied at 30 and 70
days after transplanting as topdressing in two
installments. While, total P and K were applied
before transplanting. All standard agronomic
practices were adopted to raise the rice crop.
Table 1 Chemical composition of FYM
Property Values %
Organic matter 31.67
Organic carbon 11.84
Nitrogen 0.93
Phosphoric acid 1.00
Potassium 1.31
Calcium oxide 5.74
Magnesium 1.14
Copper 0.40
Mangnese 0.83
Zinc 0.52
C:N ratio 9.5
pH 7.0
Table 2: Chemical characteristics of Press mud
Property Value
Moisture % 74.0
Available N% 0.95
Available P % 0.27
Available K % 0.19
CaO % 2.38
MgO % 1.73
DTPA Ext. Zn mg/Kg 68
Statistical analysis
The experiment laid out in Randomized Block
Design (RBD) design with three replications The soil
samples was collected from each treatment after
harvesting of rice crop in 2006-07 and 2007-08 and
analyzed for different physico-chemical properties
viz. pH, EC, organic carbon, available N, available
N, available K and DTPA extractable Zn. The data
collected from field and laboratory was
analyzed statistically at 5% level of significance
using standard statistical programmes (Snedecor
and Cochran, 1967).
RESULT AND DISCUSSION
Before transplanting soil pH in 2006-07 was 6.80
while after harvesting the pH was significantly
decreased in the plots treated FYM 10 t ha-1
with
Zinc sulphate @ 2.5, 5.0 and 7.5 Kg ha-1
with 6.71,
6.75 and 6.60, respectively. Press mud 5 t ha-1
without zinc sulphate significantly reduced the pH
(Table 3). In 2007-08 the soil pH before
transplanting was 6.70. The soil pH was significantly
increased in control. FYM 10 t ha-1
reduced pH to
6.61, 6.65 and 6.50 when applied with zinc sulphate
@ 2.5, 5.0 and 7.5 Kg ha-1
, respectively. Press mud
alone and with zinc sulphate @ 2.5 Kg ha-1
also
significantly reduced the soil pH (Table 4). The
addition of FYM 10 t ha-1
with ZnSO4 @ 2.5, 5.0 and
7.5 Kg ha-1
significantly reduced the pH in
comparison to pre-planting condition in both the
years of 2006-07 and 2007-08. Addition of press
mud @ of 5 t ha-1
with 2.5 Kg ZnSO4 also reduced
the pH in 2007-08. The decrease in pH with addition
of FYM increase the production of carbonic acids
and it also improve the soil permeability due this
basic cations leached and creates acidity up to some
extant. The reduction in pH with the addition of press
mud also reported by Rai et al. (1980). Borde et al.
(1984) also reported that the application of press mud
with P fertilizer reduced soil pH.
Page 103
JOURNAL OF PLANT DEVELOPMENT SCIENCES Vol. 6 (3) 457
ECe of composite sample before transplanting in
2006-07 was 0.25 dSm-1
, while after harvesting was
lowest (0.17 dSm-1
) in T9 followed by T8 (0.18dSm-
1). While, in the rest all treatments ECe was ranged
from 0.21 to 0.30 dSm-1
(Table 3). Similarly, in
2007-08 ECe was lowest in T6 (0.16 dSm-1
) followed
by 0.19 in T8, while in rest of all treatments, ECe was
ranged from 0.21 to 0.31 dSm-1
(Table 4). There was
no clear cut trend of increase or decrease observed
except in T9 and T8 where significant reduction in
ECe was observed in comparison to pre-transplanting
condition of 2006-07. In 2007-08 lowest ECe was
recorded in T6 (0.16 dSm-1
) followed by T8. The
reduction in electrical conductivity was also reported
by Rai et al. (1980) and Borde et al. (1984).
Organic carbon was significantly increased by all
organics treatments in 2006-07 (Table 3). The
maximum increment was observed by application of
FYM 10 t ha-1
(0.90 to 1.00 per cent) followed by
FYM 5 t ha-1
(0.76-0.85 per cent), while, least
increase in per cent in organic carbon by press mud 5
t ha-1
(0.74 to 0.78 per cent). However in control (T1)
the organic carbon was at par (0.68 per cent) with
pre- transplanting condition (0.65 per cent). Similar
trend was also observed in 2007-08 (Table 4) but the
per cent organic carbon was higher than 2006-07 in
all treatments.
Table 3: Effect of different levels of organics and zinc sulphate soil properties 2006-2007 Treatments pH
1:2 soil :
water
ECe
dSm-1
Organic
carbon%
Av. N
mgkg-1
Av. P
mgkg-1
Av. K
mgkg-1
DTPA Ext. Zn
mgkg-1
Pre-Transplanting 6.80 0.25 0.65 140 15.0 091.6 1.53
T1 = Control 6.92 0.30 0.68 140 16.1 093.0 1.56
T2 = FYM 5 t ha-1 +0.0 kg Zn SO4 6.87 0.28 0.76 142 17.3 094.3 1.59
T3 = FYM 5 t ha-1 +2.5 kg Zn SO4 6.85 0.24 0.80 145 18.6 095.2 1.63
T4 = FYM 5 t ha-1 +5.0 kg Zn SO4 6.78 0.22 0.83 146 19.5 096.0 1.66
T5 = FYM 5 t ha-1 +7.5 kg Zn SO4 6.85 0.23 0.85 147 20.0 098.4 1.71
T6 = FYM 10 t ha-1 +0kg Zn SO4 6.78 0.21 0.90 154 22.5 104.0 1.61
T7 = FYM 10 t ha-1 +2.5 kg Zn SO4 6.71 0.26 0.91 158 22.7 104.4 1.68
T8 = FYM 10 t ha-1 +5.0 kg Zn SO4 6.75 0.18 0.93 160 23.0 105.6 1.73
T9 = FYM 10t ha-1 +7.5 kg Zn SO4 6.60 0.17 1.00 165 23.5 107.0 1.80
T10 = Press mud 5 t ha-1 +0.0 kg Zn
SO4
6.69 0.24 0.75 141 17.0 095.2 1.56
T11 = Press mud 5 t ha-1 +2.5 kg Zn
SO4
6.79 0.25 0.77 144 18.4 096.8 1.60
T12 = Press mud 5 t ha-1 +5.0 kg Zn
SO4
6.75 0.28 0.78 145 19.0 099.0 1.63
T13 = Press mud 5 t ha-1 +7.5 kg Zn
SO4
6.81 0.29 0.74 147 19.6 100.0 1.70
F-Test
CD at 5%
C.V
Sig.
0.127
1.117
Sig.
0.0497
12.434
Sig.
0.0491
3.615
Sig.
3.237
1.302
Sig.
1.144
3.507
Sig.
2.719
1.643
Sig.
0.0823
2.983
Table 4: Effect of different levels of organics and zinc sulphate on soil properties 2007-2008.
Treatments pH
1:2
soil :
water
ECe
dSm-1
Organic
Carbon%
Av. N
mgkg-1
Av. P
mgkg-1
Av. K
mgkg-1
DTPA
Ext. Zn
mgkg-1
Pre-Transplanting 6.70 0.26 0.70 145 15.5 91.0 1.58
T1 = Control 6.94 0.31 0.67 141 16.2 93.0 1.60
T2 = FYM 5 t ha-1 +0.0 kg Zn SO4 6.73 0.28 0.79 144 17.8 96.0 1.63
T3 = FYM 5 t ha-1 +2.5 kg Zn SO4 6.75 0.24 0.83 146 19.1 98.1 1.66
T4 = FYM 5 t ha-1 +5.0 kg Zn SO4 6.62 0.23 0.85 149 20.2 99.5 1.70
T5 = FYM 5 t ha-1 +7.5 kg Zn SO4 6.75 0.22 0.87 150 20.8 100.0 1.74
T6 = FYM 10 t ha-1 +0kg Zn SO4 6.65 0.21 0.92 157 23.1 106.3 1.67
T7 = FYM 10 t ha-1 +2.5 kg Zn SO4 6.61 0.20 0.95 160 23.4 109.5 1.73
T8 = FYM 10 t ha-1 +5.0 kg Zn SO4 6.65 0.19 0.97 163 23.8 109.7 1.78
T9 = FYM 10t ha-1 +7.5 kg Zn SO4 6.50 0.16 1.02 170 24.0 110.0 1.85
Page 104
458 MANMOHAN SHARMA, Y.K. SHARMA, M.L. DOTANIYA AND PARDEEP KUMAR
The increase in the level of organic carbon per cent
by application of FYM and press mud was because
of these both are rich source of carbon. When level
of FYM increase from 5t ha-1
to 10 t ha-1
maximum
increase (0.90 to 1.00 per cent) followed by FYM 5 t
ha-1
(0.76 to 0.85 per cent) and press mud 5t ha-1
. The
increase in organic carbon per cent with the
application of FYM and press mud earlier reported
by Tiwari and Nema (1999). Singh et al. (1990) also
reported that application of 8.5 to 17 t ha-1 FYM ha-1
in maize-wheat rotation also increase the organic
carbon in soils. The use of organic amendment
enhanced the soil organic C and other plant nutrients
like N, K, P in soil (Shukla et al., 2013).
The available N in control after harvesting was equal
to pre- transplanting conditions (Table 2). The
available N was significantly increased when FYM 5
t ha-1
, FYM 10 t ha-1
and press mud 5 t ha-1
was
applied with 0.0, 2.5, 5.0 and 7.5 Kg ha-1
zinc
sulphate except in T2 where only FYM 5 t ha-1
was
applied. The maximum available N was observed in
plots treated with FYM 10 t ha-1
(154 to 165mg Kg-
1). Perusal of (Table 3) reveled that available N was
decreased in control (141 mg Kg-1
) and FYM 5 t ha-1
+ 0.0 Kg ZnSO4 ha-1
(144 mg Kg-1
). Press mud + 0.0
Kg ZnSO4 ha-1
(143 mg Kg-1
than the pre-
transplanting condition (145 mg Kg-1
). Furthermore
as the dose of ZnSO4 was increased with FYM 5 and
10 t ha-1
or press mud 5 t ha-1
the values of available
N was also increased in both the years of the
experiment. The available nitrogen also increases
with increasing levels of FYM and ZnSO4 and the
rate of increase in nitrogen with the application of
press mud was less than the FYM. The trend was
similar to as was in case of organic carbon. This is
because of organic carbon works as pool source of
organic nitrogen which converts in available form.
Singh et al. (1985) reported similar results increase
in the level of available nitrogen when they applied
FYM in maize- wheat rotation. Indulkar and
Malewar (1996) also reported increase in available N
content over control in sorghum.
The available phosphorus was lowest in 16.1 mg Kg-
1 in control and at par with pre-transplanting
condition (Table 2). All organic treatments
significantly increased the available P after harvest,
the 10 t ha-1
FYM with 0.0, 2.5, 5.0 and 7.5 Kg ha-1
ZnSO4 significantly increased the amount of
available P compared to 5 t ha-1
FYM and 5 t ha-1
press mud with corresponding doses of ZnSO4 in
2006-07. In 2007-08 the available P in composite
sample of pre-transplanting was 15.5 mg Kg-1
and at
par with control (16.2mg Kg-1
). The maximum
available P was observed in treatments of 10 t ha-1
FYM with 0.0 to 7.5 Kg ha-1
ZnSO4 (23.1 to 24.0 mg
Kg-1
). Similar in case of nitrogen, available
phosphorus content also increase as level of FYM
increases and maximum increase was observed at the
level of FYM 10 t ha-1
with 7.5 Kg ZnSO4. Organic
residue released organic acids, which solubilize the
insoluble soil P, and enhanced the P availability in
soil solution (Dotaniya et al., 2014a; Dotaniya, 2013)
Perusal of data on available K in Table 3 revealed
that the lowest available K observed in control (93.0
mgkg-1
) which was at par with pre-transplanting
sample and T2 where FYM 5 t ha-1
was applied
without ZnSO4 (T3). Rest of all treatment
significantly increased the available K as compare to
Pre-transplanting composite sample. FYM 5t ha-1
with all doses of ZnSO4. Further more FYM 10 t ha-1
with different doses of ZnSO4 significantly increased
the available K over FYM 5 t ha-1
and press mud 5t
ha-1
with different doses of ZnSO4 . The available K
in 2007-08 in pre-transplanting sample was 97.0 mg
Kg-1
and was at par with control. But among organic
treatments the highest K was observed in different
treatments of ZnSO4 with 10 t ha-1
FYM followed by
5 t ha-1
press mud and 5 t ha-1
FYM (Table 3). The
per cent of available K observed to increase over
control which was also at par with pre-transplanting
condition. When we increase the FYM level
concentration of K also increase and it was
maximum in T9. Crop residues having significant
amount of potassium, it was released due to
microbial decomposition during the study and
enhanced the available K in soil (Dotaniya et al.,
2014b)
DTPA Ext. Zn in 2006-07 was minimum (1.56 mg
Kg-1
) in control and press mud 5 t ha-1
without
ZnSO4 treatment (Table 3) while, in pre-
transplanting composite sample it was 1.53 mg Kg-1
.
Zn concentration was significantly increased by
application of FYM 10 t ha-1
with 2.5, 5.0 and 7.5Kg
ZnSO4(1.68, 1.73 and 1.80 mg Kg-1
) FYM 5 t ha-1
with 2.5, 5.0 and 7.5 Kg ZnSO4 (1.63, 1.66 and 1.71
mg Kg-1
) and press mud 5 t ha-1
with 5.0 and 7.5 Kg
ZnSO4 (1.63 and 1.70 mg Kg-1
). But in 2007-08
FYM 10 t ha-1
with 0.0, 2.5, 5.0 and 7.5 Kg ha-1
ZnSO4. FYM 5 t ha-1
with 2.5, 5.0 and 7.5 Kg ZnSO4
and press mud 5 t ha-1
with 2.5, 5.0 and 7.5 Kg
ZnSO4 significantly increased the DTPA ext. Zn
(Table 4). The amount of DTPA ext. Zn in pre-
T10 = Press mud 5 t ha-1 +0.0 kg Zn SO4 6.65 0.23 0.77 143 17.5 99.8 1.60
T11 = Press mud 5 t ha-1 +2.5 kg Zn SO4 6.49 0.24 0.80 148 18.9 100.0 1.64
T12 = Press mud 5 t ha-1 +5.0 kg Zn SO4 6.60 0.28 0.82 151 19.5 103.5 1.66
T13 = Press mud 5 t ha-1 +7.5 kg Zn SO4 6.65 0.29 0.78 153 20.1 105.8 1.73
F- test Sig. Sig. Sig. Sig. Sig. Sig. Sig.
CD at 5% 0.106 0.0466 0.0482 4.505 1.074
3.443
0.0501
C.V. 0.952 11.631 3.429 1.772 3.202 2.109 1.777
Page 105
JOURNAL OF PLANT DEVELOPMENT SCIENCES Vol. 6 (3) 459
transplanting sample and all other treatment samples
were higher in 2007-08 than 2006-07.The minimum
concentration of Zn was in control followed by 5 t
ha-1
press mud without ZnSO4. Concentration of Zn
increases as level of ZnSO4 and FYM increase. This
is because of ZnSO4 is the direct source of Zn and
FYM and press mud works as pool of most of the
micronutrients. Sakal et al. (1981) reported that
ZnSO4 application raised level of available Zn in
soils and left substantial amount of Zn for succeeding
crop.
CONCLUSION
Use of crop residue for agricultural crop production
was an old practice. But during the green revolution
inorganic fertilizer consumption high and farmers
mostly dependent only on chemical fertilizers,
without applying organic manure. The increasing
population growth, enhanced the pressure to produce
more from limited land. So to overcome the crop
yield stagnation and improve the soil health, farmers
again applying the organic manure in combination to
inorganic fertilizers. it improved the soil physico-
chemical properties. In this experiment application of
FYM 10t ha-1
+7.5 kg ZnSO4 improved the soil OC,
available N, P and K in soil compared to rest of the
treatments.
REFERENCES
Bhat, A.K.; Beri, V. and Sindhu, B.S. (1991).
Effect of long term recycling of crop residue on soil
productivity. J. Indian Soc. Soil Sci. 39(2): 380-382.
Borde, B.K.; Kadam, J.R. and Patil, N.D. (1984).
Effect of pressmud cake and phosphatic fertilizer on
yield and uptake of nutrient of green gram. J. Indian
Soc. Soil Sci. 32:516-518.
Dotaniya M. L., Datta S. C., Biswas D. R., Meena
H.M. and Kumar K. (2014a). Production of oxalic
acid as influenced by the application of organic
residue and its effect on phosphorus uptake by wheat
(Triticum aestivum L.) in an Inceptisol of north India.
National Academy Science Letters. DOI
:10.1007/s40009-014-0254-3.
Dotaniya, M. L. (2013). Impact of various crop
residue management practices on nutrient uptake by
rice-wheat cropping system. Current Advances in
Agricultural Sciences. 5(2):269-271.
Dotaniya, M. L., Datta, S. C., Biswas, D. R. and
Kumar, K. (2014b). Effect of organic sources on
phosphorus fractions and available phosphorus in
Typic Haplustept. Journal of the Indian Society of
Soil Science 62(1):80-83.
Dotaniya, M. L., Datta, S.C. (2014). Impact of
bagasse and press mud on availability and fixation
capacity of phosphorus in an Inceptisol of north
India. Sugar Tech 16(1):109-112.DOI
10.1007/s12355-013-0264-3.
Dotaniya, M. L., Sharma, M. M., Kumar, K. and
Singh, P. P. (2013c). Impact of crop residue
management on nutrient balance in rice-wheat
cropping system in an Aquic hapludoll. The J. Rural
and Agricultural Research. 13(1):122-123.
Indulkar, B.S. and Malewar, G.U. (1991).
Response of rice (Oryza sativa) to different zinc
sources and their residual effect on succeeding
chickpea (Cicer arietinum). Indian J. Agron. 36 : 5-9.
Meena, B. P., Kumar, A., Dotaniya, M. L., Jat, N.
K. and Lal, B. (2014). Effect of organic sources of
nutrients on tuber bulking rate, grades and specific
gravity of potato tubers. Proceedings of the National
Academy of Sciences, India Section B: Biological
Sciences. DOI 10.1007/s40011-014-0398-4.
Rai, Y.; Singh, D.; Singh, K.D.N.; Prasad, C.R.
and Prasad, M. (1980). Utlization of wate product
of sugar industry as a soil ament vis-a-vis for
reclamation of saline-sodic soils. Indian Sugar.
30:241-244.
Sakal, R. et al., (1981). Response of wheat to zinc,
copper and manganese in calcareous soil. J. Indian
Soc. Soil Sci. 29:385-387.
Sharma, M.P.; Bali, S.V. and Gupta, D.K. (2000).
Crop yield and properties of Inceptisol as influenced
by residue management under rice-wheat cropping
sequence. J. Indian Soc. Soil Sci. 48(3): 506-509.
Shukla, M., Patel, R. H., Verma, R, Deewan P.,
Dotaniya, M. L. (2013). Effect of bio-organics and
chemical fertilizers on growth and yield of chickpea
(Cicer arietinum L.) under middle Gujarat
conditions. Vegetos. 26(1):183-187.
DOI:10.5958/j.2229-4473.26.1.026.
Singh, K. (1990). Available zinc status of some soils
of Haryana. H.A.U.J. Res. 20(20): 157-160.
Singha, D.D. (2003). Management of crop residue in
summer rice and its effect on the soil properties and
crop yield. Crop Res. Hisar. 25(1): 191-193.
Snedecor, G.W. and Cochran, W.G. (1967).
Statistical Methods, Oxford and IBH Publishing
Co., New Delhi.
Tiwari, R.J. and Nema, G.K. (1999). Reponse of
sugarcane (Saccharum officinarum) to direct and
residual effect of pressmud and nitrogen. Indian J.
Agricultural Sci. 69(9): 644-646.
Yadav, R.L., and S. Solomon. (2006). Potential of
developing sugarcane by-product based industries in
India. Sugar Tech 8(2&3): 104-111.
Page 106
460 MANMOHAN SHARMA, Y.K. SHARMA, M.L. DOTANIYA AND PARDEEP KUMAR
Page 107
________________________________________________ Journal of Plant Development Sciences Vol. 6 (3) : 461-464. 2014
GENETIC VARIABILITY, CORRELATION AND PATHCOEFFICIENT ANALYSIS
OF SOME YIELD COMPONENTS OF MUNGBEAN (VIGNARADIATA L.)
Manoj Kumar Sao*, S.K. Nair, Fakeer Chand Sao, Sanjay Kumar Yadav and Sourabhpaikara
Department of Genetics and Plant Breeding, IGKV Raipur,Chhattisgarh, 492012
*Email: [email protected] Abstract: Genotypic and phenotypic coefficient of variation, heritability, genetic advance was evaluated for yield and its
contributing characters in 30 moonbeam genotypes significant variations among the genotypes were observed for all the
characters. Analysis of variance revealed that mean sum of squares due to genotypes were highly significant for all the
characters except number of pod per clusters, 100 seed weight whereas, pod length shown significant differences thus
revealing the existence of considerable variability in the material studied. Analysis of Variance was given in table no.4. High
heritability coupled with high genetic advance was recorded for seed yield per plant, number of pod per cluster, plant height
and days to 50% flowering. Indicating these characters would be best for phenotypic selection. The correlation coefficient
analysis revealed high significant positive association of plant height, number of flower per raceme, number of seed per pod,
petiole length, number of pod per clusters, pod length, days to 50% flowering and days to maturity and significant positive
association of 100 seed weight with seed yield per plant. The path coefficient analysis showed that, days to 50% flowering
had the highest direct effect on seed yield. The estimated Genotypic Coefficient of Variation (GCV) and Phenotypic
Coefficient of Variation (PCV) helped in getting a clear understanding of the variability present among the various
genotypes. The GCV was maximum for seed yield per plant (32.70%). The phenotypic coefficient of variation was high for
seed yield/plant (35.43%), number of pod per cluster (21.62%) and plant height (20.64%).
Keyword: Mungbean, correlation, variability, path analysis
INTRODUCTION
ungbean (Vignaradiata L. Wilczek) is an
important pulse crop which is annual legume.
As compared to other legumes, these edsofmung bean
are tasty, easily digestible and having more
nutritional values. Its seed contains 24.7% protein,
0.6% fat, 0.9% fiber and 3.7% ash (Potter and
Hotchkiss, 1997). Sprouts of mungbean are an
important source of food and are very commonly
used to protect from scurvy. The path analysis helps
in partitioning the correlation coefficient of yield
components with seed yield into its direct and
indirect effects to ensure the actual contribution of an
attribute as well as its influence through other traits.
Correlation analysis provides the information of
interrelationship of important plant characters and
hence, leads to a directional model for direct or
indirect improvement in seed yield per plant (Khan et
al., 2004). Genetic variability with the help of
suitable parameters such as genotypic coefficient of
variation, phenotypic coefficient of variation,
heritability and genetic advance are absolutely
necessary t o start an efficient breeding programme.
MATERIAL AND METHOD
Field experiments were conducted in 20012-2013 and
was laid out in a Randomized Complete Block
Design (RCBD) with three replication in spacing of
30 ×10 cm between rows and plants respectively
Each genotype was represented by 4 rows of 4 m
length with guard rows at either side. All the
agronomical package of practices recommended for
crop health stand was adopted. At instructional farm,
Department of Genetics and Plant Breeding, College
of Agriculture, Indira Gandhi Krishi
Vishwavidyalaya, Raipur (C.G.), to estimate genetic
variability, heritability Genotypic and phenotypic
coefficients of variance, heritabilityand genetic
advance
wereevaluatedforyieldanditscontributingcharactersin
30Mungbean genotypes. Details of the genotypes
included in the experiment are given below in table
no.1.Dataonfive randomly selected plant were
recorded on ten characters viz.,
daysto50%flowering(days), days tomaturity (days),
plant height (cm), number of pods per cluster, pod
length (cm), number of seeds per pod, 100 seed
weight (g) and yield per plant (g). Genotypic and
phenotypic coefficient of variations, heritability and
genetic advance were estimated as per Singh and
Chaudhury (1985) and Johns on et al. (1955).
Details of the Genotypic (G), phenotypic (P) and
environmental (E) correlation coefficients among
different yield traits in mungbean given below in
table no. 2.
RESULT AND DISCUSSION
Analysis of variance presented in Table 2 revealed
that mean sum of squares due to genotypes were
highly significant for all the characters except
number of pod per clusters, 100 seed weight
whereas, pod length shown significant differences.
The estimate of genotypic coefficient of variation
(GCV) and phenotypic coefficient of variation
(PCV), heritability (h2), genetic advance (GA), for
ten different characters are presented in table no.5.
The highest genotypic coefficient of variation was
found for seed yield per plant followed by number of
pod per cluster and the lowest for number of seeds
M
Page 108
462 MANOJ KUMAR SAO, S.K. NAIR, FAKEER CHAND SAO, SANJAY KUMAR YADAV AND
SOURABHPAIKARA
per pod indicating higher degree of genetic
variability for these characters. A higher heritability
estimate associated with good estimates of genetic
advance expected in the next generation for seed
yield per plant, number of pod per cluster, plant
height, number of seeds per pod and 100 seed weight
suggesting these characters are governed by additive
genetic effect to a great extent and improvement of
these characters would be effective through
phenotypic selection. Similar results were found by
Vikas et al. (1998) for plant height, Sharma (1999)
for 100-seed weight and seed yield per plant. High
heritability estimates has been found to be helpful in
making selection of superior genotypes on the basis
of phenotypic performance. Johanson et al. (1955).
Seed yield per plant exhibited highly significant
positive correlation with number of pod per cluster at
all phenotypic (0.814), genotypic (0.866) and
environmental (0.491) level which were in
accordance with the findings of Yaqoob et al. (1997),
Sadiq and Abbas (2007) and Verma and Garg (2007).
The character number of pod per cluster was
identified as selection criteria for improving seed
yield in mungbean as this character recorded strong
positive correlation with seed yield. Days to 50%
lowering had the highest direct effect (1.061) on seed
yield per plant. It also had highly significant positive
association with seed yield, complied with high
heritability and high genetic advance. Hence, this
character seems to be important contributor of seed
yield and must be considered in selection for high
seed yield details of the genotypic path coefficient of
various characters influencing seed yield per plant in
mungbeangiven below in table no. 3.
CONCLUSION
Analysis of variance revealed that, mean sum of
squares due to genotypes were highly significant for
all the characters except pod length showing
significant difference while, number of pod per
cluster and 100 seed weight were non-significant.
Thus revealing that the existence of considerable
variability in the material studied. The Genotypic
Coefficient of Variation (GCV) was noted high for
seed yield per plant and number of pod per cluster
while, the Phenotypic Coefficient of Variation (PCV)
was high for number of seed yield per plant, number
of pod per cluster and plant height. GCV for seed
yield recorded high which shows considerable scope
for yield improvement. However, plant height has
considerable genetic variability which can also be
exploited for yield improvement. High heritability
was found in all the character while high genetic
advance was found in all the character also. The path
coefficient analysis showed that, days to 50%
flowering had the highest direct effect on seed yield.
The correlation coefficient analysis revealed high
significant positive association of plant height,
number of flower per raceme, number of seed per
pod, petiole length, number of pod per clusters, pod
length, days to 50% flowering and days to maturity
and significant positive association of 100 seed
weight with seed yield. Hence, improvement of seed
yield per plant can be achieved by improving these
characters.
Table 1: Designation of Mungbean germplasms
S. No. Genotype Source
1 Pusa Vishal IARI, New Delhi
2 MalviyaJyoti BHU Varanashi
3 Pragya IGKV, Raipur
4 Pairymung BARC/IGKV,Raipur
5 TM-99-2 BARC, Trombay
6 TM 2000-1 BARC, MUMBAI
7 K-851 IIPR, Kanpur
8 TARM-1 BARC/Akola
9 RM-03-71 IGKV, Raipur
10 RM-03-79 IGKV, Raipur
11 BM-4 ARS, Badanpur
12 AKM 8802 POKV, Akola
13 PKVAKM 4 POKV, Akola
14 KM 2293 CSA, Kanpur
15 GM-04-02 SDAV, S.K.Nagar
16 PM-09-11 GBPAUT,Pantnagar
17 RVSM 11-9 Sehore
18 MH 805 Hisar
19 NVL 638 Nirmal seeds
20 DGG - 1 Dharwad
21 UANNATI MSSCL, Akoa
22 SKUA-M-300 SKUA&T, Srinagar
Page 109
JOURNAL OF PLANT DEVELOPMENT SCIENCES Vol. 6 (3) 463
23 IPM 2K 15-4 IIPR, Kanpur
24 PUSA 1271 IARI, New delhi
25 TMB-36 BARC, Mumbai
26 ML-1907 PAU, Ludhiana
27 RMG-1004 ARS, Durgapura
28 AKM 10-13 POK, Akola
29 COGG 979 Coimbtore
30 VGG 04-011 NPRC, Vamban
Table 2: Genotypic (G), phenotypic (P) and environmental (E) correlation coefficients among different yield
traits in mungbean.
Character No. of
flower
per
raceme
No. of
seeds
per pod
No. pod
per
cluster
Petiole
length
Seed
yield
100
seed
weight
(gm)
Pod
length
(cm)
Days to
50%
flowering
Days to
maturity
Plant
height
P
G
E
0.646**
0.744**
-0.069
0.595**
0.627**
0.292
0.681**
0.745**
0.213
0.616**
0.670**
0.123
0.568**
0.648**
0.032
-0.137
-0.181
0.122
0.361*
0.405*
-0.077
0.648**
0.694**
0.024
0.632**
0.684**
-0.163
No. of
flower per
raceme
P
G
E
0.687**
0.775**
-0.090
0.756**
0.817**
0.340
0.771**
0.892**
-0.216
0.805**
0.851**
0.526
0.193
0.246
-0.095
0.610**
0.679**
0.000
0.859**
0.945**
-0.216
0.862**
0.939**
-0.123
No. of
seeds per
pod
P
G
E
0.686**
0.743**
0.183
0.675**
0.745**
-0.120
0.743**
0.812**
0.211
0.180
0.226
-0.148
0.792**
0.860**
-0.069
0.719**
0.753**
0.047
0.679**
0.714**
-0.059
No. pod
per cluster
P
G
E
0.660**
0.755**
-0.133
0.814**
0.866**
0.491**
0.048
0.112
-0.310
0.554**
0.631**
-0.151
0.701**
0.768**
-0.149
0.688**
0.753**
-0.178
Petiole
length
P
G
E
0.680**
0.788**
-0.131
0.188
0.232
-0.099
0.610**
0.662**
0.016
0.870**
0.922**
-0.007
0.841**
0.890**
-0.033
Seed yield P
G
E
0.326
0.400*
-0.052
0.696**
0.768**
0.133
0.712**
0.788**
-0.125
0.687**
0.758**
-0.107
100 seed
weight
(gm)
P
G
E
0.510**
0.543**
0.321
0.242
0.272
-0.015
0.272
0.303
0.008
Pod length
(cm)
P
G
E
0.625**
0.649**
0.162
0.568**
0.593**
0.056
Days to
50%
flowering
P
G
E
0.978**
0.982**
0.772**
Table 3: Genotypic path coefficient of various characters influencing seed yield per plant in mungbean
Character
Plant
height
No. of
flower
per
raceme
No. of
seeds
per
pod
No. of
pod per
cluster
Petiole
length
100
seed
weight
(gm)
Pod
length
(cm)
Days to
50%
flowering
Days to
maturity
Genotypic
correlation
coefficient
Plant
height 0.140 0.556 0.400 0.383 0.073 -0.120 -0.296 0.737 -1.224 0.648**
No. of
flower per
raceme
0.104 0.747 0.494 0.420 0.097 0.164 -0.497 1.002 -1.682 0.851**
No. of
seeds per
pod
0.088 0.579 0.638 0.382 0.081 0.151 -0.629 0.799 -10278 0.812**
No. pod
per cluster
0.105 0.610 0.474 0.514 0.082 0.075 -0.462 0.815 -1.348 0.866**
Page 110
464 MANOJ KUMAR SAO, S.K. NAIR, FAKEER CHAND SAO, SANJAY KUMAR YADAV AND
SOURABHPAIKARA
Petiole
length
0.094 0.666 0.475 0.388 0.109 0.154 -0.484 0.979 -1.594 0.788**
100 seed
weight
(gm)
-0.025 0.184 0.144 0.058 0.025 0.666 -0.397 0.288 -0.542 0.400*
Pod length
(cm)
0.057 0.507 0.548 0.325 0.072 0.362 -0.731 0.689 -1.061 0.768**
Days to
50%
flowering
0.097 0.706 0.481 0.395 0.101 0.181 -0.475 1.061 -1.759 0.788**
Days to
maturity
0.096 0.702 0.455 0.387 0.097 0.202 -0.433 1.042 -1.790 0.758**
Table 4: Analysis of Variance Source of
variation
D.F. Plant
height
No. of
flower
per
raceme
No. of
seeds
per pod
No. pod
per
cluster
Petiole
length
Seed
yield
100 seed
weight
(gm)
Pod
length
(cm)
Days to
50%
flowering
Days to
maturity
Replication 2 27.421* 1.106* 0.021 0.102 0.114 0.348 0.796** 0.511 2.359 1.250
Treatment 29 179.21** 5.491** 2.991** 1.127 3.043** 4.217** 0.499 1.83* 275.07** 281.12**
Error 58 7.143 0.260 0.076 0.052 0.095 0.231 0.034 0.046 2.114 1.715
*Significant at 5% probability level
** Significant at 1% probability level
Table 5: Genetic parameter of variation
Character GCV (%) PCV (%) h2 (%) GA GA as % of mean
Plant height 19.47 20.64 88.9 14.71 37.81
No. of flower per raceme 14.55 15.60 87.0 2.54 28.00
No. of seeds per pod 10.11 10.50 92.7 1.96 20.10
No. pod per cluster 20.20 21.62 87.3 1.15 38.85
Petiole length 13.02 13.63 91.2 1.95 25.62
Seed yield 32.70 35.43 85.2 2.19 62.21
100 seed weight (gm) 11.36 12.55 81.9 0.73 21.09
Pod length (cm) 12.51 12.99 92.8 1.53 24.79
Days to 50% flowering 17.12 17.32 97.7 19.43 34.87
Days to maturity
11.16 11.26 98.2 19.70 22.77
GCV= Genotypic Coefficient of Variation, PCV= Phenotypic Coefficient of Variation
h2= heritability, GA= Genetic Advance
REFERENCES
Johanson, H. W., Robinson, H. F., Comstock, R.
E., (1955). Estimates of genetic and environmental
variability insoybean.AgronJ 47:314-318.
Khan, M. D., I. H. Khalil, M. A. Khan and
Ikramullah, (2004). Genetic divergence and
association for yield and related traits in mung
bean.Sarhad J. Agric., 20: 555–61.
Potter,N. N.,Hotchkiss, J. H., (1997).
FoodScience.CBSPublishers,NewDelhi, India.403.
Sadiq, M. S. and Abbas, G. (2007). Selection
indices for seed yield in mungbean. International J.
of Biology and Biotechnology. 4(4): 421-423.
Sharma, R. N. (1999) Heritability and character
association in non segregating populations of
Mungbean (VignaradiataL.Wilczek). Journalof
Interacademicia3:5-10.
Singh,R. K.,Chaudhury,B. D., (1985) Biometrical
Method in Quantitative Genetic Analysis. Kalyani
Publishers.NewDelhi,India.
Verma, P. and Garg, D. K. (2007). Correlation and
path coefficient studies in mungbean. J. of Arid
Legumes.4(2): 88-91.
Vikas ,V. R. S. P.,Singh,S. P. (1998).
Geneticvariability in mungbean(VignaradiataL.
Wilczek) over environments in kharif season. Annals
of Agri Bio Research 3:211-215.
Yaqoob, M., Malik, A. J., Malik, B. A., Khan, H.
U. and Nawab, K. (1997). Path co-efficient analysis
in some mungbean mutants under rainfed
conditions.Sarhad J. of Agriculture.13(2): 129-133.
Page 111
________________________________________________ Journal of Plant Development Sciences Vol. 6 (3) : 465-466. 2014
METHODS AND PRACTICAL ASPECTS IN MUNGBEAN HYBRIDIZATION
K.N. Sivaiah1, R. Narasimhulu
2, G.Govardhan
2 and R.Vinoth
3
1Department of Seed Science and Technology, College of Agriculture,
Orissa University of Agriculture and Technology, Bhubaneswar-751003
2Department of Genetics and Plant Breeding, S.V.Agricultural college, Tirupati-517502
Acharya N.G.Ranga Agricultural University, Andhrapadesh. 3Department of Pulses, Centre for Plant Breeding and Genetics.
Tamil Nadu Agricultural University, Coimbatore – 641 003, Tamil Nadu, India
Abstract: Mungbean [Vigna radiata (L.) Wilczek] is one of the short duration pulse crop predominantly cultivated in Asia.
It is a self pollinated crop where crossing or hybridization is tedious. Under field conditions easy and efficient crossing
technique is needed to exploit genetic potential of mungbean. Due to complexity and lack of appropriate crossing technique,
outcomes achieved have been less in mungbean. From last five decades scientists were developing different methods of
hybridization to accelerate the success rate of crossing in mung. However Khattak and co-researchers developed efficient
new technique where more pod setting was observed. Based on limited available information, this review summarizes the
methods of crossing techniques and practical measures followed during hybridization in mungbean.
Keywords: vigna radiata, mungbean, crossing, hybridization
INTRODUCTION
ungbean [Vigna radiata (L.) Wilczek] is third
important pulse crop after chickpea and pigeon
pea in India. It is widely cultivated throughout the
Asia. It belongs to the family order leguminoseae
and papilionoidae family. Inflorescence is axillary or
terminal raceme and flowers are cleistogamous,
papilionaceous flowers consists of five sepals, five
petals consisting of one standard, two wing and two
keel petals. Stamens are ten which may occur in two
bundles 9+1 (diadelphous) condition. Style is up
curved and stigma is bearded.
Crossing techniques: Crossing or hybridization
plays a crucial role in manipulation of genetic
architecture of any crop. Generally effecting cross-
pollination in a strictly self-pollinating species is
more difficult than vice-versa because for instance
preventing self-pollination occurring inside the
unopened flowers is cumbersome. To the knowledge
of the authors, the techniques used to hybridize
mungbean only few members were reported and
concise here.
Boling et al (1961) introduced crossing technique in
mungbean. In this method the young bud was
grasped between the thumb and forefinger of the left
hand. The point of a dissecting needle was inserted
just under the standard in an oblique position along
the top of the bud. The left side of the standard and
the left wing petal were pushed outward away from
the bud and held with the thumb of the left hand. The
left half of the keel was removed in pieces with
forceps. Extreme care was necessary in removing the
left half of the keel to prevent injury to the delicate
stigma. The pistil and stamens were then exposed
and the anthers were removed with forceps. After
emasculation, the pistil was pollinated immediately
with desired pollen as the stigma appeared to be
receptive. Pollination should be done by applying
slight pressure at the base of the pollen flower; the
stigma at the end of the keel was exposed with
pollen. This stigma was brushed lightly against the
stigma of the emasculated flower and pollination was
completed. The left wing and standard were then
closed to their original position on the bud. This
served to protect the stigma from drying out and
prevented damage by insects
Singh and Malhotra (1975) suggested high
percentage of pod setting can be obtained by
following emasculation of yellowish green buds in
the evening (4:00pm to 6:30pm) and pollination of
blossomed flowers in the next day morning(8:00am
to 11:00am).However, simultaneous emasculation
and pollination done during morning or evening
shown low pod setting. Park and Yang (1978) also
reported same procedure where emasculation in
evening and pollination in the following morning
gives maximum seed set. But simultaneous
emasculation and pollination during morning 8:00am
to 11:00am. Which results 3-4 seed pods normally.
Due to less time period of crossing it limits the
number of flowers to be pollinated which gradually
results low pod set. It may be useful for researchers
who require less quantity of seeds.
Cupka and Edwards (1986) introduced new
technique where female bud was grasped between
thumb and fore finger and right side of the standard
was gripped with forceps approximately two-thirds
the distance from the base along the ventral edge of
the bud. The standard was then torn upward towards
dorsal edge of the bud and removed. The wing petal
if in the way was removed similarly in order to
remove the keel petal. Using the point of the forceps,
one side of the keel was slit open. By grasping the
loosened flap. By grasping the loosened flap with
forceps, the loosened tip of the keel was then
removed and then stamens are removed. To pollinate
the female parent, the pollen landed stigma of the
M
REPORT
Page 112
466 K.N. SIVAIAH, R. NARASIMHULU, G.GOVARDHAN AND R.VINOTH
male parent gently brushed against the female parent.
The pollinated flower was tagged and sealed by
closing the opening of the standard petal with
cellophane tape which helped the control of loss of
moisture in the stigma by resealing the opening. The
success rate of this technique is 60% with an average
six seeds per pod per successful cross. But this
technique is tedious and cellophane tape may stick to
pollen used for pollination and the pollinated stigma.
Khattak et al., (1998) developed new technique
where only upper half of the floral bud was opened
to expose stigma and lower half helps to protect the
ovary and style in natural conditions. High pod
setting was observed during summer and spring by
emasculating at 5:00pm to 7:00pm and pollinating in
following morning at 7:00am to 9:00am. The high
success rate is mainly due to less disturbance on style
and ovary in the bud during emasculation.
Some of the practical measures which may helpful
during crossing
1. Plan the crossing programme during rabi season
where monsoons may not obstruct. If green
house is available it may possible at any season.
2. Sowing of parents should be done based on their
maturity dates, so that flowering period may
coincide. Follow staggered sowing for
continuous supply of pollen.
3. Practice wide spacing (>40cm) between the rows
helps in easy crossing. Paired row planting may
be better than unpaired row of planting. Tagging
of each row should be done for easy
identification.
4. Select the yellowish green colour bud for
emasculation. Observe the style should not be up
curved. Mostly up curved style indicates
matured bud.
5. Emasculation must be done carefully because
flower buds of some varieties are very delicate.
Care should be taken to remove 2/3 rd portion of
the bud during emasculation. Follow ring cut
method or keel rupture method for emasculation.
6. Select the flowers having abundant pollen for
pollination and use one flower to pollinate each
emasculated bud.
7. Crossing should be done without contacting
other already pollinated flowers and keep only
2-3 crossed flowers in each inflorescence and
remove the remaining flowers so that grain
filling will be more.
8. Pollination should be done early in the morning
6:00am to 9:00am. However it may be extended
during winter because of cool climate. After
pollination use coloured threads to tie the
pedicle.
9. In some situations like rainy days, crossing may
not possible at that time remove the buds or
flowers which we want to do on that day.
10. Fertilizers should be applied slightly more than
recommended dose to supply nitrogen,
phosphorus and potassium. Especially potassium
may helps to increase disease tolerance.
11. Flower shedding is common and more during
higher temperature. So during summer frequent
irrigation helps in more pod setting
12. Knapsack sprayer or foot sprayer are better than
power sprayer for spraying chemicals because
power sprayer may drops or disturbs the crossed
flowers.
REFERENCES
Boling, M.; Sander, D.A. and Matlock, R.S. (1961). Mungbean hybridization technique.
Agronomy journal.53:54-55.
Cupka, T.B. and Edwards, L.H. (1986). A new
technique for crossing mungbean. Crop
science.26:830-831.
Khattak, G.S.S.; Haq, M.A.; Rana, S.A., Elahi, T.
and Srinives, P. (1998). An efficient technique for
crossing mungbean (Vigna radiata (L.) Wilczek).
Thailand journal of agricultural science. 34(4):577-
582
Park, H.G. and Yang, C.Y. (1978). The mungbean
breeding programme at the Asian vegetable research
and development center, p 214-216. In : Proceedings
1st international mungbean symposium. AVRDC,
Shanhua , Taiwan.
Singh, T.P. and Malhotra, R.S. (1975). Crossing
technique in mungbean ( Phaseolus aureus Roxb.).
Current Science.44:64-65.
Page 113
________________________________________________ Journal of Plant Development Sciences Vol. 6 (3) : 467-470. 2014
ASSESSMENT OF INTERNET USING BEHAVIOR OF POST GRADUATE
AGRICULTURE STUDENTS IN CHHATTISGARH
Priyanka Chandrakar, M.L. Sharma and M.A. Khan
Department of Agricultural Extension, IGKV, Raipur (CG)
Email: [email protected] Abstract: The present investigation entitled “Study on Utilization Pattern of Information and Communication Technology
(ICT) By the Agriculture Post Graduate Students” was conducted in India Gandhi Agriculture University, Raipur (C.G.).
There are around 380 students studying in P.G. (M.Sc. 340 and M.Tech. 40) in faculty of Agriculture and Agriculture
Engineering during the session of 2013-1014. Out of them 50% students were selected randomly for this study. The findings
of this study revealed that maximum number of students were medium extent of utilization of internet
Keywords: Internet utilization, behavior, Chhattisgarh
INTRODUCTION
n India, the need for reforms in education by
harnessing new ICTs is increasingly being
accepted as essential by universities and cultural
organizations across India. The developments in
Information Communication Technology (ICT)
should be put into service, both to improve the
quality of learning and access to learning. The
possibilities of e-learning have to be exploited to the
fullest extent, even as we continue to improve the
quantity and quality of education through the face-to-
face mode. Similarly the traditional face-to-face
mode can be further improved by integrating internet
into the curriculum. This would require a continual
programme of intensive and extensive exposure to
the new pedagogy of learning to teachers as well as
students and also additional investment for providing
new infrastructure (Panikker, 2007).Estimates from
the International Telecommunications Union (ITU)
indicate that only 6 percent of the population in India
accessed Internet in 2007 (Veeramacheneniet al.,
2008).The Agriculture sector is gearing itself to
make optimal use of the new information and
communication technologies. The diffusion of
internet has contributed enormously to the growth of
economies in developed nations and developing
nations and is earnestly facilitating policy framework
to ensure an equitable diffusion of new
technologies.The Internet usage in India has been
improved significantly, especially recent few years.
Five years ago, there was limited Internet access in
some major cities only. Today, the Internet
represents the new wealth frontier for the India
middle class - a good salary and an honorable job,
and for a few, the opportunity to go abroad.Internet
adoption is continuous growing rapidly in India.
According to IAMAI (The Internet & Mobile
Association of India), because of low cost,
broadband use in the Internet is increasing.
METHODOLOGY
The study was conducted in the faculty of
Agriculture and Agriculture Engineering atIGKV,
Raipur (CG). The study consisted of Post Graduate
students including M.Sc. /M. Tech. during the
session of 2013-1014. Out of total 380 students, 50
percent students were selected randomly for this
study. In this way total 190 (170+20) post graduate
students were considered as respondent for the
present study. Our educational sector must use
internet led ICT tools to replace or supplement the
classroom teaching. The data were collected by
personal interview method.
RESULT AND DISCUSSION
1. Purpose of using internet
The data compiled in Table 1 represents the purpose
of using internet by the respondents. The result
revealed that the majority of respondents (70.53%)
used internet for getting information, followed by
entertainment (64.21%), academic purpose (61.05%),
news (58.95%), E-mail (57.37%), job search
(55.26%), chatting and game (47.89%), downloading
softwares (42.10%), buying tickets (40.52%), spend
leisure or free time (35.78%), shopping (10.52%) and
others purposes (3.31%), respectively. Mishra et al.
(2005) and Dash et al. (2012) also noted almost
similar findings
Table 1: Distribution of respondents according to purpose of using internet (n=190)
Purpose Frequency* Percentage
News 112 58.95
Entertainment 122 64.21
Spend leisure or free time 68 35.78
Information 134 70.53
Games 91 47.89
I
SHORT COMMUNICATION
Page 114
468 PRIYANKA CHANDRAKAR, M.L. SHARMA AND M.A. KHAN
Academic purpose 116 31.05
e-mail 109 57.37
Downloading software 80 42.10
Buying tickets 77 40.52
Chatting 91 47.89
Job search 105 55.26
Shopping 20 10.52
Others 12 3.31
*Data are based on multiple responses
2. Frequency, time spent and place of using
internet
The findings related to frequency, time spent and
place of using internet are presented in the Table 2. It
is evident from this table that the majority of students
(69.4%) used Internet daily, followed by 1-2 days in
a week (14.73%), 2-4 days a week (14.21%) and
only 1.6 per cent of the respondent were using
internet rarely.
As regard to time spent in a day, 40.52 per cent of
the respondents spent 30 minutes to1 hr / day for
using internet, followed by 35.26 per cent
respondents spent 1 to 2 hr/day,17.36 per cent
respondents spent up to 30 minutes per day.
Table 2: Distribution of respondents according to frequency of using internet, time spent and place of using
internet (n=190)
Particular Frequency Percentage
(A) Frequency of using internet
Daily 132 69.4
2-4 days in a week 27 14. 21
1-2 days in a week 28 14. 73
Rarely 3 1.57
(B) Time spent (per day)
Up to 30 Minutes/day 33 17.36
30 minutes to 1 hr./day 77 40.52
1-2 hr./day 67 35.26
More than 2 hr./day 13 6.84
(C) Place of using internet
At home 79 41.57
At institute 114 60
At hostel 160 84.21
At cyber café 57 30
Others 16 8.42
About 7 per cent respondents spent more than 2 hr/ day time for using internet. Mishra et al. (2005), Kumar
(2009) and Dash and Mishra (2012) also noted almost similar findings
3. Place of using internet
Table 2 reveals findings regarding place of using
internet, majority of students (84.21%) used internet
in hostel, followed by at institute (60%), at home
(41.57%), cyber café (30%) and other places
(8.42%). It seems from the result that good internet
facility is available in the hostel for the students.
Bishtet al. (2007) and Mishra et al. (2011) also noted
almost similar findings.
4. Sites mostly used for searching
Table 3: Distribution of respondents according to sites mostly used (n=190)
Sites Frequency* Percentage
Google 178 93.68
Yahoo 61 32.10
Rediff 23 12.10
Webdunia 55 28.95
Khoj 51 26.84
ICAR 66 34.73
Indiatimes.com 31 16.32
Page 115
JOURNAL OF PLANT DEVELOPMENT SCIENCES Vol. 6 (3) 469
Facebook 165 86.84
Others 55 28.95
*Data based on multiple responses
As regards to sites mostly used, the data presented in
Table 3 indicates that, 93.68 per cent respondents
used Google for searching information, followed by
facebook (86.84%), ICAR (34.73%), yahoo
(32.10%), webdunia (28.94%), khoj (26.84%),
indiatimes.com (16.32%) and Rediff (12.10). Other
sites were also used by 28.95 per cent respondents,
respectively. Kaur and Manhas (2008) and Mishra et
al. (2011) also noted almost similar findings.
5. Pattern of utilizing information retrieved from
internet
The data regarding pattern of utilizing information
retrieved from Internet are presented in Table 4. It
reveals that the majority of the respondent (68.94%)
retains the information by downloading it into the
CD, pen drive, computer, mobile etc., followed by
noting down useful information (58.94%), retain in
the memory (47.80%), by discussing it with friends
(37.89%). Some of the students were taking a
printout instantly (15.78%) and other patterns are
used for information retrieving from internet
(12.11%). Dash and Mishra (2012) also noted almost
similar findings.
Table 4: Distribution of respondents according to pattern of utilizing information retrieved from internet
(n=190)
Utilizing Pattern Frequency* Percentage
By noting down 112 58.94
By discussing it with friend 72 37.89
Retain in the memory 91 47.80
Download in the CD/Pen drive/Computer/ Mobile 131 68.94
Taking a print out instantly 30 15.78
Others 23 12.11
*Data are based on multiple responses
6. Extent of utilization of information and
communication technology
The findings regarding extent of utilization of
internet are present in Table 5. As regard to email,
42.63 per cent of students utilize rarely, followed by
regular utilize (34.21%) and never utilize (23.16%).
Regarding information, 45.26 per cent of students
regular utilize for information, followed by rarely
(32.63%) and never utilize for information (22.11%).
Regarding knowledge of current affairs, 53.68 per
cent of students rarely utilize, followed by regular
(25.19%) and never utilize (20.53%). Regarding
career opportunities, 63.16 per cent of students rarely
utilize, followed by never utilize (16.84%) and
regular utilize (16.84%).
Regarding preparation of resume, 63.68 per cent of
students never utilize, followed by rarely (28.95%)
and regular utilize (7.14%). Table 6 represents the
data on distribution of respondents according to
extent of utilization of ICT tools.Regarding extent of
utilization of Internet, 49.47 per cent students were
medium extend ofutilization, followed by 28.95 per
cent students had low extent of utilization and 21.58
per cent students had high extent of utilization.
Table 5: Distribution of respondents according to extent of utilization of selected ICT tools (n=190)
Particulars Regular Rarely Never
E-mail 65(34.21) 81(42.63) 44(23.16)
Information 86(45.26) 62(32.63) 42(22.11)
Knowledge of current affairs 49(25.19) 102(53.68) 39(20.53)
Career Opportunities 32(16.84) 120(63.16) 38(20)
Preparation of Resume 14(7.37) 55(28.95) 121(63.68)
Entertainment 61(32.11) 100(52.63) 29(15.26)
Academic Purpose 25(13.25) 94(49.47) 71(37.37)
Table 6: Distribution of respondents according of extent of utilization of selected ICT tools (n=190)
ICT tools Frequency Percentage
Internet
Low (0-4 score) 55 28.95
Medium (5.9 score) 94 49.47
High (10-14 score) 41 21.58
Page 116
470 PRIYANKA CHANDRAKAR, M.L. SHARMA AND M.A. KHAN
CONCLUSION
The present study reveal that the majority (70.53%)
of respondents used internet for getting information,
majority (69.4%) of the students used Internet daily,
40.52 per cent of the students spent time 30 minutes -
1 hr./ day for using internet, maximum number of
students (84.21%) used internet in hostel, 93.68 per
cent respondent used Google for searching
information, followed by facebook (86.84%) and
majority (68.94%) of the respondent utilizing
information retrieved from internet retain in the
information by downloading it into the CD, pen
drive, computer, mobile etc. 49.47 per cent students
were medium extent of utilization,
REFERENCES
Anonymous (2000). Govt. of India, Ministry of
Information Technology.Working group on
Information Technology for masses.Planning
Commission.N3ew Delhi.
Asan, A. and Koca, N. (2006). An analysis of
students’ attitudes towards Internet. Fourth
International Conference on Multimedia and
Information and Communication Technologies in
Education,
Dash, D.K. and Mishra, O.P. (2012). Internet
utilization pattern and perceived uses of internet
among the students of Banaras Hindu
University.Journals of Communication Studies31(3):
106- 117.
Kaur, A. and Manhas, R. (2008). Use of internet
service and resources in the engineering college of
Punjab and Hariyana (India): A study. The
International Information and Library Review 40:10-
20.
Mishra, O. P., Kumar, S., Dash, D.K. and Kumar,
R. (2011). Undergraduate agriculture students and
uses of the internet: the case of Banaras Hindu
University. Journals of Communication Studies29(1):
43-50.
Sharma, A. and Hasan, S. (2012). Information and
communication technologies usage by undergraduate
students in Pantnagar University.Journals of
Communication of Studies30(1): 132-138.
Sharma, S. and Malaviya, A. (2004). Internet
Utilization among Post-Graduate Girl
Students.Indian Journal of Extension
Education40(1and2): 117-118.
Veeramacheneni, B., Vogel, R. and Ekanayakeet,
E.M. (2008). “ICT in Education in India” in Richard
Vogel (ed), NYSEA Papers and Proceedings, New
York: New York State Economics Association:
104-114.
Page 117
________________________________________________ Journal of Plant Development Sciences Vol. 6 (3) : 471-473. 2014
YIELD AND ECONOMICS OF FINGER MILLET INFLUENCED BY POST
EMERGENCE HERBICIDES
Srishti Pandey, Damini Thawait and H.L. Sonboir
Department of Agronomy, College of Agriculture, Raipur, Chhattisgarh Abstract : Finger millet (Eleusine coracana L.) is an important small millet crop that is hardy and grows well in dry zones
as rain-fed crops. It is used both as medicinal and traditional purposes. Finger millet is a high statue crop with slower initial
growth which remains under smothering due to the infestation of weeds at early stages of growth. This situation causes
higher competition and may result in drastic reduction in yield up to 20 to 50 per cent (Kushwaha et al., 2002). The critical
period of crop weed competition for the finger millet varies from 25-45 days after sowing (Lall and Yadav, 1982). Manual
weed management, which is the most prevalent method for weed management in finger millet, requires a lot of labour. Now
a day, due to the scarcity of labours, chemical weed management is considered as better option than the hand weeding. It
may increase over all benefit of finger millet cultivation. The work on effect of post emergence herbicides in weed
management of finger millet is very limited; therefore, keeping these points in view the present investigation was carried out
for evaluation of post-emergence herbicides for weed management in direct sown finger millet.
Keywords: Weed management, finger millet, herbicide
INTRODUCTION
he present investigation was carried out at
Instructional cum Research Farm, Indira Gandhi
Krishi Vishwavidyalaya, Raipur (C.G.) India, during
the kharif season 2012. The soil of experimental field
was Clayey (Vertisols), which was low in nitrogen,
medium in phosphorus and high in potassium
contents with neutral in pH. The experiment was laid
out in randomized block design (RBD) with three
replications. There were thirteen treatments of post-
emergence herbicides along with two hand weeding
and untreated control. The finger millet cultivar
“GPU-28” was sown and harvested on 11th
July,
2012 and 20th
November, 2012 respectively, using
seed rate of 10 kg/ha at 25 cm distance and gaps
were maintained by thinning to obtain proper plant
population. Sowing was performed manually and
crop was fertilized with 60:40:40 N: P2O5:K2O kg/ha.
Application of herbicide was done at 20 DAS. Plant
protection measures were followed as per
recommendation. The treatments were T1-
Fenoxaprop-p-ethyl (37.5 g/ha), T2- Fenoxaprop-p-
ethyl (45.0 g/ha), T3- Metsulfuron methyl +
Chlorimuron ethyl, T4- Ethoxysulfuron, T5 –
Cyhalofop-butyl, T6- Fenoxaprop-p-ethyl (37.5 g/ha)
+ metsulfuron methyl + chlorimuron ethyl, T7-
Fenoxaprop-p-ethyl (45.0 g/ha) + metsulfuron
methyl + chlorimuron ethyl, T8- Fenoxaprop-p-ethyl
(37.5 g/ha) + ethoxysulfuron, T9- Fenoxaprop-p-ethyl
(45.0 g/ha) + ethoxysulfuron, T10- Cyhalofop-butyl +
metsulfuron methyl + chlorimuron ethyl, T11-
Cyhalofop-butyl + ethoxysulfuron, T12- Hand
weeding twice and T13- Weedy check. Grain yield of
the net plot was noted after threshing, winnowing
and drying, and then calculated in kg/ha with
appropriate multiplication factor. The harvested
produce from each net plot was tied in bundles
separately. Straw yield of plot was noted down after
subtraction of grain yield from bundle weight. Weed
index expressing the reduction in yield due to
presence of weeds in comparison with weed free
situation was calculated using the formula given
below as suggested by (Reddy, 2007).
Sw – StWeed Index % 100
Sw
Sw = Seed yield from weed free plot
St = Seed yield from treated plot
The major weed flora of experimental field consisted
of Echinochloa colona, Phyllanthus urinaria, Eclipta
alba, Alternanthera triandra and Cyperus iria and
other weed species like Commelina benghalensis,
Cynodon dactylon, Cynotis axillari, Cyperus
rotundus, Euphorbia hirta, Euphorbia geniculata,
Fimbristylis miliacaea etc. were also observed in the
experiment field in negligible quantum. All the weed
management practices caused significant reduction in
density, dry weight of weeds in comparison to weedy
check plot.
Grain yield and straw yield of finger millet was
significantly influenced by different weed
management practices. Among different herbicidal
weed management practices, application of
ethoxysulfuron alone recorded the highest grain yield
which was at par with that of metsulfuron methyl +
chlorimuron ethyl alone and significantly better than
rest of the treatments including weedy check. The
application of fenoxaprop-p-ethyl and cyhalofop-
butyl alone or in combination with metsulfuron
methyl + chlorimuron ethyl or ethoxysulfuron caused
severe reduction in grain yield due to their
phytotoxicity effect on finger millet and hardly 77
kg/ha to 191 kg/ha grain yield was achived. Weed
free treatment recorded the highest grain yield. Weed
caused 55.4% reduction in grain yield of finger
millet. It is in conformity with Prasad et al. (1991).
Similarly the highest straw yield was noted with
weed free treatment. Among herbicidal treatments
straw yield of finger millet was observed high with
application of metsulfuron methyl + chlorimuron
ethyl or ethoxysulfuron alone. The straw yield was
T
SHORT COMMUNICATION
Page 118
472 SRISHTI PANDEY, DAMINI THAWAIT AND H.L. SONBOIR
significantly reduced with application of fenoxaprop-
p-ethyl and cyhalofop-butyl due to phytotoxicity.
Weed index (loss of yield due to weeds) was found
to be minimum with application of ethoxysulfuron
(34.37 %) followed by metsulfuron methyl +
chlorimuron ethyl (36.23 %). Weedy check
registered 55.40 per cent weed index. The maximum
weed index was found with application of
fenoxaprop-p-ethyl (93.62 %) at higher level (45.0 g
ha-1
) followed by cyhalofop-butyl + ethoxysulfuron
(90.22%). Weed index in rest of the herbicidal
treatments ranged between 84.23% to 88.47%.
Hand weeding twice recorded the highest gross
return. Among herbicides, ethoxysulfuron gave
maximum gross return which was at par with that of
metsulfuron methyl + chlorimuron ethyl. In other
herbicidal treatments viz. fenoxaprop-p-ethyl,
cyhalofop-butyl alone or in combination with
metsulfuron methyl + chlorimuron ethyl or
ethoxysulfuron gross return was drastically reduced
due to lower seed yield which was affected due to
phytotoxicity. Fenoxaprop-p-ethyl (45.0 g/ha) gave
minimum gross return. The maximum net return was
observed in hand weeding twice which was at par
with application of ethoxysulfuron and metsulfuron
methyl + chlorimuron ethyl other herbicidal
treatments were uneconomical due to lower seed
yield. The highest B:C ratio was observed with
application of ethoxysulfuron which was at par with
that of metsulfuron methyl + chlorimuron ethyl and
hand weeding twice. These results were in
conformity with Kumara et al. (2007) reported that
the herbicides are economical and cost effective in
managing weeds as compared to hand weeding.
Table 1. Grain yield, straw yield and weed index of finger millet as influenced by different herbicidal treatments
Treatment Dose
(g/ha) Grain yield
(Kg/ha)
Straw yield
(Kg/ha)
Weed index
(%)
T1 : Fenox 140 1395 88.47
T2 : Fenox 45.0 77 637 93.62
T3 : MSM+CME 2.0+2.0 771 6155 36.23
T4 : Ethox 15.0 794 5479 34.37
T5 : Cyhalo 62.5 188 1217 84.53
T6 : Fenox+MSM+ CME 37.5+2.0+2.0 191 1427 84.23
T7 : Fenox+MSM+ CME 45.0+2.0+2.0 188 1219 84.52
T8 : Fenox+Ethox 37.5+15.0 180 966 85.15
T9 : Fenox+Ethox 45.0+15.0 165 819 86.37
T10 : Cyhalo+MSM+ CME 62.5+2.0+2.0 163 1328 86.53
T11 : Cyhalo+Ethox 62.5+15.0 119 1276 90.22
T12 : Weed free (HW at 20 and 40 DAS) 1210 6363 -
T13: Weedy check 540 3737 55.40
SEm ±
CD at 5 %
21.58
63.00
310.86
907.34
-
-
Fenox = Fenoxaprop-p-ethyl, MSM = Metsulfuron methyl, CME = Chlorimuron ethyl, Ethox = Ethoxysulfuron,
Cyhalo = Cyhalofop–butyl, HW = Hand weeding
Table 2. Economics of different post emergence herbicides for weed management in finger millet
Treatments Total Cost of
Cultivation (Rs/ha)
Gross
Return
(Rs/ha)
Net
Return
(Rs/ha)
B:C
Ratio
T1 : Fenox 12028 2863 -9165 0.24
T2 : Fenox 12162 1551 -10611 0.13
T3 : MSM+CME 11662 15417 3755 1.32
T4 : Ethox 11795 15662 3867 1.33
T5 : Cyhalo 12706 3682 -9023 0.29
T6 : Fenox+MSM+ CME 12328 3801 -8527 0.31
T7 : Fenox+MSM+ CME 12462 3689 -8773 0.30
T8 : Fenox+Ethox 12548 3488 -9060 0.28
T9 : Fenox+Ethox 12682 3199 -9483 0.25
Page 119
JOURNAL OF PLANT DEVELOPMENT SCIENCES Vol. 6 (3) 473
T10 : Cyhalo+MSM+ CME 13006 3260 -9746 0.25
T11 : Cyhalo+Ethox 13226 2467 -10759 0.19
T12 : Weed free (HW at 20 and 40 DAS) 18370 23377 5007 1.27
T13: Weedy check 11070 10648 -422 0.96
SEm ±
CD at 5 %
451.39
1317.5
451.39
1317.5
0.03
0.10
Fenox = Fenoxaprop-p-ethyl, MSM = Metsulfuron methyl, CME = Chlorimuron ethyl, Ethox = Ethoxysulfuron,
Cyhalo = Cyhalofop–butyl, HW = Hand weeding
SUMMARY
The experiment comprising single application of
different post-emergence herbicides either alone or in
combination and hand weeding was conducted on
Vertisols of Instructional cum Research Farm at
College of Agriculture, Raipur during kharif season
of 2012. Echinochloa colona among grasses,
Cyperus iria among sedges and Alternanthera
triandra, Eclipta alba and Phyllanthus urinaria
among broad leaf weeds were dominant. Hand
weeding twice recorded the highest grain yield and
net return however application of ethoxysulfuron
registered the highest B:C ratio which was at par
with metsulfuron methyl + chlorimuron ethyl and
hand weeding twice.
REFERENCES
Kumara, O., Basavaraj Naik, T. and Palaiah, P. (2007). Effect of weed management practices and
fertility levels on growth and yield parameters in
Finger millet. Karnataka Journal of Agricultural
Sciences 20(2): 230-233.
Kushwaha HS, Tripathi ML and Singh VB. (2002). (Eds.). Weed management in coriander
(Coriandrum sativum). In: Proceeding of Second
International Agronomy Congress on Balancing
Food and Environment Security: a Continuing
Challenge (Eds.), Singh Panjab, IPS Ahlawat and
Gautam RC. Indian Society of Agronomy, IARI, New
Delhi: 985-987.
Lall, M. and Yadav, L.N.S. (1982). Critical time of
weed removal in finger millet. Indian Journal of
Weed Sciences 14: 85-88.
Prasad, T.V.R., Narasimha, N., Dwarakanath, N.,
Munegowda, M.K. and Krishnamurthy, K. (1991). Integrated weed management in drilled finger
millet (Eleusine coracana (L.) Gaertn.). Mysore
Journal of Agricultural Sciences 25(1): 13-17.
Reddy, S.R. (2007). Principles of Agronomy.
Kalyani Publishers. New Delhi third edition p.477.
Page 120
474 SRISHTI PANDEY, DAMINI THAWAIT AND H.L. SONBOIR
Page 121
________________________________________________ Journal of Plant Development Sciences Vol. 6 (3) : 475-476. 2014
PROSPECTS OF UTILIZING WATER CABBAGE (LIMNOCHARIS FLAVA (L.)
BUCHENAU) BIOMASS AS AN ALTERNATE ORGANIC MANURE SOURCE
Nishan, M.A, and Sansamma George*
Department of Agronomy, College of Agriculture, Vellayani, Thiruvananthapuram- 695 522, Kerala
[email protected]
Abstracts : Water cabbage (Limnocharis flava (L.) Buchenau) (Malayalam name: Malamkoovalam / Nagapola), an aquatic
invasive alien weed was introduced as an ornamental plant in India. Now it has invaded vast tracts of low lying wetland
system in Kerala and has become a serious threat to paddy cultivation. The weed clogs irrigation tanks and drainage
channels, resulting in poor drainage. The luxuriant vegetative growth coupled with the fast spreading root systems extract
large quantities of nutrient elements from the soil. Sannigrahi et al. (2002) reported that large scale utilization is the only
way to control noxious aquatic weeds which require no tillage, fertilizer or nourishment for their proliferation. Non
availability of good organic source at cheaper rates is another serious problem faced by farmers interested in organic crop
production. Information on quality of the weed biomass as a source of manure would motivate farmers to manage such
weeds through utilization. The present study was conducted to assess the possibility of utilizing the luxuriant weed biomass
of water cabbage through vermicomposting.
Keywords : Water, cabbage, utilization, fertilizer
INTRODUCTION
he experiment was conducted at College of
Agriculture, Vellayani, Thiruvananthapuram,
Kerala during 2012. Water cabbage plants were
collected from the field and vermicompost was
prepared using standard techniques, with weed
biomass alone or weed biomass mixed with crop
residues in 1:1 proportion on weight basis. The weed
plants collected were shade dried for 7 days and were
chopped to 5 to 7 cm size. The weed biomass alone
or combined with the crop residue was mixed with
cow dung in the ratio 8: 1 (water cabbage / water
cabbage + crop waste: cow dung) on weight basis.
The composting was done in cement rings of 1.0 m
diameter and 30 cm depth. Earth worms (Eudrilus
eugeniae) were introduced after 10 days when the
thermophilic stage of composting was over.
Adequate moisture was maintained by watering
regularly and fortnightly turning was given for
proper aeration. The compost maturity was judged by
its physical appearance such as the development of
dark brown to black colour with uniformly
disintegrated structure and C: N ratio. The N
content (Modified microkjeldahl method), P
content (Vanado-molybdo phosphoric yellow
colour method), K content (Flame photometer
method), and Fe, Mn and Zn content (Diacid
digestion method) were estimated for compost
samples (Jackson, 1973; Chesnin and Yien,
1951). Heavy metal content in the digested sample
(DTPA extractant) were determined by using Atomic
Absorption Spectrophotometer and expressed as ppm
(Lajunen, 1992).
RESULT AND DISCUSSION
The physical characteristics of the vermicompost
prepared from water cabbage biomass were found
promising. The product developed greyish brown
colour when composted alone while the compost had
brownish black colour when composted along with
crop residues. The product did not have any foul
smell and had an earthy or humus like odour when
composted alone or as 1:1 combination with crop
residue. When the weed biomass was
vermicomposted alone, the composting required 80
days for maturity while mixed with crop residue
(1:1) the compost was ready by 50 days. The
recovery percentage was 33 and 45 percent
respectively. The population of earthworms in the
former was also lower. The NPK content, EC and
pH were favorable for using the product as an
alternate organic source (Table.1). Moreover, there
was no weed seed germination when random samples
from the compost were tested for weed seed
germination.
The chemical analysis of the product revealed that
the content of copper in vermicompost was much
higher than the maximum permissible limit of 400
ppm as described by Canadian Council of Ministers
of the Environment (2005) (Table 2). However
concentration of the other heavy metals were quite
less than the limits prescribed for vermicompost
internationally. Thus it might be inferred that the
luxuriantly growing weed is promising for
bioremediation but its use as an organic manure is
debatable due to the very high content of some of the
heavy metals.
Table 1. Chemical properties of water cabbage vermicompost
Material pH EC OC% N% P% K% C:N Ratio C:P Ratio
Before composting 6 - 48 1.6 0.13 2 30:1 369:1
Weed biomass alone 7.12 4.2 32.2 1.4 0.48 1.3 23:1 67:1
Weed : crop residue (1:1) 7.59 0.2 32.4 1.8 0.44 1.17 18:1 73.6:1
T
SHORT COMMUNICATION
Page 122
476 NISHAN, M.A, AND SANSAMMA GEORGE
Table 2. Micronutrient composition of water cabbage vermicompost (ppm)
Elements Weed biomass alone Weed : crop residue (1:1)
Iron
Manganese
Copper
Zinc
Lead
Mercury
Cadmium
Nickel
Chromium
Cobalt
2820
1175
18435
220
0.007
0.054
0.1
0. 04
0.15
0. 015
2990
1135
10965
195
0.021
0.023
0.11
0.05
0.13
0.01
REFERENCES
Canadian Council of Ministers of the
Environment (CCME) 2005.Guidelines for
compost quality. 22p.
Chesnin, L. and Yien, C.R. (1951). Turbidimetric
determination of available sulphates. Proc. Amer.
Soc. Soil Sci., 15: 149-151
Jackson, M.L. (1973). Soil Chemical Analysis.
Second edition. Prentice Hall of India, New Delhi,
498 p.
Lajunen, L. H. J., Peramaki, P. (2004).
Spectrochemical analysis by atomic absorption and
emission. Royal Society of Chemistry, Cambridge
342p
Sannigrahi, A.K., Chakrabortty, S. and Borah,
B.C. (2002). Large scale utilization of water hyacinth
(Eichhornia crassipes) as raw material for
vermicomposting and surface mulching in vegetable
cultivation. Ecol. Env. Conserv. 8: 269-271.
Page 123
________________________________________________ Journal of Plant Development Sciences Vol. 6 (3) : 477-479. 2014
ANALYSIS OF FACTORS ASSOCIATED WITH THE PRODUCTIVITY OF
SCENTED RICE VARIETIES AMONGST THE TRIBAL FARMERS OF JASHPUR
DISTRICT (CHHATTISGARH)
Subodh Kumar Pradhan, M.A. Khan, V.K. Painkra and M.L. Sharma
Department of Agricultural Extension, IGKV, Raipur (CG)
Email: [email protected]
Abstract: The present study was conducted in Jashpur district (Chhattisgarh) among scented rice growing tribal farmers.
Total 4 blocks were purposively selected for the study and three villages were selected randomly from each selected block.
Twelve scented rice growing tribal farmers were selected randomly from each selected village. Thus the total 144 scented
rice growing farmers (12X12=144) were considered as respondent for this study. The results of the study revealed that the
productivity of scented rice varieties of respondents was found to be positively and high significantly related with the three
variables viz. extension participation, source of information and contact with extension personnel at 0.01 per cent level of
probability.
Keywords: Scented rice, productivity, adoption, factors
INTRODUCTION
ice is one of the important cereal crops of the
world and forms the staple food for more than
50 per cent of population and is known as “king of
cereals”. It provides staple diet to 2.7 billion people
in different parts of the world. It is grown in the
entire world, except Antarctica. It is occupying 150
million ha of area, producing 573 million tones rice
with an average productivity of 3.83 tones ha. (Singh
et al., 2013). The United Nations General assembly,
in a resolution declared the year of 2004 as the
“International Year of Rice”, which has tremendous
significance to food security. It very eloquently
upheld the need to heighten awareness about the role
of rice in alleviating poverty and malnutrition
(Manjunath, 2010).
Indian subcontinent is well known for its native
wealth of aromatic rice, of which basmati rice are
inexplicably exclusive. Many other traditional rice
varieties are also grown in some specific pockets of
the country. Scented rice occupies an important
status in domestic as well as in International market
due to its several outstanding qualities and therefore
they earn premium price. These indigenous tall
varieties possess some special characteristics, like
grains of some varieties are very small, some are fine
and some of them have peculiar fragrance and
colour. In addition to long grain Basmati type that
has high export potential, there are large number of
indigenous short-grained aromatic varieties
cultivated in Chhattisgarh and different pockets of
other states.
RESEARCH METHODOLOGY
The study was conducted during the year 2013-14 in
the Jashpur district of the Chhattisgarh state. Out of
total 8 blocks namely; Jashpur, Bagicha, Pathalgaon,
Pharsabahar, Kansabel, Kunkuri, Duldula and
Manora; 4 blocks (50% blocks) Pharsabahar,
Jashpur, Duldula and Bagicha blocks were selected
purposively. Thereafter, 12 tribal villages namely,
Garighat, Bhagora, Sikirma, Galonda, Lodam,
Rengola, Bamhani, Patratoli, Sirimkela, Jujgu,
Jurgum and Kurdeg were selected for this study on
the basis of maximum area under scented rice
varieties. In this way the 12 villages were selected
for the study. From each village, 12 scented rice
growers were selected randomly for collection of
data. In this way (12 X 12 = 144) a total of 144
scented rice growing farmers were selected for the
study. The data were collected personally through
pre-tested interview schedule. Collected data were
tabulated and processed by using appropriate
statistical tools and methods.
RESULT AND DISCUSSION
Correlation analysis of independent variables
with the productivity of scented rice varieties
Correlation coefficient between the selected
characteristics of the respondents with productivity
of scented rice varieties among scented rice growing
farmers was worked out and the values of correlation
coefficient are presented in Table 1.
It was found from the data that out of all selected
fifteen characteristics, the three variables viz.
extension participation, source of information and
contact with extension personnel were found to be
positive and high significantly correlated with
productivity at 0.01 per cent level of probability.
Whereas, the variables credit acquisition was found
to be positively and significantly correlated with the
productivity of scented rice at 0.05 per cent level of
probability. It shows that the productivity of scented
rice varieties increase by the increasing of
participation, source of information and contact with
extension personnel and credit acquisition.
The other eleven variables viz. age, education, family
size, social participation, occupation, land holding,
annual income, economic motivation, scientific
R
SHORT COMMUNICATION
Page 124
478 SUBODH KUMAR PRADHAN, M.A. KHAN, V.K. PAINKRA AND M.L. SHARMA
orientation, risk orientation and cultivation practices
has no statistically significant correlation with
productivity of scented rice varieties. So it is required
to intervene the significant factors for enhancing the
productivity of scented rice varieties.
Table 1: Coefficient of correlation of independent variables with the productivity of scented rice varieties
S. No. Independent Variables Coefficient of correlation “r” value
1 Age 0.032 NS
2 Education -0.027 NS
3 Family size 0.019 NS
4 Social participation 0.116 NS
5 Extension participation 0.412**
6 Occupation -0.052 NS
7 Land holding 0.036 NS
8 Annual income 0.035 NS
9 Credit acquisition 0.177*
10 Source of information 0.364**
11 Contact with extension personnel 0.402**
12 Economic motivation 0.034 NS
13 Scientific orientation -0.090 NS
14 Risk orientation -0.089 NS
15 Sowing method -0.111 NS
*Significant at 0.05 level of probability (“r” value = 0.162)
** Significant at 0.01 level of probability (“r” value = 0.212)
NS = Non-Significant
It can be concluded that the highly positive
significant correlation coefficient was found to be in
extension participation (r = 0.412), in source of
information (r = 0.364) and in contact with extension
personnel (r = 0.402) respectively as compared to
other variables.
Multiple regression analysis of independent
variables with the productivity of scented rice
varieties
The results of multiple regression analysis are
presented in Table 2. The results of multiple
regression analysis reveals that, out of 15
independent variables, three variables extension
participation, land holding and scientific orientation
contributed significantly towards productivity at 0.05
per cent level of probability.
The variables age, education, family size, social
participation, occupation, land holding, annual
income, credit acquisition, source of information,
contact with extension personnel, economic
motivation, risk orientation and cultivation practices
had no significant contribution in productivity of
scented rice varieties.
Table 2: Multiple regression analysis of independent variables with the productivity of scented rice varieties
S. No. Independent variables “t” value Regression coefficient
“b” value
1 Age 1.67946 0.06679
2 Education -0.31743 -0.08746
3 Family size -0.74836 -0.48420
4 Social participation 1.03043 0.46021
5 Extension participation 2.15034 0.81583*
6 Occupation 0.20087 0.09253
7 Land holding -2.01382 -0.43144*
8 Annual income 0.13516 0.00000
9 Credit acquisition 0.19500 0.14097
10 Source of information 0.19422 0.02883
11 Contact with extension personnel 1.41878 0.41168
12 Economic motivation 0.09642 0.02221
13 Scientific orientation -2.01132 -0.27855*
14 Risk orientation -0.85164 -0.14217
15 Sowing method -0.56129 -0.40477
** Significant at 0.01 level of probability („t‟ value = 2.610) R2 = 0.295
*Significant at 0.05 level of probability („t‟ value =1.97) F value of r = 3.56
NS = Non-significant
Page 125
JOURNAL OF PLANT DEVELOPMENT SCIENCES Vol. 6 (3) 479
CONCLUSION
From the study, according to the correlation analysis,
it was found from the data that out of all selected
characteristics, the three variables viz. extension
participation, source of information and contact with
extension personnel were found to be positive and
high significantly correlated with productivity of
scented rice varieties at 0.01 per cent level of
probability. While multiple regression analysis
reveals that, out of 15 independent variables, three
variables namely extension participation, land
holding and scientific orientation contributed
significantly towards productivity at 0.05 per cent
level of probability.
REFERENCES
Anonymous (2012). Model training course on rice
production technology. Directorate of Extension
Services, IGKV, Raipur (C.G.). pp 1-119.
Lakra, P. K. (2011). A study on extent of adoption
of hybrid rice production technology by the tribal
farmers of Surguja district of Chhattisgarh. M.Sc.
(Ag.) Thesis, IGKV, Raipur (C.G.).
Manjunath, T. (2010). A study on knowledge and
adoption of plant protection measures by paddy
growers of raichur district. M.Sc. (Ag.) Thesis,
University of Agricultural Sciences, Dharwad.
Singh, H.C., Kumar, R. and Singh, S. (2013).
Impact of knowledge on adoption of integrated pest
management practices by paddy growers. Indian
Research Journal of Extension Education 13 (3): 34.
Page 126
480 SUBODH KUMAR PRADHAN, M.A. KHAN, V.K. PAINKRA AND M.L. SHARMA
Page 127
________________________________________________ Journal of Plant Development Sciences Vol. 6 (3) : 481-483. 2014
ANALYSIS OF FACTORS ASSOCIATED WITH THE TECHNOLOGICAL GAP IN
ADOPTION OF RECOMMENDED PRODUCTION TECHNOLOGY OF BLACK
GRAM AMONG TRIBAL FARMERS OF JASHPUR DISTRICT (CHHATTISGARH)
Virendra Kumar Painkra, M.A. Khan, S.K. Pradhan and M.L. Sharma
Department of Agricultural Extension, IGKV, Raipur (CG)
Email: [email protected] Abstract: Present study was conducted in Jashpur district (Chhattisgarh) among tribal farmers. Total three blocks were
purposively selected for the study; four villages were selected randomly from each selected block to make a total of 12
villages in the sample. Ten black gram producing tribal farmers were selected randomly from each selected village. Thus the
total 120 black gram growers (10X12=120) were considered as respondent for this study. The results of the study revealed
that the technological gap of respondents was found to be negatively and significantly related with the independent variables
viz.:- extension participation, land holding, annual income, credit acquisition, source of information, contact with extension
personnel, knowledge level.
Keywords: Technological gap, black gram
INTRODUCTION
hough India is the world’s largest producer of
pulses but still it imports a large amount of
pulses to meet the growing domestic needs. During
2009-10, India imported 3.5 million tons of pulses
from the countries like Australia, Canada and
Myanmar. (FAOSTAT 2010), Black gram (Vigna
mungo) which belongs to Fabaceae (Leguminoceae)
family, originated from India. Urd is an important
food legume widely consumed in India. It is one of
the most widely cultivated pulse crops in the country.
It is grown over an area of about 30 lakh ha with a
production of about 13 lakh tones, the average
productivity of about 0.4 t/ha. Is still a challenge
which has to be increased, Black gram is mainly
cultivated in Indian subcontinent. Black lentil is
nothing but the split black gram and after removing
black skin it is sold as white lentil. In India Black
gram is popular as “Urad dal” and it is highly prized
pulse among all the pulses. Black gram, also known
as urdbean, mash, black maple etc. an important
short-duration pulse crop grown in many parts of
India. This crop is grown in cropping systems as a
mixed crop, catch crop, sequential crop besides
growing as sole crop under residual moisture
conditions after the harvest of rice and also before
and after the harvest of other summer crops under
semi-irrigated and dry land conditions. Its seeds are
highly nutritious with protein (25-26%),
carbohydrates (60%), fat (1.5%), minerals, amino
acids and vitamins. Seeds are used in the preparation
of many popular Indian dishes. It is one of the most
important components in the preparation of famous
south Indian dishes, e.g. dosa, idli, vada etc. besides,
it adds about 42 kg Nitrogen per hectare in soil. It is
also valued as a green manure crop. Its dry stalks
along with pod husk forms a nutritive fodder
especially for milch cattle. Black gram possesses
deep root system, which binds soil particles and thus
prevents soil erosion.
In Chhattisgarh, black gram is cultivated in 177.77
thousand ha area with production of 73.51 tons in the
year 2011 (Agridept.cg.gov.in), Raigarh is 1st rank in
cultivating area of 17.30 thousand ha with production
of 4 thousand metric tons, Surguja accounts 14.81
thousand ha with 4.01 metric tons production
followed by Jashpur district with area 14.42 thousand
ha and production of 5.11 metric tons. The
productivity of black gram in the state is only 0.41
t/ha which is far behind than the potential. The study
is therefore concerned about assessment of such
technological gap in production of black gram
particularly among tribal farmers and the findings
will throw light on these aspects to meet out the
challenges in Jashpur district.
RESREARCH METHODOLOGY
The study was conducted in Jashpur district of
Chhattisgarh, during the year 2013-14. Out of total 8
blocks in the district (Jashpur, Bagicha, Pharsabahar,
Pathalgaon, Kunkuri, Kansabel, Manora and
Duldula), only three blocks i.e, Pharsabahar, Bagicha
and Jashpur were selected purposively because of
maximum area under black gram cultivation.
Villages were selected randomly from each selected
block to make a total of 12 villages in the sample.
Randomly selected villages are following: Baro,
Mahuwadih, Khutsera, Jamtoli, Kutma, Bamba,
Pasiya, Sanna, Lodam, Putrichaura, Koleng and
Jabla. Ten black gram producing tribal farmers were
selected randomly from each selected village. Thus
the total 120 black gram growers (10X12=120) were
considered as respondent for this study. The data
were collected personally through pre-tested
interview schedule. Collected data were tabulated
and processed by using appropriate statistical tools
and methods.
T
SHORT COMMUNICATION
Page 128
482 VIRENDRA KUMAR PAINKRA, M.A. KHAN, S.K. PRADHAN AND M.L. SHARMA
RESULT AND DISCUSSION
Correlation analysis of sixteenth independent
variables i.e.: age, education, family size, social
participation, extension participation, farming
experience, occupation, land holding, annual income,
credit acquisition, irrigation facility, source of
information, contact with extension personnel,
scientific orientation, risk orientation and knowledge
level with technological gap in adoption of
recommended production technology of black gram.
Table 1 depicts that out of sixteen variables only
seven variables were negatively and significantly
correlated at 0.01 level of probability with
technological gap in production of production
technology of black gram among tribal farmers these
variables are: - extension participation, land holding,
annual income, credit acquisition, source of
information, contact with extension personnel and
knowledge level of recommended production
technology of black gram, of which only occupation
had positively and significantly correlated with
technological gap. It’s meant technological gap in
adoption of recommended production technology of
black gram decrease by increasing of extension
participation, land holding, annual income, and credit
acquisition, source of information, contact with
extension personnel and knowledge level of
recommended production technology of black gram,
where as occupation and technological gap increase
or decrease in similar direction. Whereas remaining
eight variables i.e. age, education, family size, social,
participation, farming experience, irrigation facility,
scientific orientation and risk orientation non-
significantly correlated with technological gap in
adoption of recommended production technology of
black gram. It is therefore required to intervene the
significant factors for reducing the technological gap
in adoption of blackgram production technology.
Table 1: Coefficient of correlation of independent variables with the Technological gap in adoption of
recommended production technology of black gram (n=120)
S.N. Independent variables Coefficient of correlation “r” value
1. Age -0.058NS
2. Education -0.047NS
3. Family size -0.006NS
4. Social participation -0.050NS
5. Extension participation -0.434**
6. Farming experience -0.128NS
7. Occupation 0.381**
8. Land holding -0.338**
9. Annual income -0.445**
10. Credit acquisition -0.363**
11. Irrigation facility 0.012NS
12. Source of information -0.266**
13. Contact with extension personnel -0.597**
14. Scientific orientation -0.162NS
15. Risk orientation -0.112NS
16. Knowledge level -0.702**
**Significant at 0.01 level of probability *Significant at 0.05 level of probability NS=Non significant
Multiple regression analysis of independent variables
with the technological gap in adoption of
recommended production technology of black gram
is compiled in Table 2. It revealed that out of the
sixteen variables under study, two variables viz.
contact with extension personnel and knowledge
level had significant contribution with technological
gap at 0.01 per cent level of probability. Whereas
age, education, family size, social participation,
extension participation, farming experience,
occupation, land holding, annual income, credit
acquisition, irrigation facility, source of information,
scientific orientation and risk orientation had shown
non-significant contribution to the technological gap
in adoption of recommended production technology
of black gram.
Table 2: Multiple regression analysis of independent variables with the technological gap in adoption of
recommended production technology of black gram (n=120)
S.N. Variables "t' value Regression coefficient "b" value
1. Age 1.146 0.082 NS
2. Education 1.031 0.375 NS
3. Family size -0.190 -0.125 NS
Page 129
JOURNAL OF PLANT DEVELOPMENT SCIENCES Vol. 6 (3) 483
4. Social participation 0.087 0.118 NS
5. Extension participation -1.165 -0.532 NS
6. Farming experience -0.858 -0.066 NS
7. Occupation 1.464 1.246 NS
8. Land holding -0.282 -0.098 NS
9. Annual income -1.388 -0.763 NS
10. Credit acquisition -0.564 -0.618 NS
11. Irrigation facility 1.271 0.753 NS
12. Source of information 1.743 0.404 NS
13. Contact with extension personnel -4.690 -2.709**
14. Scientific orientation -1.535 -0.103 NS
15. Risk orientation -0.002 0.006 NS
16. Knowledge level -5.986 -0.337**
** Significant at 0.01 level of probability R2 = 0.657
* Significant at 0.05 level of probability F value of R = 12.37 NS = Non significant
CONCLUSION
The technological gap among tribal farmers was
found to be negatively and significantly related with
the extension participation, land holding, annual
income, credit acquisition, source of information,
contact with extension personnel and knowledge
level of recommended production technology of
black gram. Occupation was positively and
significantly related with the technological gap in
adoption of recommended production technology of
black gram.
Whereas age, education, family size, social,
participation, farming experience, irrigation facility,
scientific orientation and risk orientation non-
significantly correlated with technological gap in
adoption of recommended production technology of
black gram.
Regarding multiple regression analysis, only two
variables were negative significantly contribution
towards technological gap at 0.01 level of
probability.
REFERENCES
Kumar, S. (2009). A study on technological gap in
adoption of the improved cultivation practices by the
soybean growers. M. Sc. (Ag.) Thesis, UAS
Dharwad.
Naruka, P. S., Henry, C., Pachauri, C. P.,
Sarangdevot, S. S. and Kumar, Sanjay (2010).
Relationship between technological gap in the
recommended soybean production technology and
the selected independent variables. Rajasthan
Journal of Extension Education 17&18:136-139
Patel, M. K. (2008). A Study on Technological Gap
in Recommended Soybean Production Technology
among the Farmers of Kabirdham District of
Chhattisgarh State. M. Sc. (Ag.) Thesis, IGKV
Raipur.
Saxena, B. (2003). Study on knowledge and
adoption level of tomato production technology
among the farmers of Jashpur district in
Chhattisgarh. M. Sc. (Ag.)Thesis, IGKV Raipur.
Singh, B. (2011). Factors influencing the adoption of
mung bean Production technology in arid zone of
Rajasthan. Rajasthan Journal of Extension Education
19:173-177.
Page 130
484 VIRENDRA KUMAR PAINKRA, M.A. KHAN, S.K. PRADHAN AND M.L. SHARMA
Page 131
________________________________________________ Journal of Plant Development Sciences Vol. 6 (3) : 485-486. 2014
MAJOR WEED SPECIES IN FINGER MILLET
Srishti Pandey, H.L. Sonboir and Damini Thawait
Deptt. of Agronomy, College of Agriculture, Raipur, Chhattisgarh
Abstract : The experiment comprising 13 weed management practices which comprised single application of different post-
emergence herbicides either alone or in combination and hand weeding was conducted on Clayey Vertisols soil of College of
Agriculture, Raipur during kharif season of 20012. Echinochloa colona among grasses, Cyperus iria among sedges and
Alternanthera triandra, Eclipta alba and Phyllanthus urinaria among broad leaf weeds were dominant. Over all the most
dominant species was Echinochloa colona which ranged between 24-46 per cent at all the growth stages.
Keywords: Major weed species, finger millet
INTRODUCTION
inger millet (Eleusine indica) is an important
small millet crop that is hardy and grows well in
dry zones as rain-fed crops. It is used both as
medicinal and traditional purposes. Finger millet is a
high statue crop with slower initial growth which
remains under smothering due to the infestation of
weeds at early stages of growth. This situation causes
higher competition and may result in drastic
reduction in yield (Kushwaha et al., 2002). The
production and productivity of the country is lower
because of weeds pose one of the major constraints
in the production of finger millet. Owing to initial
slow growth of the finger millet favours weed
growth, which cause more competition for sunlight,
nutrient and water in early stages of growth lead in
lowering productivity (Kumara et al., 2007). The
critical period of crop weed competition for the
finger millet varies from 25-45 days after sowing
(Lall and Yadav, 1982). Weeds compete with crop
plants for water, nutrients, space and solar radiations
by reduction of yield upto 20 to 50 per cent.
(Kushwaha et al., 2002). According to various
research work major weed flower was observed in
finger millet crop was Cyperus rotundus among
sedges, Echinochloa colona, Digitaria marginata,
Cynodon dactyton, Chloris barbata, Erograstis
uniloides, Panicum spp., Eleusine indica and Setaria
glauca, among monocot and Commelina
benghalensis, Acanthospermum hispidum, Portulaca
oleracea, Borreria hispida, Amaranthus viridis,
Phyllantlus niruri, Argemone mexicana, Cleome
monophylla, Crotons sparsiflorus, Emilia
sanchifol1a, Euphorbia hirta, Euphorbia geniculata,
Legasca mollis, Parthenium hysterophorus, Tridax
procumbens, Ipomoea eriopcarp, Hibiscus asper
and Spilanthus ecmela among broad leaf weeds.
MATERIAL AND METHOD
The present investigation entitled “Evaluation of
post-emergence herbicides for weed management in
direct sown Finger millet.” was carried out at
Instructional cum Research Farm, Indira Gandhi
Krishi Vishwavidyalaya, Raipur (C.G.) India, during
the kharif season (July-November) 2012. The soil of
experimental field was Clayey (Vertisols). The
experiment was laid out in randomized block design
(RBD) with three replications. There were thirteen
treatments of post-emergence herbicides along with
two hand weeding and untreated control. The finger
millet cultivar “GPU-28” was sown and harvested on
11th
July, 2012 and 20th
November, 2012
respectively, using seed rate of 10 kg ha-1
at 25 cm
distance. Weed counts (number m-2
) was recorded by
putting a quadrate (0.25 m-2
) at random spots in each
plot and relative weed density (%) was calculated by
using the formula
DRelative weed density % 100
Td
D = Weed density of weedy check plot of different
weed species at different interval
Td = total weed density of weedy check plot
RESULT AND DISCUSSION
Weeds The major weed flora of experimental field consisted
of Echinochloa colona, Phyllanthus urinaria, Eclipta
alba, Alternanthera triandra and Cyperus iria. The
major weeds species were observed in weedy check
which has been presented in Table 1.
Table 1 : Major weeds species observed in the experiment field
S. No. Scientific name Family Common name Group
1 Echinochloa colona Poaceae Sawan/Jungle rice Grasses
2 Cyperus iria Cyperaceae Motha/Yellow
nutsedge
Sedges
3 Alternanthera triandra Compositae Resham kanta Broad leaf
4 Eclipta alba compositeae Bhringraj/False daisy Broad leaf
5 Phyllanthus urinaria Euphorbiaceae Dodania Broad leaf
F
SHORT COMMUNICATION
Page 132
486 SRISHTI PANDEY, H.L. SONBOIR AND DAMINI THAWAIT
Table 2: Weed density and relative weed density at different interval in weedy check in direct seeded finger
millet S.
No.
Major weed
species
Weed density (m-2) Relative weed density %
15
DAS
30
DAS
45
DAS
60
DAS
75
DAS
90
DAS
15
DAS
30
DAS
45
DAS
60
DAS
75
DAS
90
DAS
1. Echinochloa
colona
30.0
0
85.00 100.6
7
72.00 64.00 52.6
7
40.36 45.78 36.26 24.30 29.22 35.51
2. Cyperus iria 2.34 18.00 35.00 67.00 20.33 8.33 3.15 9.69 12.60 22.61 9.28 5.62
3. Alternanthe
ra triandra
9.00 9.33 25.00 26.67 20.00 18.33
12.11 5.03 9.00 9.00 9.13 12.36
4. Eclipta alba 3.33 18.33 51.33 59.67 57.33 28.67
4.48 9.87 18.49 20.14 26.18 19.33
5. Phyllanthus
urinaria
13.67
30.33 35.33 38.33 30.67 26.33
18.39 16.34 12.72 12.93 14.00 17.75
6. Other weed
species
16.00
24.67 30.33 32.67 26.67 15.33
21.52 13.29 10.92 11.02 12.18 10.34
Total weed
species
74.3
4
185.6
6
277.6
6
296.3
4
219 149.
66
100.0
0
100.0
0
100.0
0
100.0
0
100.0
0
100.00
The weed flora composition (%) at different stages of
direct seeded finger millet is given in Table 1. At 15
DAS, the percentage composition of Echinochloa
colona (28%) was recorded highest followed by
other weed species (20%) and Phyllanthus urinaria
(29%). At 30 DAS the percentage composition of
Echinochloa colona (29%) followed by Phyllanthus
urinaria (17%) and 45 DAS the percentage
composition of Echinochloa colona (25%) was
recorded highest followed by Eclipta alba (18%)
while, at 60 DAS, the composition of Echinochloa
colona (20%) was recorded highest. At 75 and 90
DAS, the percentage composition of Echinochloa
colona (22% and 25%, respectively) was recorded
highest followed by Eclipta alba (21% and 19%,
respectively). At harvest the percentage composition
of Alternanthera triandra (39%) was recorded
highest followed by other weed species (33%).
Over all the most dominant species was Echinochloa
colona which ranged between 24-46 per cent at all
the growth stages. It was followed by Phyllanthus
urinaria (13-18 %), Eclipta alba (5-26 %), Cyperus
iria (3-23 %) and Alternanthera triandra (5-12 %).
Other weed species like Commelina benghalensis,
Cynodon dactylon, Cynotis axillari, Cyperus
rotundus, Euphorbia hirta, Euphorbia geniculata,
Fimbristylis miliacaea etc. were also observed in the
experiment field in negligible quantum. These results
were in conformity with Pradhan et al. (2010) and
Gowda et al. (2012).
REFERENCES
Gowda, S.G.K., Naveen, D.V., Bhagyalakshmi, T.
and Gowda, R.C. (2012). Weed management
practices on nutrient removal by weeds and its
relation to yield of finger millet in eastern dry zone
of Karnataka. International Journal of Agricultural
Sciences 8 (2):385-389.
Kumara, O., Basavaraj Naik, T. and Palaiah, P. (2007). Effect of weed management practices and
fertility levels on growth and yield parameters in
Finger millet. Karnataka Journal of Agricultural
Sciences 20(2): 230-233.
Kushwaha HS, Tripathi ML and Singh VB. (2002). (Eds.). Weed management in coriander
(Coriandrum sativum). In: Proceeding of Second
International Agronomy Congress on Balancing
Food and Environment Security: a Continuing
Challenge (Eds.), Singh Panjab, IPS Ahlawat and
Gautam RC. Indian Society of Agronomy, IARI, New
Delhi: 985-987.
Lall, M. and Yadav, L.N.S. (1982). Critical time of
weed removal in finger millet. Indian Journal of
Weed Sciences 14: 85-88.
Pradhan, A., Rajput, A.S., and Thakur, A. (2010).
Effect of weed management on growth and yield of
finger millet. Indian Journal of Weed Science
42(1&2): 53-56.
Page 133
________________________________________________ Journal of Plant Development Sciences Vol. 6 (3) : 487-489. 2014
IMPACT OF WEED MANAGEMENT PRACTICES ON WEED CONTROL,
NODULATION, RHIZOBIUM POPULATION AND YIELD IN SOYBEAN
Bhumika Patel1, V.K. Gupta
2, Rajendra Lakpale
3 and Pritee Awasthy*
4
Indira Gandhi Krishi Vishwavidyalaya, Raipur (Chhattisgarh), India
* Email: [email protected]
Absract: The experiment using JS 97-52 variety of soybean was laid out during kharif season of 2013 at the Research Cum
Instructional Farm, Indira Gandhi Krishi Vishwavidyalaya, Raipur (C.G.) using Randomized Block Design, comprising four
replications and eight treatments. The result revealed that highest number of root nodules plant-1 was recorded under hand
weeding twice at 20 and 40 DAS, however it was found comparable with Sulfentrazone @ 300 g a.i. ha-1as PE +
Imazethapyr @ 100 g a.i. ha-1 as PoE. The lowest root nodules plant-1 was registered under untreated control. Maximum dry
weight of nodules plant-1 was recorded under hand weeding twice at 20 and 40 DAS as compared to other treatments,
however it was on par with Sulfentrazone @ 360 g a.i. ha-1 as PE and Sulfentrazone @ 300 g a.i. ha-1as PE + Imazethapyr
@ 100g a.i. ha-1 as PoE . The lowest weight of root nodules plant-1 was registered under untreated control. Maximum
rhizobial population was observed under treatment untreated control, which was at par with treatment hand weeding twice at
20 and 40 DAS, and minimum rhizobial population was observed under treatment Pendimethalin @ 1 kg a.i. ha-1 as pre-
emergence.Minimum density and dry weight of weeds were also registered under Hand weeding twice at 20 and 40 DAS.
Keywords: Nodule number, rhizobium population, weed control, soybean
INTRODUCTION
oybean [Glycine max (L.) Merrill] is an
important oil-yielding leguminous crop having
multiple uses. Due to its various uses soybean is
rightly called “Golden Gift” of nature to mankind.
Soybean known as a „Miracle Crop‟ because it
contains about 40-42 per cent high quality protein,
20-22 per cent edible oil, 20-30 per cent
carbohydrates, large amount of phosphorus, high
level of amino acids such as Lysine, Lucien, Lecithin
and vitamins. Soybean builds up the soil fertility by
fixing atmospheric nitrogen (45 to 60 kg ha-1
)
through the root nodules, and adds about 0.5 to 1.5
tonnes ha-1
organic matter in soil through leaf fall
(Kanase et al., 2006). It is able to leave residual
nitrogen effect for succeeding crop equivalent to 35-
40 kg N ha.-1
Soybean can tolerate mild drought as
well as floods. This characteristic has made soybean
to fit well in sustainable agriculture.At Raipur (C.G)
most prominent weeds observed in soybean
Echinochloa colona, Cyperus rotundus, Euphorbia
spp., Commelina benghalensis, Phyllanthus niruri,
(Kolhe et al et al., 1998).The critical period of crop-
weed competition in soybean is reported to be first
DAS (Swarnakar, 2010).In soybean, the weed flora
as observed from the unweeded control plots consist
of 58% sedges, 32% broad-leaved weeds and 10%
grasses.Hand weeding is a traditional and effective
method of weed control, but untimely and continuous
rains as well as unavailability of labour at peak time
are main limitations of manual weeding. The only
alternative that needs to be explored is the use of pre
as well as post-emergence herbicides. The screening
of such herbicides in soybean reveals their efficiency
against either monocotyledonous or dicotyledonous
weeds. Many herbicides like sulfentrazone, and
imazethapyr are available at present day giving
effective and broad spectrum weed control in
soybean. In the present study, an attempt was made
to evaluate cultural practices and selective herbicides
for the control of weeds and to find out the effect of
weed-control methods on yield of soybean.
MATERIAL AND METHOD
A field experiment was conducted at Research Cum
Instructional Farm, Indira Gandhi Krishi
Vishwavidyalaya, Raipur (C.G.) during kharif
seasons of 2013. The soil of experimental field was
clayey in texture, low in nitrogen, medium in
phosphorus and high in potassium contents with
neutral pH. The experiment was laid out in
Randomized Block Design, comprising four
replication and eight treatments which included
Sulfentrazone 48 % F 300 g a.i ha-1
as pre-
emergance, Sulfentrazone 48 % F 360 g a.i ha-1
as
pre- emergence, Pendimethalin 30 EC 1 kg a.i ha-1
as
pre-emergence, Sulfentrazone 48 % F 300 g a.i ha-1
as pre -emergance + Imazethapyr 10 SL as Post-
emergance, Sulfentrazone 48 % F 300 g a.i ha-1
as
pre -emergance + one hand weeding , Sulfentrazone
48 % F 300 g a.i ha-1
as pre -emergance + hoeing ,
hand weeding twice at 20 and 40 DAS and untreated
control . Soybean variety JS 97-52 was sown with
spacing of 30 cm x 7cm during the last week of June
and the seed rate of 83.33 kg ha-1
and fertilizer dose
was 25, 60 and 40 kg/ ha of N, P2O5 and K2O
respectively was used, at the time of sowing. Yield
attributes were recorded at harvest. Observations of
weeds, number and dry weight of nodules were
recorded at 60 DAS. Analysis of rhizobium
population in soil was done by serial dilution plating
method (Subba Rao 1988).
S
SHORT COMMUNICATION
1.M.Sc. (Ag.) Scholar, 2 & 3. Principal Scientist, 4. Ph.D Scholar
Page 134
488 BHUMIKA PATEL, V.K. GUPTA, RAJENDRA LAKPALE AND PRITEE AWASTHY
RESULT AND DISCUSSION
Higher number of root nodules plant-1
was recorded
under treatment twice hand weeding at 20 and 40
DAS (T7) as compared to other treatments, however
it was found comparable with Sulfentrazone @ 300 g
a.i. ha-1
as PE + Imazethapyr @ 100g a.i. ha-1
as PoE
(T4). The lowest root nodules plant-1
was registered
under untreated control (T8).
Increased number of root nodules plant-1
in above
treatments might be due to the favourable
microclimate after suppression of weeds near the root
zone of soybean crop. Higher nodulation fixed the
atmospheric nitrogen which ultimately supported in
higher crop growth of soybean. Increased number of
nodules up to 60 DAS might be due to less weed and
favourable micro climate. Furthermore, nodules
count in the above treatments might be due to greater
infection Rhizobium in the growing roots. Increased
number of nodules up to 60 DAS might be due to
less weed and favourable micro climate.
Furthermore, nodules count in the above treatments
might be due to greater infection Rhizobium in the
growing roots. The increased in nodule number
probably due to increased aeration of Rhizosphere.
On the contrary, in rest of the treatments, limitation
of soil moisture and nutrients for plant uptake,
adversely affected the nodulation and decline
nitrogenase activity.
Higher dry weight of nodules plant-1
was recorded
under hand weeding twice at 20 and 40 DAS (T7) as
compared to other treatments, however it was on par
with Sulfentrazone @ 360 g a.i. ha-1
as PE (T2) and
Sulfentrazone @ 300 g a.i. ha-1
as PE +
Imazethapyr @ 100g a.i. ha-1
as PoE (T4). The
lowest weight of root nodules plant-1
was registered
under untreated control (T8). Increased dry weight of
nodules in the above treatments might be due to more
nodule count and greater infection of Rhizobium in
the growing roots. Lowest dry weight of nodule
might be due to more crop-weed competition and
effect of herbicides.
Rhizobial population (x 106 g
-1 soil) of soybean field
was counted at 60 DAS and data are presented in
Table 1. maximum rhizobial population was
observed under treatment untreated control (T8),
which was at par with treatment hand weeding twice
at 20 and 40 DAS (T7), whereas significantly
minimum rhizobial population was observed under
treatment Pendimethalin @ 1 kg a.i. ha-1
as pre-
emergence (T3). The highest rhizobial population
observed under untreated control (T8) followed by
hand weeding twice at 20 and 40 DAS (T7), and
incomparable treatments might be due to the
favourable microclimate and absence of herbicidal
effect. Lowest Rhizobial population was observed
under Pendimethalin @ 1 kg a.i. ha-1
as pre-
emergence (T3) might be due to more crop-weed
competition and herbicidal effects. Similar findings
were reported by Jeenie and Sharma (2011).
The experimental site was dominated by Parthenium
hysterophorus, Euphorbia geniculata, Digera
arvensis, Commelina benghalensis, Convolvulus
arvensis, Echinocloa colona, Cynodon dactylon and
Cyperus rotundus. Density of weeds were observed
significantly maximum under Untreated control and
significantly minimum density was recorded under
Hand Weeding twice at 20 and 40 DAS. This was
because no any weed management practices was
applied to control weeds under untreated control plot,
which freely proliferated and compete with the crop
for available nutrient, moisture and sunlight resulting
in reduction of crop yield. Similar results were
observed by Idapuganti et al. (2005) and Pal et al
(2013). Dry matter production by weeds were
observed significantly maximum under Untreated
control and significantly minimum production of dry
matter under treatment Hand weeding twice at 20
and 40 DAS. Idapuganti et al. (2005) and Karande et
al. (2008) also reported similar results from their
study. The total production of dry matter by weeds
was significantly highest under Untreated control
throughout the crop growth period, which was due to
absence of suitable weed management practices,
which leads to accumulation of more dry matter in
weeds upto harvest.
Table 1: Effect of weed management practices on number and dry weight of nodules, rhizobium population,
weed density and dry weight of weeds in soybean
Treatments Number of
nodules
plant-1
Dry
weight of
nodules
(g plant-1
)
Rhizobium
population
(x 106 g
-1 soil)
Weed
density
(No m-2
)
Dry weight of
weeds
(g m-2
)
T1-Sulfentrazone 48 % F @
300 g a.i ha -1
as PE
78.3 0.98 42 6.1
(37.2) 3.8
(14.2)
T2-Sulfentrazone 48 % F@ 360
g a.i ha -1
as PE
87.8 1.25 37 5.9
(23.5) 3.1
(9.6)
T3- Pendimethalin 30 EC @ 1
kg a.i ha -1
as PE
73.8 0.86 32 8.2
(66.4) 5.2
(28.9)
T4- Sulfentrazone 48 % F @
300 g a.i ha -1
as PE fb
97.3 1.19 26 2.8
(7.2) 2.0
(3.9)
Page 135
JOURNAL OF PLANT DEVELOPMENT SCIENCES Vol. 6 (3) 489
Imazethapyr 10 SL @ 100 g a.i
ha -1
as PoE T5-Sulfentrazone 48 % F@
300g a.i ha -1
as PE fb One
Hand Weeding at 25 DAS
80.3 1.03 47 5.4
(28.6) 3.7
(13.2)
T6-Sulfentrazone 48 % F@ 300
g a.i ha -1
as PE fb Hoeing at
25 DAS
76.1 0.92 49 6.6
(42.9) 4.2
(17.4)
T7-Hand weeding twice at 20
and 40 DAS
99.2 1.49 54 2.5
(6) 1.3
(1.2)
T8-Untreated control 63.2 0.61 62 12.3
(152.3) 12.1
(147.7)
SEm ± 0.8 0.12 1.7 1.9 2.3
CD (P=0.05) 2.8 0.43 5.1 5.6 6.7
Figures in the parentheses are original values; data were transformed through which are given in bold
REFERENCES
Idapuganti, R.G., Rana, D.S. and Sharma,R. (2005). Influence of integrated weed management on
weed control and productivity of soybean [Glycine
max (L.) Merrill]. Indian Journal of Weed Science 37
(1/2): 126-128.
Jeenie, P. and Sharma, V. (2011). In vitro
sensitivity of rhizobium and phosphate solubilising
bacteria to herbicides. Indian Journal of
Microbiology 51 (2): 230-233.
Karande, D.R., Kadam, G.L., Talnikar, A.S. and
Jogdand, P. B. (2008). Integrated weed management
in soybean (Glycine max). International Journal of
Agricultural Science 4 (1): 107-113.
Kolhe, S.S., Choubey, N.K. and Tripathi, R.S. (1998). Evaluation of fenoxaprop-p-ethyl and
lactofen in soybean. Indian Journal of Weed Science
36(3-4): 216-217.
Pal, D., Bera, S. and Ghosh, R.K. (2013).Influence
of herbicides on soybean yield, soil microfiora and
urease enzyme activity.Indian Journal of Weed
Science 32 (3&4): 135-139.
Subba Rao, N.S. (1988). Biological nitrogen
fixation. Oxford and I.B.H. Pub. Co., New Delhi.
Swarnakar, V.K. (2010). Study of critical crop-
weed competition period in soybean (Glycine max
L.). M.Sc. (Ag.) Thesis Department of Agronomy,
College of Agriculture, IGKV, Raipur (C.G.).
Page 136
490 BHUMIKA PATEL, V.K. GUPTA, RAJENDRA LAKPALE AND PRITEE AWASTHY
Page 137
________________________________________________ Journal of Plant Development Sciences Vol. 6 (3) : 491-493. 2014
PROBING BEHAVIOUR OF NILAPARVATA LUGENS (STAL.) ON RICE PLANT
AS INFLUENCED BY POTASH APPLICATION
Swati Sharma, 1 Ashish Kumar Sharma
2 and Damini Thawait
3
1 Department Of Entomology IGKV, Raipur,
2 Department Of Entomology IGKV, Raipur
3 Department Of Agronomy IGKV, Raipur
Email: [email protected] Abstract: Rice is an important cereal crop of the world which is known to be attacked by several insect pest during its
different development stages out of these brown plant hopper (Nilaparvata.lugens) is an important insect pest of rice. The
main approach for the management of this pest has been through the chemical methods which has resulted several problems;
therefore the fertilizer components affecting the biophysical parameters of the host ultimately influencing the probing
behaviour of BPH (N.lugens) was thrust point of investigation. In present study the major components of fertilizer viz.,
nitrogen was tested at 0, 40, 60, 100, 160, 220, 280, 340, 400 and 460 kg/ha and its impact on the probing behaviour of
N.lugens was recorded. There was significant negative correlationship (r =0.99) between probe marks and nitrogen doses.
The regression equations for probe marks in relation to different nitrogen levels applied was = 0.0324x + 4.9589.
Keywords: Nilaparvata lugens, paddy, probing behaviour, brown plant hopper
INTRODUCTION
ice (Oryza sativa) is a main cereal crop
cultivated on an area of 44 million ha in India
having production of about 93 million tones. In
Chhattisgarh state, rice is grown in 34.69 lakh
hectares with the production of 28.862 lakh tones
during 2002-03, which is 8.15% of total area and
3.70% of total production in country
(ANONYMOUS, 2003). Among the various insect
pests, brown plant hopper of rice is major one with
greater economic significance causing extensive
losses to paddy crop up to 34.40% in Chhattisgarh
(GANGRADE et al., 1978). Several attempts had
been done in past and present scenario by using
several chemicals but due to ignorance and lack of
techniques know how, the result did not come up to
expectation more over, several after use of these
chemical problems had been noted. It has been
reported that close planting production of more tillers
per unit area, increased use of fertilizers
indiscriminate plant protection measures were
reported to have increased behavior and its
abundance (KALODE, 1974, 1976 AND OKA,
1977). Non judicious uses of fertilizers suppose to
cause many problems of the insect pest as well as
more use of organic matter may give rise the problem
of brown plant hopper (N.lugens). Therefore, to work
out the impact of macronutrient on the probing
capacity of brown plant hopper (N.lugens), which
could give a clue for its better management, is the
aim of framing this piece of investigation at the lab
level.
MATERIAL AND METHOD
The experiments were carried out at glass house
department of Entomology, college of Agriculture
IGKV, Raipur during the period of March-2007 to
june-2007. The brown plant hopper, Nilaparvata
lugens (Stal.) initially collected from entomological
field and its culture being maintained throughout the
year in the air-cooled glass house, Department of
Entomology at 30oc±5
0c on potted TN1 variety. BPH
(N.lugens) were reared on 40 to 45 days old potted
TN1 plant inside the rearing cage of 75x75x75 cm
size consisting of wooden frame. Potted TN1 plants
were placed inside the rearing cage for egg laying
along with at least 60 pairs of BPH per pot. After 23
days the female starts egg laying inside the leaf
sheath of paddy plants. For determination of soil
fertility status initially soil samples were collected
from Entomological field at the two depth (0 to 15
cm and subsurface 15-30 cm). Available nitrogen
was determined by alkaline permagnet methods,
phosphorus was determined by Olsen extract method
and potash was determined by Flame photometric
method for preparation of pots the pots were filled
with the soil which was already assessed for fertility
gradient, then light sprinkle of water given to pots
containing soils. First of all potash was conducted for
which fixed amount of phosphorus (P) was
thoroughly mixed into the soil and nitrogen (N) was
mixed into two split doses into the soil and different
amount of potash viz; 0, 40, 100, 160, 220, 280, 340,
400 and 460 kg/ha was provided thoroughly into the
soil.
For testing of probing behaviour of BPH different
fertilizer application seeds of identified susceptible
variety TN1 germinated separately in petridishes.
Germinated seeds were sown into wooden trays
containing well-puddled soil. After seven days it was
transferred into individual pots two days old female
was introduced into each test tube and allowed to
make punctures on the seedling for 24 hours. Test
tubes were plugged with sterilized cotton swab.
There after the seedlings were taken for staining in
another tube 1.0% erythrosine dye aqueous solution.
Insects probing marks were counted visually after 30
minutes of staining (NAITO, 1964).
R
SHORT COMMUNICATION
Page 138
492 SWATI SHARMA, ASHISH KUMAR SHARMA AND DAMINI THAWAIT
RESULT AND DISCUSSION
Three replicates were used for each treatment and
each treatment were repeated three times. The result
obtained due to experiment are as it can be seen from
table-1 (D1) that an average probing mark by
N.lugens was significantly the lowest (4) in the least
potash (0 kg/ha) applied pot; while the maximum
number of average probe marks i.e., 19 was recorded
on the highest potash (460 kg/ha) levels. There was a
increasing trend of average probing mark behaviour
with the increase in potash level. And it is crystal
clear from table-2 that there is straight line positive
correlationship could be established between
different levels of potash and average probing mark
and correlation coefficient worked out was 0.99, the
regression equation is like that y = 0.324x+4.9589
and the coefficient of determination was found 0.99.
Influence of different potash levels for the probing
behaviour of N.lugens on paddy was studied as it is
clear from the tables (1-2) that the probes were
reducing down in number with decrease in different
potash levels. In general there was positive
correlationship between these two variables studied.
Probably, the reason behind this may be due to
variation in different biochemical factors. Which
may be ultimately influenced and governed by macro
and micronutrient of fertilizer uptake. The
application of potash imparts disease resistance;
produces strong stiff straw especially in paddy and
wheat. Potash also regulates osmoregulation and
stomatal movement and actsas food farmer sugar and
starch transporter, protein builder and a disease
retarder (KATYAYAN, 2004).Therefore, the more
number of probes made by N.lugens on the plant
having higher potash application and vice versa was
there with lower potash application inferring that the
excess potash level had provided stiff morphological
attributes of the host plant.
Table 1: Influence of different potash level on the probing behaviour of Nilaparvata lugens on paddy during
march-2007 to june-2007.
S.NO. Treatments
Potash (Kg/ha)
Mean probing mark in 24 hours by N.lugens
D1 D2 D3 D4
Overall average
Probing mark
1. T1-O 3.00 3.00 6.00 7.00 4.75
2. T2-40 5.00 4.00 7.00 9.00 6.25
3. T3-100 6.00 7.00 9.00 10.00 8.00
4. T4-160 10.67 8.00 11.00 13.00 10.67
5. T5-220 11.00 12.00 12.00 14.00 12.25
6. T6-280 12.00 13.00 15.00 16.00 14.00
7. T7-340 13.33 17.00 16.00 17.00 15.83
8. T8-400 16.00 18.00 19.00 19.00 18.00
9. T9-460 19.00 19.00 21.00 20.00 19.75
SEm± 1.17 1.48 1.56 1.80 2.67
CD (p=0.05) 3.46 4.49 4.65 5.33 7.94
D1 = Planted between 07.03.07 to 18.03.07
D2 = Planted between 21.03.07 to 01.04.07
D3 = Planted between 23.05.07 to 02.06.07
D4 = Planted between 03.06.07 to 14.06.07
Table 2: Association between probing behaviour of Nilaparvata lugens and different dose of potash.
S.No. Different planting
dates
Correlation
coefficient (r)
Regression equation
(Y)
Coefficient of
determination (R2)
1 D1 0.98 -0.0408x+23.071 -0.96
2 D2 0.99 0.0327x+3.0748 0.99
3 D3 0.99 0.372x+2.951 0.98
4 D4 0.99 0.324x+5.6853 0.99
Overall average 0.99 0.0324x+4.9589 0.99
REFERANCES
Anonymous, (2003). Policies need to be farmers
friendly. The Hindu survey of Indian Agriculture PP.
5-6.
Gangrade, G.A., Kaushik, U.K. Patidar, G.L.,
Shukla, B.C., Shrivastava, S.K., Deshmukh, P.D.
and Pophaly, D.J. (1978). Insect-pest of summer
paddy in India. Int. Rice Res. Newsl. 3(6): 16.
Kalode, M.B. (1974). Recent changes in relative pest
status of rice insects and influenced by cultural,
ecological and genetic factors. Paper presented at the
international rice conference held at the IRRI,
Manila, Philippines.
Page 139
JOURNAL OF PLANT DEVELOPMENT SCIENCES Vol. 6 (3) 493
Kalode, M.B. (1976). Brown plant hopper rice and
its control. Indian Frmg. 27 (5): 3-5.
Katyayan, Arun, (2004). Fundamentals of
agriculture, kushal publications and distributors, Ed.
III, pp 207-240.
Naito, A. (1964). Methods of detecting feeding mark
of leaf and plant hopper and its application. Plant
Prot. Japan 18(12): 482-484.
Oka, I.N. (1977). Cultural control of brown plant
hopper, paper presented at the Brown plant hopper
symposium held at the IRRI. Manila, Philippines 18-
22 April 1977. PP. 1-28.
Page 140
494 SWATI SHARMA, ASHISH KUMAR SHARMA AND DAMINI THAWAIT
Page 141
________________________________________________ Journal of Plant Development Sciences Vol. 6 (3) : 495-498. 2014
EVALUATION OF NEWER INSECTICIDES AGAINST WHITE BACKED PLANT
HOPPER (SOGATELLA FURCIFERA HORVATH) OF RICE CROP.
Swati Sharma, Ashish Kumar Sharma, Sanjay Sharma and Damini Thawait
IGKV Raipur (CG)
Email: [email protected] Abstract: Rice is an important cereals crop of the world which is known to be attacked by large numbers of insect pest
during its different development stages, out of this white backed plant hopper (Sogatella furcifera) is an important insect pest
of rice. Evaluation of newer insecticides combine them with present one and new formulations of older molecules was
thrust point of investigation viz. incidence of white backed plant hopper (Sogatella furcifera) was found in best reducing
form by the application of ethiprole + imidacloprid @ 100g.a.i./ha and alika 247 ZC @ 44 g.a.i./ha were observed as
effective insecticide for minimizing the WBPH incidence.
Keywords: Sogatella furcifera, cereal crop, insecticide
INTRODUCTION
ice is the staple food of more than half of
humanity in the world and for more than 65 to
70 % of Indian population. It is grown over 44
million hectare in India under diverse ecologies, like
upland, lowland, Irrigated, deep water etc. Indian
population is increasing @1.5% and it needs to
produce over 100 million tons of rice by 2015 and
120 million tons by 2020. This additional production
has to come from declining and degrading resources
like land and water.
Presently the area under rice cultivation in
Chhattisgarh is about 3465820 hectare, which is 26
per cent of the total cultivable land (Total area in
Chhattisgarh is 13603361 ha). The total production
of rice in the state is 8309916 metric tons with an
average productivity of 1323 Kg/ha, which is very
low as compared to the national average of 2263
Kg/ha. About 96 percent of total area under rice in
the state is concentrated in low and very low
productivity groups of the state (Sastri et al., 2006).
Rice crop is infested with a large number of insect
pest from sowing to harvesting stage of the crop
(Gupta and Verma 2001). About 300 insect species
have been reported to attack Rice crop in India.
About twenty species of insects have been found to
be serious and causing more than 50 percent yield
loss (Arora and Dhaliwal, 1996). Among them,
sucking pests white backed plant hopper (S.furcifera)
play’s important role in reducing the yield levels in
paddy. White backed plant hopper (sogatella
furcifera Horvath) suck plant sap and weaken the
plants.
Development of integrated pest management (IPM)
strategies is the most appropriate solution to tackle
the pest problems. Target specific and eco-friendly
insecticide application is one of the important
components of IPM.
Insecticide plays a major role in the production
system of rice, in spite of their much highlighted
hazardous effect on the environment. They are still
relied upon by the rice farmers for better
management of different pests. Continuous and
consistent use of pesticides leads to the development
of resistance among pests and adverse effects on
non-target organisms.
To cope with ever challenging insects pest problems
in Rice, the farmers needs to have the latest
technological knowledge in pest management.
Evaluation of newer insecticides, combine them with
present one and new formulations of older molecules
is an important exercise of Rice entomologist.
Therefore, Present study has been conducted.
MATERIAL AND METHOD
The present investigation entitled “Evaluation of
newer insecticides against white backed plant hopper
(sogatella furcifera) of rice crop” was carried out at
IGKV Research Farm, Raipur under field condition
during Kharif 2006-07. The materials used and
techniques adopted for this study is illustrated in this
chapter.
Treatment details
Treatment Common name Trade name % a.i. in the
Formulation
g
a.i/ha
Dose
g Or ml of
formulation/ha
T1. Chlorpyriphos Dursban 10G 10% 1000 10.0 Kg
T2. Chlorpyriphos Dursban 10G 10% 1250 12.5 Kg
T3. Carbofuran (check) Furadan 3G 3.0% 1000 33.0 Kg
T4. Ethiprole 40% +
Imidacloprid 40%
Bayer 80% 100 125 g
T5. Neonicotinoid + ALIKA 247ZC 22% 33 150 ml
R
SHORT COMMUNICATION
Page 142
496 SWATI SHARMA, ASHISH KUMAR SHARMA, SANJAY SHARMA AND DAMINI THAWAIT
Synthetic
pyrethroid
T6. Neonicotinoid +
Synthetic
pyrethroid
ALIKA 247ZC
22% 44 200 ml
T7. Deltamethrin Decis 10%EC 10% 15 150 ml
T8. RIL 043 oxadiazin
+ synthetic
pyrethoid)
- - - 400 ml
T9. Indoxacarb Kingdoxa 15
SC 14.5% 30 200 ml
T10. Spinosyn A 50% +
Spinosyn D 50%
Spinosad
45%SC 45% 45 100 g
T11. Spinosyn A 50% +
Spinosyn D 50%
Spinosad
45%SC 45% 56 120 g
T12. Monocrotophos
(check)
Monocrown
36 WSC 36% 500 1390 ml
T13. Phorate 10G Uthane (UPL) 10% 1000 12.5 Kg
T14. Untreated control - - - -
Fertilizer application (N: P: K 80:60:40) Kg/ha
The paddy crop grown for experimental purpose was
given nutrition through the chemical fertilizer @
80:60:40 NPK kg/ha. Full dose of P and K were
applied at the time of planting and “N” was applied
in three split doses. First dose was given at the time
of planting and remaining two doses were applied at
the tillering and panicle initiation stage of the crop.
Method of insecticidal treatment application
The required quantity of insecticide for each plot was
calculated on the basis of active ingredient and
standard doses. Before applications of insecticide per
plot insect population were counted for ten random
plants in each plot, then the insecticidal treatments
were applied to the crop homogeneously.
Time of insecticidal treatment application:
All the insecticidal treatments were applied twice
during the crop season. The first application was
given as prophylactic treatment at 30 days after
transplanting. The second insecticidal treatment
application was given at the maximum tillering stage
of the crop i.e.50 DAT. The increasing trend of
insect infestation was observed at 50 DAT
observations.
Sampling technique applied in field
experimentation
The observations on occurrence of major insect pests
of paddy were recorded in each plots after
transplanting. The pre treatment and post treatment
observations were recorded at 30 and 50 DAT on ten
randomly selected hills from each plot.
White backed plant hoppers
The total count of nymphs and adults of white
backed plant hopper (Sogatella furcifera Horvath)
was recorded separately on ten randomly selected
hills from each plot by using kittur’s glass book
technique. One day before application of insecticides
as pre-treatment and after insecticidal application as
post treatment observation. The total number of
nymphs and adults were recorded per hill basis.
RESULT AND DISCUSSION
This chapter deals with the brief description of
results obtained under different objectives of this
study. The findings of the present study are
compared with the previous findings of the relevant
aspects in justified manner to draw a concrete
conclusion. The results and discussion are presented
here under different sub headings:
Bio-efficacy under field condition
The experiment was laid out in randomized block
design with 14 treatments replicated four times to
access the bio-efficacy of different insecticide
against the major insect pest of paddy. Three
granular insecticides viz. Carbofuran and Phorate
and seven sprayable insecticides viz. Chlorpyriphos. ,
Ethiprole + Imidacloprid, Neonicotinoid+Synthetic
Pyrethroid, Deltamethrin, Oxadiazin+Synthetic
Pyrethroid, Indoxacarb, Spinosyn A 50%+Spinosyn
D 50% and Monocrotophos were taken under this
study. These treatments were compared with an
untreated control. All the treatments were applied
twice i.e. at 30 and 50 day after transplanting.
White backed plant hopper (Sogatella furcifera)
Observation on white backed plant hopper (WBPH)
incidence were recorded from sampling of ten
randomly selected hills of each treatment
replications. WBPH incidence were recorded prior
and pest application of insecticidal treatment on the
basis of per ten hill population. The WBPH
population were counted with the help of Kitturs
glass book sampling technique. The data of insect
count from ten hills are presented form
interpretation.
The WBPH incidence was observed at the early stage
of crop, it was found escaped at the alter stage.
Therefore the data of treatment application impact
Page 143
JOURNAL OF PLANT DEVELOPMENT SCIENCES Vol. 6 (3) 497
were recorded only during the first treatment
application. The observations were based on the total
WBPH count of ten plant observed with the help of
kitturs glass book.
Pre-treatment observations
In pre treatment observation WBPH count varied
from 16 to 22 number in different plots which was
statistically non-significant. It may be stated that the
WBPH incidence were found homogenous during
pre-treatment observation.
Post treatment observations
The post treatment observation of WBPH incidence
was recorded at ten days after application in the form
of per ten plant population. Significant impact of
treatment application was observed in this study. The
minimum WBPH count was recorded with the
treatment ethiprole + imidacloprid @ 100 g a.i/ha
followed by alika 247 SC @ 22 g a.i/ ha (1.75). The
higher number of WBPH was found under the
untreated control treatment (5.75). The application of
Phorate 10 G @ 1000 g a.i/ha was found statistically
at par with untreated control.
ethiprole + imidacloprid and alika-247 SC were
observed as best effective insecticides in minimizing
the WBPH incidence. Similar results were also
reported by Bhavani and Rao (2005), Seetha Ramu et
al. (2005) and Shakti (2006). They have also
reported ethiprole + imidacloprid as best effective in
reducing WBPH population. Panda et.al. (1991) have
reported monocrotophos as best effective insecticide
for controlling WBPH of rice.
Table 1 : Intensity of Paddy White backed plant hopper population observed Under different insecticidal
treatment during Kharif – 2007
Treatment Formulation
g a.i/ha
Mean WBPH population / 10 plants
Pre- treatment Post- treatment
T1: Dursban 10 G
T2: Dursban 10 G
T3: Furadan 3 G
T4: Ethiprole 40% + Imidacloprid 40%
T5: Alika 247 SC
T6: Alika 247 SC
T7: Decis 10 EC
T8: RIL- 043
T9: Kingdoxa 14.5 SC
T10: Spinosad-45 SC
T11: Spinosad-45 SC
T12: Monocrown 36 WSC
T13: Phorate 10 G
T14: Untreated control
1000
1250
1000
100
33
44
15
400
30
45
56
500
1000
-
5.00
(2.34)
5.00
(2.34.)
4.25
(2.18)
4.75
(2.29.)
4.75
(2.28)
4.50
(2.23)
5.25
(2.39.)
5.25
(2.39)
4.25
(2.17.)
5.00
(2.34.)
4.25
(2.29)
5.50
(2.44)
5.25
(2.37)
4.00
(2.23)
3.00
(1.86)
3.75
(2.06)
3.00
(1.86)
1.00
(1.18)
3.00
(1.86)
1.75
(1.49)
3.00
(1.85)
2.25
(1.65)
3.50
(1.99)
3.25
(1.93)
2.75
(1.79)
3.50
(1.99)
3.75
(2.06)
5.75
(2.49)
SE (m) +
CD (5%)
0.11
NS
0.10
0.29
REFERENCES
Arora, R. and Dhaliwal, (1996). Agroecological
change and insect pest problem in Indian
Agriculture. Indian J. ecology, 23:109-112.
Bhavani, B. and Rao, P.R.M. (2005). Bioefficacy
of certain insecticides against rice plant hoppers vis-
à-vis natural enemies under irrigated field conditions.
Indian Journal Plant Prtection. Vol. 33. No. 1: 64-67.
Gupta, A.K. and Verma, R.A. (2001). Comparative
effect of some granular insecticides against green
Page 144
498 SWATI SHARMA, ASHISH KUMAR SHARMA, SANJAY SHARMA AND DAMINI THAWAIT
leaf hopper (Nephotettix virescens) on Paddy crop.
Indian J. Ent., 63(2) : 109-113.
Panda, S.K. Samalo, A.P. and Shi, N. (1991).
Efficacy of insecticides against white backed
planthopper of rice and its predators . Oryza 28: 373-
376.
Sastri, A.S.R.A.S., Rao, S.S. and Dwivedi, S.K. (2006). Chhattisgarh me Krishi ki Visheshtayan evm
sambhavnyen. Krishi Smarika 2006. PP.9-11.
Seetha , Ramu, P. Punnaiah. K.C. Rao, G.
Ramchandra and Rao, V. Srinivasa (2005). Bio-
efficacy of certain new insecticides against sucking
insect pests of rice. J. Ent. Res., 29(3) : 211-213.
Verma, Sakti (2006). Studies on paddy brown plant
hopper infestation at farmer’s field and bio-efficacy
of some newer insecticides. Msc(Ag.) Thesis.
Page 145
________________________________________________ Journal of Plant Development Sciences Vol. 6 (3) : 499-500. 2014
EFFECT OF P SOLUBLIZING BACTERIA ON YIELD OF WHEAT AND
NUTRIENT AVAILABILITY IN ACID SOIL IN VARANASI REASON
Rahul Kumar and Priyanka Sharma
Department of Soil Science and Agricultural Chemistry,
College of Agriculture,IGKV,Raipur (C.G.)
Email - [email protected] Abstract : A field experiment was conducted for two rabi crop during season 2009-2010 at Varanasi.To study the effect of
application of rack phosphate along with P solublizing microorganism on yield of wheat and nutrient availability in
inseptisol. The experiment finding the grain yield was significant increased with rack phosphate application up to 60 kg P2O5
ha-1 highest yield was recorded with the addition of rack phosphate and P solublizing bacteria in combination of rack
phosphate @60 kg P2O5 ha-1. A significant increase in organic carban and available NPK was also observed with use of rock
phosphate +P solublizing bacteria. The result indicate that yield, maintained the soil health minimizing the cost of P
fertilizer.
Keyworld : Rock Phosphate, P use efficiency, wheat, PSM
INTRODUCTION
heat is important food crop in India. Wheat
grown in rabi season. The fertilizer
consumption in this state is very low. NPK ratio is
4.7:2.7:1 low mineralized organic P fixation of P
compound with Iron and Aluminum oxide and
sorption of P compound with organic compound
have resulted in low P use efficiency Singh and Dutta
1987). Acid soils are generally poor in calcium iron
and phosphate are precipitated in the form of ferric or
aluminum compound. Which are not so easily
amendable to solublizing by plant roots by micro
organism, introduction of phosphorus solublising
bacteria in rhizoshpere of crop by soil increase the
availability of P form insoluble source of phosphate,
desorption of fixed phosphorus and also increase the
efficiency of phosphatic fertilizer (Gour1990).
METHOD AND MATERIAL
Where as the effective CEC (sum of all exchangeable
catain) was found to be 10.8 Cmol (P+) kg ha-
1with
22.2% Al saturation of EC. The treatments consisted
of control 30 kg P2O5ha-1
, 60 kg P2O5ha
-1 Phosphorus
solublizing bacteria (PSB) inoculation 30 kg P2O5ha-
1+ PSB, 60 kg P2O5ha
-1 +PSB. Lime requirement of
soil was observed to be 4.1t ha-1
to attain a pH level
of 6.4 (Shoemaker et al 1981) and it was applied
@1.5 t ha-1
uniform every year well in advance of
sowing of the crop. The peat bound cultures of
pseudomonas striata (PSB) However seed are treated
with PSB by coating of seed before sowing. A
uniform dose of N @120kg ha-1
in the form of Urea
and K @ 40 kg ha-1
in the form of K2O( murate of
potash) applied as basal dressing. P used as basal
dressing in the form of Rock phosphate (20-40 kg ha-
1). All the culture was followed as per schedule.
RESULT AND DISCUSION
Effect of graded dose of Phosphate
The result of table 1 reveals that grain yield was
significant increase with the application of graded
dose of Rock phosphate up to 60 kgha-1
over control
the increase was 11.2 and 13.2 over control with the
application of 30 and 60 P2O5 kg ha-1
respectively.
Application of Rock phosphate in this acidic soil
resulted in effective solublizing of P and influenced
higher crop yields of wheat.
Effect of P solublizing Microorganisms.
It evident that inoculation of wheat seed with PSB
(Pseudomonas striata ) showed the significant
increase in grain yield over control. it was found that
application of rock phosphate @ 60 P2O5 kg ha-1
and
PSB inoculated recorded highest grain yield
55.15q/ha followed 60 P2O5 kg ha-1
(49.65ha-1) the
increase grain yield with the inoculation of P
solublizing of microorganism may be due to increase
in P availability (Gaur and Sinha 1999) the
phosphate micro organism are reported to secrete a
number of organic acid which may form chelate with
Fe and Al resulting in to effective solublizing of
phosphates these result are agree with finding of
Subba rao(1999).
Effect of P solublizing micro organism in soil
The result in table 2 that the soil Ph significant in all
the treatment over the initial value the increase in Ph
might be due to regular liming by CaO for
neutralizing the soil acidity. The organic carbon and
available N,P and K showed a decreasing trend in
control with continues cropping without any added p
but the nutrient status improve with the addition of
Rock phosphate and inoculation with P solublizing
microorganism. It showed that the availability of P
status in the soil was increased by 12.3and 14.3 over
the initial status due application of rock Phosphate @
30 P2O5 kg ha-1
+PSB and 60 P2O5 kg ha-1
+PSB. This
might be due to more solubilizing of Rock Phosphate
in acidic range of pH of soil with regular liming
trend to a significant in the available nutrient status
of soil. Similar finding of Debnath and Mandal
(1983) . It is conducted that inoculation of wheat
W
SHORT COMMUNICATION
Page 146
500 RAHUL KUMAR AND PRIYANKA SHARMA
seed with PSB in combination with optimum dose of
Rock phosphate produce higher yield and suitable
crop response by increasing the efficient of added P
fertilizer and also improve the fertility status of soil.
Table 1: Effect of P solublizing microorganism on grain yield Wheat.
Treatment Grain yield (q/ha)
2009 2010
Mean Yield response
(%)
Yield response Kg grain
kg-1 P2O5
Control 30.6 39.3 34.95 -- -
30 kg P2O5ha-1
44.2 45.1 44.65 11.2 15.1
60 kg P2O5ha-1
49.3 50.0 49.65 13.2 17.2
PSB 39.6 40.2 39.9 10.2
30 kg P2O5ha-1
+ PSB 48.7 49.2 48.95 14.1 18.3
60 kg P2O5ha-1
+ PSB 55.8 54.3 55.15 15.6 19.1
Mean 44.7 46.38
S E m ± 0.03 0.04
CD (P=0.05) 0.11 0.012
Fig. 1
Table 2: Effect of P solublizing microorganism on soil physical chemical properties after 2010.
Treatment pH Organic
carbon(g/kg)
Available nutrient kg ha-1
N P K
Control 5.8 1.05 210 9.4 208
30 kg P2O5ha-1
6.2 1.11 216 7.6 223
60 kg P2O5ha-1
6.02 1.16 258 11.0 235
PSB 6.13 1.01 271 10.8 216
30 kg P2O5ha-1
+ PSB 6.15 1.08 270 12.3 234
60 kg P2O5ha-1
+ PSB 6.12 1.07 265 14.3 247
S E m ± 0.02 0.10 2 0.13 2
CD (P=0.05) 0.04 0.21 4 0.41 5
REFERENCES
Chapman, H.D. (1965). In method of soil analysis
(C.A. Blacked) Agronomy (Part 2), American
Society of Agronomy, Madison, Wiscosin.
Gaur, A.C. (1990). Phosphate solublizing of
microorganism as Bio fertilizer Omega Scientific
Publishers New Delhi
Gaur, A.C. and Sunita, G. (1999). Phosphate
solublizing of microorganism An overview current
trend in life science,23,151-164.
Mohad, S. P.; Gupta, D. N.; and Chevan, A.S. (1989). Enhancement of Phosphate solublizing
cultures. Journals of Maharashtra Agriculture
University 14,178-181.
Peach, M. (1965) In Method of Soil Analysis (C.A.
Blacked) Agronomy (Part 2), American Society of
Agronomy, Madison, Wiscosin.
Shoemekar, H.E.; Mclean, E .O. and Pratt, P.F. (1961). Buffer method for determination lime
requirement in soil with appreciable amount of
extractable aluminum soil science society of
America. Proceeding 25.274-277
Singh, O.P.: and Dutta,B. (1987). Phosphorus
status of some hill soil of Mizoram in relation to
pedogenic properties. Journals of Indian society soil
science society 34,600-605.
0102030405060
30 kg P2O5ha-1
60 kg P2O5ha-1
PSB 30 kg P2O5ha-1+
PSB
60 kg P2O5ha-1+
PSB
Grain yield (q/ha) 2009 2010 30.6
Grain yield (q/ha) 2009 2010 39.3
Mean 34.95
Yield response (%) --
Yield response Kg grain kg-1 P2O5 -
Page 147
________________________________________________ Journal of Plant Development Sciences Vol. 6 (3) : 501-504. 2014
EFFECT OF POST EMERGENCE HERBICIDE ON GROWTH AND YIELD OF
FINGER MILLET
Srishti Pandey, Damini Thawait, Pooja Mandal and Sarita Painkra
Deptt. of Agronomy, College of Agriculture, Raipur, Chhattisgarh
Abstract: The experiment comprising 13 weed management practices which comprised single application of different post-
emergence herbicides either alone or in combination and hand weeding was conducted on Clayey Vertisols soil of College of
Agriculture, Raipur during kharif season of 20012. Echinochloa colona among grasses, Cyperus iria among sedges and
Alternanthera triandra, Eclipta alba and Phyllanthus urinaria among broad leaf weeds were dominant. Hand weeding twice
recorded the highest grain yield and net return. This higher yield in Hand weeding twice was reflected in terms of better
yield parameter like Number of fingers m-2, finger length, number of fingerlet finger-1, grains finger-1 and test weight and
growth parameter like plant height, dry matter accumulation, Number of tillers. Application of ethoxysulfuron registered the
highest B:C ratio which was at par with metsulfuron methyl + chlorimuron ethyl and hand weeding twice.
Keywords: Weed management, Finger millet, herbicide
INTRODUCTION
inger millet (Eleusine indica) is an important
small millet crop that is hardy and grows well in
dry zones as rain-fed crops. It is used both as
medicinal and traditional purposes. Finger millet is a
high statue crop with slower initial growth which
remains under smothering due to the infestation of
weeds at early stages of growth. This situation causes
higher competition and may result in drastic
reduction in yield (Kushwaha et al., 2002). The
production and productivity of the country is lower
because of weeds pose one of the major constraints
in the production of finger millet. Owing to initial
slow growth of the finger millet favours weed
growth, which cause more competition for sunlight,
nutrient and water in early stages of growth lead in
lowering productivity (Kumara et al., 2007). The
critical period of crop weed competition for the
finger millet varies from 25-45 days after sowing
(Lall and Yadav, 1982). Weeds compete with crop
plants for water, nutrients, space and solar radiations
by reduction of yield upto 20 to 50 per cent.
(Kushwaha et al., 2002) and (Singh and Singh, 1984)
reported that weeds caused an appreciable reduction
in density, dry weight and depletion of nutrients.
Manual weed management, which is the most
prevalent method for weed management in finger
millet, requires a lot of labour. Now a day, due to the
scarcity of labours, chemical weed management is
considered as better option than the hand weeding.
Chemical weed management practices might be an
answer to achieve greater weed control efficiency,
which in turn, may increase over all benefit of finger
millet cultivation. The work on effect of post
emergence herbicides in weed management of finger
millet is very limited; therefore, keeping these points
in view the present investigation was carried out to
evaluation of post-emergence herbicides for weed
management in direct sown finger millet.
MATERIAL AND METHOD
The present investigation entitled “Evaluation of
post-emergence herbicides for weed management in
direct sown Finger millet.” was carried out at
Instructional cum Research Farm, Indira Gandhi
Krishi Vishwavidyalaya, Raipur (C.G.) India, during
the kharif season (July-November) 2012. The soil of
experimental field was Clayey (Vertisols). The
experiment was laid out in randomized block design
(RBD) with three replications. There were thirteen
treatments of post-emergence herbicides along with
two hand weeding and untreated control. The finger
millet cultivar “GPU-28” was sown and harvested on
11th
July, 2012 and 20th
November, 2012
respectively, using seed rate of 10 kg ha-1
at 25 cm
distance and gaps were maintained by thinning to
obtain proper plant population. Sowing was
performed by manually and crop was fertilized with
60:40:40 N: P2O5:K2O kg ha-1
.
Plant protection
measures were followed as per recommendation. The
treatments were viz. T1- Fenoxaprop-p-ethyl (37.5 g
ha-1
), T2- Fenoxaprop-p-ethyl (45.0 g ha-1
), T3-
Metsulfuron methyl + Chlorimuron ethyl, T4-
Ethoxysulfuron, T5 – Cyhalofop-butyl, T6-
Fenoxaprop-p-ethyl (37.5 g ha-1
) + metsulfuron
methyl + chlorimuron ethyl, T7- Fenoxaprop-p-ethyl
(45.0 g ha-1
) + metsulfuron methyl + chlorimuron
ethyl, T8- Fenoxaprop-p-ethyl (37.5 g ha-1
) +
ethoxysulfuron, T9- Fenoxaprop-p-ethyl (45.0 g ha-1
)
+ ethoxysulfuron, T10- Cyhalofop-butyl +
metsulfuron methyl + chlorimuron ethyl, T11-
Cyhalofop-butyl + ethoxysulfuron, T12- Hand
weeding twice and T13- Weedy check. The
experimental data recorded for growth, yield and
economics were statistically analyzed. Plant height
and number of tillers plant-1
of five tagged plants in
each net plot area and Dry matter accumulation (g
plant-1
) was recorded at an interval of 15, 30, 45, 60,
75 and 90 DAS and at harvest. Post harvest
observations were recorded from net plot area under
each treatment. Five fingers of the tagged plants were
harvested separately finger length (cm), total
F
SHORT COMMUNICATION
Page 148
502 SRISHTI PANDEY, DAMINI THAWAIT, POOJA MANDAL AND SARITA PAINKRA
fingerlets finger-1, grains finger-1 was counted.
Number of fingers was recorded from one m-2 area of
each plot. 1000 seeds from the winnowed produce of
each plot were counted and same were oven dried till
constant weight and then weight was recorded in
gram by using an electronic digital balance. Their average was worked out and used for statistical
analysis. Grain yield of the net plot was noted after
threshing, winnowing and drying, and then
calculated in kilogram hectare -1 with appropriate
multiplication factor. The harvested produce from
each net plot was tied in bundles separately. Straw
yield of plot was noted down after subtraction of
grain yield from bundle weight. Bundle weight was
recorded in kilogram hectare-1 with the help of spring
balance. Harvest index was computed as the ratio of
economic yield i.e. grain yield ha-1 to the total
biomass i.e. biological yield ha-1 (grain and straw) and expressed in per cent, using formula given by
Donald (1962),
Harvest index (%)
And weed index expressing the reduction in yield
due to presence of weeds in comparison with weed
free situation. It was expressed in per cent and
calculated by using the formula given below as
suggested by (Reddy 2007).
Weed Index (%) =
Seed yield from weed free plot –
Seed yield from treated plot 100
Seed yield from weed free plot
RESULT AND DISCUSSION
Weeds
The major weed flora of experimental field consisted
of Echinochloa colona, Phyllanthus urinaria, Eclipta
alba, Alternanthera triandra and Cyperus iria and
other weed species like Commelina benghalensis,
Cynodon dactylon, Cynotis axillari, Cyperus
rotundus, Euphorbia hirta, Euphorbia geniculata,
Fimbristylis miliacaea etc. were also observed in the experiment field in negligible quantum. There was
complete control of broad leaf weeds viz.
Alternanthera triandra, Eclipta alba and Phyllanthus
urinaria and sedges i.e. Cyperus iria by the
application of metsulfuron methyl + chlorimuron
ethyl and ethoxysulfuron, where as grassy weed i.e.
Echinochloa colona was completely killed by the
application of fenoxaprop-p-ethyl. The crop
experienced severe weed competition in cyhalofop-
butyl followed by fenoxaprop-p-ethyl at both levels
which might be due to unfavourable conditions
leading to vigorous growth of weeds. Application of metsulfuron methyl + chlorimuron ethyl and
ethoxysulfuron alone was found most suitable for
weed control without any harm to the crop. They
completely killed all the broad leaf weeds and
sedges. Weedy check recorded the highest density
and dry weight by weeds owing to their greater
competitive ability than crop plant put under highest
biomass of weedy check.
Crops The maximum plant height of finger millet was recorded under the treatment hand weeding twice
which was at par with that of ethoxysulfuron and
metsulfuron methyl + chlorimuron ethyl but highest
dry matter accumulation was observed in
fenoxaprop-p-ethyl (37.5 g ha-1) + ethoxysulfuron
which was at par with that of hand weeding twice,
fenoxaprop-p-ethyl (45.0 g ha-1) + ethoxysulfuron
and fenoxaprop-p-ethyl (37.5 g ha-1) + metsulfuron
methyl + chlorimuron ethyl. Number of tillers of
finger millet were maximum with application of
fenoxaprop-p-ethyl (45.0 g ha-1) + ethoxysulfuron
which was at par with that of hand weeding twice, fenoxaprop-p-ethyl (37.5 g ha-1) + ethoxysulfuron,
fenoxaprop-p-ethyl (37.5 g ha-1) + metsulfuron
methyl + chlorimuron ethyl, cyhalofop-butyl,
metsulfuron methyl + chlorimuron ethyl,
ethoxysulfuron, weedy check and cyhalofop-butyl +
metsulfuron methyl + chlorimuron ethyl. Number of
fingers m-2, finger length, number of fingerlet finger-
1, grains finger-1 and test weight were maximum
under the hand weeding. Grain yield of finger millet
was significantly influenced by different weed
management practices. Hand weeding twice at 20 and 40 DAS proved significantly superior to all other
treatments. Prasad et al. (1991) recorded that the
weeds reduced yield of finger millet by 55-61 per
cent and hand weeding twice gave the highest grain
yield. Singh and Arya (1999) also noted similar
findings. Among different herbicidal weed
management practices, ethoxysulfuron recorded the
highest grain yield which was at par with
metsulfuron methyl + chlorimuron ethyl and
significantly better than rest of the treatments
including weedy check. Straw yield of finger millet
was the highest under hand weeding twice, which was at par with that of metsulfuron methyl +
chlorimuron ethyl and ethoxysulfuron and
significantly superior over rest of the treatments
including weedy check. Harvest index varied
significantly due to application of post emergence
herbicides either alone or in combination at lower or
higher dose. Hand weeding twice gave higher harvest
index, which was at par with combined application of
fenoxaprop-p-ethyl (37.5 g ha-1) + ethoxysulfuron
and fenoxaprop-p-ethyl (45.0 g ha-1) +
ethoxysulfuron and significantly superior over rest of the treatments. Weed index (loss of yield due to
weeds) was found to be minimum with application of
ethoxysulfuron (34.37 %) followed by metsulfuron
methyl + chlorimuron ethyl (36.23 %). Weedy check
registered 55.40 per cent weed index. The maximum
weed index was found with application of
fenoxaprop-p-ethyl (93.62 %) at higher level (45.0 g
ha-1) followed by cyhalofop-butyl + ethoxysulfuron.
Page 149
JOURNAL OF PLANT DEVELOPMENT SCIENCES Vol. 6 (3) 503
Economics
Hand weeding twice recorded the highest gross
return. Among herbicides ethoxysulfuron gave
maximum gross return which was at par with that of
metsulfuron methyl + chlorimuron ethyl.
Fenoxaprop-p-ethyl (45.0 g ha-1
) gave minimum
gross return. The maximum net return was observed
in hand weeding twice which was at par with
application of ethoxysulfuron and metsulfuron
methyl + chlorimuron ethyl and B:C ratio was
observed with ethoxysulfuron which was at par with
that of metsulfuron methyl + chlorimuron ethyl and
hand weeding twice.
Table 1: Grain yield, Straw yield, Harvest Index and Weed Index of finger millet as influenced by different
herbicidal treatments
Treatment Dose
(g ha-1
) Grain yield
(Kg ha-1
)
Straw
yield (Kg
ha-1
)
Harvest
index (%)
Weed
index (%)
T1 : Fenox 140 1395 9.11 88.47
T2 : Fenox 45.0 77 637 11.11 93.62
T3 : MSM+CME 2.0+2.0 771 6155 11.34 36.23
T4 : Ethox 15.0 794 5479 13.00 34.37
T5 : Cyhalo 62.5 188 1217 13.39 84.53
T6 : Fenox+MSM+ CME 37.5+2.0+2.0 191 1427 12.44 84.23
T7 : Fenox+MSM+ CME 45.0+2.0+2.0 188 1219 13.44 84.52
T8 : Fenox+Ethox 37.5+15.0 180 966 15.67 85.15
T9 : Fenox+Ethox 45.0+15.0 165 819 15.56 86.37
T10 : Cyhalo+MSM+ CME 62.5+2.0+2.0 163 1328 11.00 86.53
T11 : Cyhalo+Ethox 62.5+15.0 119 1276 8.44 90.22
T12 : Weed free (HW at 20 and 40
DAS) 1210 6363 16.00 -
T13: Weedy check 540 3737 12.64 55.40
SEm ±
CD at 5 %
21.58
63.00
310.86
907.34
0.76
2.23
-
-
Fenox = Fenoxaprop-p-ethyl, MSM = Metsulfuron methyl, CME = Chlorimuron ethyl, Ethox = Ethoxysulfuron,
Cyhalo = Cyhalofop–butyl, HW = Hand weeding
Table 2: Economics of different post emergence herbicides for weed management in finger millet
Treatments Total Cost of
Cultivation (Rs ha-1
)
Gross
Return
(Rs ha-1
)
Net
Return
(Rs ha-1
)
B:C
Ratio
T1 : Fenox 12028 2863 -9165 0.24
T2 : Fenox 12162 1551 -10611 0.13
T3 : MSM+CME 11662 15417 3755 1.32
T4 : Ethox 11795 15662 3867 1.33
T5 : Cyhalo 12706 3682 -9023 0.29
T6 : Fenox+MSM+ CME 12328 3801 -8527 0.31
T7 : Fenox+MSM+ CME 12462 3689 -8773 0.30
T8 : Fenox+Ethox 12548 3488 -9060 0.28
T9 : Fenox+Ethox 12682 3199 -9483 0.25
T10 : Cyhalo+MSM+ CME 13006 3260 -9746 0.25
T11 : Cyhalo+Ethox 13226 2467 -10759 0.19
T12 : Weed free (HW at 20 and 40 DAS) 18370 23377 5007 1.27
T13: Weedy check 11070 10648 -422 0.96
SEm ±
CD at 5 %
451.39
1317.5
451.39
1317.5
0.03
0.10
Fenox = Fenoxaprop-p-ethyl, MSM = Metsulfuron methyl, CME = Chlorimuron ethyl, Ethox = Ethoxysulfuron,
Cyhalo = Cyhalofop–butyl, HW = Hand weeding
Page 150
504 SRISHTI PANDEY, DAMINI THAWAIT, POOJA MANDAL AND SARITA PAINKRA
REFERENCES
Kumara, O., Basavaraj Naik, T. and Palaiah, P. (2007). Effect of weed management practices and
fertility levels on growth and yield parameters in
Finger millet. Karnataka Journal of Agricultural
Sciences 20(2): 230-233.
Kushwaha HS, Tripathi ML and Singh VB. (2002). (Eds.). Weed management in coriander
(Coriandrum sativum). In: Proceeding of Second
International Agronomy Congress on Balancing
Food and Environment Security: a Continuing
Challenge (Eds.), Singh Panjab, IPS Ahlawat and
Gautam RC. Indian Society of Agronomy, IARI, New
Delhi: 985-987.
Lall, M. and Yadav, L.N.S. (1982). Critical time of
weed removal in finger millet. Indian Journal of
Weed Sciences 14: 85-88.
Prasad, T.V.R., Narasimha, N., Dwarakanath, N.,
Munegowda, M.K. and Krishnamurthy, K. (1991). Integrated weed management in drilled finger
millet (Eleusine coracana (L.) Gaertn.). Mysore
Journal of Agricultural Sciences 25(1): 13-17.
Reddy, S.R. (2007). Principles of Agronomy.
Kalyani Publishers. New Delhi third edition p.477.
Singh, R.V. and Arya, M.P.S. (1999). Effect of
integrated weed management practices on the yield
of ragi under rainfed conditions. Bhartiya Krishi
Anusandhan Patrika 14(3/4): 19-24.


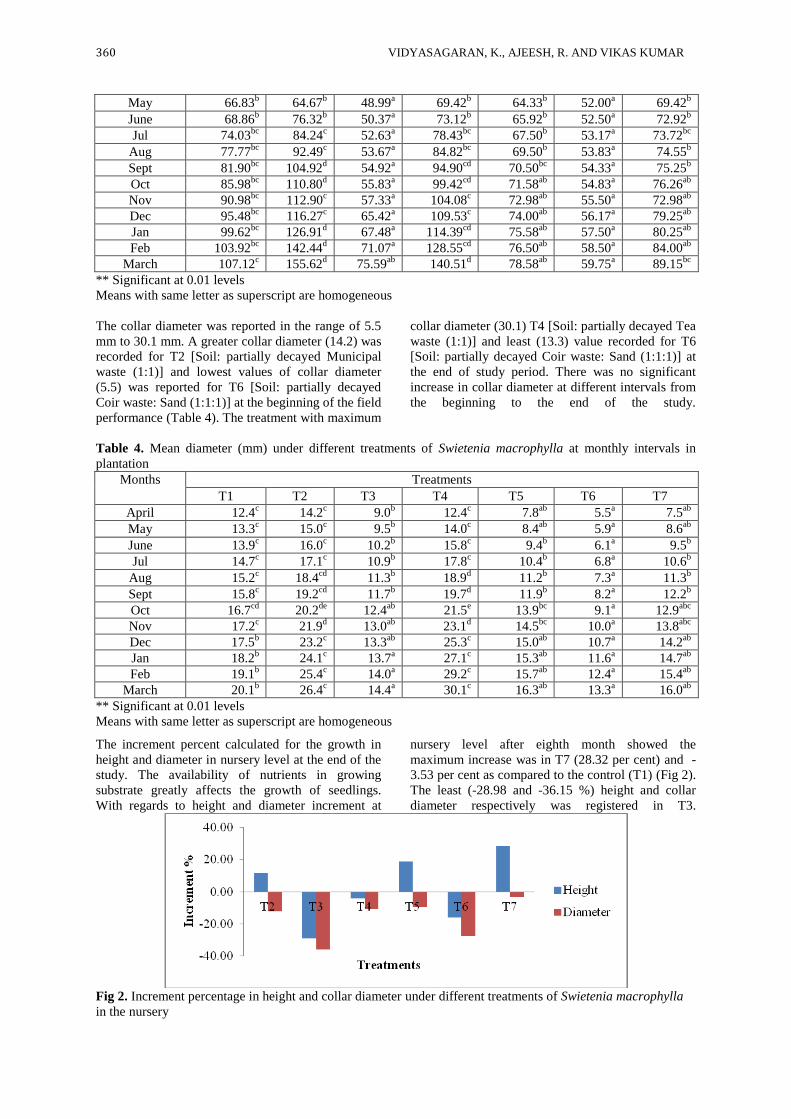


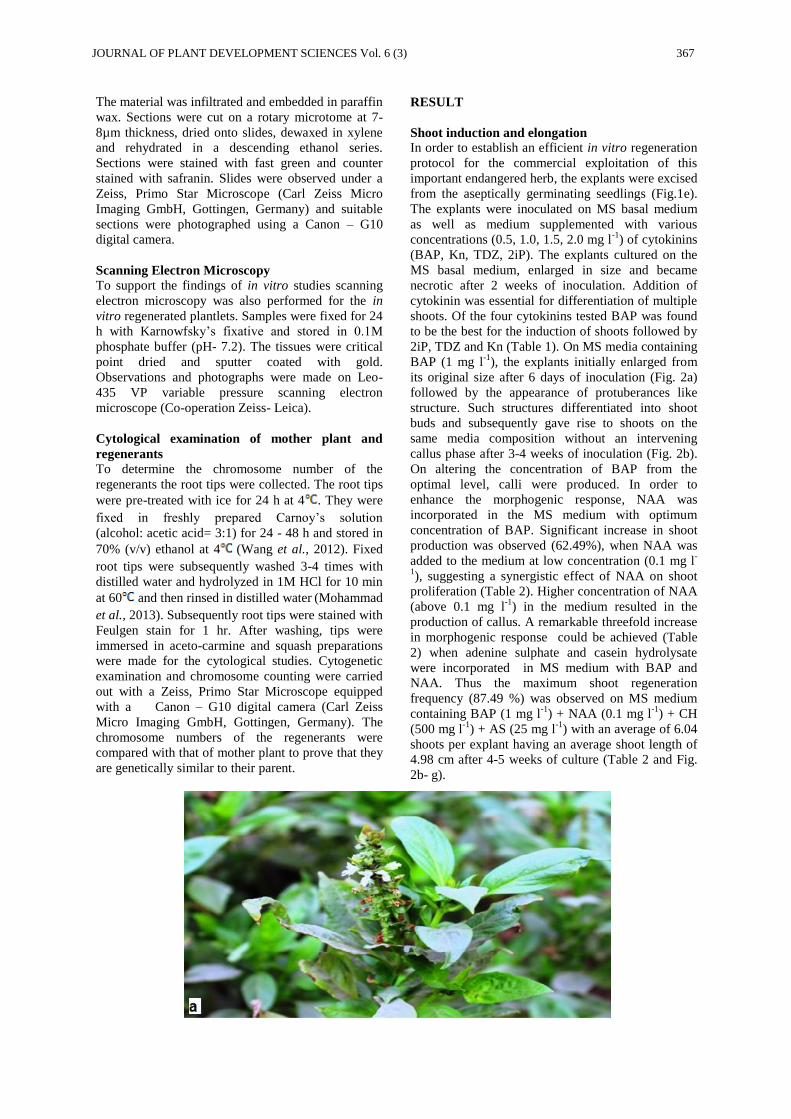

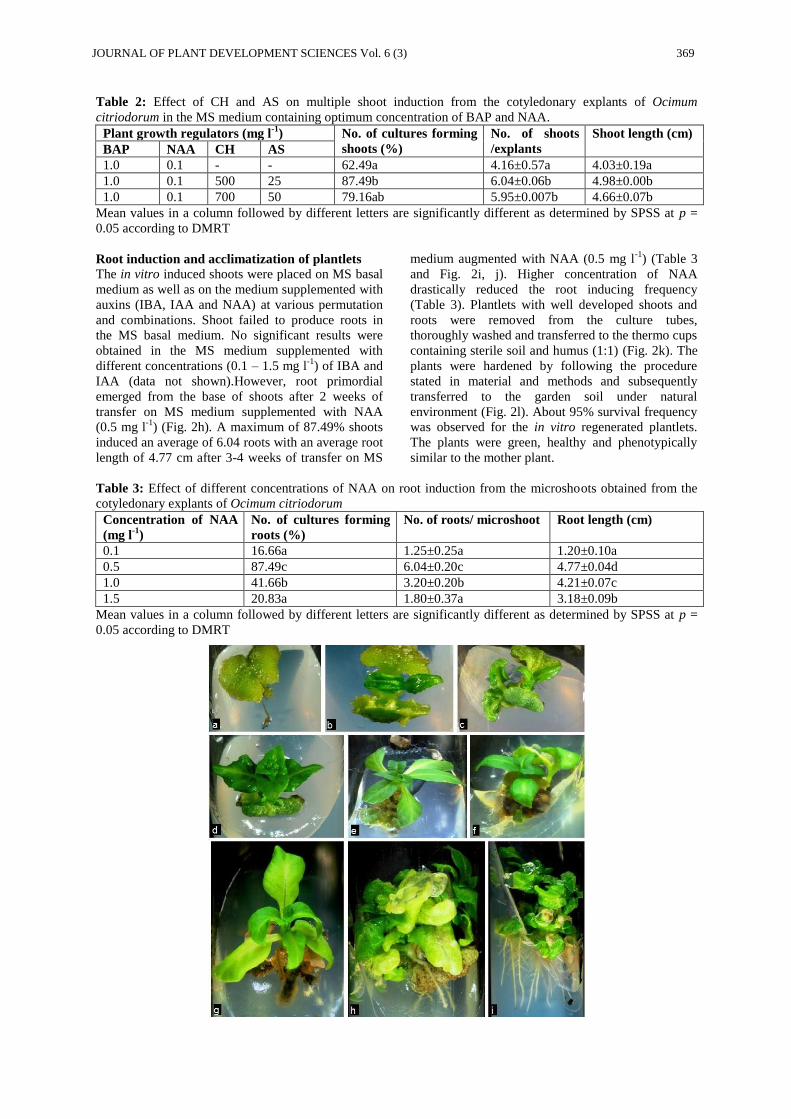

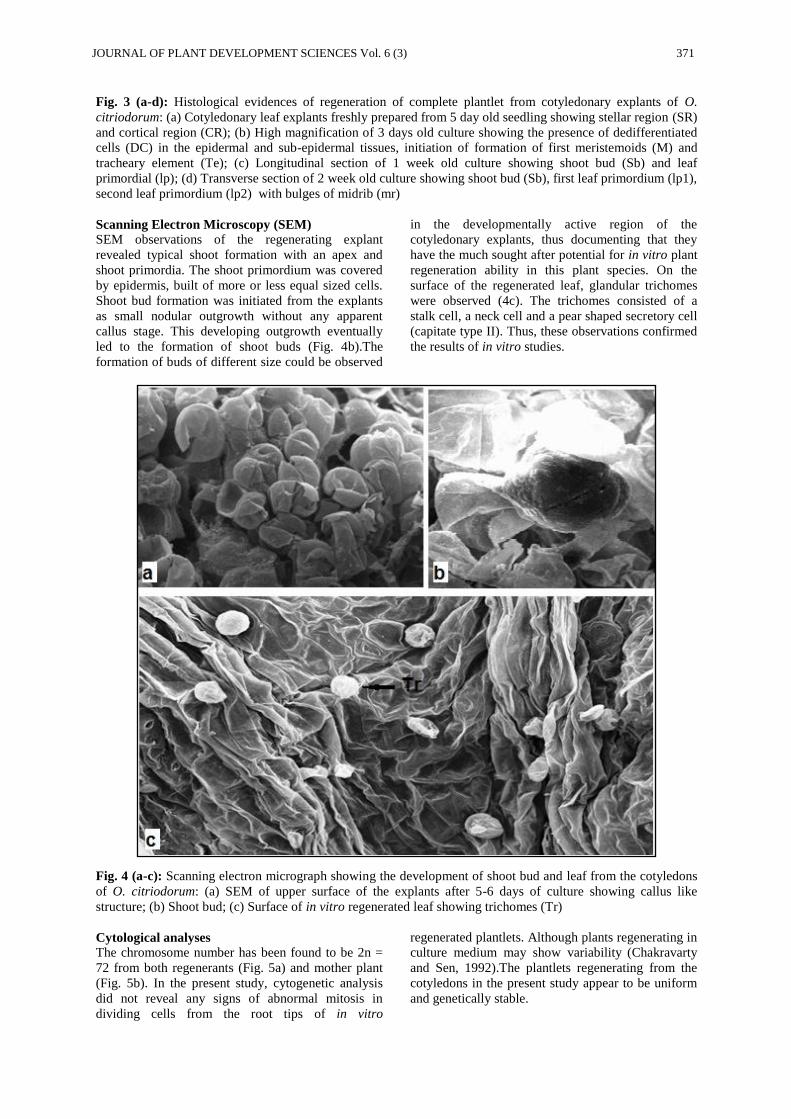
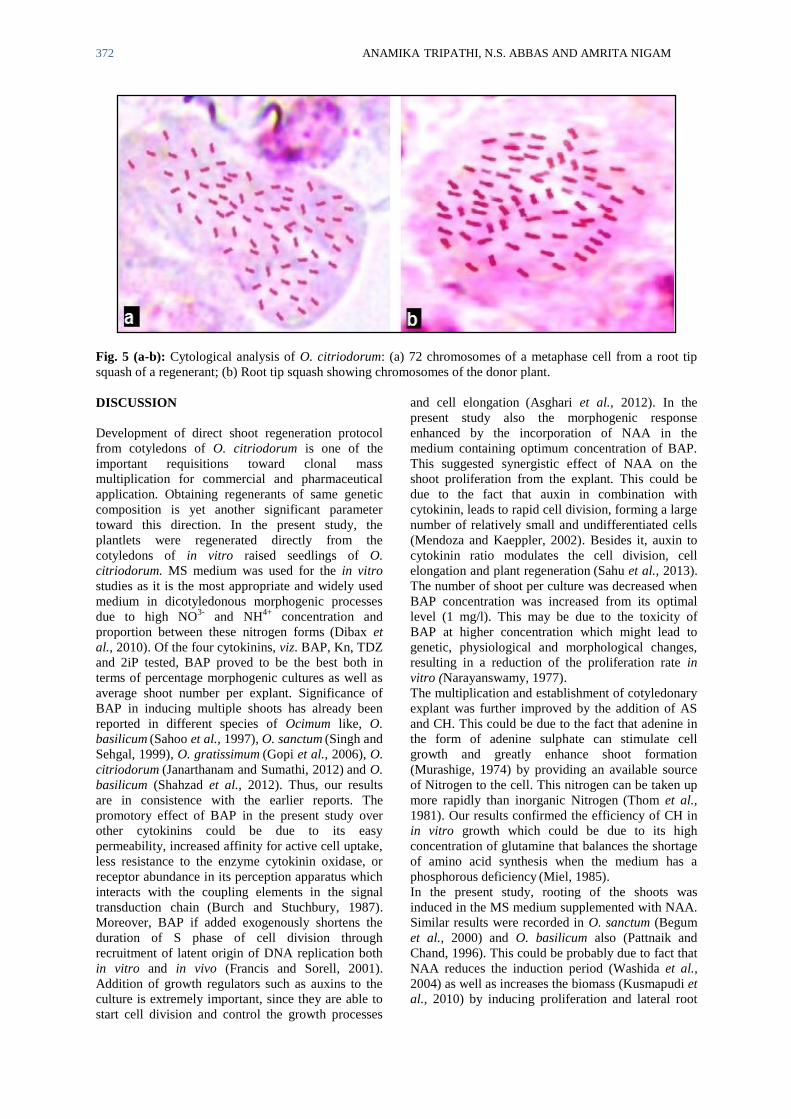


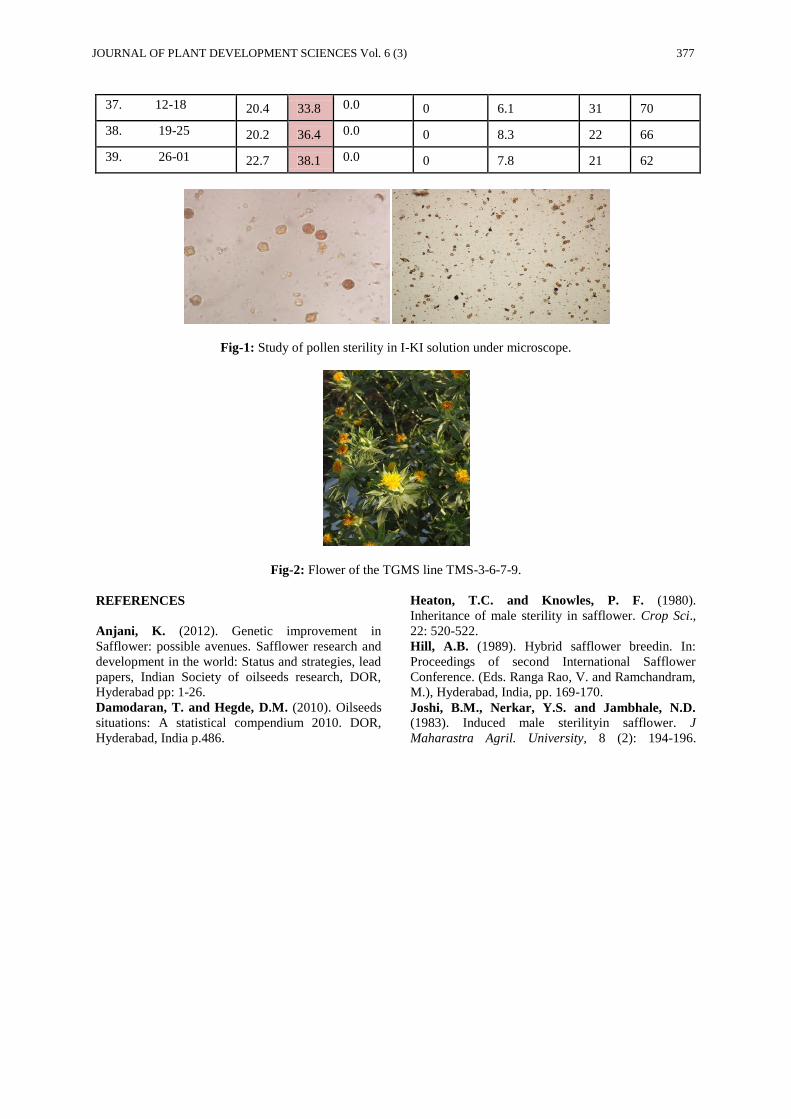


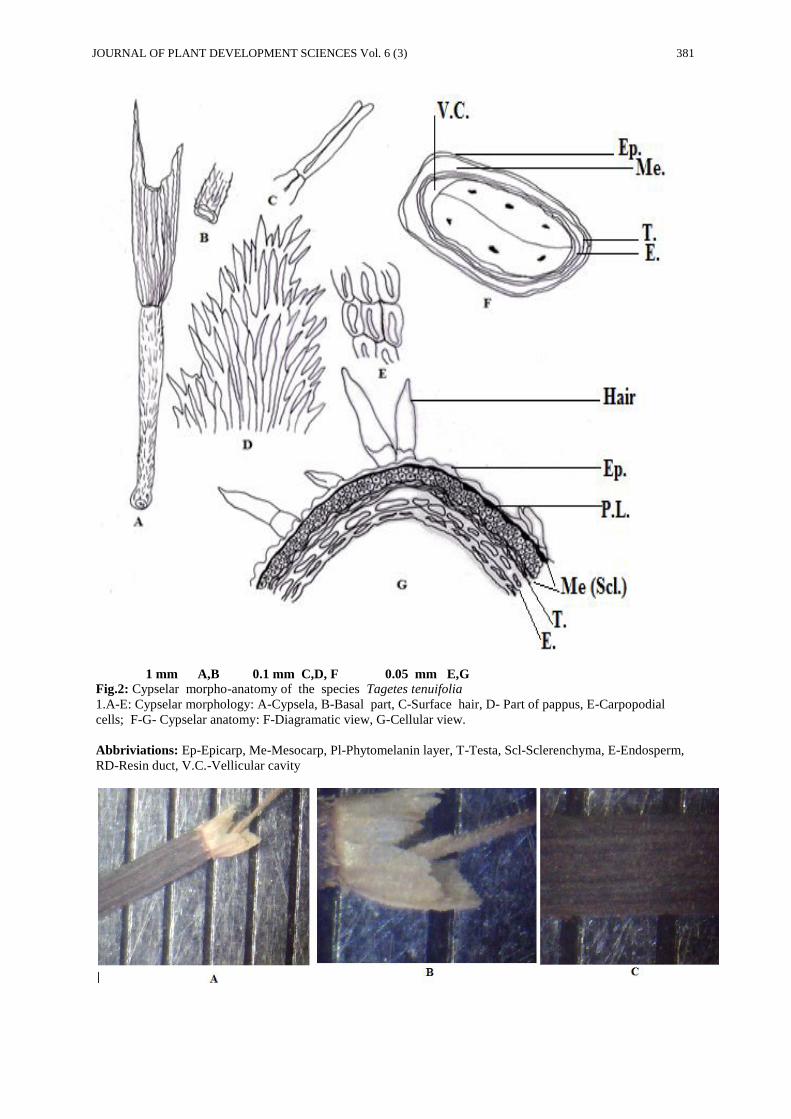
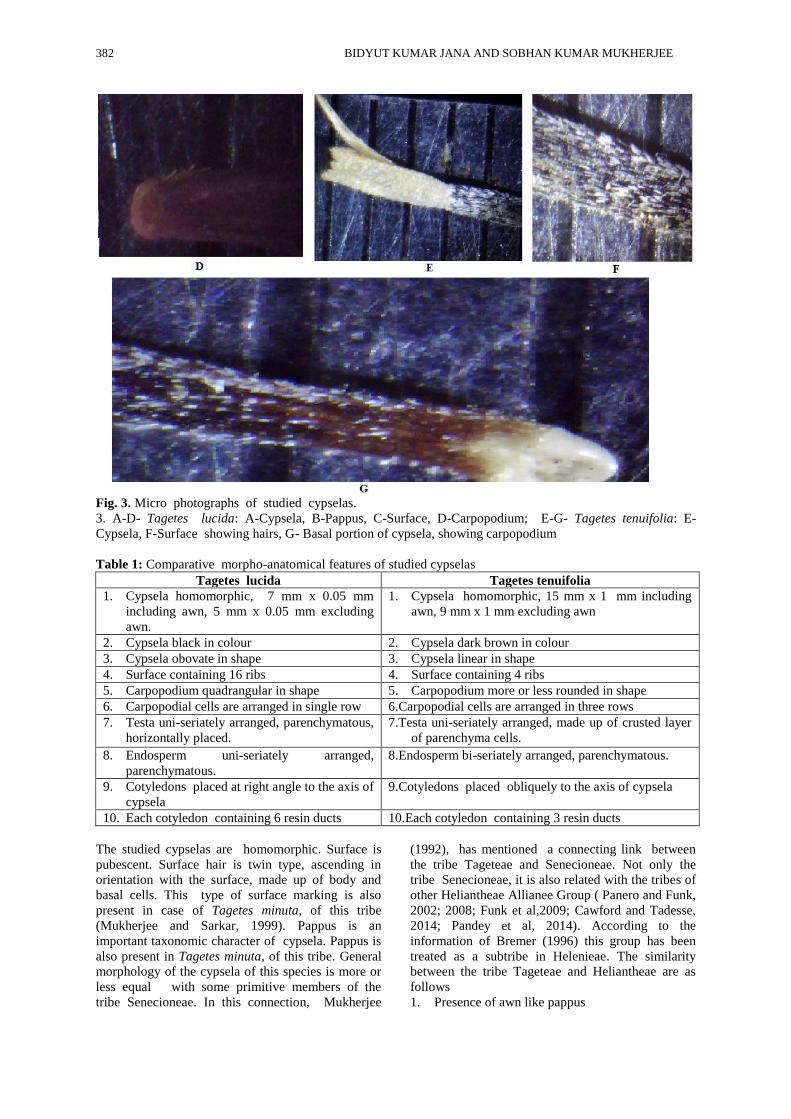


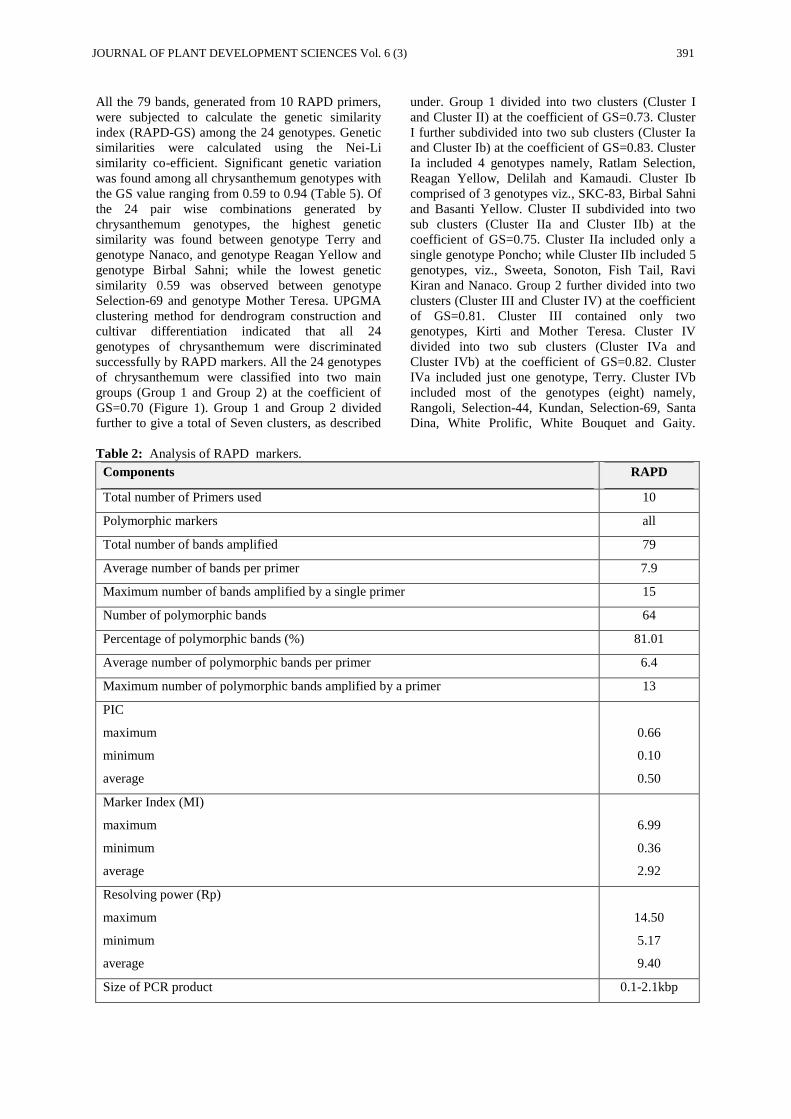


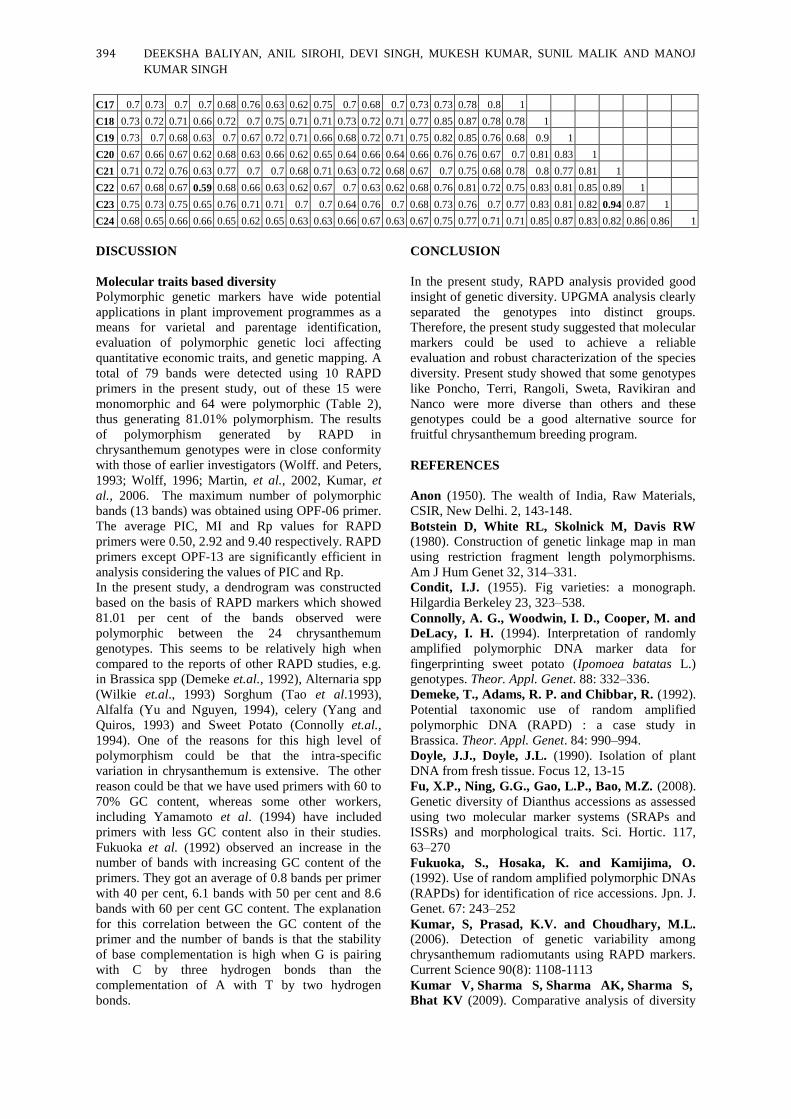


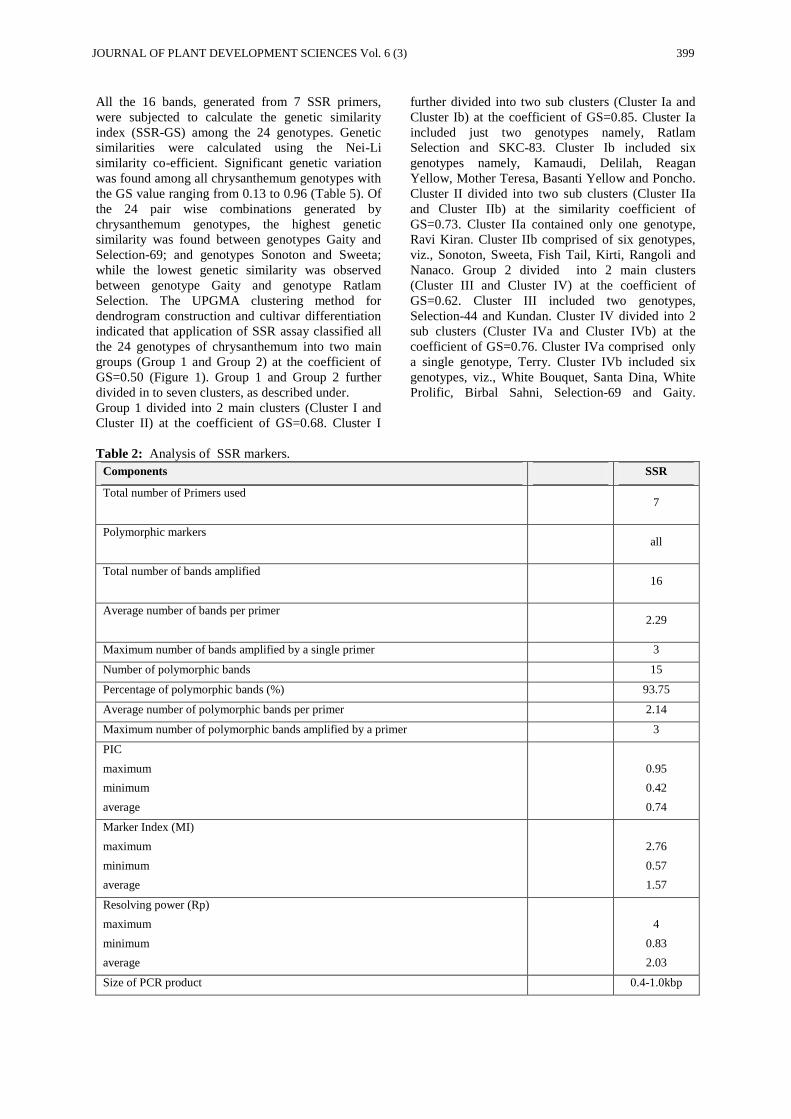
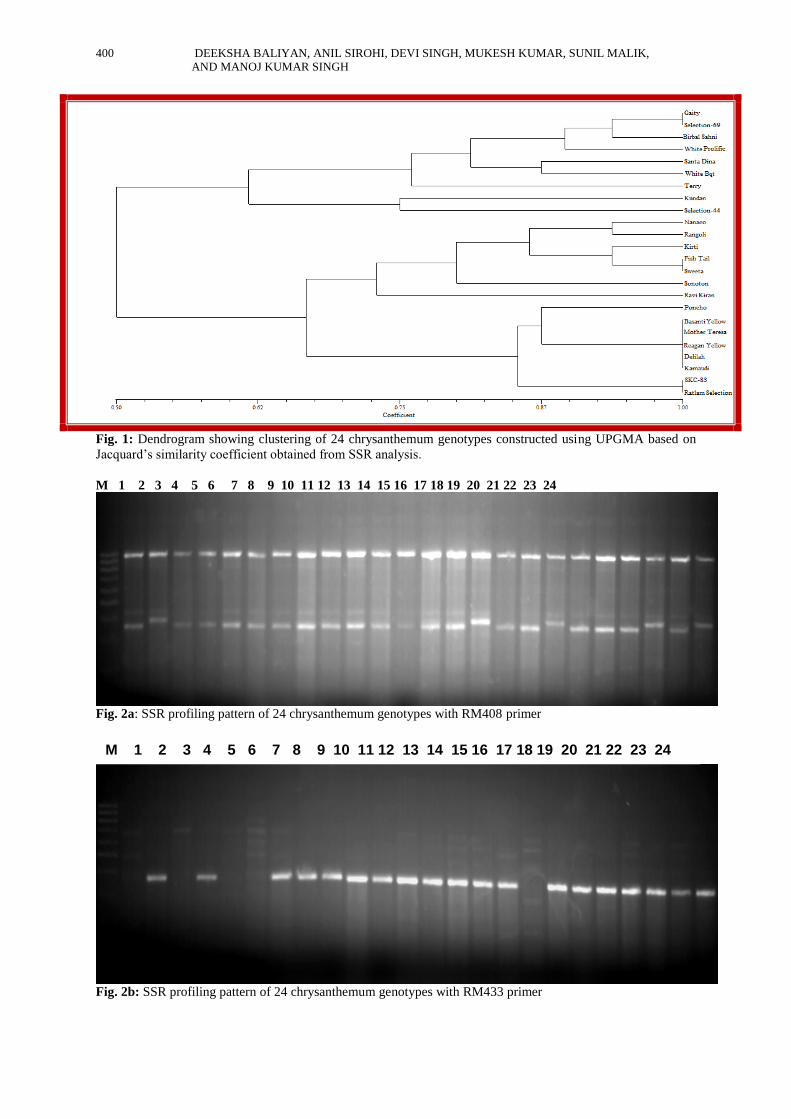

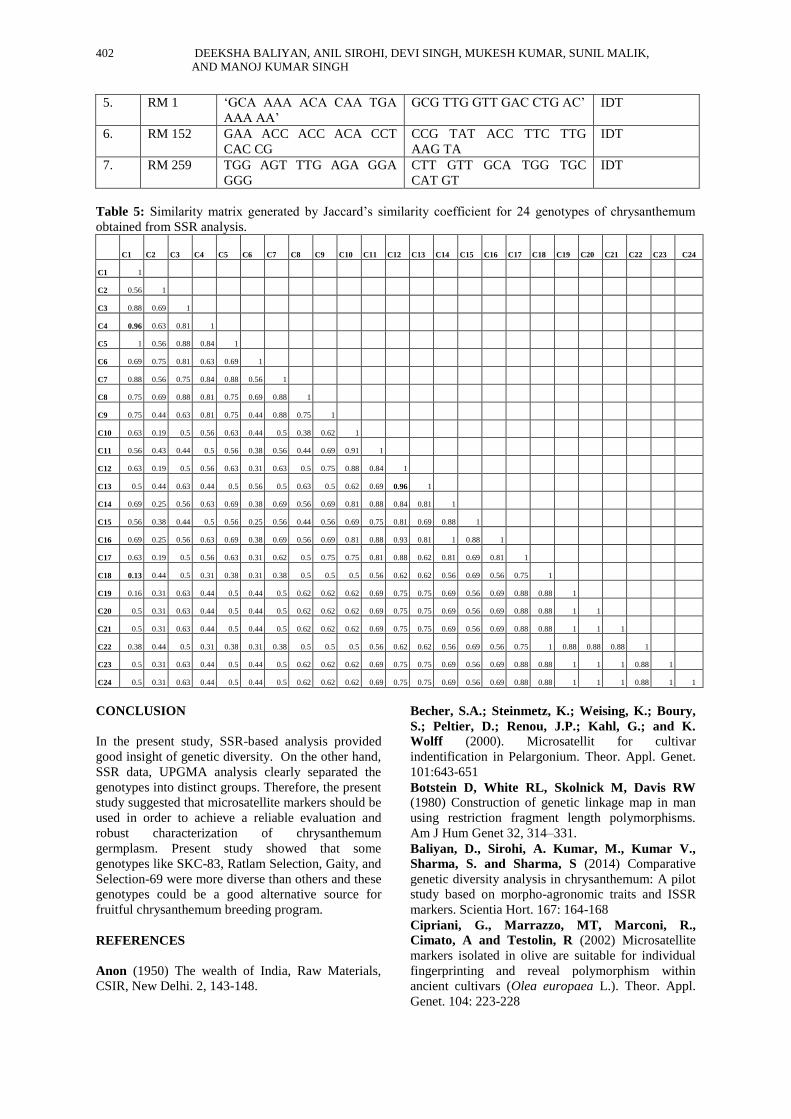


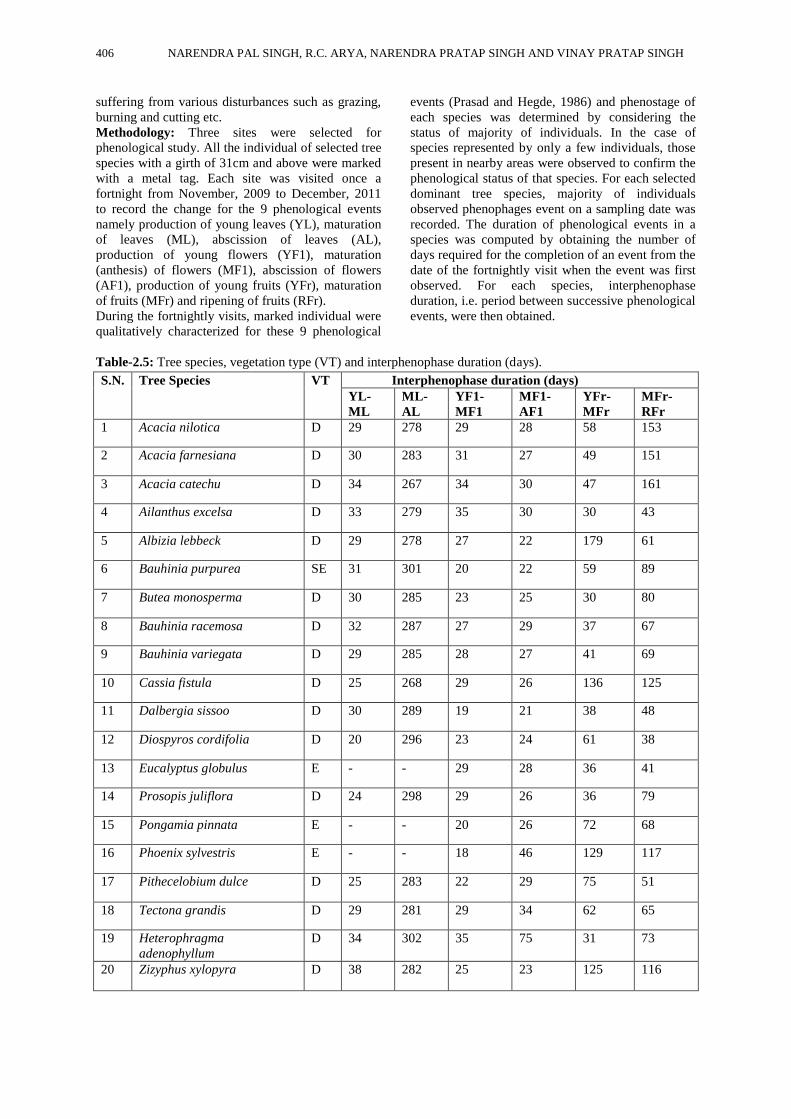
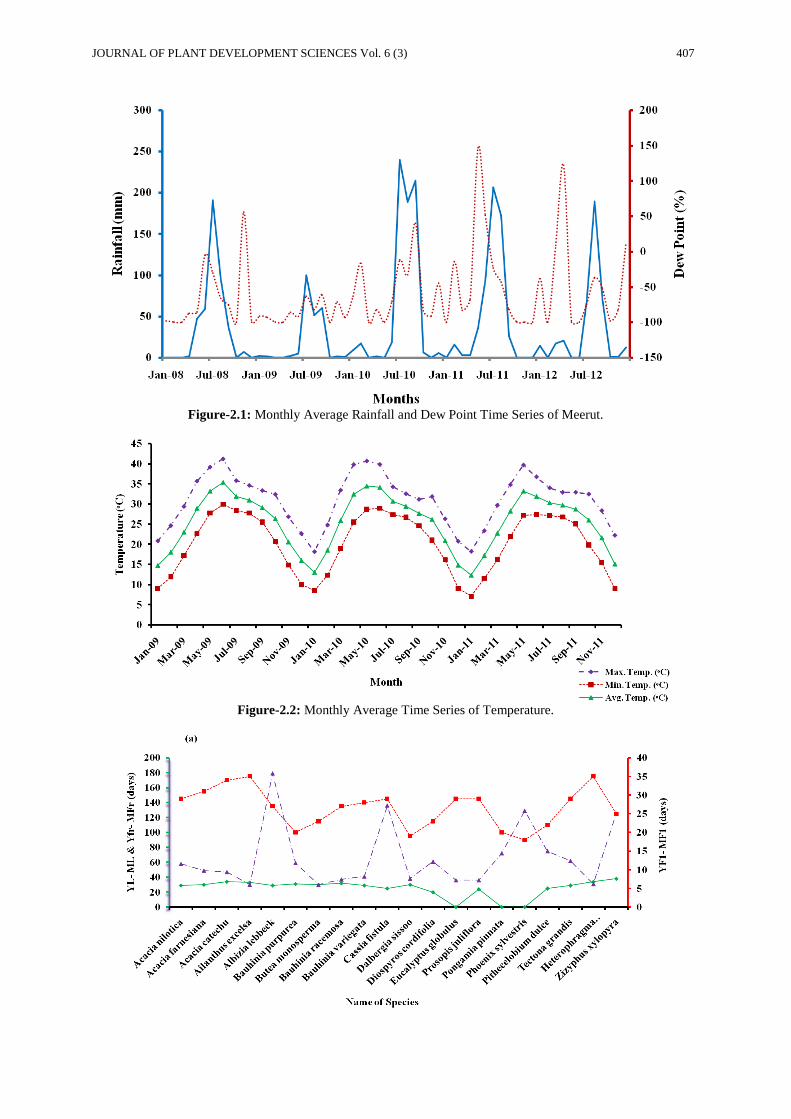


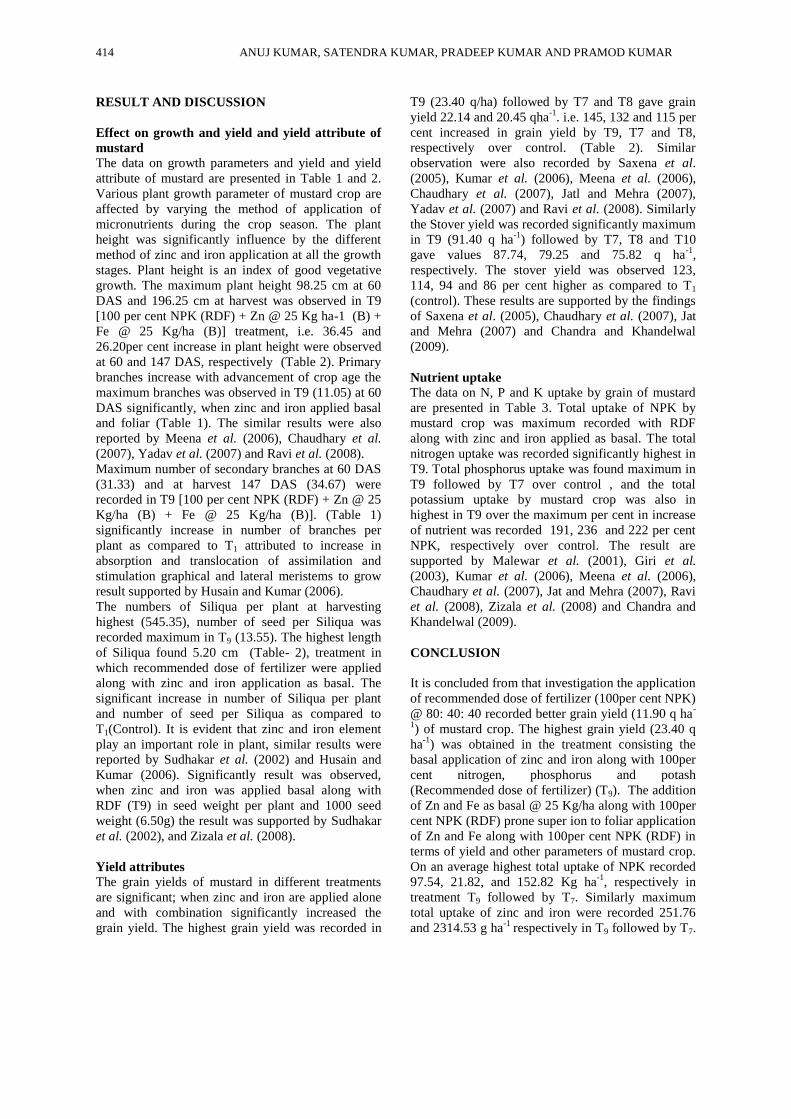


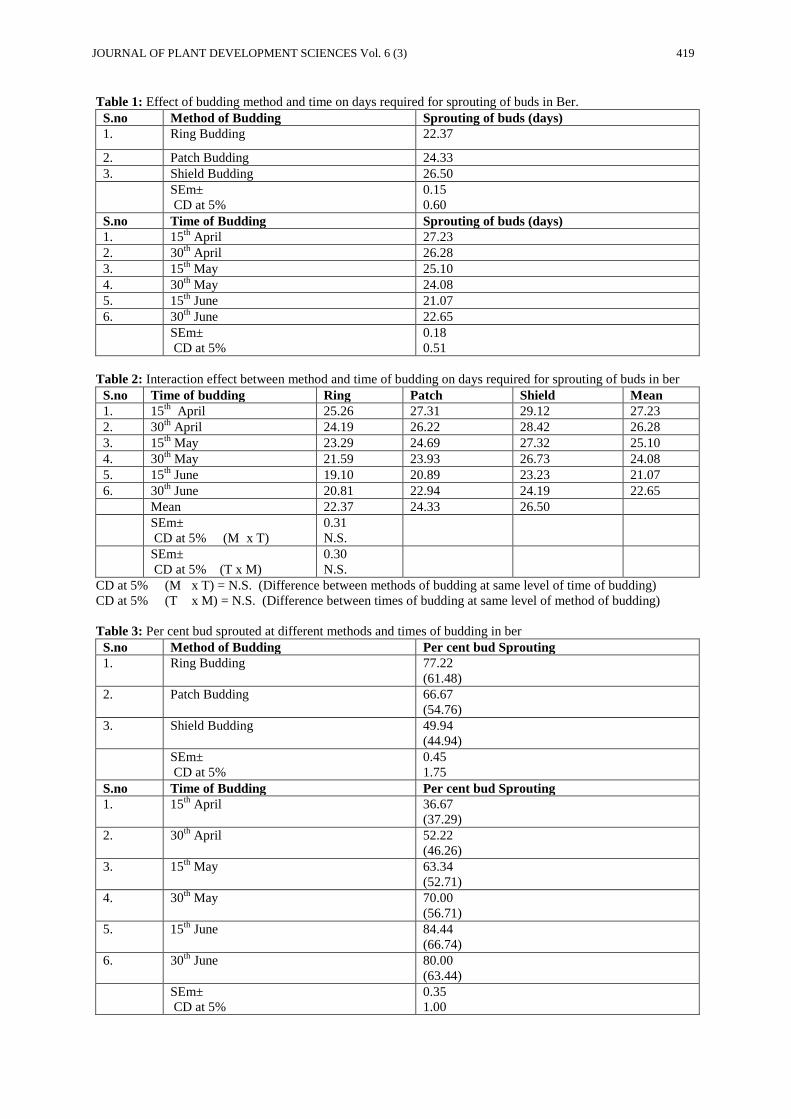


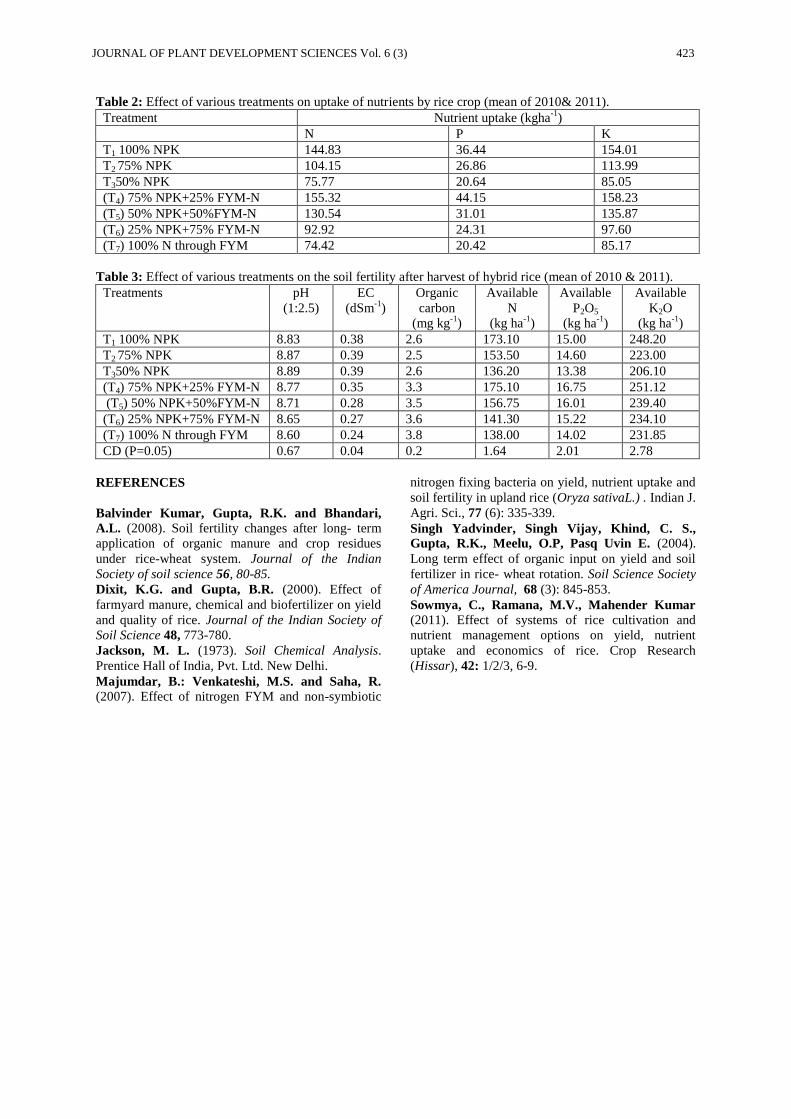


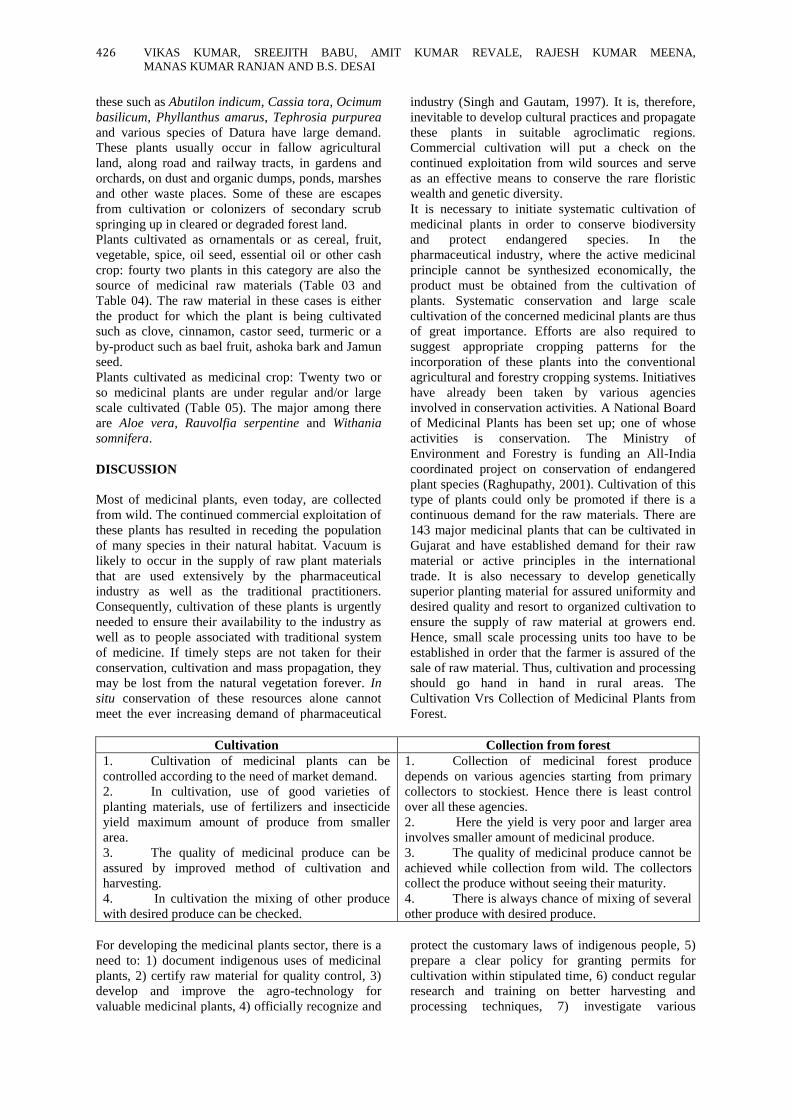


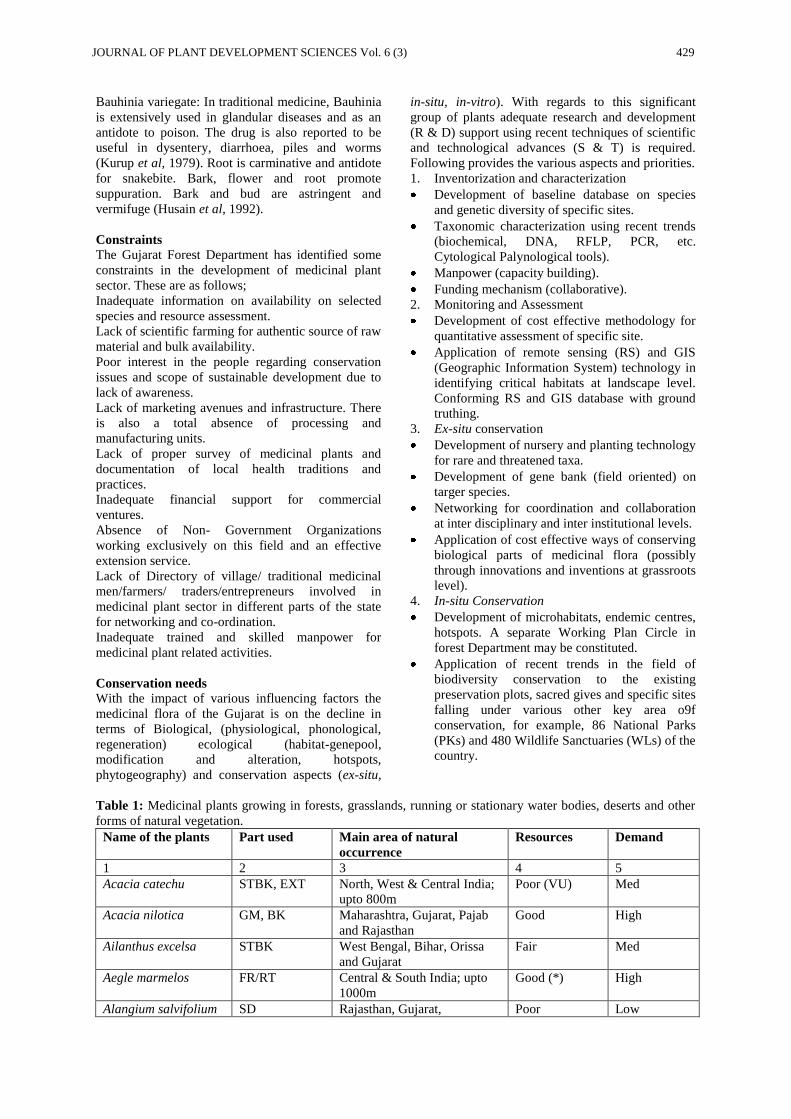

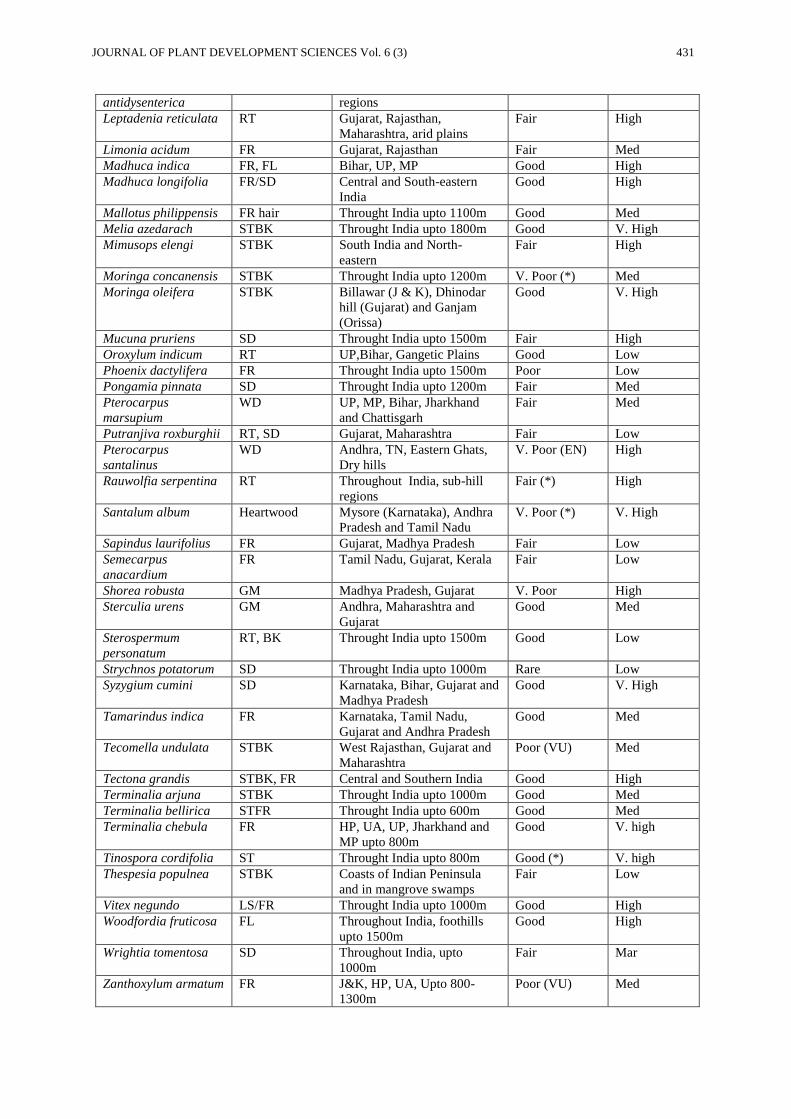

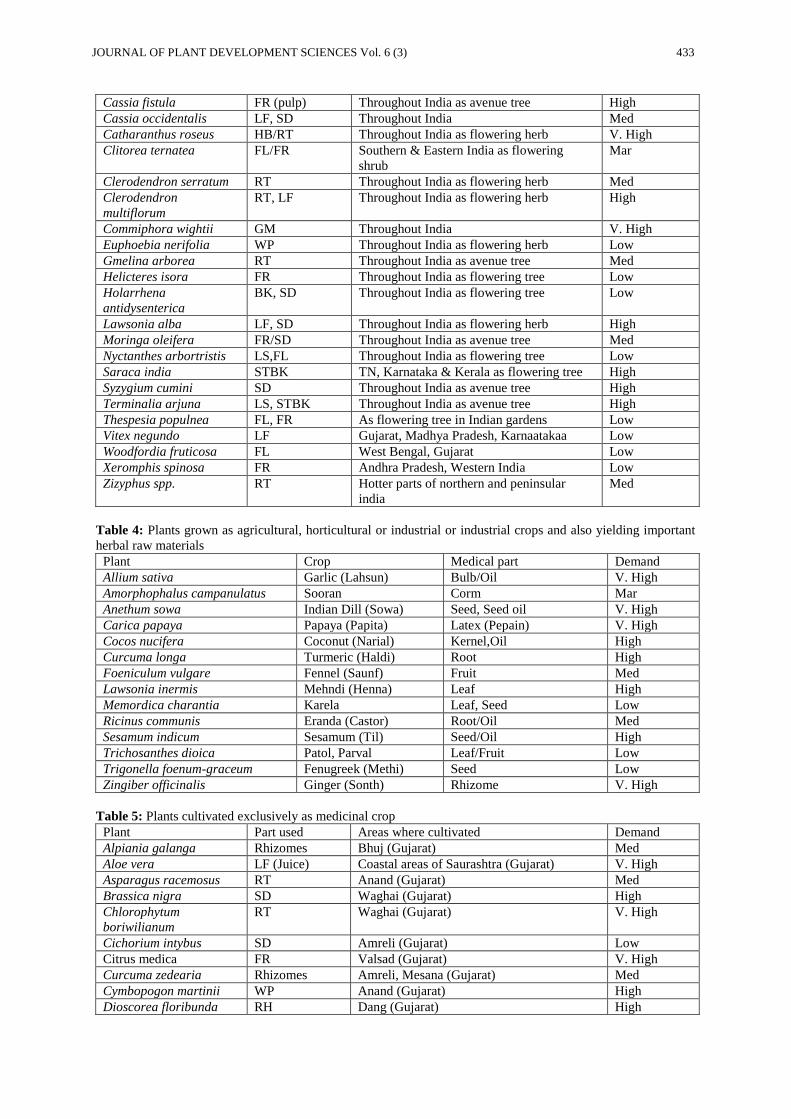
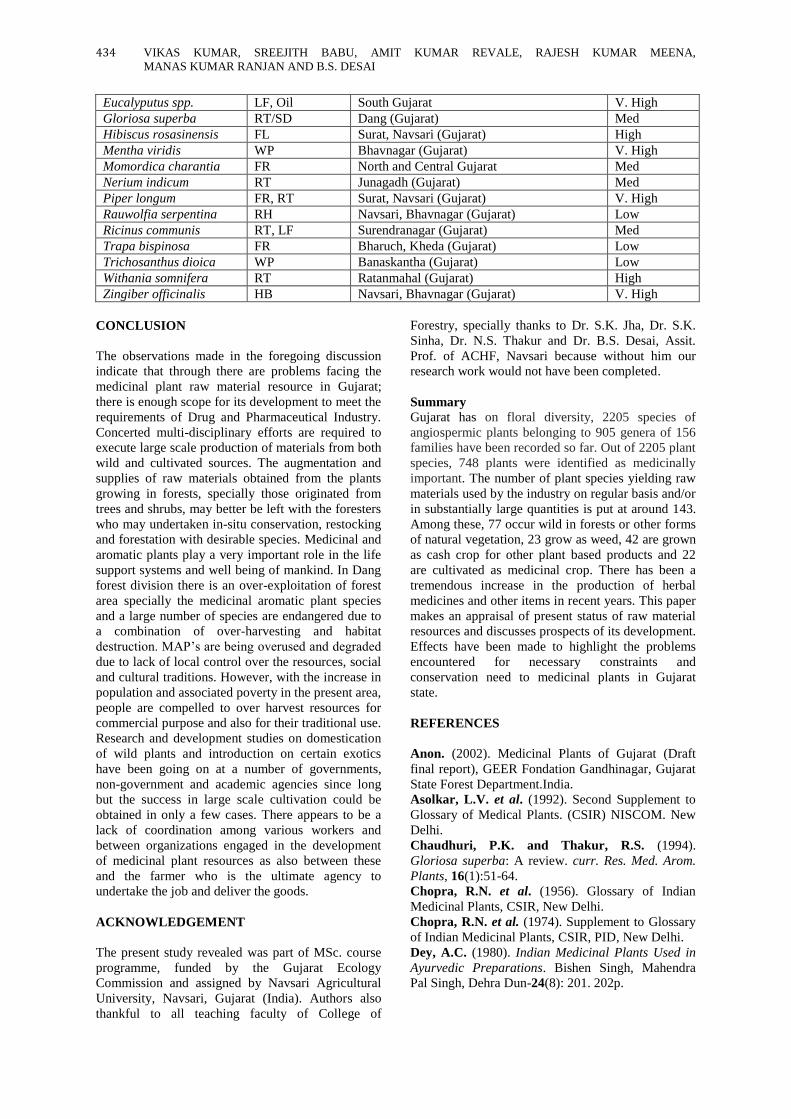


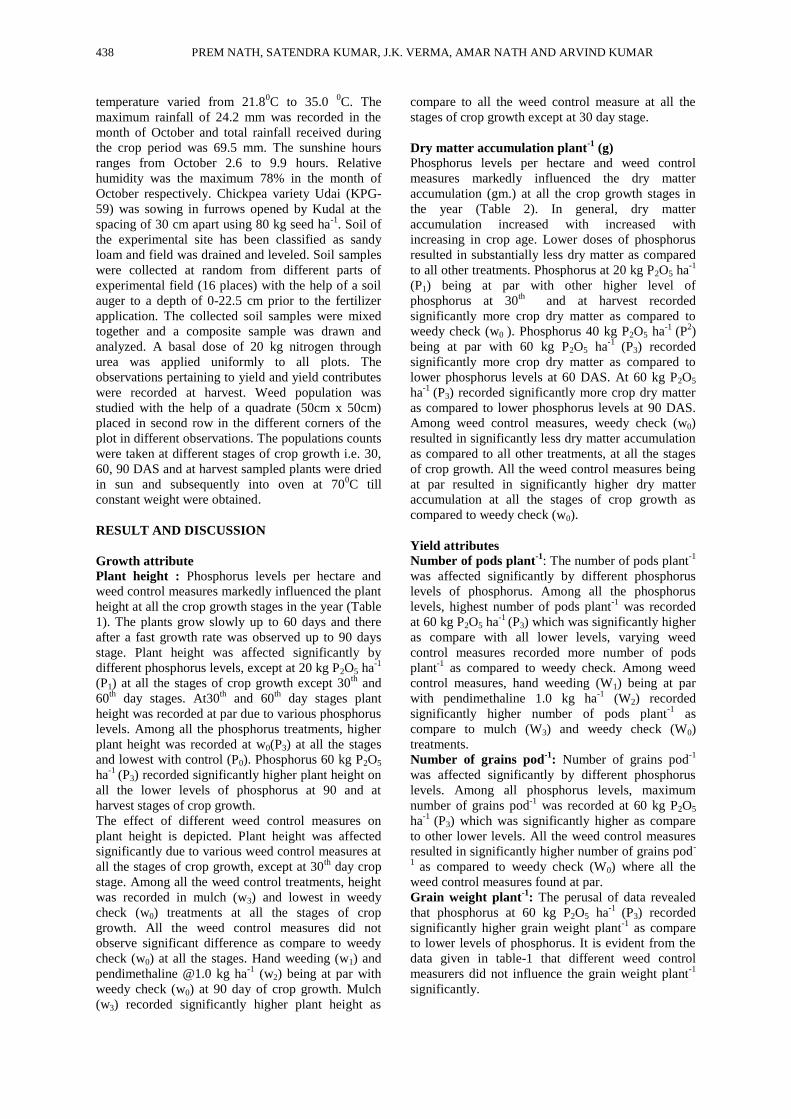


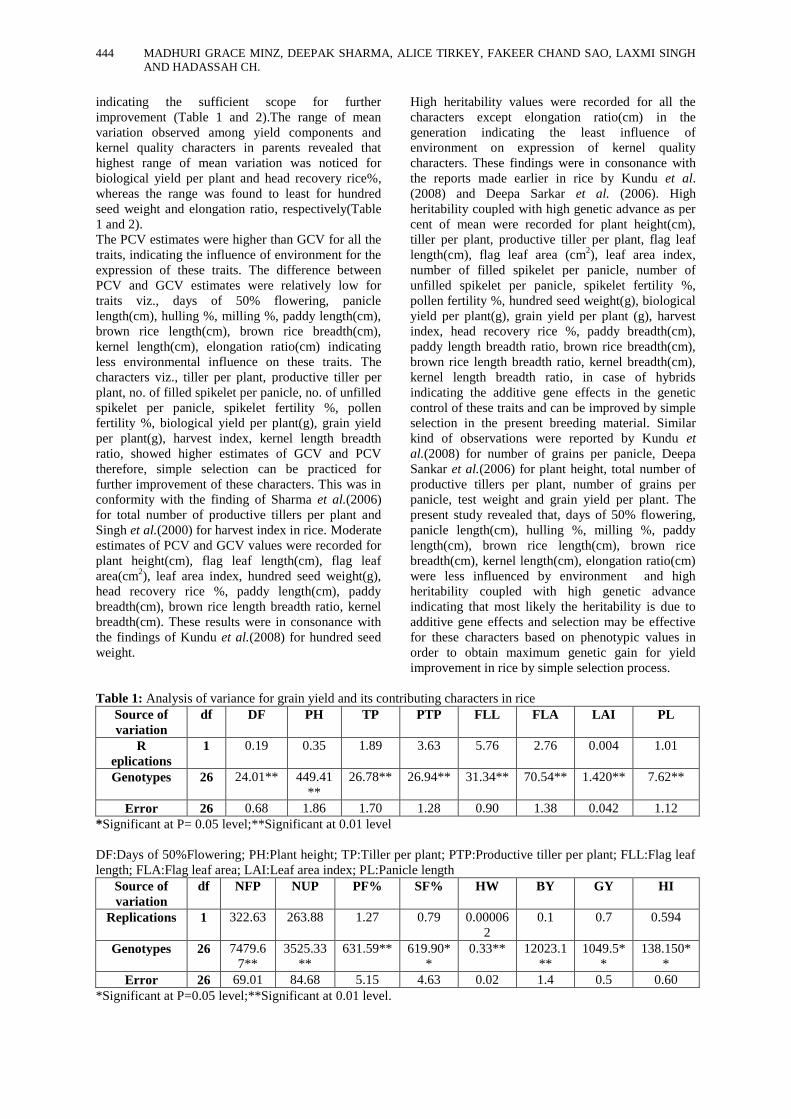


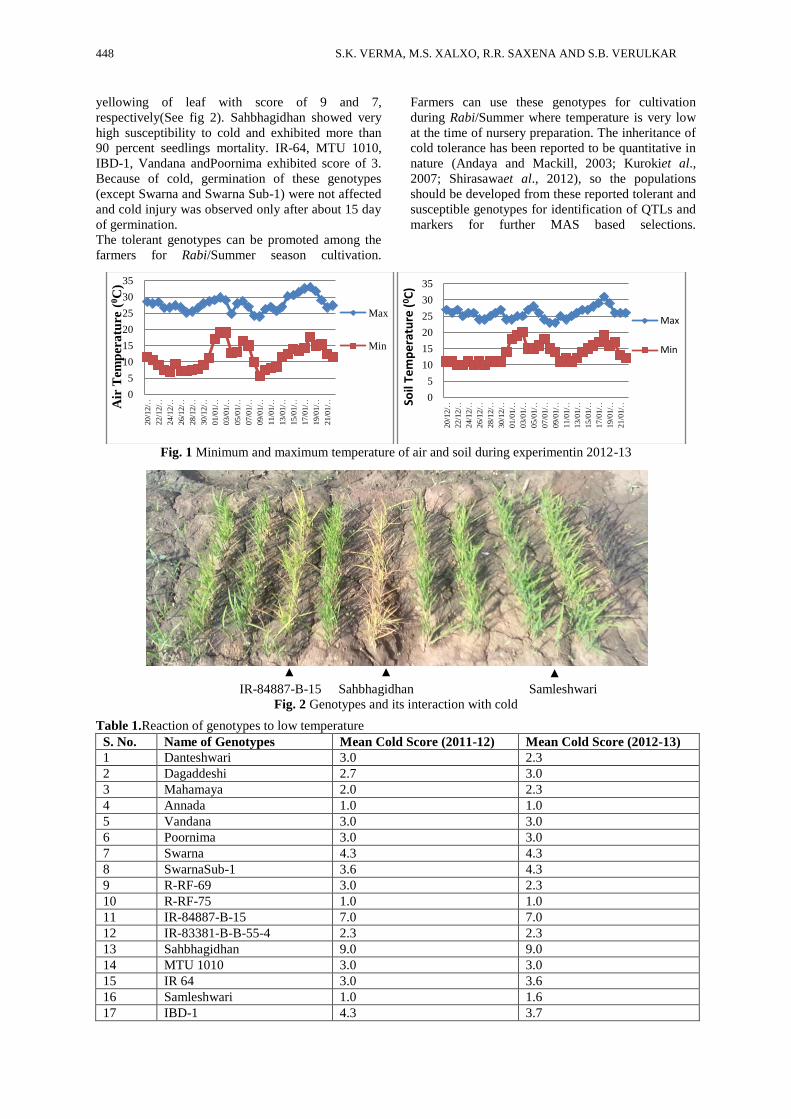


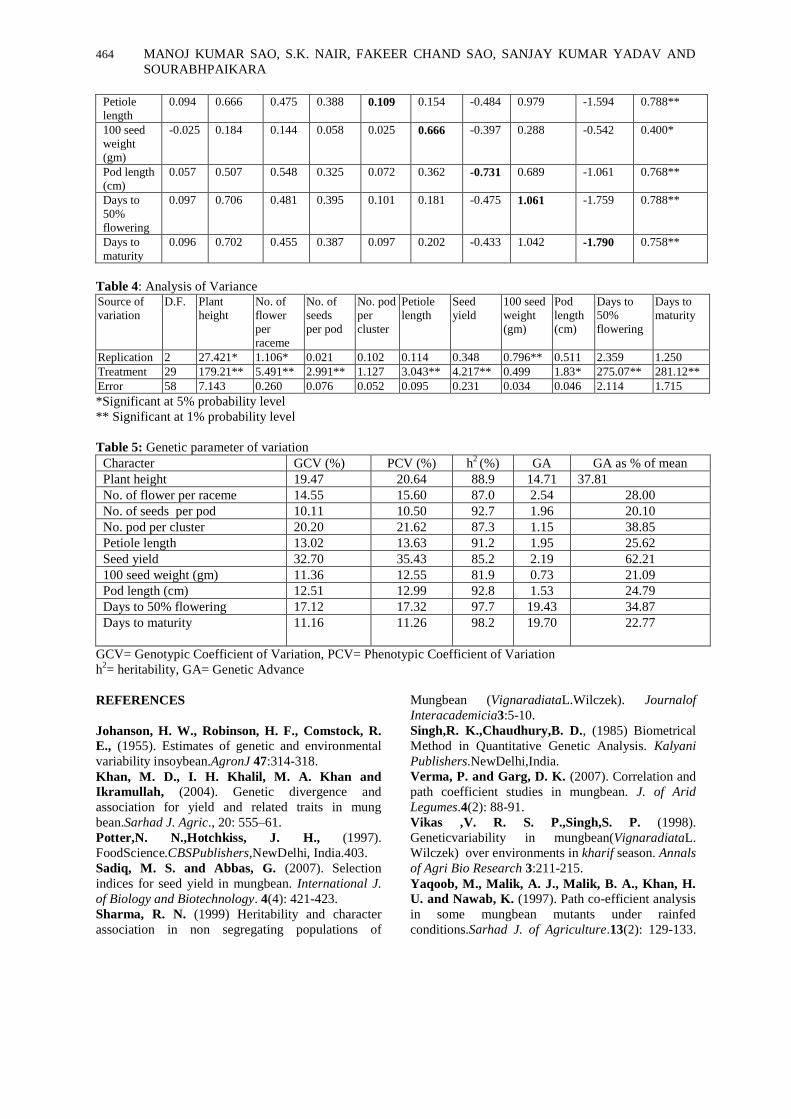
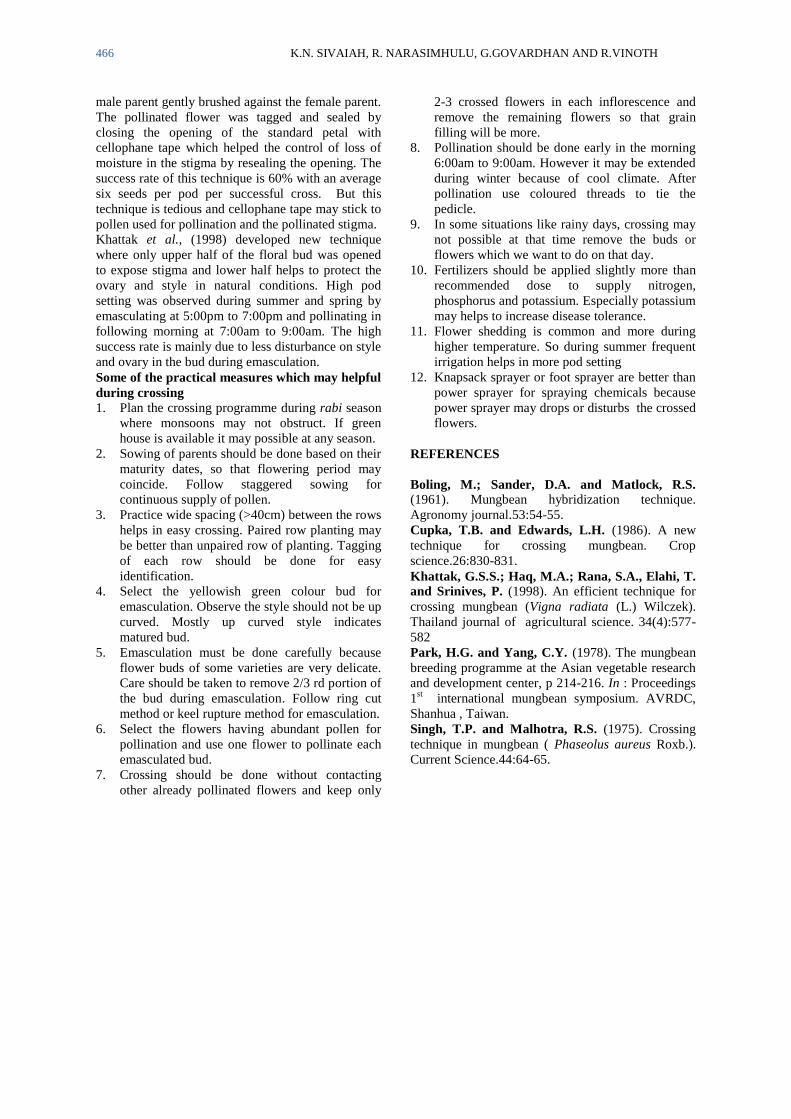

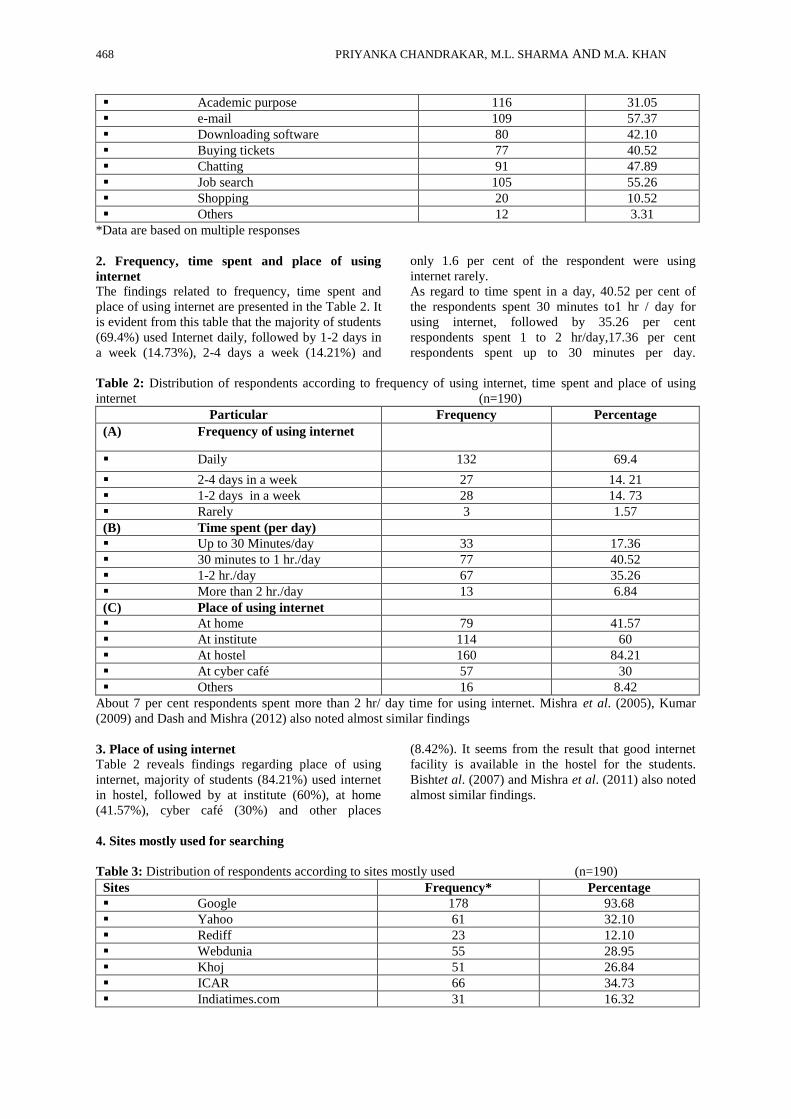


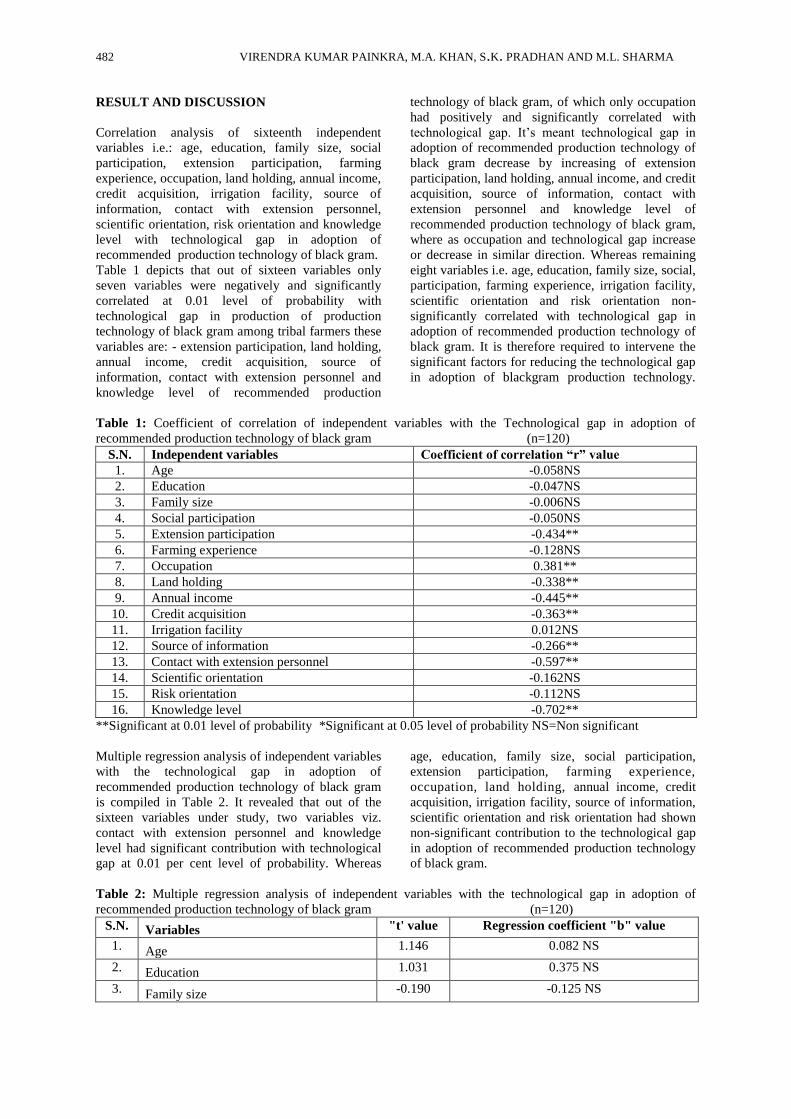


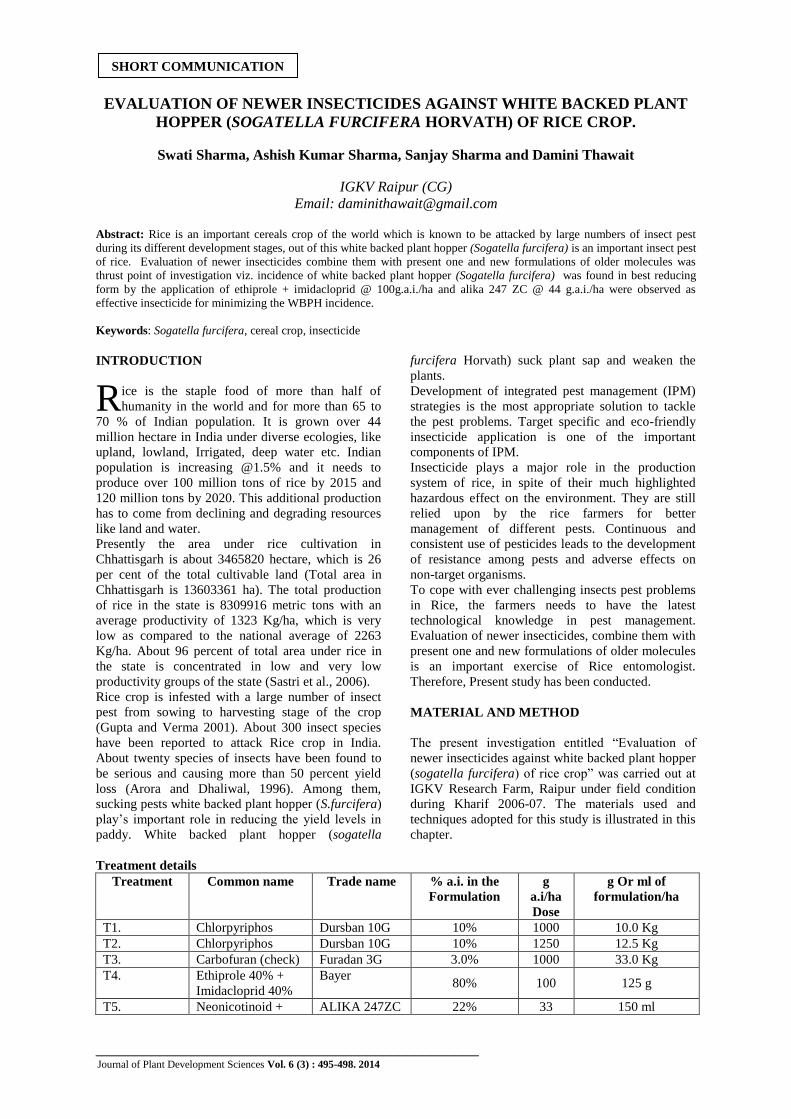
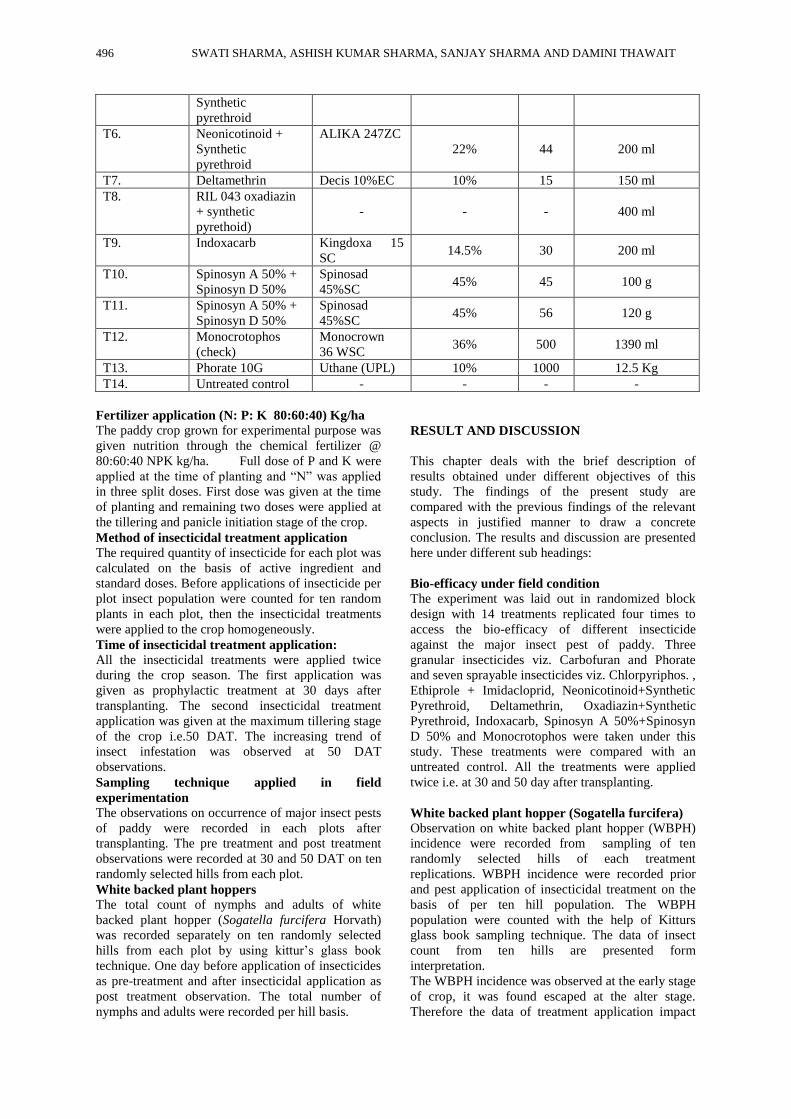


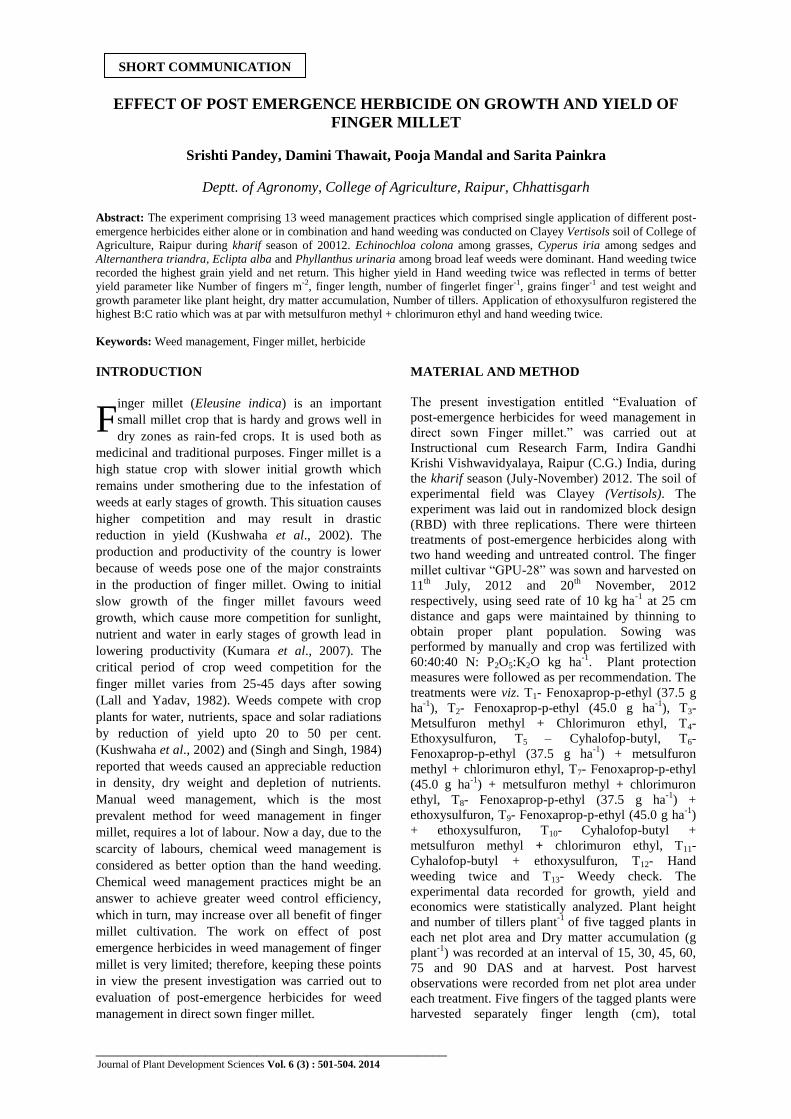

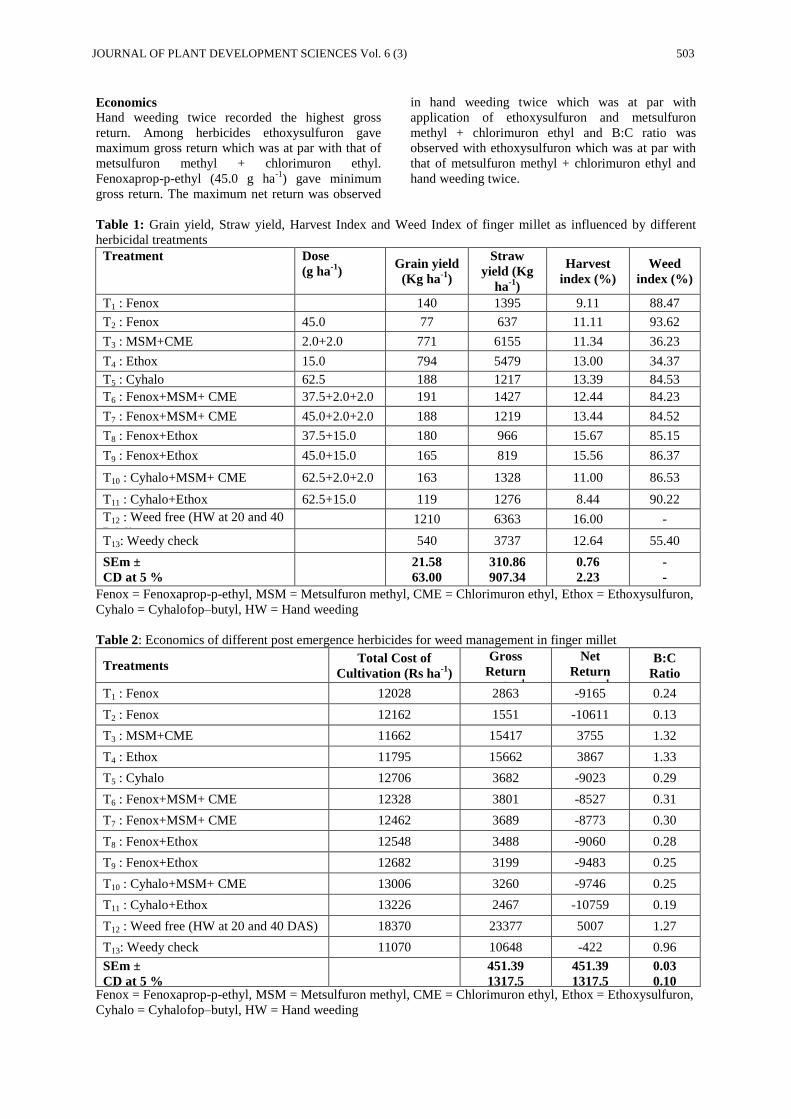


![Journal of Plant Development Sciencesjpds.co.in/wp-content/uploads/2014/03/Vol.-103.pdfAbstract: Pearl millet [Pennisetum glaucum (L.)R.Br.] is grown mainly as a rainfed crop in north](https://static.documents.pub/doc/80x56/5fecff2922186e616f6f6863/journal-of-plant-development-abstract-pearl-millet-pennisetum-glaucum-lrbr.jpg)


