Page 1
Journal of Plant Development Sciences (An International Monthly Refereed Research Journal)
Volume 12 Number 4 April 2020
Contents
REVIEW ARTICLE
Diara cultivation of cucurbits
—Barsha Tripathy, Samapika Dalai, Meenakshi Badu, Kalyani Pradhan, M. Sai Sindhu, B. Bhagyarekha
and Sandeep Rout ----------------------------------------------------------------------------------------------------- 189-194
RESEARCH ARTICLES
Changes in the physico-chemical properties of soil in different Deodarforests of Garhwal Himalaya
—Gaurav Chand Ramola, Digvijay Rathod, Yogesh Kumar, Prajapati Dhaval, Akshit Kukreti and V.P.
Khanduri---------------------------------------------------------------------------------------------------------------- 195-205
Collection of medicinal plants in traditional and modern perspective
—Vinay M. Raole and Vaidehi V. Raole -------------------------------------------------------------------------- 207-214
Long term effect of inorganic fertilizers and organic manures on nutrient uptake, and yield of rice on Inceptisol
—Kiran Rathore, Alok Tiwari and Rahul Kumar ------------------------------------------------------------- 215-222
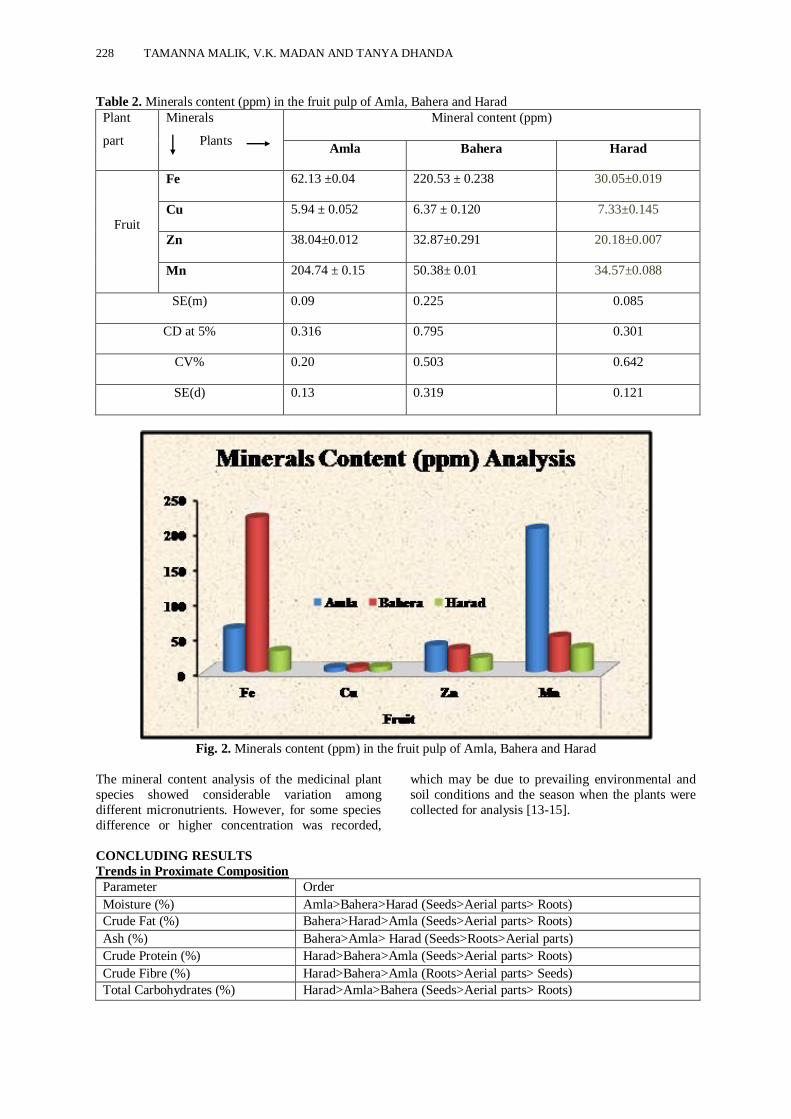
Assessment of medicinal plants through proximate and micronutrients analysis
—Tamanna Malik, V.K. Madan and Tanya Dhanda ---------------------------------------------------------- 223-229
Validation of mas derived lines for introgressed gene against blast and blb resistancein Southern Chhattisgarh
—Prafull Kumar ------------------------------------------------------------------------------------------------------ 231-237
Forecasting monthly precipitation model for Dantewada, Jagdalpur and Sukma region (Chhattisgarh) using
Arima model
—Anosh Graham, Avinash Yadu and Atul Galav -------------------------------------------------------------- 239-245
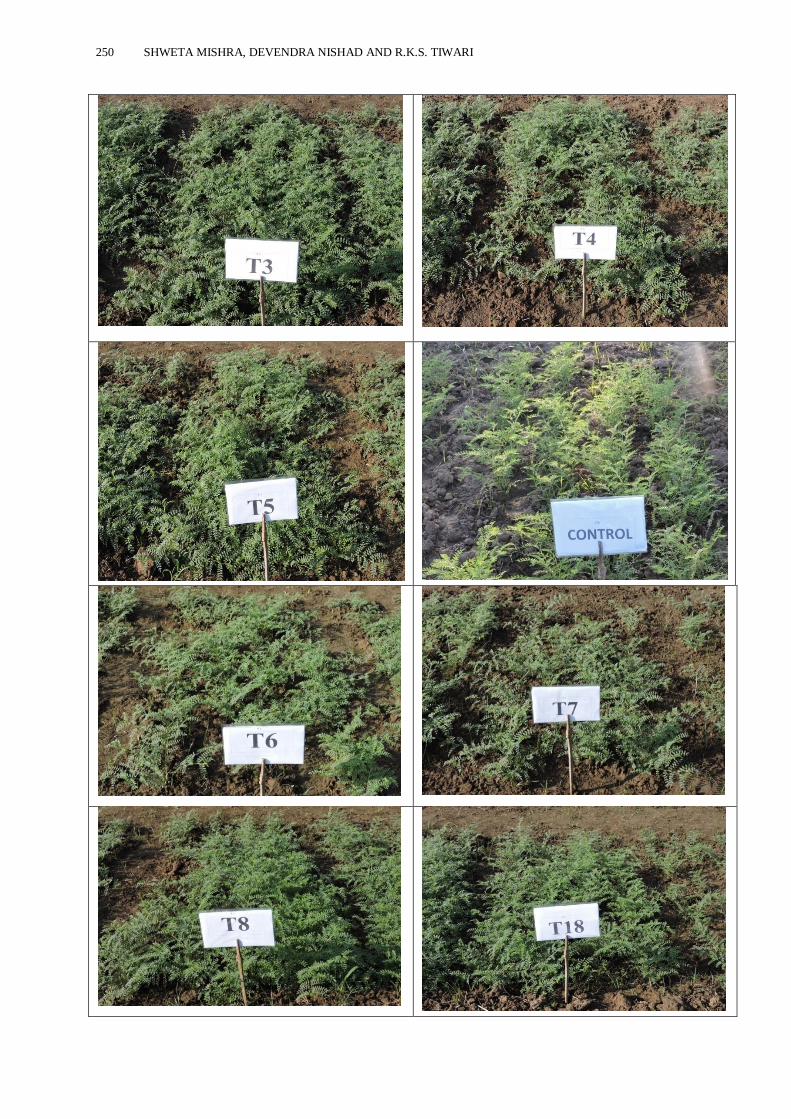
Disease controlling potential of Trichoderma harzianum and Trichoderma viride against collar rot of chickpea
—Shweta Mishra, Devendra Nishad and R.K.S. Tiwari ------------------------------------------------------ 247-251
Production potential and economics of intercropping in autumn planted- sugarcane under north hill zone of
Chhattisgarh
—Prakash Kumar Sahu, D.K. Gupta and V.K. Singh --------------------------------------------------------- 253-256
SHORT COMMUNICATION
Existing production patterns among the maize growers
—P.K. Netam, Basanti Netam and Virendra Kumar Painkra ----------------------------------------------- 257-259
Page 2
*Corresponding Author ________________________________________________ Journal of Plant Development Sciences Vol. 12(4): 189-194. 2020
DIARA CULTIVATION OF CUCURBITS
Barsha Tripathy1, Samapika Dalai
1, Meenakshi Badu
2, Kalyani Pradhan
1, M. Sai Sindhu
1, B.
Bhagyarekha1 and Sandeep Rout*
3
1Department of Horticulture, Centurion University of Technology and Management,
Paralakhemundi, Odisha-761211 2Sri Sri University, Cuttack, Odisha
3Department of Agronomy and Agroforestry, M. S. Swaminathan School of Agriculture, Centurion
University of Technology and Management, Parlakhemundi, Odisha-761211
Email: [email protected]
Received-05.04.2020, Revised-26.04.2020
Abstracts: In recent years, the agriculture sector is adversely affected by climate change, and the rural poor are becoming more vulnerable to unsustainable livelihoods. River areas are known as “Diara”. Diara land cultivation continues to be carried out with the traditional manner. Riverbed cultivation is a type of vegetables forcing, facilitating off season production of mainly cucurbitaceous vegetables. Incomes generated by river bed vegetable growers were used primarily for meeting their household food security. On riverbed vegetable cultivation is easy with respect to land preparation, water management and other cultural practices. In north India, the cucurbits generally grown together are cucumber, bottle gourd, bitter gourd,
summer squash, round melon and long melon but ridge gourd in Rajasthan, MP and UP. The major constraints of diara farming are stray animals, strong windstorms and long spell of droughts. Diara farming is a pro-poor focused program for the rural community to increase household income and to improve the food security of landless and land poor households of India.
Keywords: Climate change, Cultivation, Cucurbits, Vegetable
INTRODUCTION
he ancient practice diara cultivation was started
during the mughal period predominantly with
various cucurbits. It was selected as an entry point to
promote inclusive economic growth for the benefit of the landless people. A piece of land created inside a
river due to deposition of sand is known as Diara
land or river bed. Cultivation in riverbeds facilitates
off season production which is a type of vegetable
forcing in many cucurbitaceous vegetables which is
purely an indigenous and innovation of Indian
vegetable grower. The term "Diara" has been
extracted from the word „Diya‟ meaning earthen
lamp. Keeping in conformity with the shape of the
„Diya‟, the bowl like systems on the surface
(depressions) situated between the natural levees on
either side of the river appear like small „Diyas‟ when rain water gets accumulated in them during the
rainy session. In survey it was observed that out of
total area under cucurbits cultivation, 60 % area is
under riverbed cultivation during the summer season
around 75-80 % of total cucurbits production is being
produced in river beds or diara land area which is
available in market from February – June. Such land
is also known as in different areas of India as
khaddar lands, char lands, dariayi, kachhar, doab,
kochar, nad, riverine area, and nadiari. Diara lands
and tal lands.
How it forms
The alluvion and diluvion action of perennial
Himalayan Rivers during South- West monsoon lead
to the formation of diara lands. During monsoon, the
vegetable crops can be grown on these lands due to
yearly deposits of fresh silt and clay. After the monsoon season, the water from the riverbeds
retreats back to its channel, leaving large areas dry.
These areas of land are generally left unused. The
subterranean moisture seeped from adjacent river,
streams, makes the upper layers of land more suitable
for growing early vegetable crops.
Where it works
The technology works well on marginal lands, in
topographically flat areas with river beds that are
dry for one crop cycle (approximately 6 months)
with arable land silted over and/or washed away
due by floods.
Distance/Adjoining to village: not more than 30
minutes on foot.
Sand must be fine and small-grained and the
groundwater table should be <1 m.
Riverbeds or riverbanks may be cultivated.
Riverbeds have a higher soil moisture content
compared to riverbanks.
Main River beds in India Main river beds which formed by different rivers are
found in 9 states (Table 1). State wise, the main river
beds in India are:
T
REVIEW ARTICLE
Page 3
190 BARSHA TRIPATHY, SAMAPIKA DALAI, MEENAKSHI BADU, KALYANI PRADHAN, M. SAI SINDHU,
B. BHAGYAREKHA AND SANDEEP ROUT
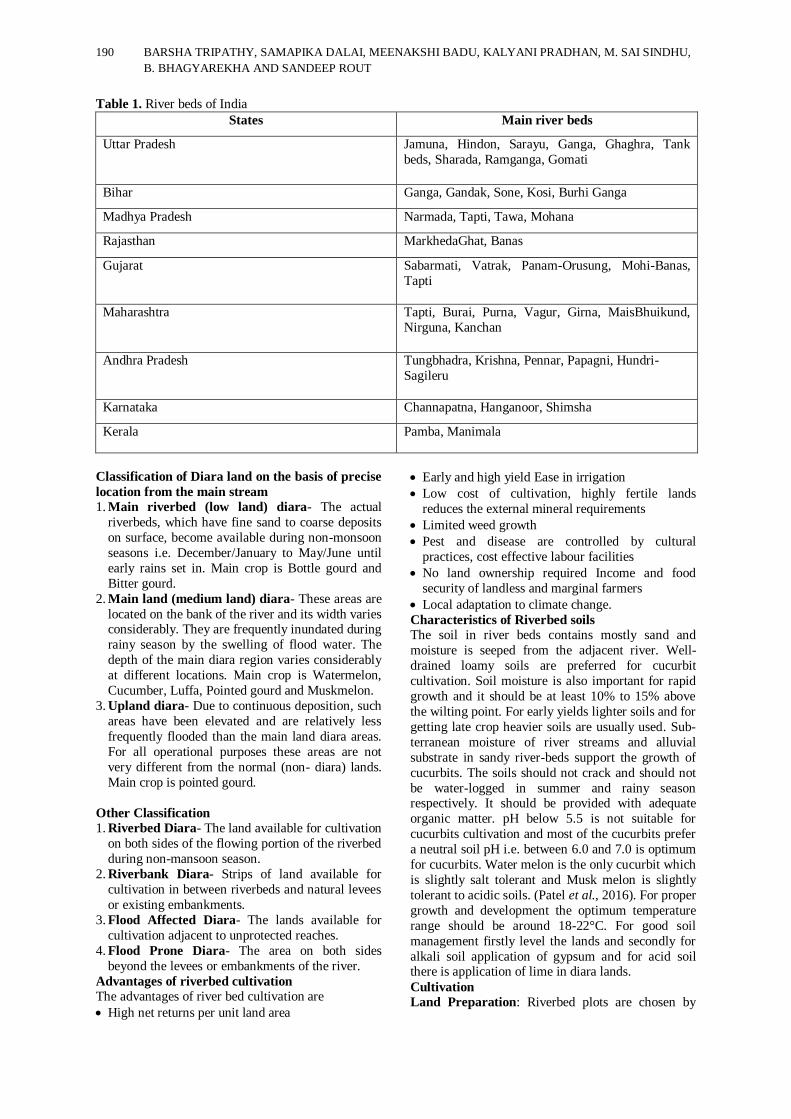
Table 1. River beds of India
States Main river beds
Uttar Pradesh Jamuna, Hindon, Sarayu, Ganga, Ghaghra, Tank
beds, Sharada, Ramganga, Gomati
Bihar Ganga, Gandak, Sone, Kosi, Burhi Ganga
Madhya Pradesh Narmada, Tapti, Tawa, Mohana
Rajasthan MarkhedaGhat, Banas
Gujarat Sabarmati, Vatrak, Panam-Orusung, Mohi-Banas,
Tapti
Maharashtra Tapti, Burai, Purna, Vagur, Girna, MaisBhuikund,
Nirguna, Kanchan
Andhra Pradesh Tungbhadra, Krishna, Pennar, Papagni, Hundri-
Sagileru
Karnataka Channapatna, Hanganoor, Shimsha
Kerala Pamba, Manimala
Classification of Diara land on the basis of precise
location from the main stream 1. Main riverbed (low land) diara- The actual
riverbeds, which have fine sand to coarse deposits
on surface, become available during non-monsoon
seasons i.e. December/January to May/June until
early rains set in. Main crop is Bottle gourd and
Bitter gourd.
2. Main land (medium land) diara- These areas are
located on the bank of the river and its width varies considerably. They are frequently inundated during
rainy season by the swelling of flood water. The
depth of the main diara region varies considerably
at different locations. Main crop is Watermelon,
Cucumber, Luffa, Pointed gourd and Muskmelon.
3. Upland diara- Due to continuous deposition, such
areas have been elevated and are relatively less
frequently flooded than the main land diara areas.
For all operational purposes these areas are not
very different from the normal (non- diara) lands.
Main crop is pointed gourd.
Other Classification
1. Riverbed Diara- The land available for cultivation
on both sides of the flowing portion of the riverbed
during non-mansoon season.
2. Riverbank Diara- Strips of land available for
cultivation in between riverbeds and natural levees
or existing embankments.
3. Flood Affected Diara- The lands available for
cultivation adjacent to unprotected reaches.
4. Flood Prone Diara- The area on both sides
beyond the levees or embankments of the river.
Advantages of riverbed cultivation
The advantages of river bed cultivation are
High net returns per unit land area
Early and high yield Ease in irrigation
Low cost of cultivation, highly fertile lands
reduces the external mineral requirements
Limited weed growth
Pest and disease are controlled by cultural
practices, cost effective labour facilities
No land ownership required Income and food
security of landless and marginal farmers
Local adaptation to climate change.
Characteristics of Riverbed soils
The soil in river beds contains mostly sand and
moisture is seeped from the adjacent river. Well-
drained loamy soils are preferred for cucurbit
cultivation. Soil moisture is also important for rapid
growth and it should be at least 10% to 15% above
the wilting point. For early yields lighter soils and for
getting late crop heavier soils are usually used. Sub-
terranean moisture of river streams and alluvial
substrate in sandy river-beds support the growth of
cucurbits. The soils should not crack and should not
be water-logged in summer and rainy season respectively. It should be provided with adequate
organic matter. pH below 5.5 is not suitable for
cucurbits cultivation and most of the cucurbits prefer
a neutral soil pH i.e. between 6.0 and 7.0 is optimum
for cucurbits. Water melon is the only cucurbit which
is slightly salt tolerant and Musk melon is slightly
tolerant to acidic soils. (Patel et al., 2016). For proper
growth and development the optimum temperature
range should be around 18-22°C. For good soil
management firstly level the lands and secondly for
alkali soil application of gypsum and for acid soil there is application of lime in diara lands.
Cultivation
Land Preparation: Riverbed plots are chosen by
Page 4
JOURNAL OF PLANT DEVELOPMENT SCIENCES VOL. 12(4) 191
farmers, with plots perpendicular to the river‟s flow.
After recession of flood during October- November
and the cessation of the south-west monsoon pits or
trenches or channels are prepared.
Systems of planting
Majority of farmers choose the following system of planting depending on personal preferences and
availability of labour. They are –
i. Pit system of planting
ii. Ditch system of planting
Pit system of Planting - For the pit system, pits of
0.5 m diameter are dug 1 m deep and 1 to 3 meters
apart depending on the crops, and planted with
numerous seeds, the feeble of which are thinned out.
Sometimes circular pits with diameter of about 35-
45cm and a depth of 90 cm are prepared.
Ditch system of planting - To manage the
availability of moisture and higher temperature the trenches are dug in North-West direction. To use the
ditch system, a trench 1 m deep is dug along the row,
with 1 to 2 m (cucumber, bitter gourd) or 3 m
(watermelon, bottle gourd, pumpkin) space between
rows. Seeds are planted/spaced 1 m (watermelon,
bottle gourd, and pumpkin) and 0.5 m (cucumber,
bitter gourd) apart in the ditch. The pits/trenches are
filled with organic decomposed waste or oil cakes or
FYM or any other which is mix in the soil.
Seed rate, seed treatment and
sowing/transplanting time Seed rate varies according crops to be grown.
Sowing is usually done for early crop in 1st fortnight
of November and 1st week of December. 1st week of
January is the best time for late sowing. The seeds
are sown in trench at a distance of 45-60 cm and at a
depth of 3 to 4 cm. Two seeds are usually sown at
one place. Pre sprouted seeds are sown for smooth
germination when the temperature is very low. For
this, pre-soak the seeds for 24 hours and place the
moist seeds on a gunny bag and cover them with a
cotton cloth and keep them in a warm place for about
a week for sprouting to start. Sometimes the moistened seeds are wrapped in
gunny bags are left near the fire for quick
germination and in this way sprouting start after 5-6
days. As soon as sprouts emerged outside the seed
coat they are planted. Generally, 3-4 pre-germinated
seeds/hill area sown in pits.
Nutrient management Earlier manures/fertilizers were not used in diara
land cultivation but nowadays farmers are slightly
using fertilizers and manures for proper growth of
the crop. Since this cultivation practice is taken only for one season, so inorganic fertilizers and organic
manures are used in a limited quantity with extra
caution. Well decomposed FYM or compost, caster
cake or groundnut is applied first. To enhance
retentively of moisture in the feeding zone River silt
is generally used. Germinating seeds or growing
transplants are provided with warmth from the
organic manure. At the time of thinning 30-60 g urea
per pit will be useful. After 25-30 days of sowing,
depending on weather conditions and growth,
chemical fertilizers are top dressed in two split doses,
especially fertilizer mixtures or nitrogenous
fertilizers like urea. This top dressing is applied in shallow trenches away from the plants.
Water management The deep root system in cucurbits, enables the plant
to survive in diara land. Pitcher irrigation is given in
the initial stages of germination and growth till the
roots of the plants touch the water regime below the
sand or left as such. Trickle or sprinkler irrigation
system is quite advantageous to avoid leaching losses
of the nutrients in sandy soils.
Weed management Major weeds in diara land areas are Euphorbia hirta,
Polygonum sp., Eclipta prostrata, Fimbristlylis dichotoma, Sida sp. etc. These weeds can be
eradicated manually by pulling, since soil is quite
loosened due to excess sands. Herbicides should be
avoided completely as it may prove to be hazardous
to human, animal and fishes when mixed with
running river water.
Thatch preparation In north-west India, when the winter goes down 1-20
C in Dec-Jan, young plants should be protected from
low temperature and frost in their early stages. The
thatch screen made of locally available material like paddy straw, Saccharam grass or sugarcane leaves
provides protection for the young seedlings.
Grass is spread in the month of February over the
sand as a bedding and mulch, to protect the tender
and young plants and fruits from scorching of heat
sand during summer and also stops the vines to drift
during strong winds. Polyethylene cover as a method
for frost protection is still to be developed. This will
be affordable and will be available easily for
ordinary growers.
Cropping pattern Mixed cropping is usually practiced in riverbeds. Water melon and Musk melon generally go together.
Other cucurbits mainly grown together are summer
squash, bottle gourd, round melon, cucumber, sponge
gourd, bitter gourd, long melon in north India, ridge
gourd in Rajasthan, MP, and UP and pointed gourd
in Bihar.
Harvesting and yield
Harvesting should be done when fruits are quite
tender and edible. Fruits which attain edible maturity
should be harvested at 2-3 days interval, or else, the,
quality deteriorates and fruits are hardened due to seed maturity. By the end of June to end of October
harvesting at regular interval can be done. Table 2
contains the Potential yield of various vegetables.
Harvesting of fruits starts in Feb-March (off-season)
and gives early yield and higher return (Selvakumar,
2014). After harvest, crops are transported to local
market centers for sale.
Page 5
192 BARSHA TRIPATHY, SAMAPIKA DALAI, MEENAKSHI BADU, KALYANI PRADHAN, M. SAI SINDHU,
B. BHAGYAREKHA AND SANDEEP ROUT
Table 2. Crop duration and yield of cucurbitaceous vegetables in diara lands
S.No. Vegetables Seed rate
(kg/ha)
Planting Time Harvesting Time Average Yield
(q/ha)
1 Bottle gourd 3-4 Nov-Dec March-July 200-350
2 Bitter gourd 4-5.5 Feb-March May-July 100-150
3 Pointed gourd - Nov-Dec March-July 350-400
4 Ridge gourd 3.5-5 Apr-May June-July 100-200
5 Sponge gourd 2.5-3.5 Jan-Feb April-May 100-200
6 Cucumber 2.5-3.5 Jan-Feb March-June 225-250
Table 3. Important considerations for Cucurbits harvesting/marketing
Sl.
No
Crops Harvesting Test method Stage of fruit Remark
1 Cucumber 60-70 days after
sowing
Anthesis
duration
Tender green
fruit
Optimum length 20-25
cm (depending upon
variety/consumers
demand)
2 Bitter gourd 55-100 days after
sowing (depending upon variety)
Anthesis
duration
Tender green
fruit
Optimum length 20-25
cm
3 Pointed gourd 80-90 days after
transplanting
Anthesis
duration
Green fruits
having tender
seeds
Optimum length 20-25
cm
4 Ivy gourd Tender immature
fruits
Anthesis
duration
Green fruits
having tender
seeds
Optimum length 20-25
cm
5 Ash gourd 75-125 days after
sowing
Anthesis
duration
Full mature
stage
White wax deposition on
skin
6 Bottle gourd 60-100 days after
sowing,
12-15 days after fruit
setting
Pressing the
skin and little
pubescence
persisting on
the skin Nail
test
Light green
colour
Seed should be soft, if
examined in transverse
section
7 Luffa species 55-60 days after
sowing, 6-7 days after
anthesis
Anthesis
duration
Fruit should
not turn fibrous and
picking should
be done earlier
Picking at 4-5 days
interval
Table 4. Important Diseases and pests in diara land
Diseases
Sl.
No
Name of the
Disease
Causal organism Symptoms Control
1 Powdery mildew Sphaerotheca
fulignea
White fluffy, circular patches
on the under surface of leaves.
At later stages brown surface
with shrivelled leaves appear and lastly defoliation occurs.
Spray diathane M-45 an
early stage and repeated
2 to 3 times.
2 Fusarium wilt Fusarium
oxysporium s.sp.
nivarum
In young seedlings, cotyledons
droop and wither.
In older plants, leaves wilt
suddenly.
Soil dressing by captan
or hexocaptan or thiride
0.2 to 0.3% solution.
Page 6
JOURNAL OF PLANT DEVELOPMENT SCIENCES VOL. 12(4) 193
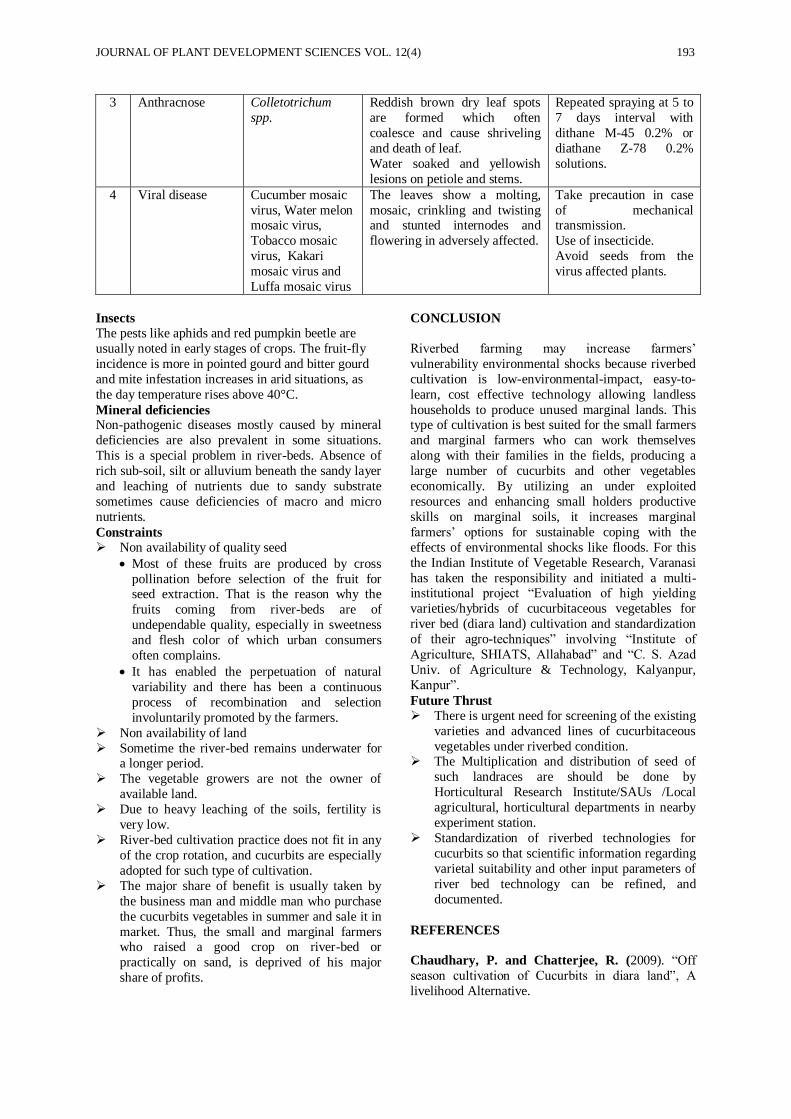
3 Anthracnose Colletotrichum
spp.
Reddish brown dry leaf spots
are formed which often
coalesce and cause shriveling
and death of leaf.
Water soaked and yellowish
lesions on petiole and stems.
Repeated spraying at 5 to
7 days interval with
dithane M-45 0.2% or
diathane Z-78 0.2%
solutions.
4 Viral disease Cucumber mosaic
virus, Water melon mosaic virus,
Tobacco mosaic
virus, Kakari
mosaic virus and
Luffa mosaic virus
The leaves show a molting,
mosaic, crinkling and twisting and stunted internodes and
flowering in adversely affected.
Take precaution in case
of mechanical transmission.
Use of insecticide.
Avoid seeds from the
virus affected plants.
Insects
The pests like aphids and red pumpkin beetle are
usually noted in early stages of crops. The fruit-fly
incidence is more in pointed gourd and bitter gourd
and mite infestation increases in arid situations, as
the day temperature rises above 40°C.
Mineral deficiencies Non-pathogenic diseases mostly caused by mineral
deficiencies are also prevalent in some situations.
This is a special problem in river-beds. Absence of
rich sub-soil, silt or alluvium beneath the sandy layer
and leaching of nutrients due to sandy substrate
sometimes cause deficiencies of macro and micro
nutrients.
Constraints Non availability of quality seed
Most of these fruits are produced by cross
pollination before selection of the fruit for seed extraction. That is the reason why the
fruits coming from river-beds are of
undependable quality, especially in sweetness
and flesh color of which urban consumers
often complains.
It has enabled the perpetuation of natural
variability and there has been a continuous
process of recombination and selection
involuntarily promoted by the farmers.
Non availability of land
Sometime the river-bed remains underwater for a longer period.
The vegetable growers are not the owner of
available land.
Due to heavy leaching of the soils, fertility is
very low.
River-bed cultivation practice does not fit in any
of the crop rotation, and cucurbits are especially
adopted for such type of cultivation.
The major share of benefit is usually taken by
the business man and middle man who purchase
the cucurbits vegetables in summer and sale it in
market. Thus, the small and marginal farmers who raised a good crop on river-bed or
practically on sand, is deprived of his major
share of profits.
CONCLUSION
Riverbed farming may increase farmers‟
vulnerability environmental shocks because riverbed
cultivation is low-environmental-impact, easy-to-
learn, cost effective technology allowing landless
households to produce unused marginal lands. This type of cultivation is best suited for the small farmers
and marginal farmers who can work themselves
along with their families in the fields, producing a
large number of cucurbits and other vegetables
economically. By utilizing an under exploited
resources and enhancing small holders productive
skills on marginal soils, it increases marginal
farmers‟ options for sustainable coping with the
effects of environmental shocks like floods. For this
the Indian Institute of Vegetable Research, Varanasi
has taken the responsibility and initiated a multi-institutional project “Evaluation of high yielding
varieties/hybrids of cucurbitaceous vegetables for
river bed (diara land) cultivation and standardization
of their agro-techniques” involving “Institute of
Agriculture, SHIATS, Allahabad” and “C. S. Azad
Univ. of Agriculture & Technology, Kalyanpur,
Kanpur”.
Future Thrust
There is urgent need for screening of the existing
varieties and advanced lines of cucurbitaceous
vegetables under riverbed condition. The Multiplication and distribution of seed of
such landraces are should be done by
Horticultural Research Institute/SAUs /Local
agricultural, horticultural departments in nearby
experiment station.
Standardization of riverbed technologies for
cucurbits so that scientific information regarding
varietal suitability and other input parameters of
river bed technology can be refined, and
documented.
REFERENCES
Chaudhary, P. and Chatterjee, R. (2009). “Off
season cultivation of Cucurbits in diara land”, A
livelihood Alternative.
Page 7
194 BARSHA TRIPATHY, SAMAPIKA DALAI, MEENAKSHI BADU, KALYANI PRADHAN, M. SAI SINDHU,
B. BHAGYAREKHA AND SANDEEP ROUT
Kumari, Reena, Sharma, Ankita, Bhagta, Shikha
and Kumar, Ramesh (2018). River Bed Cultivation:
A Kind of Vegetable Forcing for Remunerative Returns. Int.J.Curr.Microbiol.App.Sci. 7(04): 359-
365.
Pandey, S. and Karmakar, P. (2014). New
initiative- River bed cultivation of cucurbits,
vegetable newsletter, ICAR-IIVR, Varanasi-221305.
1(1): 2-3.
Pandey, S. and Karmakar, P. (2015). River bed
cultivation of cucurbitaceous vegetable crops, E-
manual on improved production technologies in
vegetable crops. DOE, Ministry of Agriculture &
Cooperation, Government of India, New Delhi,16th -
23rd January. 49- 54.
Patel, H.B., Saravaiya, S.N., Kumar, S. and Patel, A.I. (2016). Riverbed farming. Innovative Farming -
An International Journal of Agriculture 1(3): 106-
107.
Ramjan, Md, Kumar, V. and Chhetri, A. (2018).
Production technology of cucurbits in riverbeds.
Indian farmer. 5(4): 434-438. Selvakumar, R. (2014). A text book of Glaustus
Olericulture. New Vishal Publications. New Delhi.
Singh, P.K. (2012). “Cucurbits Cultivation under
Diara-Land”, Asian Journal of Agriculture and Rural
Development. 2(2): 248-252.
Page 8
*Corresponding Author
________________________________________________ Journal of Plant Development Sciences Vol. 12(4): 195-205. 2020
CHANGES IN THE PHYSICO-CHEMICAL PROPERTIES OF SOIL IN
DIFFERENT DEODARFORESTS OF GARHWAL HIMALAYA
Gaurav Chand Ramola1, Digvijay Rathod
2, Yogesh Kumar*
3, Prajapati Dhaval
4, Akshit
Kukreti5 and V.P. Khanduri
6
1,2,4,5ForestResearch Institute, Dehradun(Uttarakhand)
6College of Forestry, VCSG, UUHF, RanichauriTehriGarhwal(Uttrakhand)
3Ministry of Environment Forest and Climate Change, New Delhi
Received-09.04.2020, Revised-28.04.2020 Abstracts: The present study was undertaken in different deodar temperate forest of Uttrakhand in Garhwal Himalaya, India. The aim of the study was to evaluate the changes in the physico-chemical properties of soils in different deodar forest of Garhwal Himalaya after 15 years as previous study was carried out in 2000 in the same studied sites by Bhatt et al. The
changes in physico-chemical properties of soil were assessed by laying out five 0.1 ha sample plots by recognizing GPS location of the earlier study on each location. The composite soil samples were collected from each sample plot at three different soil depths (0-10 cm, 11-20 cm and 21-30 cm). The standard method was used to analyze the soil sample. To study the Physico-chemical properties of soil various parameter viz. Soil organic carbon %, available phosphorus, available potassium, pH and moisture content % was analyzed. The outcome of the study revealed that the values of soil organic carbon %, available phosphorus, available potassium, pH and moisture content % ranged between 0.24% to 0.68 %, 7.76 to 64.21 kg/ha, 63.5 kg/ha to 406.6 kg/ha, 5.07 to 5.87, 14.72 % to 41.99 % respectively. In the present re-visitation study, the huge changes was seen in the physico-chemical properties of soil mainly in Organic Carbon %, soil pH and moisture content
% as they all decreases due steep topographic condition, slow decomposition rate whereas there was increase in the available Phosphorus. These changes are more likely attributable to the combined effect of growth and use of soil nutrients by the trees in respective sites.
Keywords: Decomposition, Deodar, Garhwal Himalaya, Nutrient changes, Physico-chemical properties
INTRODUCTION
oil is a complex system wherein living soil
organisms belonging to different taxonomic
groups interact at different levels within the
community and plays a significant role in the
maintenance of soil properties (Garbeva et al., 2004, Van et al., 2002). Soil microorganisms constitute a
source and sink for nutrients and are involved in
decomposition of wood, litter, organic matter,
generating organic C, N and energy from these
organic substrates (Ganjegunte et al., 2004, Lindahl
et al., 2007).
Soils in the Himalayan region are very well suited for
high productivity and sustainability. But due to
increased anthropogenic activities like rapid
urbanization and infrastructure development in the
naturally delicate ecosystem with unstable geology,
steep slopes and heavy rains had hastened the degradation process of fertile soil in the Himalayan
region. Many studies confined to agricultural soils
have been performed to determine the ecological and
environmental factors regulating microbial
community structure (Baek and Kim, 2009, Grayston
et al., 2001, Hogberg et al., 2007). Besides, the soil
and vegetation have a complex interrelation because
they develop together over a long period. Soil
analysis shows the forest types and plant density of
any area because the different species of plants need
different types of soils. The selective absorption of nutrient elements by different plant species and their
capacity to return them to the soil brings about
changes in soil properties (Singh et al., 1986).The
properties of the soil are an important factor for the
growth of the plants. Some of these properties
including the percentage of nitrogen, phosphorus,
potassium, soil acidity, soil salinity, and pH affect
vegetation cover in an ecosystem (Zarinkafsh, 1987). Bhatt in 2000 studied five different forests of deodar
at five sites namely Ghimtoli, Dhanolti, Dewarkhal,
Devidhar and Jhandidhar of Garhwal Himalaya to
study the physico-chemical properties of soil. The
present study was also conducted on the same sites
mentioned above by recognizing the GPS location of
the earlier study as the re-visitation study, which was
aimed to understand the changes in the various
physico-chemical characteristics of soil of Cedrus
deodara forests of Garhwal Himalayas over 15 years.
MATERIALS AND METHODS
Five forest stands of Cedrusdeodara in different
parts of Garhwal Himalayas (Lat.290 26‟ to 310 28‟ N
and Longi.770 49‟ to 800 06‟ E) were recognized with
the help of GPS coordinates for identifying the
changes in the physico-chemical properties of soil in
a re-visitation study over 15 years (Fig.1). The earlier
study was made by Bhatt et al. (2000) at these
studied sites. The same sites in the present study
were located with the help of geographic information
as presented in Table 1.
S
RESEARCH ARTICLE
Page 9
196 GAURAV CHAND RAMOLA, DIGVIJAY RATHOD, YOGESH KUMAR, PRAJAPATI DHAVAL, AKSHIT
KUKRETI AND V.P. KHANDURI
Table 1. The geographic information of different studied sites
S.No Locality /District Alt (m) Longitude Latitude
1 Ghimtoli / Rudraprayag 2300 780 15‟ 300 „23
2 Dhanolti / TehriGarhwal 2200 780 52‟ 300 23‟
3 Dewarkhal / Uttarkashi 2300 780 26‟ 390 44‟
4 Devidhar / Rudraprayag 1900 780 15 290 25‟
5 Jhandidhar / Pauri 2000 780 46‟ 300 8‟
METHODOLOGY
To investigate the changes in the physico-chemical
properties of soil in Cedrus deodara forests, five
sample plots of 0.1 ha were laid out on each location.
Thus a total of 25 sample plots were laid out in all
the five locations.
Soil Analysis
Composite soil samples (four samples from four
corners and one from the center of the sample plot)
were taken and later on were mixed-depth-wise like 0-10 cm soil of one corner of sample plot mixed with
0-10 cm soil of other four corners of the same
sample plot and like that other soil samples were
mixed depth-wise). The samples were collected from
three different depths viz., (i) upper (0–10 cm), (ii)
middle (11–20 cm) and (iii) lower (21–30 cm) for
assessing the physical and chemical properties of soil
in all the five selected forest of deodar. The total
number of composite soil samples from the single
site was 15 and total composite soil samples among
all the five sites were 75.
The samples were brought to the laboratory in tightly
closed polythene bags and fresh weight of each
composite sample was recorded. The samples were
air-dried, grinned and passed through 2 mm sieve for
pH, soil moisture content %, organic carbon content, available phosphorus, and exchangeable potassium
by technique shown in Table 2. The soil analysis was
done in the soil science laboratory of New Tehri,
Tehri Garhwal, Uttrakhand.
Table 2. Physico-chemical properties
S.
No. Component Method adopted References
1 Soil pH Standard paste technique using Ec and
pH meters
Rhoades,1982
2 Organic Carbon % Potassium dichromate reduction of
organic carbon and spectrophotometric
measurements
Walkey and Black, 1982
3 Available
phosphorus
Olsen‟s method, Colorimetry Olsen et al. (1954)
4 Available
potassium
Neutral normal NH4OAc, Flame
photometry
Stanford and English (1949)
5 Moisture Content
%
(Fresh weight-Dry Weight) ×100
Dry weight
Misra, 1968.
Calculation of Correlation coefficient Correlation coefficient between Growing stock
versus Organic carbon, Available phosphorus and Available potassium were calculated as per Freese
(1967).
RESULTS AND DISCUSSION
Changes in Physico-chemical properties of soils
under different C. deodara forests of Garhwal
Himalaya:
Changes in Soil Organic Carbonpercentage: The comparison of present soil organic percentage
reported by Bhatt, reveals that over these 15 years, organic carbon percentage decreased in all the
studied sites because of poor understory vegetation
among all the sites which leads to the slow
decomposition of organic matter. A decrease in
organic carbon percentage may also due to slower
microbial activities among all the sites. According to
Bhatt, the average organic carbon % was 1.64 %
(Ghimtoli), 1.47% (Dhanolti), 1.56% (Dewarkhal),
Page 10
JOURNAL OF PLANT DEVELOPMENT SCIENCES VOL. 12(4) 197
2.07 % (Devidhar) and 1.18 % (Jhandidhar), whereas
after 15 years in the same studied sites it was 0.57 %
(Ghimtoli),0.62% (Dhanolti), 0.24% (Dewarkhal),
0.68% (Devidhar) and 0.58% (Jhandidhar).(Table
no.3 and Fig.1).Sharma et al., (2012) while working
on the soil chemical properties in relation to forest composition in moist temperate valley slopes of
Garhwal Himalaya observed 2.29 % organic carbon
in mixed Abiespindrow forest and 4.31 %organic
carbon in Aesculus indica forest typessimilarly.
Digvijay et al., (2015) has worked on biomass and
carbon stocks in different deodar forests of Garhwal
Himalaya. In this study they ranged soil organic
carbon percent in all the sites from 1.42 to 1.70 %, 1.29 to 1.67 % and 1.41 to 1.61 % for 0-15 cm, 16-30
cm and 31- 45 cm soil depth respectively.
Fig. 1. Changes in soil organic carbon percentage over 15 years
The highest soil organic carbon % was obtained
under Devidhar forest and lowest under Dewarkhal
forest. The soil enrichment with soil organic carbon
content in Devidhar could be due to the addition of
litter, thick humus layer and minimum soil organic
carbon % were recorded in Dewarkhal due to poor
understory vegetation and heavy rainfalls recorded in
Uttarkashi region as compared to Rudraprayag
district. This might have a key factor contributing to
decreasing soil organic carbon content, which may
erode the soil surface and removed organic matter-
rich fine sediments from the soil surface.
Table 3. Changes in the soil organic carbon percentage
S.NO LOCALITY SOIL ORGANIC CARBON % IN
2000
SOIL ORGANIC CARBON % IN
2016
RANGE X* SE* RANGE X* SE*
1 GHIMTOLI
A
B
C
1.01-2.25
0.91-
1.86
1.35-
2.10
1.81 1.39
1.73
0.21 0.61
1.73
0.03-1.40 0.03-1.17
0.02-1.31
0.66 0.35
0.71
0.29 0.31
0.28
Average 1.64 0.13 0.57 0.26
2 DHANOLTI
A
B
C
0.62-
2.27
0.49-
2.21
0.41-
2.69
1.35
1.32
1.81
0.31
0.31
0.48
0.27-1.05
0.33-0.90
0.30-1.05
0.21
0.26
0.25
0.06
0.01
0.07
Average 1.47 0.18 0.62 0.12
1.641.46
1.56
2.07
1.18
0.57 0.62
0.24
0.680.58
0
0.5
1
1.5
2
2.5
OR
GA
NIC
CA
RB
ON
%
SITES
2002
2016
2000
Page 11
198 GAURAV CHAND RAMOLA, DIGVIJAY RATHOD, YOGESH KUMAR, PRAJAPATI DHAVAL, AKSHIT
KUKRETI AND V.P. KHANDURI
3 DEWARKHAL
A
B
C
1.07-
2.02
0.61-2.02
1.07-
2.21
1.61
1.35
1.73
0.22
0.25
0.22
0.12-0.44
0.21-0.32
0.05-0.45
0.21
0.26
0.25
0.06
0.01
0.07
Average 1.56 0.18 0.24 0.04
4 DEVIDHAR
A
B
C
0.76-
6.70 0.33-
6.21
0.25-
1.28
3.42
0.66 0.76
1.35
0.20 0.18
0.02-1.44
0.08-1.32 0.02-1.35
0.83
0.43 0.78
0.32
0.23 0.30
Average 2.07 0.90 0.68 0.28
5. JHANDIDHAR
A
B
C
0.49-2.05
0.58-
1.61
0.61-
1.54
1.16 1.09
0.85
0.25 0.19
0.18
0.03-1.35 0.06-1.35
0.20-1.35
0.58 0.80
0.37
0.20 0.29
0.25
Average 1.18 0.22 0.58 0.24
*X=MEAN,SE= STANDARD ERROR
Changes in Soil pH
The present study results showed in Fig.2 , according
to Bhatt, the average soil pH of the same studied sites
was 6.37 (Ghimtoli), 6.43 (Dhanolti), 6.45
(Dewarkhal), 6.16 (Devidhar), and 6.12 (Jhandidhar).
However, after 15 years the soil pH decreased and in
the present study, it was 5.82 (Ghimtoli), 5.07
(Dhanolti), 5.87 (Dewarkhal), 5.64 (Devidhar) and
5.55 (Jhandidhar). The decrease in soil pH over a
period of 15 years clearly depicting that the nature of
conifer forests became acidic in due course of time as a result of podzolozation. (Table no. 4). Gairola et
al., (2012) studied the Conifer mixed broadleaf forest
and Abiespindrow forest in Mandal – chopta,
Chamoli Garhwal region and Khera et al. (2001) for
Quercusleucotrichophora and Q. floribunda forest in
Uttarkashi Garhwal region have also reported acidic
pH values i.e. 5.47 and 5.20. This may be due to
higher organic matter content and protected nature of
forest. Tiwari et al., (2013) studied the Physico-
chemical properties of soils in cool-temperate forests
of the “Nanda Devi Biosphere Reserve” in
Uttarakhand (India). Their study revealed that the
parent material of the study area represents
crystalline rocks and comprises of garnetiferous mica, schists, garnet mica and mica quartzite. The
soil was found acidic in nature, which ranged from
5.09 ± 0.06 to 6.46 ± 0.05 for 0 to 45 cm depth.
Fig. 2. Changes in soil ph over 15 years
6.37 6.43 6.45 6.16 6.12
5.825.07
5.87 5.64 5.55
0
1
2
3
4
5
6
7
SO
IL p
H
SITES
2002
2016
2000
Page 12
JOURNAL OF PLANT DEVELOPMENT SCIENCES VOL. 12(4) 199
Table 4. Changes in the soil ph
S.NO LOCALITY SOIL pH IN 2000 SOIL pH IN 2016
RANGE X* SE* RANGE X* SE*
1 GHIMTOLI
A
B
C
6.2-6.6
6.3-6.5 6.2-6.6
6.38
6.38 6.36
0.07
0.04 0.07
5.30-6.50
5.30-6.80 5.10-5.80
5.88
6.14 5.44
0.19
0.31 0.15
Average 6.37 0.01 5.82 0.21
2 DHANOLTI
A
B
C
6.4-6.5
6.3-6.5
6.4-6.6
6.42
6.42
6.46
0.02
0.02
0.04
4.60-5.30
4.70-5.50
4.60-5.50
4.96
5.14
5.12
0.13
0.16
0.18
Average 6.43 0.01 5.07 0.15
3 DEWARKHAL
A
B
C
6.4-6.5
6.3-6.5
6.4-6.6
6.44
6.44
6.48
0.02
0.04
0.05
5.90-6.62
5.50-6.62
4.90-6.30
6.04
5.80
5.78
0.05
0.15
0.24
Average 6.45 0.01 5.87 0.14
4 DEVIDHAR
A
B
C
5.9-6.2 6.0-6.3
6.1-6.4
6.12 6.12
6.24
0.06 0.06
0.05
4.80-7.30 5.30-6.10
5.50-6.00
5.68 5.50
5.74
0.42 0.15
0.09
Average 6.16 0.04 5.64 0.22
5. JHANDIDHAR
A
B
C
6.0-6.2
5.9-6.1
6.0-6.5
6.12
6.02
6.22
0.04
0.04
0.09
5.30-6.80
4.90-5.80
5.20-5.80
5.92
5.28
5.24
0.27
0.15
0.06
Average 6.12 0.06 5.55 0.16
* X= MEAN, SE= STANDARD ERROR
Table 5. Changes in the soil available phosphorus
S.NO LOCALITY AVAILABLE PHOSPHORUS
(kg/ha) IN 2000
AVAILABLE PHOSPHORUS
(kg/ha) IN 2016
RANGE X* SE* RANGE X* SE*
1 GHIMTOLI
A
B
C
3.95-14.78
3.25-7.88
3.45-11.23
6.59
6.34
7.17
2.07
0.90
2.24
8.96-22.4
8.96-26.88
8.93-17.92
15.23
15.23
15.23
2.28
3.35
1.79
Average 6.70 0.25 15.23 4.49
2 DHANOLTI
A
B
C
13.34-
22.65
13.74-22.65
16.75-
31.52
17.84
19.08
22.43
1.52
1.78
3.18
31.36-
62.72
31.36-67.2 40.32-
76.12
51.07
51.96
49.27
6.43
5.94
6.78
Average 19.75 1.34 50.77 6.38
3 DEWARKHAL
A
B
C
10.44-
13.99
9.46-13.99
4.21-13.99
12.33
10.95
9.86
0.63
0.79
1.59
44.8-85.12
67.2-76.12
49.28-
53.12
71.68
68.18
52.86
7.88
2.60
0.89
Average 11.05 0.71 64.21 3.79
Page 13
200 GAURAV CHAND RAMOLA, DIGVIJAY RATHOD, YOGESH KUMAR, PRAJAPATI DHAVAL, AKSHIT
KUKRETI AND V.P. KHANDURI
4 DEVIDHAR
A
B
C
4.83-10.84
6.00-14.78
7.09-9.26
7.78
9.96
8.36
1.12
9.96
8.36
4.28-22.4
4.48-26.28
4.48-22.04
14.19
18.91
9.85
2.93
4.10
3.29
Average 8.70 0.65 14.28 3.44
5. JHANDIDHAR
A
B
C
6.59-9.85
7.49-11.23
4.83-8.07
8.40
9.30
6.54
0.63
0.69
0.61
4.48-17.92
4.48-13.44
4.48-8.96
9.85
8.06
5.37
2.61
1.67
0.89
Average 8.08 0.81 7.76 1.72
*X= MEAN, SE= STANDARD ERROR
Table 6. Changes in the soil available potassium
S.NO LOCALITY AVAILABLE POTASSIUM
(kg/ha) IN 2000
AVAILABLE POTASSIUM (kg/ha)
IN 2016
RANGE X* SE* RANGE X* SE*
1 GHIMTOLI
A
B
C
116-224
128-172
120-148
167.20
164.40
133.20
22.07
10.48
4.72
54-117
5-135
45.5-153
84.8
78.2
93.7
11.11
26.99
18.72
Average 154.33 10.90 85.57 18.04
2 DHANOLTI
A
B
C
200-320
160-320 148-324
251.20
237.80 230.40
23.81
28.07 30.58
315-396
342-423 333-405
360.8
370.8 354.6
13.16
13.76 13.52
Average 239.80 6.08 362.4 13.48
3 DEWARKHAL
A
B
C
312-452
312-440
312-440
369.60
363.20
384.00
26
25.12
29.26
356-466
324-432
356-423
430.4
392.4
397
20.09
19.42
11.50
Average 372.27 6.15 406.6 17
4 DEVIDHAR
A
B
C
136-288
168-300
132-352
204
215.20
177.80
29.23
24.18
19.87
41-144
27-72
27-90
73.2
48.8
68.5
18.42
8.32
11.53
Average 199 11.08 63.5 12.85
5. JHANDIDHAR
A
B
C
112-342
192-312
124-428
220.40
201.60
276.00
43.21
31.84
64.50
99-153
41-113
41-153
118
77
92
8.96
12.40
18.60
Average 232.67 22.34 95.67 13.66
* X= MEAN, SE= STANDARD ERROR
Table 7. Changes in the moisture content percentage
S.NO LOCALITY MOISTURE % IN 2000 MOISTURE % IN 2016
RANGE X* SE* RANGE X* SE*
1 GHIMTOLI
A
B
C
10.0-31.25
10.0-
31.25
7.96-
27.78
19.25 20.59
15.33
3.68 3.87
3.41
18.68-42.2
20.62-
57.92
23.51-
42.4
33.18 34.08
39.9
4.13 6.15
7.96
Average 18.39 1.58 35.69 6.08
Page 14
JOURNAL OF PLANT DEVELOPMENT SCIENCES VOL. 12(4) 201
2 DHANOLTI
A
B
C
42.86-
83.33
33.33-
75.00
25.00-
66.67
62..86
62.18
43.67
7.32
16.17
8.24
12.94-
84.97
24.71-
44.52
37.47-
54.08
44.59
36.14
45.15
11.52
3.64
3.34
Average 56.24 6.28 41.99 6.16
3 DEWARKHAL
A
B
C
15.00-
56.25
20.00-
71.42
7.14-
33.33
28.25
32.17
18.84
7.24
9.84
4.72
12.94-
21.5
9.91-
57.92
16.41-
42.16
16.83
29.40
27.29
1.54
7.87
4.50
Average 26.42 3.95 24.48 4.63
4 DEVIDHAR
A
B
C
7.96-
40.00
9.09-
25.00
11.11-27.27
17.86
15.68
19.18
5.91
3.03
3.24
8.95-
25.25
4.73-
23.82
5.06-14.07
16.55
16.36
11.25
3.34
7.75
2.07
Average 17.57 1.02 14.72 4.38
5. JHANDIDHAR
A
B
C
10.00-
33.33
9.09-
28.83
8.33-
16.67
24.11
17.14
12.28
4.26
3.51
1.67
7.36-23.3
2.56-
51.56
6.95-
18.39
16.71
21.68
13.85
2.74
8.33
2.25
Average 18.01 3.30 17.41 4.44
*X= MEAN, SE= STANDARD ERROR
Present study reveals that soils were slightly acidic to
buffer in nature on all the 5 sites and the pH values
of these soils ranged from 5.07 to 5.87. It has been
reported that forest soils should be slightly acidic for
nutrient supply to be balanced (Leskiw 1998).
Changes in Available Phosphorus
Bhatt revealed that the maximum average
phosphorus (19.75±1.34 kg/ha) was recorded in the
soils of site-2 (Dhanolti), followed by Dewarkhal
(11.05 kg/ha), Devidhar (8.70 kg/ha), Jhandidhar
(8.08 kg/ha) and minimum average (6.70 kg/h) was
recorded in site-1 (Ghimtoli). After 15 years in a re-
visitation study results showed in figure. 3, the
available average phosphorus was increased in four
similar sites as 15.23 kg/ha in Ghimtoli, followed by
50.77 kg/ha in Dhanolti, 64.21 kg/ha in Dewarkhal,
14.28 kg/ha in Devidhar. However, in the Jhandidhar
site, it declined (7.76 kg/ha) as compared to that of
the previous study of Bhatt in 2000. (Table no. 5).
Bhatt et al. (2014) have studied the physico-chemical
properties of the soil in Central Himalaya and
observed that the available phosphorus is varied
between 16.12 kg/ha in the Oak-mixed conifer forest
and 35.15 Kg/ ha in Pine-Oak forest.
Page 15
202 GAURAV CHAND RAMOLA, DIGVIJAY RATHOD, YOGESH KUMAR, PRAJAPATI DHAVAL, AKSHIT
KUKRETI AND V.P. KHANDURI
Fig. 3. Changes in phosphorus (kg/ha.) over 15 years
Shrestha (1979) has reported the available
Phosphorus range from 1.03 to 71.15 kg/ha in the
specified part of the Godavari hill forest area, Kathmandu. However, Baral (1983) have reported
the available Phosphorus range 44.66 to 90.66 kg/ha
from the same sites.
In the present study, the minimum average
phosphorus (7.76 kg/ha) was recorded in the soils of
site-5 (Jhandidhar) whereas the maximum average
phosphorus (64.21 kg/ha) was recorded in the soils of
site-3 (Dewarkhal). The values of available
Phosphorus in the present study are much higher than
those recorded by some other investigators in similar
and other parts of the Garhwal region of Central Himalaya (Bhatt et al., 2000, Digvijay et al., 2015).
It may be because in low pH, the Phosphorus reacts
with Iron, Aluminium, Calcium and other minerals to
form Iron phosphate, Aluminium phosphate and
Calcium phosphate, which is unavailable to the
plants in higher amount. The Phosphorus was also
found higher in the lower horizons of all the forest
types, which may be due to the leaching properties of
the soils.
Changes in Available Potassium
According to Bhatt, the mean maximum (372.27
kg/ha) potassium was recorded in the soils of site-3
(Dewarkhal) followed by (239.80 kg/ha) Dhanolti,
(232.67 kg/ha) Jhandidhar, (199.00 kg/ha) Devidhar
and (154.93 kg/ha) in Ghimtoli. After 15 years in a re-visitation studyindicated by figure. 4, it is evident
that average potassium increased in Dhanolti (362.4
kg/ha) and Dewarkhal site (406.6 kg/ha), whereas it
decreases in Ghimtoli (85.57 kg/ha), Devidhar (63.5
kg/ha) and Jhandidhar site (95.67 kg/ha).These
changes are more likely attributable to the combined
effect of growth and the use of soil nutrients by the
trees in respective sites. (Table no. 6). Digvijay et
al.,(2015) has worked on biomass and carbon stocks
in different deodar forests of Garhwal Himalaya. In
this study, they ranged soil potassium in all the sites from 84.56 kg/ha to 243.4/ha.
Kaushal et al., (1997) have observed the available K
status of the dry temperate zone of Cedrus deodara
in surface soil from 188.4 - 860.0 kg ha-1 and sub-
surface soils from 67.2 - 710.0 kg ha-1 respectively.
In the present study, the mean maximum (406 kg/ha)
potassium was recorded at site-3 (Dewarkhal) and
mean minimum (63.5 kg/ha) was recorded at site-4
(Devidhar).The reduction in availability of potassium
is due to leaching and drainage, which results in the
destruction of vegetation (Basumatary and Bordoloi,
1992).
6.7
19.75
11.05
8.7
8.0815.23
50.77
64.21
14.28
7.760
10
20
30
40
50
60
70
PH
OS
PH
OR
US
(K
G/H
A)
SITES
2002
2016
2000
Page 16
JOURNAL OF PLANT DEVELOPMENT SCIENCES VOL. 12(4) 203
Fig. 4. Changes in available potassium (kg/ha) over 15 year
Changes in Moisture content Bhatt has also recorded the average moisture content
percentage on same sites i.e. Ghimtoli (18.39±1.58
%), Dhanolti (56.24±6.28), Dewarkhal (26.42±3.95
%), Devidhar (17.57±1.02 %) and Jhandidhar
(18.01±3.30 %) which was within the moderate
range of its availability.
After 15 years, the average moisture content
percentage showed in figure 5. at Ghimtoli
(35.69±6.08) increased, whereas it decreased in other sites like Dhanolti (41.99±6.16), Dewarkhal
(24.48±4.63), Devidhar (14.72±4.48) and Jhandidhar
(17.41±4.44) which may be due to less utilization of
water by plants or may be due to less transpiration
rate. The highest average moisture content (41.99 %)
was recorded on site-2 (Dhanolti) because of more
atmospheric precipitation on this site (Table-no.10).
Fig. 5. Changes in moisture content of soil (%) over 15 years
Bhatt et al., (2014) studied the Analysis of the
physico-chemical properties of the soil and climatic
attribute on vegetation in Central Himalaya in which
forest types were Pine- Oak forest, mixed oak-
conifer forest, mixed broadleaved conifer forest,
conifer forest. According to him the average
moisture content in these forests were 18.8% in pine-
oak forest, 24.66 % in mixed oak-conifer forest,
154.93239.8
372.27
199232.67
85.87
362.40
406.60
63.5095.67
0
50
100
150
200
250
300
350
400
450P
OT
AS
SIU
M (
KG
/HA
)
SITES
2002
2016
18.39
56.24
26.42
17.57 18.01
35.6941.99
24.48
14.72 17.41
0
10
20
30
40
50
60
MO
IST
UR
E C
ON
TE
NT
%
SITES
2002
2016
2000
Page 17
204 GAURAV CHAND RAMOLA, DIGVIJAY RATHOD, YOGESH KUMAR, PRAJAPATI DHAVAL, AKSHIT
KUKRETI AND V.P. KHANDURI
26.33 % in mixed broadleaved conifer forest and
20.5 % in a conifer forest.
The average moisture contents on three study sites i.e., Dewarkhal (24.48 %), Devidhar (14.72 %) and
Jhandidhar (17.41 %) although found within the
moderate range of its availability which was
significantly higher (average 35.59 % and 41.99 %)
on site-1 (Ghimtoli) and site-2 (Dhanolti). An
increase in the retention of soil moisture through the
incorporation of humus has been reported by Biswas
and Ali (1969).
CONCLUSION
The present study revealed important results over a
long period in changesof physicochemical properties.
It will help all the scientific community, researches
and forester to understand the changes in soil over a
long period. The present study will be a key factor to
manage and maintain for the deteriorating plant
growing media to improving its fertility and
productivity per hectare.
REFERENCES
Baek, K. and Kim, H.S. (2009).Microbial
community structure in hexadecane- and
naphthalene-enriched gas station soil. Journal of
microbiology and biotechnology, 19(7):651–657.
Basumatary, A. and Bordoloi, P.K. (1992).Forms
of potassium in some soils of Assam in relation to
soil properties. J Indian Soc Soil Sci. 40 (3) :443–446
Beer, C.,Lucht, W., Schmullius, C. and
Shvidenko, A.(2006).Small Net Carbon Dioxide
Uptake by Russian Forests during 1981-
1999.Geophysical Research Letters, 33, Article ID:
L15403 Beral, S. R. (1983).Soil nutrients under different
trees of Phulchoki hill. M.Sc. Thesis.
CentralDepartment of Botany, Tribhu.Uni.
Kathmandu, Nepal.
Bhatt, A., Sharma, C.M. and Khanduri, V.P.
(2000).Growing stock variation in different
Cedrusdeodara forests of Garhwal, Himalaya. Indian
forester.218 (8): 903 – 916.
Bhatt, P.V., Mehta, P.J. and
Shresthamaniz(2014).Analysis of the physico-
chemical properties of the soil and climatic attribute on vegetation in Central Himalay.J Nature and
Science.12:11.
Biswas, T.D. and Ali, M.H. (1969). Review of soil
research in India. Indian J. agric. Sci. 39: 618.
Cain, S.A. (1950).Life forms and phtoclimate.Bot. Rev.,
16: 1-032.
Carvalhais, N., Reichstein, M.,Ciais, P.,Collatz, G.
J., Mahecha, M. D. andMontagnani, L.
(2010).Identification of Vegetation and Soil Carbon
Pools Out of Equilibrium in a Process Model via
Eddy Covariance and Biometric Constraints. Global
Change Biology: 16:2813-2829
Digvijay, R.,Dhanai, C.S. and Khanduri, V.P.
(2015).Variation in volume, biomass and carbon
stocks in different deodar forests of Garhwal Himalaya. M.Sc. Thesis.
Gairola, S., Sharma, C.M.,Ghildiyal, S.K. and
Suryal, S. (2012).Chemical properties of soils in
relation to forest composition in moist temperate
valley slopes of Garhwal Himalaya,
India.Environmentalist.DOI 10.1007/s10669-012-
9420-7.
Ganjegunte, G.K., Condron, L.M., Clinton, P.W.,
Davis, M.R. andMahieu, N. (2004).Decomposition
and nutrient release from radiatapine(Pinusradiata)
coarse woody debris. Forest Ecology and Management, 187:197–211
Garbeva, P., Van Veen, J.A. and Van Elsas, J.D.
(2004). Microbial diversity in soil:selection
microbial populations by plant and soil type and
implications for disease suppressiveness. Annual
review of phytopathology, 42:243–270.
Grayston, S.J., Griffith, G.S., Mawdsley, J.L.,
Campbell, C.D. and Bardgett, R.D.
(2001).Accounting for variability in soil microbial
communities of temperate upland grassland
ecosystems.Soil Biology and Biochemistry, 33(4-5):533–551.
Häme, T.,Salli, A. and Lahti, K. (1992).Estimation
of Carbon Storage in Boreal Forests Using Remote
Sensing Data. In M.Kanninen, & P. Anttila (Eds.),
Pilot Study (pp. 250-255). The Finnish Research
Program on Climate Change, Progress Report.
Helsinki, Finland: Academy of Finland
Houghton, R.A. (1999). The U.S. Carbon Budget:
Contributions from Land-Use Change. Science,
285(5427):574–578.
Kaushal, R.,Bhandhari, A.R., Sharma, J.C. and
Tripathi, D. (1997).Soil fertility status under natural deodar (Cedrusdeodara) forest ecosystem of North-
West Himalayas.Indian J. Forestry.20(2): 105-111.
Khera,N., Kumar, A., Ram, J. and Tewari, A.
(2001).Plant biodiversity assessment in relation to
disturbances in mid-elevational forest of Central
Himalaya, India. Trop Ecol. 42(1):83–95.
Leskiw, L.A. (1998). Land capability classification
for forest ecosystem in the soil stands region. Algeria
Environmental Protection, Edmonton. Alberta.
Report ESD/ LM/ 98-1.
Lindahl, B.D., Ihrmark, K., Boberg, J.,
Trumbore, S.E., Högberg, P., Stenlid, J. and
Finlay, R.D. (2007).Spatial separation of litter
decomposition and mycorrhizal nitrogen uptake in a
boreal forest.The New phytologist, 173(3):611–620.
Misra, R. R. (1968).Ecology work book. Oxford and
I.B.H. publication.NewDelhi.pp 224.
Olsen, S.R., Cole, C.V., Watanabe, F.S. and Dean,
L.A. (1954).Estimation of available phosphorus in
soils by extraction with Sodium bicarbonate.
Department of Agriculture Circular, US. p 939.
Page 18
JOURNAL OF PLANT DEVELOPMENT SCIENCES VOL. 12(4) 205
Rhoades, J.D. (1982). Soluble Salts.In A.L. Page et
al. (ed.) Methods of soil analysis. Part 2. Agronomy
9: 167-l78.
Sharma, C.M.,Gairola, S.,Baduni, N.P.,Ghildiyal,
S.K. and Suyal, S. (2011). Variation in carbon
stocks on different slope aspects in seven major forest types of temperate region of Garhwal
Himalaya, India. J.Biosci. 36 (4): 701-708.
Shrestha, P. (1979).The Vegetational analysis of a
specified part of Godavari hill forest
area,Kathmandu.M.Sc. Thesis, Central Department
of Botany, Tribhu.Uni. Kathmandu, Nepal.
Singh, A.K., Parsad, A, Singh, B.
(1986).Availability of phosphorus and potassium and
its relationship with physico-chemical properties of
some forest soils of Pali-range (Shahodol, M.P.).
Indian For,112(12):1094–1104.
Somogyi, Z.,Teobaldelli, M.,Federici,
S.,Matteucci, G.,Pagliar, V. and Grassi, G.
(2008).Allometric biomass and carbon factors
database.iForest. 1: 107-113.
Stanford, S. and L. English(1949).Use of flame
photometer in rapid soil tests of K and Ca. Agron. J.
4: 446-447.
Tiwari, S.D., Joshi, R. and Rawat, A.
(2013).Physico-chemical properties of soils in cool -
temperate forests of the “Nanda Devi Biosphere Reserve” in Uttarakhand (India).J. Ecol. Nat.
Environ. 5(6): 109-118.
Van Elsas, J. D., Garbeva, P. and Salles, J.
(2002).Effects of agronomical measures on the
microbial diversity of soils as related to the
suppression of soil-borne plant pathogens.
Biodegradation,13(1):29–40.
Walkley, A. and Black,T.A. (1982).An examination
of the wet acid method for determining soil organic
matter and proposed modification of the chromic
acid titration method.Soil Sci. 37: 29-38.
Williams, M., Schwarz, P.A., Law, B.E., Irvine, J. and Kurpius, M. R. (2005).An Improved Analysis
of Forest Carbon Dynamics Using Data
Assimilation.Global Change Biology.11:89-105.
Zarinkafsh, M. (1987).Applied Pedology.Tehran
University.
Page 19
206 GAURAV CHAND RAMOLA, DIGVIJAY RATHOD, YOGESH KUMAR, PRAJAPATI DHAVAL, AKSHIT
KUKRETI AND V.P. KHANDURI
Page 20
*Corresponding Author
________________________________________________ Journal of Plant Development Sciences Vol. 12(4): 207-214. 2020
COLLECTION OF MEDICINAL PLANTS IN TRADITIONAL AND MODERN
PERSPECTIVE
Vinay M. Raole*1 and Vaidehi V. Raole
2
1Department of Botany, Faculty of Science, The Maharaja Sayajirao University of Baroda,
Vadodara, Gujarat, India
2Department of Sharir Kriya, Parul Institute of Ayurveda, Parul University, Limda,
Waghodia Vadodara
Email: [email protected] ; [email protected]
Received-04.04.2020, Revised-25.04.2020
Abstract: In the recent past surveys of medicinal plants and plant products all over the globe is increased. Use of medicinal plants and its products is going on since the beginning of human civilization. Traditional knowledge is very important for sustainability of natural wealth including medicinal plants. Medicinal plants form the major natural resources base of the Indian indigenous health care tradition. Conservation of these plants can be learnt from specific local knowledge and transmission of facts, skills and strategies, concern for well-being of future generations. Due to global popularity of Ayurveda
there is enhanced demand of herbal drugs which is exerting enormous pressure on natural assets. Healing plants form the major natural resources base of the Indian indigenous health care system. In the medicinal plants, the secondary metabolites or active principle are made available through biosynthetic pathway and proper harvesting techniques. The science behind ancient Ayurvedic harvesting techniques was narrated in various earlier treaties and commentaries. To achieve good therapeutic result it is mandatory to collect the drug plants in a modern collection procedure and is also proven by modern scientific methods. In Ayurvedic literature, drug collection has been mentioned according to different parts of the plant in respective seasons and basis of therapeutic uses. According to modern botanical and pharmaceutical science, drugs possess highest prospects during its collection period. The soil condition, climatic factors, temperature, rain fall, duration of light
exposure, altitude, collection from wild area, and methods of collection, processing and storage have impact on the secondary metabolites of the plant ultimately which affect the therapeutic efficiency of the drug. General guidelines for drug plants, plant parts as per botanical field collection, safety issues and recommendations for collection practices, and future scope of procedure has been given.
Keywords: Ayurvedic, Medicinal plants, Modern, Traditional
INTRODUCTION
an since time immortal, has constantly
struggled to achieve mastery over the very
many forces of the nature, and plants has all the time
helped us to reach the goal. Nature provided man with
all the basic requirements for his existence which is
one of the reasons why nature was respected in the form of mother. The early civilizations have always
valued nature and nature worship was common in
those times. After coming in contact with plants,
people began to realize their significance and how
they could be of great benefit to them. There are also
some evidences relating to nature worship in the
Indian subcontinent around 3000 BC as well as
admiration for nature as a source of medicine.
Conventional therapeutic systems of India employ
large numbers of plant species viz., Ayurveda (2000
spp.), Siddha (1121 spp.), Unani (751 spp.) and Tibetan (337 spp.) (Anonymous, 2004 a, b).
Aforesaid long-established medical systems are
generally based on the exploitation of available
natural and local products which are commonly
related to the people's perspective on the world and
life (Toledo et al., 2009).
India as a nation has different traditional culture,
distributed throughout, and follows different custom
and systems of medicine. It also harbours a rich
variety of floral and faunal diversity. The peninsular
region is well known for rich Ethnobotanical wealth
in traditional knowledge particularly medicinal plants
since ancient time. Furthermore, it might have started
with ancient myths, lores and beliefs in addition to
other occult practices and developed into folk
medicine which advanced into herbal medicinal
practices viz. Ayurveda and siddha etc. Ancient Unani manuscripts, Egyptian papyrus and Chinese writings
have also described the use of herbs in their medicinal
texts. After prolonged time, these traditional systems
of green medicine are coming back to centre stage of
our health care and hygiene (Balasubramanian, 2000).
Moreover, demand for these medicines and systems
have started gaining the respectability among the
scientific society all over the globe despite the
development of synthetic drugs, and demand for plant
based medicines is growing. The main rationale for
this growing drift is increasing public concerns about the adverse effects of synthetic medicines. Traditional
medicine and Ethnobotany are two important subjects
that should be noted to achieve effective herbal
medicines with considerable therapeutic effects.
Conventional medicine is based on experience of
citizens over centuries and ethno-botany is based on
recognition of the indigenous plants prevailing in the
vicinity of the human habitat. Natural products have
been the backbone of traditional system of healing
M
RESEARCH ARTICLE
Page 21
208 VINAY M. RAOLE AND VAIDEHI V. RAOLE
throughout the globe, and have also been an integral
part of history and culture ((Shankar et al., 2000).
Ayurveda is more than the experience with the nature
as it is nothing but the knowledge of life. Ayurveda
(drug school) a supplement of Atharvaveda (charm
school) which we can notice an admixture of drug school and charm school is used in concept of drug.
And, the drug concept in Ayurveda is totally different
from modern school of medicine. As modern
medicine heavily based on principles of physical
sciences only, while Ayurveda includes physical,
living and conscious phenomenon also. The term
drug is derived from the French word „drogue‟ i.e.
dry/dried herb. It is defined as „any substance or
product used to modify and/or explore the
physiological systems or pathological states for the
benefit of the recipient‟. In terms of Ayurveda drug is
a ‘bhesaja’ or ‘aushadha’ which will overcome the disease or fear of disease. Although, in Ayurveda 3
types of drugs Audbhida, Jangama and Parthiva
derived from plants, animals and minerals includes
salts respectively (Sinha, 1984; Majumdar, 1989).
The link between available phytodiversity and
medicine was appreciated early in India. Caraka
Samhita, mentions that the remedies for the diseases
prevalent in a given region can be found in the herbs
growing naturally in that region. Folk medicines are
widely practiced for primary healthcare, underlying
factors such as economy, education, religion, culture, and environment. The local society and herbalist
primarily use different Barks, Roots, Rhizomes,
Leaves, Flowers, Fruits, Seeds, Herbs or other
common items available in and around their
homestead, collected from their vicinity and even
from remote hills/forests, as well as grown through
cultivation (Sivarajan and Balalchandran, 1999). In
some cases, they also perform rituals based on faiths,
and recite holy verses (mantras). Three factors which
legitimize the role of the folk healers include: their
own beliefs, the beliefs of the community and the
success of their actions. Nearly half of rural community members present in this universe have
superstitions and strong beliefs on herbs and
approximately 15%- 25% treats simple ailments with
herbs. They mostly use different plant as a whole in
diverse forms and simple extracts or polyherbal
formulation for different diseases for cure. These
systems are still in place today because of their
organizational strengths, and they focus primarily on
multicomponent mixtures (Bannerman et al, 1983).
India, seventh largest country of the world covering
total area of 32,87,263 square Kilometers, ranks 6 among the 12 mega biodiversity centres of the world
and home for 4 main hotspots. The Indian homeland
is divided into 10 bio-geographical zones and 25
provinces and also has 15 agroclimatic zones and
17,000–18,000 species of flowering plants of which
6000–7000 are estimated to have medicinal usage in
folk and documented systems of medicines. Our
nation has a wide range of medical experiences due to
historical precedent and diversity of race, religion,
ethnicity, language, and climate. The herbal
medicines are considered to be of great importance
especially, for tribal populations and residents settled
in the treacherous part of the land. On the other hand,
climatic and environmental variability between regions leads to growth of different types of plant
species rather large diversity. In recent years owing to
habitat destruction and indefensible harvesting of
natural phyto-resources including medicinal plants
pose a serious threat not only to biodiversity but,
even to native medicinal resources in India because of
progressively loss of forest cover in every region
(Mukherjee et al. 2013)
METHODOLOGY
Ayurveda classical texts and their commentaries,
various available compendia and translations,
lexicons, literature on collection and cultivation
methods as well as on modern plant inventory
methods have been referred. Some of the harvesting
practices and research publications related to
documentation and inventorization of forest wealth
for research data also taken into account. Main
emphasis has been about these collection techniques
and its utility for collecting medicinal plants are
considered while compiling the information
(Anonymous 1948-1976; Anonymous 2005).
Plant Diversity and Ayurvedic Medicinal Plant
Collection
Plants are used as a medicines in the treatment of
various diseases in civilised society since times gone
by. Most of the medicinal plant species used in trade
is always carrying on to be sourced from natural
forest and most of these are harvested by destructive
means leading to rapidly decreasing in the vicinity.
Ongoing dilapidation of ecosystem through ruthless
exploitation of natural resources and inconsistent
collection practices, collection of the drug plants with
high therapeutic activity is declining. This is quite
true with respect to medicinal plants whose roots are
collected and used for very many herbal formulations.
The naturally synthesised phytocompounds are
having better patient tolerance and acceptance.
Approximately 30,000-70,000 plant species all
around the globe have been screened for their
medicinal properties and used by aboriginals. Plants
have provided us with some of our most effective
drugs, including aspirin, made from willow bark.
Moreover, at least 7,000 medical compounds in the
modern pharmacopoeia are derived from plants. And,
these plants in particular those with ethno
pharmacological uses have been the major starting
place of medicine in the early drug discovery.
Fabricant and Farnsworth, (2001) reported that, 80%
Page 22
JOURNAL OF PLANT DEVELOPMENT SCIENCES VOL. 12(4) 209
of 122 plant derived drugs were related to their
original ethno pharmacological purposes used by
indigenous people. Current drug discovery from
plants mainly relied on bioactivity guided principle as
well as fractionation and led to isolation of many
important anticancer drugs. Nearly two thirds of
traditional medicinal plants are as effective as medical
drugs but it is still difficult to get proper sound advice
due to variability of quality of these drugs as an
individual or in polyherbal formulations. Medical
pluralism has led to an intrinsic feature of its medical
system in historical and contemporary contexts.
Acharya Charaka described the technical excellence
in the field of medicinal plants pharmacognostical,
pharmaceutical and therapeutic sciences as
“Tasyapium pariksha idam evam Prakruti” etc. Here
“evam rutu” the season for collection of drug plays an
important role in the field of drug research. Shankar et
al., (2000) explained about both siddha and unani
systems were enriched by and in turn contributed to
the enrichment of Ayurveda. While the Vedic texts
written between c. 1500-1000 B.C. list only 289
medicinal plants, this number increased to around 650
in Caraka and Susruta Samhitas composed around
500 A.D., and further to about 1800 in various
„Nighantus‟ (ayurveda texts) that were compiled
between 500 and 1900 A.D. (Shankar et al., 2000). In
Ayurvedic classics, Charak samhita, sushrut samhita,
bhavaprakasha, Raj nighantu etc. drug collection has
been described in four major steps i.e. (( Table 1 & 2)
Bhumi pariksha (Selection of land), Medicinal plant
materials should be collected from the appropriate
place, and during the appropriate season or time
period to ensure the best possible quality of both
source materials and finished products. The soil
which is unctuous, smooth, blackish-white or reddish
in colour, nearer to water sources ,tight(non fragile),
devoid of big stones, ditch, excessive water, gravels,
sand particles, valmika (ant hills) is recommended
best for finding best quality medicinal herb as a
whole and for the collection of raw materials in the
part of medicinal shrubs or trees.
Therefore, one should have the basic knowledge of
the soil types from which drug plant is going to be
collected. This soil texture is also based on the
availability of water at that particular region. Three
main types of soil classes have been given; Jangal
desha, Aanoop desha and Sadharan desha repectively.
Over and above, on the basis of five fundmental
elements (Panchmahabhootas) soil is further sub
divided into parthiv, jaliya, aagneya, vayaneeya and
aakashiya. Furthermore, on the basis of other
characters it is termed as prashasta and aprahsasta
bhoomi i e. Nonpolluted and polluted soil. ( Table 3)
Sangrahaniya dravyas (Selection of drug), It is well
known that the quantitative concentration of
biologically active constituent‟s i.e. veerya of a drug,
varies with the stage of plant growth, its stage of
development and place of its occurrence this includes
sheetveerdravya and ushanveerdravya which varies
according to phytoconstituetns. The best time for
collection should be determined according to the
quality and quantity of biologically active constituents
rather than the total vegetative yield of the targeted
medicinal plant parts. For herbs we should look into
some of the following characteristics (Charak and
Sushruta samhita).
It should not be affected by smoke, rain, air or
water.
It should be collected in respective seasons, from
prasastabhumi which should be free from pests,
poisonous weapon, severe sunlight, high breeze,
fire, excessive moisture and any kind of disease.
It should not be collected from road sides, should
be well developed and deeply rooted in the soil,
must have a single predominant taste in it with its
natural odor, color and taste.
It should be new and must be used within one
year of its collection from field and must be
collected from eastern and northern side for
therapeutic utility.
Sangrahaniya Vidhi (Method of collection) to procure
best qualities of drug the proper place of collection,
part, method and time for collection are most
important. Charaka prescribes certain instructions
regarding mode of collection. They include
performance of auspicious rituals and practices,
taking of sacred bath to become mentally and
physically clean, wearing sacred dress, worshipping
of gods including Ashwinikumar‟s and the sacred
cow, performance of religious fast overnight etc. In
addition to the collector should collect the raw
material plant or plant part mainly from east or north
direction according to part-used, season of collection
and its potency, in a specific manner.
Sangrahaniya Kala (Time for collection).
Sangrahakala of various medicinal plants and plant
organs in different seasons give you an idea about a
systematic scientific reason of transportation of
synthesised secondary metabolites from one part to
another part of the plant to live fit in that particular
ecological condition. While, collecting the medicinal
plants in nature certain factors such as Guna, Desha,
Kala, Pakva-apakva avastha, Navpurana avastha,
Prayojyanga, Karma and Disha should also be given
importance.
Page 23
210 VINAY M. RAOLE AND VAIDEHI V. RAOLE
Table 1. Season and collection period According to 3 main Ayurveda samhitas
Part used Season
Charaka Sushruta Raj nighantu
Whole plant - - Late autumn
Roots Summers and winter Summer and monsoon Late winter
Tubers and rhizomes - Early winter
Branches and Leaves
Tender Leaves
Autumn and spring Monsoon and early
Winter
Late winter
late summer
Stem bark and latex Autumn and winter Late autumn and early
Winter
-
Heart wood and sap wood Early winter Spring -
Flowers and inflorescence According to season - Spring
Fruits and seeds (mature) According to season Summer -
Modern Collection Technique
On the subject of huge diversity and distribution of
medicinal plants in India, botanical research and
collection of data obtained from other researches can
provides a good recognition of this great treasure for
us and future generation. Botanical studies of a
neighbouring region not only are of an educational
value, but they are also the source of information for
students on diversity of nature and a necessity for
protection of the province they reside in. Going
outdoors, visiting nearby and farther surroundings,
pupils together with their teachers, can observe the
morphological properties record and collect plants
including medicinal plants. It gives an input for
analyzing and describing plant species present in the
community and vegetation of the nearby region which
always forms basic source of number of medicinal
plants.
Table 2. Collection schedule of medicinal plant and plant parts according to Rutus (Seasons)
Part used Rutus (Season)
Charaka Sushruta Raj nighantu
Whole plant - - Sharad
Roots Grishama, Shishira - Shishira
Tubers and rhizomes Sharad - Hemant
Branches
Varsha, vasant - -
Leaves Varsha, vasant Varsha Shishira
Tender Leaves Varsha, vasant Grishama,
Stem bark Sharad Sharad -
Latex Sharad Hemant -
Heart wood and sap wood Hemant Vansnat -
Flowers and inflorescence As per rutu - Vasant
Fruits As per rutu
Seeds - - -
Table 3. Collection of medicinal plant and vegetation based on traditional soil types
Mahabhuta (Elemental composition)
Soil nature Colour Vegetation
Prithvi Pebbly Dark blue or black Rich vegetation
Jala Unctous, cool White Grass
Agni Stony Multicolour Small sized tree
Vayu Rough Grey Small trees
Akash Soft No colour Trees of no value
Page 24
JOURNAL OF PLANT DEVELOPMENT SCIENCES VOL. 12(4) 211
In order to gain proper knowledge of medicinal plants
we should have the information on the flora and the
vegetation of a particular or certain region. It is
necessary to carry both, field and laboratory studies.
Field studies encompass, first of all, listing/registering
and collecting of the plant material, as well as, identification and description of plant communities
that are made of that plant material. The collected
material is prepared in laboratories for preservation
and a further utilization for stereoscopic and
microscopic analyses if any for proper identification.
The field investigations can also include different
microclimatic measurements (solar radiation, solar
light, air and soil temperatures, air humidity,
evaporation, etc.) that provide data on a habitat
conditions under which living creatures live i e.
abiotic and biotic factors prevailing in the area. By
and large, considerable importance is given for the season during collection of different parts of
economical plants as it governs not only the total
quantity of active constituents produced but also the
relative proportions of the components of the active
mixture.
Presently plant collections methods always suggest
looking for the morphologically best specimen from
that particular habitat and ecological niche. Mostly we
have to select vigorous, typical specimens for
identification and after confirmation of particular
medicinal species we can go for bulk collection. By and large, non destructive system of the plant
collection should be employed. Specimens should be
representative of the population, but should include
the range of morpho-variation of the plant species.
Dioecious plant species should be represented by both
sexes in the collection. Roots, bulbs, and other
underground parts should be carefully dug up, and the
soil removed with care if it is useful for proper
identification such as Cyperaceae and Araceae
members. In collecting large herbs, shrubs and trees,
different types of foliage, flowers and fruits should be
collected from the same plant. Collect sufficient material to prepare the herbarium sheet and still leave
enough room for the labelling and field notes. This
will be useful for authentification of the plant species
and will require during the use as well as research
purpose. Moreover, if we are going to collect the
whole population then avoid insect or pathogen
damaged plants and plant parts of pharmacological
interest. These will vary widely from species to
species and the area from which we are going to
collect the raw material according to necessity.
While, collecting whole plant we have to follow above procedure. Leafy drug plants which are
discoloured or attacked by insects or strike must be
rejected as it has the main quality of the medicinally
important phytochemicals. At the same time, we have
to keep away the leaves covered with rain or dew
drops (Annonymous, 2005).
Season of collection: The season and time at which
each drug is collected is usually a matter of
consideration, since the amount and sometimes nature
of active constituents varies throughout the year.
There is increasing evidence that composition of
number of secondary plant metabolites varies
appreciably throughout day and night. e.g., Rhubarb
(Rheum emodi) has maximum Anthraquinone in summer season which is an active constituent of this
plant while same constituent is minimum or absent if
one collect the drug in winter. Likewise, the amount
of glycoside present in the leaves of Digitalis
purpurea remains at its highest level only in the day
time, it breaks down in the night. So, the leaves of
Digitalis should be collected in the day time and
rhubarb should be collected in summer for desired
action.
Collection period: The best period for collection of
herbaceous species is during September -November,
but in August-October in the area above 3000m., as, snowfall starts from November. In evergreen forest
the best period for collection of trees and shrubs is
March-May, as most of the species are in flowering
condition during this period, while in deciduous forest
the collection should be avoided in winter season
because falling of leaves is common during this
season.
Stage of plant: It is also observed that the quality and
quantity of chemical constituents varies according to
stage/growth of plant. Therefore, it is very essential to
know the optimum stage of the plant parts/plant for collection of right material for getting best therapeutic
effects. It is generally suggested to collect the leaves
just before flowering, flowers when fully opened, and
rhizome and root when aerial parts are matured.
Herbage: The aerial or top parts of the plant are
collected with flower or fruit bearing stem. In case of
herbage, seasonal studies must be conducted to
pinpoint the period when optimum active principles
are present in the plant. The care should be taken
during the collection that the mature branches of the
stem must be harvested and never remove all the
branches of the plant. Care should be taken to exclude vegetable debris as far as possible.
Roots: Roots of annuals are usually not collected but
in case where the whole plant is used, the roots of an
annual plant along with aerial part of the plant are
collected. At the same time, while collecting roots of
trees and bushes, the main roots should not be cut or
dug up, and moreover, severing the tap root of trees
and bushes should be avoided. Only some of the
lateral roots should be located and collected. The
biennials and perennials are generally collected in
autumn of the first year growth or in spring before the beginning of the second year growth. This is because
the roots are storage organ for the plant and
accumulate active principles during the summer.
However, there are some exceptions also viz. the root
of Withania somnifera are normally collected when
the plants are 6-8 months old. Likewise the roots of
Saussurea lappa, Innula racemosa, Glycirrhizia
glabra should be collected when the plants are of 3-5
Page 25
212 VINAY M. RAOLE AND VAIDEHI V. RAOLE
years old. Moreover, seasonal variation is recorded in
overall various active biomolecules content, as well as
variation among different phytochemicals present
their in. This is an exceedingly valuable finding if
roots are being grown for individual compounds or if
manufactured products are harvested at different times and standardized to a specific compound that
varies from month to month, week to week, or even
day to day.
Stem and bark: It is collected either in spring when
the trees and shrubs begin to bud or in autumn after
they have shed their leaves. This is the time of year
when the flow of sap is at its maximum and bark
radially detach from the wood. However, the
collection time of every individual plant or part of the
plant differs depending upon the climate and altitude.
The bark should be collected from the branches
instead of main trunk and do not peel whole bark of the plant. It is also important to strip the bark
longitudinally and not all over the circumference to
the trunk/ branches. Bark and wood samples are often
desirable additions when collecting woody plants.
There are special requirements for the identification
of some plants; e.g. Eucalyptus specimen, should
must include mature leaves, juvenile leaves, buds,
fruits, and bark wherever possible.
When collecting species whose bark is the main
material to be used, the tree should not be girdled or
completely stripped of its bark, it will result into death of that plant. So longitudinal strips of stem bark along
one side of the tree should be cut and collected. Bark
is usually collected after a period of damp weather.
Collection of gums, gum resins etc. should be made in
dry weather.
Leaves: They are collected throughout the whole
growing period. The leaves show that loss on drying
is minimum when they are fully grown. When
majority of leaves dries up and new leaves are
coming. Young leaves, however, contain highest
quality of active principle, but they must be free from
diseases, insect etc. This indicates that new leaves have more tendencies to absorb more moisture
helping in proper storage of the drug. Leaves, flowers
and fruits should not be collected when covered with
dew or rain. Care should be taken to exclude
vegetable debris as far as possible.
Tubers/bulb: These should be collected during
flowering period because this aid in identification of
the species. It is notable that the deep digging is
avoided during the collection of underground parts.
Underground parts must be freed from soil to
minimise the microbial contamination. Flower: Flowers or whole inflorescences are gathered
at the start of the flowering period and leave some
floral parts on the plants to facilitate natural
regeneration.
Fruits and the seeds: Fruits and the seeds are
collected when they are fully matured. In the case of
cultivated crops which are harvested by machine, this
is done just before they are fully ripe so that fruits do
not crumble or the seeds fallout in the field.
Medicinal Property of the Plants
The beneficial medicinal effects of plant materials
typically result from the combinations of secondary
products present in the plant. That the medicinal actions of plants are unique to particular plant species
or groups is consistent with this concept as the
combinations of secondary products in a particular
plant are often taxonomically distinct (Wink, 1999).
These secondary products defined as biochemicals
which do not have any vital biochemical role in
maintaining plant cells. But, these chemicals play an
important role in ecophysiology of plants such as
defensive role against herbivory, pathogen attack, and
inter-plant competition. In addition they play
attractant role toward beneficial organisms such as
pollinators or symbionts (Kaufman et al., 1999; Wink and Schimmer, 1999). Plant secondary products also
have protective actions in relation to abiotic stresses
exerted on the plants. Secondary metabolites involved
in plant defense toward microbial pathogens proved
useful as antimicrobial medicines in humans.
Likewise, defence against herbivores through
neurotoxin activity may have beneficial effects in
humans through their action on the central nervous
system. To promote the ecological survival of plants,
secondary products can be affecting the physiological
functions in competing microorganisms, plants, and animals (Wink and Schimmer, 1999). Over and
above, some plant metabolites may have beneficial
medicinal effects on humans due to similarities in
their potential target sites (e.g. central nervous
system, endocrine system, etc.) (Kaufman et al.,
1999). Many phytomedicines exert their beneficial
effects through the additive or synergistic action of
several chemical compounds acting at single or
multiple target sites associated with a physiological
process (Briskin, 2000).
Secondary metabolites also contribute to the specific
odours, tastes and colours in plants (Bennett and Wallsgrove, 1994). Plant secondary metabolites are
only one of its kind as a source for number of food
additives, flavors, pharmaceuticals and industrially
important pharmaceuticals (Ravishankar and
Venkataraman, 1990; Ravishankar and Rao, 2002).
Chemicals include calcium, abscisic acid (ABA),
salicylic acid (SA), polyamines and Jasmonates (JA),
nitric oxide are involved in stress responses in plants
(Tuteja and Sopory, 2008). Accumulation of
metabolites often occurs in plants subjected to stresses
including various elicitors or signal molecules. Secondary metabolites have significant practical
applications in medicinal, nutritive and cosmetic
purposes, besides, importance in plant stress
physiology for adaptation.The production of these
compounds is often low (less than 1% dry weight) and
depends greatly on the physiological and
developmental stage of the plant. Some of the plant
derived natural products include drugs such as
Page 26
JOURNAL OF PLANT DEVELOPMENT SCIENCES VOL. 12(4) 213
morphine, codeine, cocaine, quinine etc.
Catharanthus alkaloids, Belladonna alkaloids,
colchicines, phytostigminine, pilocarpine, reserpine
and steroids like diosgenin, digoxin and digitoxin,
flavonoids, phenolics etc. (Rao and Ravishankar,
2002).
General guidelines for collection
In the course of collection, efforts should be made to
remove parts of the selected plants that are not
required. In addition to above, foreign material in any
form natural or artificial such as particular toxic
weeds or the anthropogenic waste also should be
taken away. Decomposed and decayed medicinal
plant parts as a raw material should be discarded.
Medicinal plants should not be collected in or around
areas of heavily pollution. Local sites having high
levels of pesticides, herbicides, insecticides, chemical
fertilizer or other possible contaminants are always neglected. Even, road sides, drainage, ditches, mines
tailing, garbage dumps and industrial surroundings
which may produce toxic emissions should not be
considered. In addition, the collection of medicinal
plants in and around active pastures, including
riverbanks downstream from pastures, should be
avoided in order to avoid microbial contamination
from any type of waste as it has the capacity to have
numerous microorganisms. In general, the collected
medicinal plant and raw materials of any plant part
should not come into direct contact with the soil. If underground parts are used, any adhering soil should
always be removed from the plants and plant part as
soon as they are collected. Collected material must be
placed in clean containers, basket, mesh bags, other
well aerated containers or drape clothes that are free
from any foreign matter, including plant remnants
from previous collecting activities. This concern is of
extreme importance to present day society that has
been over exploiting the drugs for commercial gains
without much reciprocal social gains as a result many
commonly used medicinal plants are on the verge of
extinction (Annonymus, 2005).
Safety issues and recommendations
Lack of side effects of herbals does not mean taking a
conventional medicine without any expert‟s
recommendations. With traditional medicine, there is
always risk of counterfeits or adulterations or
admixture of unwanted material. And, while their
effectiveness varies from place, method and season of
collection of plant material and also person to person.
Such traditional medicinal systems are often the last
resort for people, especially when the western medical
treatments fail them to cure. Definitely we get energized with a number of active herbal ingredients
posing on the package but a little but relevant
question rise how all these ingredients are altogether
found at a time as plant constituents varies in different
seasons. Moreover, some plants should not be found
anytime and every time. And if we are convinced with
the fact that they collected and stored for selling year-
round, where‟s the guaranty that they were stored in a
prescribed manner after following standard operating
procedure for plant collection. Rapidly increasing of
local healer‟s or quack shops clearly visible with their
unusual claim of complete recovery from any
complications. A growing number of people are
looking for guidance on the Internet while others believe dishonest ads. It is strictly recommended that
plant drugs are miraculous, better avoid plant drugs
only as food supplements, they can‟t be always safe
as they are natural and taking expert‟s advice before
use.
Conclusion and future scope
Thus, on the one hand, habitat destruction and
unsustainable harvesting of medicinal plants pose a
serious threat to biodiversity, as well as the native
medicinal resources in India, where many states and
regions are progressively losing their forest cover
(FSI, 1999). Therefore, collection of these resourceful plants in most appropriate manner is essential. Vedic,
Ayurvedic literature on medicinal plants has
furthermore described the collection practices in well
documented manner and its utility is also corroborated
by modern chemical tools. Therapeutic efficiency is
presumed to depend on the quality and quantity of the
secondary metabolites which are major active
principles. The quantity and quality are influenced by
the method of collection. For our ancient
Ayurvedacharya‟s medicinal plants were not just
resources for exploitation of natural resources for man‟s need/greed. They were the auspicious fellow
inhabitants of the sacred planet „Mother Earth‟ which
is being exploited only to protect and promote the
health of living being during the time of natural or life
style problems. In fact they believed that the drug will
be blessed with optimum medicinal value if and only
if their purpose is genuine and proper collection of the
plants or plant parts with due respect in a proper
season.
This communication highlights the importance of
collection practices to achieve desired beneficial
effect, as herbs without good effectiveness become useless to physician as well as pharmaceuticals
industries. Traditional plants have vast opportunities
to explore and conducting extensive research is
necessary for their rational use. In order to expedite
medicinal plant breeding and transform them into
living factories of medicinal compounds proper
collection of important medicinal plants is essential.
And, even use of the emerging high-end modern
technologies can be expanded to traditional medicinal
plants to understand and extract newer phyto-
molecules for very many health problems of the human being.
REFERENCES
Anonymous (1948-1976). Pharmacognosy of
Ayurvedic drugs. Trivandrum Vol. 1 and 2.
Anonymous (1948-1976). Wealth of India, New
Delhi.
Page 27
214 VINAY M. RAOLE AND VAIDEHI V. RAOLE
Anonymous (2005). How to Collect Plants. Royal
Botanic Gardens, Sydney.
Ashtanga Hrudya of Vagbhata (2018).
Choukhmbha Surbharati Prakashana.
Balasubramanian, A.V. (2000). The relevance of a
vibrant tradition. In: Indian Health Traditions, pp. 6-8. The Hindu, October, Chennai, India.
Bannerman, R.H.O., Burton, J. and Chen, W.C. (1983). Traditional Medicine and Health Care
Coverage: A Reader for Health Administrators and
Practitioners. Geneva: World Health Organization.
Bennett, R.N. and Wallsgrove, R.M. (1994).
Secondary metabolites in plant defence mechanisms.
New Phytol. 127:617-33.
Bhavaprakash Nighantu Commentary by Dr.
Krushnachand Chunekar, Oriental Publishers and
Distributors, Varanasi.
Charaka, Samhita (1981). PV Sharma Translator, Chaukhamba Orientalia, Varanasi, India.
Chopra, A. and Doiphode, V.V. (2002). Ayurvedic
medicine: core concept, therapeutic principles, and
current relevance. Med Clin North Am. 86:75-89.
Fabricant, D.S. and Farnsworth, N.R. (2001). The
Value of Plants Used in Traditional Medicine for
Drug Discovery. Envir. Health Perspectives, 109, 1.
69-75.
Forest Survey of India (FSI). (1999). State of Forest
Report 1999. Forest Survey of India (Ministry of
Environment and Forests), Dehra Dun, India. Hankey, A. (2001). Ayurvedic physiology and
etiology: Ayurvedo Amritanaam. The doshas and
their functioning in terms of contemporary biology
and physical chemistry. J Altern Complement Med.
7:567-574.
Karnick, C.R. (1977). Effects of phases of moon on
the growth and active principles of Acorus calamus
(Bach.) Nagarjun journal.
Kaufman, P.B., Cseke, L.J., Warber, S., Duke, J.A.
and Brielmann, H.L. (1999). Natural Products from
Plants. CRC Press, Boca Raton, FL.
Madhava, Nidanam (1993). Shri Kanta Murthy translator, Chaukhamba Orientalia, Varanasi, India,
Bhava Prakasha 1998, Shri Kanta Murthy translator,
Chaukhamba Orientalia, Varanasi, India.
Majumdar, A.K. (1989). Ayurveda and modern
medicine Anc. Sci. Life 8(3): 117-190.
Mukherjee, P.K., Bahadur, S. and Harwansh, R.K. (2013). Development of traditional medicines:
Globalizing local knowledge or localizing global
technologies. Pharma, 45(9).
Parasuraman, S., Thing, G.S. and Dhanaraj, S.A. (2014). Polyherbal formulation: concept of Ayurveda. Pharmacogn Rev.;8(16):73-80. Rajnighantu with
Dravyagunaprakashika hindi vyakhya by Indradev
Tripathi,Choukhamba krushnadas academy,Varanasi.
Rao, S.R. and Ravishankar, G.A. (2002). Plant cell
cultures: chemical factories of secondary metabolites.
Biotechnol Adv 20:101-53; PMID:14538059;
DOI:10.1016/ S0734-9750(02)00007-1.
Ravishankar, G.A. and Rao, S.R. (2000)
Biotechnological production of phytopharmaceuticals.
J Biochem Mol Biol Biophys 4:73-102.
Ravishankar, G.A. and Venkataraman, L.V. (1990). Food applications of plant cell cultures. Curr
Sci 57:381-3.
Reid, W.V. 1993. World Resources Institute, Instituto
Nacional de Biodiversidad (Costa Rica), Rainforest
Alliance, African Centre for Technology Studies.
Biodiversity Prospecting: Using Genetic Resources
for Sustainable Development. New York:World
Resources Institute.
Sabnis, M. (2006). Chemistry and Pharmacology of
Ayurvedic Medicinal Plants. Varanasi, India:
Chaukhamba Amarabharativ Prakashan; Sastri H, ed.
Ashtanga Hridayam. Varanasi, India: Chaukhambha Orientalia; 2002.
Shankar, D. (1999). Bioresources and biotechnology
policy issues: the case of medicinal plants. In:
Bioresources and Biotechnology: Policy Concerns for
the Asian Region (Ed. Sahai, S.), pp. 45-51. Gene
Campaign, New Delhi, India.
Shankar, D., Ved, D.K. and Geetha, U.G. (2000). A
green pharmacy. In: Indian Health Traditions, pp. 14-
17. The Hindu, October, Chennai, India
Sharangdhara Samhita, Dipika Hindi Vyakhya, by
Brahmananda Tripathi, Choukhamba Surbharati prakashana, Vasranasi.
Sharngadhara, Samhita (1984). Shri Kanta Murthy
Translator, Chaukhamba Orientalia, Varanasi, India,
Sinha, A.K. (1984). Philosophical presuppositions of
Ayurveda and Modern medicine. Anc. Sci. Life 3(3):
123-128.
Sivarajan, V.V. and Balalchandran, I. (1999).
Ayurvedic drugs and their plant sources. Oxford &
IBH publishing comp. New Delhi.
Sushruta, Samhita (1991). KL Bhishagratna
Translator, Chaukhamba Orientalia, Varanasi, India,
Ashtanga Hridaya 1991 Shri Kanta Murthy Translator, Chaukhamba Orientalia, Varanasi, India.
Toledo, B.A., Galetto, L. and Colantonio, S. (2009).
Ethnobotanical knowledge in rural communities of
Cordoba (Argentina): the importance of cultural and
biogeographical factors. J. Ethnobiol. Ethnomed.
5:40.
Tuteja, N. and Sopory, S.K. (2008). Chemical
signaling under abiotic stress environment in plants.
Plant Signal Behav; 3:525-36.
Wink, M. and Schimmer, O. (1999). Modes of
action of defensive secondary metabolites. In MWink, ed, Functions of Plant Secondary Metabolites and
Their Exploitation in Biotechnology. CRC Press,
Boca Raton, FL, pp 17–112.
Page 28
*Corresponding Author
________________________________________________ Journal of Plant Development Sciences Vol. 12(4): 215-222. 2020
LONG TERM EFFECT OF INORGANIC FERTILIZERS AND ORGANIC
MANURES ON NUTRIENT UPTAKE, AND YIELD OF RICE ON INCEPTISOL
Kiran Rathore1, Alok Tiwari
2and Rahul Kumar*
3
Department of Soil Science & Agricultural Chemistry, College of Agriculture, Raipur1,2
College of Agriculture, Bharatpur(Raj)3
Email: [email protected]
Received-02.04.2020, Revised-23.04.2020
Abstracts: The experiment was conducted during the kharif season at research farm, Indira Gandhi Krishi Viswavidyalaya, Raipur to investigate the long term effect of Inorganic fertilizer and organic manures on nutrient uptake and yield or rice. The soil was sandy loan and locally known as matasi, Low in nitrogen, medium in P and K. the experiment was laid in RBD and replicated three times with eleven treatment T1 -No Fertilizer, No Organic manure (Control),T2 -50% Recommended NPK (40:30:20), T3-75% Recommended NPK,T4-100% Recommended NPK (80:60:40),T5-50% Recommended NPK +50%N through Farm yard manure,T6 -75% Recommended NPK +25%N through Farm yard manure,T7-50% Recommended NPK +50%N through rice residue,T8-75% Recommended NPK +25%N through rice residue,T9-50% Recommended NPK +50%N through Green manure,T10-75% Recommended NPK +25%N through Green manure,T11-
Conventional Farmer’ Practice (50:30:20). A medium duration high yielding rice variety Mahamaya was taken as test crop. The results revealed that combination application of inorganic fertilizer and organic manure i.e. integrated of fertilizer and manure improve chemical propertied of soil. The macro nutrient uptake yield and attributing parameter and grain yield of rice were found superior in different organic and inorganic treatment combination at 25, 50 % and along with Green manuring and / FYM as compared to 50 % or 75% RDF to rice crop
Keyword: Rice, Nutrient uptake,Nutrient content, Organic, Inorganic fertilizer
INTRODUCTION
ndia is the second largest rice producing country in
the world after China. Although rice planted area
in India is 40 per cent higher than in China, Indian
rice production is 30 percent below than Chinese
production because of lower yields (2.3 tonnes per
hectare in India vs. 4.7 tonnes in China). Indian rice
yields are well below the world average (2.9 tonnes/hectare), implying there is a great potential
for increasing production.Chhattisgarh state occupies
13.51 million hectares with a gross cropped area of
about 5.68 million ha. The geographical area of the
state is situated between 17046’ to 2406’ N latitude
and 80015’ to 84051’ E longitude.Inceptisol are
shallow, well-drained, loamy soils on the gentle
sloping and undulating plateau (slightly dissected)
with moderate erosion and occurrence of stones.
They are classified as loamy, kaolinitic,
isohyperthermic, Lithic Ustropepts. Inceptisol are
locally called matasi soil. They have a light texture and a shallow to moderate depth.
Integrated nutrient management is one of the most
important components of the production technology
to sustain soil fertility and crop productivity. The
combined use of organic and inorganic sources of
plant nutrients not only pushed the production and
profitability of field crops but also helped in
maintaining the fertility status of the soil
(Chandrasoorian et al. 1994). The advantage of
combining organic and inorganic sources of nutrients
in integrated nutrient management has been proved superior to the use of each component separately
(Palaniappan and Annadurai 2007). Inorganic
fertilizers, especially nitrogen (N), phosphorus (P)
and potassium (K), not only serve to maintain or
improve crop yields, but their application also
directly or indirectly induce changes in soil chemical,
physical and biological properties. Some studies
showed that chemical fertilizers increase biomass C
and N, Sarathchandra et al. (2001) reported that
nitrogen and phosphatefertilizers had no significant effects on soil microbial populations and N
application reduced the functional microbial diversity
in pasture soils.
Applying organic amendments to soil not only
increases the total organic carbon content and its
different fractions but also has a series of effects on
microbial proliferation and activity (Tejada et al.,
2006; Ros et al., 2003). Soil microbial biomass is
undoubtedly a valuable tool for understanding and
predicting changes in soil fertility management and
associated soil conditions such as nutrient dynamics
and soil reaction (Sharma et al., 2004; Yougunet al., 2007). It has assumed greater significance and
increasing interest in its determination (Azamet al.,
2003).Long term effect of inorganic fertilizers and
organic manures on nutrient uptake and yield of rice
on inceptisol”
MATERIALS AND METHODS
The field experiment was conducted at the research
farm, Indira Gandhi Krishi Vishwavidyalaya, Raipur
(Chhattisgarh) during kharif. Raipur comes under agro-climatic plain Zone of Chhattisgarh State and
I
RESEARCH ARTICLE
Page 29
216 KIRAN RATHORE, ALOK TIWARI AND RAHUL KUMAR
lie at 21016’ N latitude and 81026’ East longitude
with an altitude of 289.56 m above the mean sea
level. The experiment were laid out in eleven
treatment combinations.T1 -No Fertilizer, No
Organic manure (Control),T2 -50% Recommended
NPK (40:30:20), T3-75% Recommended NPK,T4-100% Recommended NPK (80:60:40),T5-50%
Recommended NPK +50%N through Farm yard
manure,T6 -75% Recommended NPK +25%N
through Farm yard manure,T7-50% Recommended
NPK +50%N through rice residue,T8-75%
Recommended NPK +25%N through rice residue,T9-
50% Recommended NPK +50%N through Green
manure,T10-75% Recommended NPK +25%N
through Green manure,T11- Conventional Farmer’
Practice (50:30:20). A medium duration high
yielding rice variety Mahamaya was taken as test
crop with threereplications. Nitrogen content in plant Sample was determined by
using micro-Kjeldahl method as described by
Chapman and Pratt (1961). Phosphorus content was
determined by Vanadomolybdo-phosphoric acid
yellow color method using blue filter as described by
Jackson (1958). Potassium content was determined
by flame photometer method as described by
Chapman and Pratt (1961).The growth and yield of
rice crop depend upon all growth parameters.viz
Number of total and effective tillers, Panicle length,
1000 grain weight etc.
RESULTS AND DISCUSSION
Effect of various combinations of inorganic
fertilizer and organic manure application on
nutrient content and their uptake
Content in rice grain and straw
Nitrogen, Phosphorus and potassium content in grain
as well as straw are given in table 1 The different
treatment combination significantly affected the N, P
and K concentration in grain and straw at harvest
stage.
Nitrogen content The nitrogen content in grain and straw was
increased significantly with integrated nutrient
management practices over control. The nitrogen content in grain and straw was ranged from 7.9 to
10.9 and 3.8 to 6.5 gm kg-1, respectively. The higher
nitrogen content in grain was noted under treatment
50%RDF+ 50%GM followed by 50% RDF+
50%FYM and lowest under the control. Similar kind
of result in nitrogen content was obtained in straw
also.
Phosphorus content
Phosphorus content in grain and straw of rice under
different treatment combination is given in table 1.
The P content in grain was ranged from 1.6 to 3.2 gm
kg-1 amongst different treatment. The highest (3.2 gm kg-1) P content in grain was recorded in 50%RDF+
50%GM-N and lowest in control plot. Almost similar
kind of pattern was observed in phosphorus content
in straw amongst various treatment combinations.
Potassium content
Potassium content in grain was ranged from 2.1 to
2.9gm kg-1 in different treatments. The higher (2.9
gm kg-1) potassium content in grain was recorded in
50% RDF+50%FYM-N and 50% RDF+ 50%GM-N
and lowest (2.1gm kg-1) in control plots. Potassium
content in straw was ranged from 13.2 to 19.7gm kg-1 and increased significantly with applied all treatment
combination over control. The highest (9.7gmkg-1)
potassium content in straw was measured in 50%
RDF+ 50%FYM-N treated plot, while lowest (16.9
gm kg-1) in farmer’s practices. The results are in
agreement with the finding of Sarwar (2005) who
studied that increased concentration of N, P and K in
paddy grain and straw of rice with the combined use
of FYM, Sesbania green manure and chemical
fertilizer compared with application of chemical
fertilizer and organic manures alone.
Table 1. Effect ofintegrated nutrient management fertilizer and organic manure application on N, P and K
content in grain and straw of rice (after 21 crop cycle)
Treatments
Nutrient Content (gm kg-1
)
Grain Straw Grain Straw Grain Straw
N P K
T1-Control 7.9d 3.8e 1.6e 0.4d
2.1d 1.32d
T2-50% RDF (40:30:20) 8.4d 4.3de 2.4d 0.5cd 2.3cd 1.72bc
T3-75% RDF 8.5cd 5.1bc 2.4cd 0.5c 2.5abcd 1.79bc
T4-100% RDF (80:60:40) 9.4abcd 5.0cd 2.6bcd 0.6bc 2.6abc 1.81abc
T5-50% RDF+50% FYM-N 10.7ab 6.4a 2.9ab 0.8ab 2.9a 1.97a
T6-75%RDF+25% FYM-N 10.2abc 5.5bc 2.7bcd 0.7abc 2.7ab 1.74bc
T7-50%RDF+50% RR-N 8.8cd 5.9ab 2.8abc 0.7abc 2.6abc 1.81abc
T8-75% RDF+25% RR-N 9.2bcd 5.4bc 2.6bcd 0.7abc 2.3bcd 1.76bc
Page 30
JOURNAL OF PLANT DEVELOPMENT SCIENCES VOL. 12(4) 217
T9-50% RDF+50% GM-N 10.9a 6.5a 3.2a 0.8a 2.9a 1.88ab
T10-75% RDF+25% GM-N 10.2abc 5.9ab 2.8ab 0.7ab 2.8a 1.72bc
T11-Farmer practices (50:30:20) 8.6cd 4.9cd 2.6cd 0.6c 2.5abcd 1.69c
SEm+ 0.56 0.27 0.15 0.05 0.14 0.55
CD (P= 0.05) 1.65 0.79 0.43 0.14 0.40 1.63
FYM-farm yard manure, RR- rice residues, GM- green manure
Uptake of N, P and K by grain and straw as
influenced by different fertilizer and integrated
nutrient management practices
Nitrogen uptake
Nitrogen uptake by grain, straw and total by rice is
given in table 2. The nitrogen uptake by grain was ranged from 10.34 to 76.29 kg ha-1. The 50% RDF+
50% GM-N had highest nitrogen uptake 76.29 kg ha-
1 by grain followed by 74.33 kg ha-1 in 50% RDF +
50% FYM-N and the lowest (10.34 kg ha-1 ) under
control plots. Almost similar trend was observed in
nitrogen uptake by straw among various treatment
combinations. Due to incorporation of 50% or 25%
RR-N with 50% or 75% RDF the N uptake by straw
was similar to that obtained in 100% RDF.
Among INM combinations 50% RDF + 50% GM –N
gave highest N uptake by grain as compared to other
INM treatment at 50% RDF (T5, T7 and T9). The INM treatments at 75% RDF level were almost
similar (T6, T8 and T10) in N uptake by grain. The
results are in agreement with the findings of Dar et
al. (2012) who studied that uptake of nitrogen by
paddy and straw was higher under integrated nutrient
treatments.
Table 2. Nitrogen uptake by rice as affected by nutrient management practices (after 21 crop cycle)
Treatments Nitrogen uptake (kg ha
-1)
Grain Straw Total
T1-Control 10.34 8.78 19.12 h
T2-50% RDF (40:30:20) 36.45 29.00 65.45 g
T3-75% RDF 52.72 47.10 99.82 dc
T4-100% RDF (80:60:40) 65.69 47.42 113.11 cd
T5-50% RDF+50% FYM-N 74.33 59.26 133.59 ab
T6-75%RDF+25% FYM-N 68.71 51.21 119.92 bc
T7-50%RDF+50% RR-N 53.70 47.75 101.45 dc
T8-75% RDF+25% RR-N 52.90 41.50 94.40 ef
T9-50% RDF+50% GM-N 76.29 61.87 138.20 a
T10-75% RDF+25% GM-N 69.47 56.54 126.01 abc
T11-Farmer practices (50:30:20) 44.13 37.39 81.53 f
SEm+ 3.68 2.34 4.76
CD (P= 0.05) 10.87 6.92 14.03
FYM-farm yard manure, RR- rice residues, GM- green manure
Total uptake
The total nitrogen uptake by rice crop was ranged
from 19.12 to 138.2 kg ha-1 and increased significantly with applied fertilizer treatment over
control. Significantly higher (138.2 kg ha-1) N uptake
was recorded in treatment 50%RDF +50% GM-N,
followed by 133.59 kg ha1in 50%RDF + 50% FYM-
N and lowest (65.45 kg ha-1) under 50% RDF among
fertilizer treatment plot ( Table 2) The results are in
agreement with Laxminarayana and Patiram (2006),
revealed that application of optimum doses of NPK
in combination with green manure @ 5 Mg ha−1
recorded highest grain and straw yields and uptake of
N, P and K followed by 100% NPK + poultry
manure and 100% NPK + FYM
Phosphorus uptake
Phosphorus uptake by rice grain, straw and total
under different treatment is given in table 3. The increase in application of inorganic fertilizer
significantly increased the P uptake by grain and
simultaneously the uptake by straw and total also.
The phosphorus uptake by grain ranged from 2.13 to
22.09 kg ha-1. The highest (22.09 kg ha-1) phosphorus
uptake by grain was noted under 50%RDF +50%
GM-N, followed by 19.83 kg ha-1 in
50%RDF+50%FYM-N and lowest (10.32 kg ha-1)
under 50% RDF with respect to applied treatment.
The highest (18.3 kg ha-1) uptake was recorded in
100% RDF compared to all inorganic fertilizer.
Similar trend was observed in phosphorus uptake by straw among various treatment combinations.
Page 31
218 KIRAN RATHORE, ALOK TIWARI AND RAHUL KUMAR
Table 3.Phosphorus uptake by rice as affected by nutrient management practices (after 21 crop cycle)
Treatments Phosphorus uptake (kg ha
-1)
Grain Straw Total
T1-Control 2.13 0.91 3.05 i
T2-50% RDF (40:30:20) 10.32 3.57 13.9 h
T3-75% RDF 14.74 4.97 19.7 f
T4-100% RDF (80:60:40) 18.30 5.95 24.3 cd
T5-50% RDF+50% FYM-N 19.83 7.1 26.9 b
T6-75%RDF+25% FYM-N 18.01 6.18 24.2 cd
T7-50%RDF+50% RR-N 17.01 5.46 22.5 de
T8-75% RDF+25% RR-N 15.19 5.03 20.2 ef
T9-50% RDF+50% GM-N 22.09 7.52 29.6 a
T10-75% RDF+25% GM-N 19.11 6.86 26 bc
T11-Farmer practices (50:30:20) 13.04 4.21 17.2 g
SEm+ 0.93 0.45 0.79
CD (P= 0.05) 2.73 1.32 2.35
FYM- farm yard manure, RR- rice residues, GM- green manure
Total uptake
Total phosphorus uptake by rice ranged from 3.05 to
29.6 kg ha-1 and increasing significantly with
increasing dose of applied fertilizer and manure over
control. The significantly highest (29.6 kg ha-1) P uptake was recorded in 50% RDF + 50% GM-
Nclosely followed (26.9 kg ha-1) by 50%RDF +
50%FYM-N and lowest (13.9 kg ha-1) in 50% RDF
with respect to applied inorganic fertilizer. The
nitrogen and phosphorus uptake by grain and straw
were also increased due to increased grain yield and
concentration of the nutrients in respective
treatments (Table 3). Similar finding were observed
by Makarim et al. (2005).
Potassium uptake
Potassium uptake by grain, straw and total under
inorganic fertilizer and INM treatments is given in
table 4. The K uptake by grain ranged from2.80 to
20.18 kg ha-1. The highest (20.18 kg ha-1) K uptake was recorded in 50%RDF + 50% GM-N followed by
19.88 kg ha-1 in 50%RDF + 50%FYM-N and lowest
(2.80 kg ha-1) in control plots. The K uptake by straw
ranged from 30.85 to 183.34 kg ha-1. The highest
(183.34 kg ha-1) K uptake by straw was noted in
50%RDF + 50%FYM-N followed by (179.79 kg ha-
1) in 50%RDF + 50% GM-N and the lowest 30.85 kg
ha-1 in control plots.
Table 4. Potassium uptake by rice as affected by different treatment (after 21 crop cycle)
Treatments
Potassium uptake (kg ha-1
)
Grain Straw Total
T1-Control 2.8 30.85 33.65 f
T2-50% RDF (40:30:20) 9.84 117.16 127.00 e
T3-75% RDF 15.4 165.03 180.43 b
T4-100% RDF (80:60:40) 18.18 171.72 189.90 ab
T5-50% RDF+50% FYM-N 19.88 183.34 203.22 a
T6-75%RDF+25% FYM-N 18.11 162.79 180.91 b
T7-50%RDF+50% RR-N 15.75 147.34 163.09 c
T8-75% RDF+25% RR-N 13.45 136.16 149.61 d
T9-50% RDF+50% GM-N 20.18 179.79 199.97 a
T10-75% RDF+25% GM-N 18.96 165.92 184.88 b
T11-Farmer practices (50:30:20) 12.74 129.32 142.06 d
SEm+ 0.78 4.53 4.55
CD (P= 0.05) 2.29 13.36 13.41
FYM- farm yard manure, RR- rice residues, GM- green manure
Total uptake The total potassium uptake by rice ranged from 33.65
to 203.22 kg ha-1 and increased significantly by
increasing dose of applied fertilizer and manure over
control. Significantly highest 203.22 kg ha-1 K
uptake was recorded in 50%RDF + 50% FYM-N
closely followed by 199.97 kg ha-1 in 50%RDF +
50% GM-N and lowest 127 kg ha-1in 50%RDF with
Page 32
JOURNAL OF PLANT DEVELOPMENT SCIENCES VOL. 12(4) 219
respect to applied treatment. The results are in
agreement with the findings of Das et al. (2013),
showed that FYM application @ 15 t ha -1 along with
100% NPK fertilizers produced maximum yields,
nutrients uptake and improve in soil properties.
Effect of combined application of inorganic
fertilizer and organic manure on nutrient balance
sheet
It is always desirable to calculate the apparent
nutrient balance to attain the desirable level of
production without depleting the native reserves and
ensuring the maintenance and improvement in soil
fertility. Nutrient’s drain has been calculated on the
basis of the removal by grain and straw of the crops
which were harvested. The balance sheets of
available N, P and K in rice as influenced by
inorganic fertilizer and organic manure are presented
in Table 5. The data showed that on inputs (nutrient applied) and outputs (nutrient uptake) of nutrients
indicated the N, P and K removal was the highest in
50%RDF+50%FYM-N followed by 50%
RDF+50%GM-N over rest of the treatments. The
maximum negative N balance was recorded in
treatment 50%RDF+50%FYM-N (-54.83).
Phosphorus is relatively immobile in soil as
compared to N and K. The maximum positive
balance of P was recorded in treatment 75%
RDF+25% RR-N (+5.8 kg ha-1) followed by 50%RDF+50% RR-N (+3.5 kg ha-1) while,
maximum negative balance of P was recorded in
treatment Farmer practices (-4.2 kg ha-1). The
negative P balance is obviously due to absence
and/or lower dose of P in fertilization schedule
whereas positive P balance is because of addition of
P in excess of its uptake by crops (Dwivedi et al.
2007). The maximum negative balance of K in soil
was recorded under 50%RDF+50%FYM-N (-170 kg
ha-1) treatment. Thakur et al. (2011) reported that
balanced use of fertilizers alone significantly
responsible forbuildup of organic carbon and available P. A declining trend of available N and K
from its initial status was noticed as a result of
continuous cropping, which indicated considerable
soil mining of available N and K.
Table 5. Effect of application of inorganic fertilizer and organic manure on nutrients (N, P and K) balance sheet
(after 21 crop cycle)
Treatments
Balance sheet of Nutrients ( kg ha-1
)
Nutrient added through
fertilizer and manure
Nutrient removed by grain
+straw
Net gain or loss
N P K N P K N P K
T1-Control 0 0 0 19.12 3.05 33.65 -19.12 -3.05 -33.65
T2-50% RDF (40:30:20) 40 13 17 65.45 13.9 127 -25.45 -0.9 -110
T3-75% RDF 60 20 25 99.82 19.7 180.43 -39.82 +0.3 -155.43
T4-100% RDF (80:60:40) 80 26 33 113.11 24.3 189.9 -33.11 +1.7 -156.9
T5-50% RDF+50% FYM-N 80 26 33 134.83 26.9 203.22 -54.83 -0.9 -170.22
T6-75%RDF+25% FYM-N 80 26 33 119.92 24.2 180.91 -39.92 +1.8 -147.91
T7-50%RDF+50% RR-N 80 26 33 101.45 22.5 163.09 -21.45 +3.5 -130.09
T8-75% RDF+25% RR-N 80 26 33 94.40 20.2 149.61 -14.4 +5.8 -116.61
T9-50% RDF+50% GM-N 80 26 33 132.98 29.6 199.97 -52.98 -3.6 -166.97
T10-75% RDF+25% GM-N 80 26 33 126.01 26 184.88 -46.01 0 -151.88
T11-Farmer practices (50:30:20) 50 13 17 81.53 17.2 142.06 -31.53 -4.2 -125.06
Page 33
220 KIRAN RATHORE, ALOK TIWARI AND RAHUL KUMAR
Effect of different nutrient management practices
on yield attributing characters and yield of rice
Yield attributing character of rice
Number of tiller per m2
Data pertaining on number of effective tillers per m2 (Table 6) showed that this parameter was
significantly influenced with combination of applied
inorganic fertilizer and organic manure over control.
The 50% RDF+ 50% GM-N showed higher response
on number of tillers as compare to other treatment
combination. The integration of recommended
fertilizer dose along with organic residues like 50%
N through GM (483 m2), FYM (456 m2), and RS
(424 m2), and 25% N through GM (453 m2), FYM
(440 m2) and RS (434 m2) along with 50 and 75%
RDF showed comparable and/or on par number of
effective tillers amongst them. At harvest, all the treatments combination proved
significantly superior over control in producing
effective tillers per square meter. The 50% RDF+
50% GM-N gave maximum (453 m2) number of
effective tillers and minimum (298 m2) in farmer’s
practice plot.
Table 6. Effect of continuous cropping and fertilization on yield attributing characters of Rice (after 21 crop
cycle)
Treatments
Effective tiller
(m-2
)
Panicle length
(cm)
Test weight
(gm)
T1-Control 113 f 16.04 c 30.86 c
T2-50% RDF (40:30:20) 353 d 21.3 b 31.89 bc
T3-75% RDF 348 d 21.83 ab 33.01 ab
T4-100% RDF (80:60:40) 460 a 22.52 ab 33.56 a
T5-50% RDF+50% FYM-N 456 b 24 ab 34.21 a
T6-75%RDF+25% FYM-N 440 b 22.38 ab 33.94 a
T7-50%RDF+50% RR-N 424 c 21.23 b 33.92 a
T8-75% RDF+25% RR-N 434 b 22.32 ab 33.46 a
T9-50% RDF+50% GM-N 483 a 24.55 a 33.31 ab
T10-75% RDF+25% GM-N 453 b 22.56 ab 32.86 ab
T11-Farmer practices (50:30:20) 298 e 21.5 ab 33.85 a
SEm+ 9 1.06 0.48
CD (P= 0.05) 26 3.11 1.43
FYM- farm yard manure, RR- rice residues, GM- green manure
Panicle length The data on panicle length is given in Table 6
showed that all the treatments had significant
differences over the control. The highest (24.55 cm)
panicle length was recorded in 50% RDF+ 50% GM-
N followed by 24 cm in 50% RDF+ 50% FYM-N
and lowest (16.04 cm) under control plots. The 50,
75 and 100% RDF alone and in combination with 25 and 50% RR-N and farmer practice were at par on
panicle length and significantly inferior over rest of
the INM treatments. The results are in agreement
with the finding of Chaudhary et al. (2007) who
observed that maximum panicle length was obtained
under 120 kg N ha-1 (27.80 cm) as compared to in
control (20.22 m).While the effect of N at 80 or 120
kg ha-1 with FYM on 1000-grain weight was equally
effective as reflected in their statistical methods also.
Test weight
The data on test weight (1000- seeds) is presented in Table 6. The highest test weight, 34.21 g was
recorded in 50%RDF+ 50% FYM-N followed by
33.31 g in 50%RDF+ 50% GM-N and lowest (30.86
g) in control plot. The results are conformity with the
findings of Hossaen et al. (2011) who revealed that
the maximum number of total grain per plant (97.45),
the highest weight of 1000 seeds (21.80 g), the
maximumgrain yield (7.30 t ha-1) and straw yield
(7.64 t ha-1) were recorded in treatment T5 (70%
NPKS+2.4 t poultry manure ha-1
) whereas the lowest
number of effective tillers per hill was 6.1
Effect of different nutrient management practices
on rice yield The yield of rice increased with increasing the levels
of mineral nutrients from 50 to 100% RDF.
Treatment T9 consisting of 50% RDF + 50% GM-N
as received from green manuring registered highest
grain yield (70.23 q/ha) of rice which was
significantly superior to the control, farmer’s practice
and different levels of mineral nutrients i.e. from 50
to 100 % RDF. It was because of the immobilization
of nitrogen and comparable to that of 100%
inorganic fertilizer treatment (T4), 50% (T5) and 75%
(T6) RDF +25/50% N as received from FYM and 25% N received from GM in T10 respectively (Table
7). Significant residual effect of FYM and GM
incorporation in soil was recorded on grain yield of
rice. Thus, the use of FYM and GM with fertilizer N
has helped in sustaining the yield of rice as reported
Page 34
JOURNAL OF PLANT DEVELOPMENT SCIENCES VOL. 12(4) 221
by Singh et al. (2001). Rice was found to be more
responsive than rabi crops to green manuring, which
might be due to direct effect of green manure in
supplying nutrient to rice crop and beneficial effect
on soil health as reported by Kumar and Singh
(2010). Mehdi et al. (2011) studied the comparison of Sesbania and FYM applied at 20 ton ha-1 showed
that Sesbania remained superior over the farm yard
manure for improving the paddy and straw yield. The
increased efficiency of NPK fertilizer with green
manuring may be due to chemical, enzymatic and
metabolic transformation of organic material, as the
green manuring iscontinuously subject to
degradation, thus more susceptible to change in metal uptakethan inorganic soil fractions.
Table 7. Effect of long term inorganic fertilizer and organic manure application on rice yield
Treatments Yield q/ha
Grain Straw
T1 Control 13.13 e 23.29 e
T2 50% RDF (40:30:20) 43.54 cd 68.13 cd
T3 75% RDF 61.77 b 92.08 a
T4 100% RDF (80:60:40) 70.1 a 94.79 a
T5 50% RDF+50% FYM-N 69.27 a 93.13 a
T6 75%RDF+25% FYM-N 67.5 a 93.75 a
T7 50%RDF+50% RR-N 60.73 b 81.46 b
T8 75% RDF+25% RR-N 57.6 b 77.5 b
T9 50% RDF+50% GM-N 70.23 a 95.83 a
T10 75% RDF+25% GM-N 68.29 a 96.25 a
T11 Farmer practices (50:30:20) 51.04 c 76.46 b
SEm± 2.78 3.72
CD (P= 0.05) 8.15 10.90
FYM- farm yard manure, RR- rice residues, GM- green manure
CONCLUSION
The above result the following conclusions can be
drawn:-Higher response was observed in integrated use of organic along with inorganic fertilizer for the
nutrient supply of rice crop and further it improves
the organic carbon and available nitrogen and
potassium content of soil. The balance sheets of N, P
and K in rice as markedly influenced by inorganic
fertilizer and organic manures, The maximum
negative N balance (-54.83)was recorded in
treatment 50%RDF+50%FYM-N. The maximum
positive balance (+5.8 kg ha-1) of P was recorded in
treatment 75% RDF+25% RR-N followed by
50%RDF+ 50% RR-N (+3.5 kg ha1) while, maximum negative balance (-4.2 kg ha-1) of P was
recorded in Farmer practices treatment. The
maximum negative balance (-170 kg ha-1) of K in
soil was recorded under 50%RDF+50%FYM-N
treatment.Green manure is second best option for
long-term sustainability and high yield in this system
followed by chemical fertilizer alone and integration
with FYM. All the yield attributing character and
yield of rice significantly increased due to residual
effect of GM/FYM/RR residues along with 75% and
100% RDF in rice over control. The yield of rice
increased with increasing the levels of mineral nutrients from 50 to 100% RDF. Treatment T9
consisting of 50% RDF + 50% GM-N as received
from green manuring registered highest grain yield
(70.23 q/ha).
REFERENCES
Azam, F., Farooq, S. and Lodhi, A.(2003).
Microbial biomass in agricultural soils-determination, synthesis, dynamics and role in plant
nutrition. Pakistan J. Biol. Sci., 6: 629–639.
Chandrasoorian, S., Palaniappan, S.P.and
Martin, G.J.(1994). Studies on soil fertility changes
in a rice based cropping system In :XIII national
symposium onIntegration Nutrient Management for
efficient crop production. February TNAUP 75. p 22-
25.
Chaudhary, S.K., Thakur, S.K. and Pandey,
A.K.(2007). Response of wetland Rice (Oryza
sativa) to N and Zn, Oryza. An International journal on Rice,44(1): 31-34
Chapman, H.D. and Pratt, P.F. (1961). Method of
analysis for soils, plants and waters. Universityof
California. USA.
Dar, S. R., Thomas T., Dagar J. C., Mir H., Amin
A., Shankar V., Singh D., Pundir A. K., Malik R.
K. and Grover, G.P.(2012). Yield Potential,
Nutrient Uptake, Metal Fractionation and Effect on
Soil Properties under Integrative Use of Varied C:N
Ratio Composts, Fly Ash and Inorganic Fertilizer
Nitrogen in Rice Grown on Inceptisol. Journal of
Agricultural Science.4(6). Das, T., Ram, S. and Ram, N.(2013). Effect of long
term application inorganic fertilizers and manure on
yields, nutrients uptake and grain quality of wheat
Page 35
222 KIRAN RATHORE, ALOK TIWARI AND RAHUL KUMAR
under rice-wheat cropping system in a
Mollisols.www. gbpuat.ac.in/research/9(2).
Dwivedi, D. K. and Thakur, S. S. (2000). Effect of
organic and inorganic fertility levels on productivity
of rice (Oryza sativa) crop. Indian-Journal-of-
Agronomy. 45(3): 568-574.
Hossaen, M. A., Shamsuddoha, A. T. M., Paul, A.
K., Bhuiyan, M. S. I. andZobaer,A. S. M.(2011).
Efficacy of different organic manures and inorganic
fertilizer on the yield and yield attributes of Boro
Rice. Krishi Foundation: Mirpur, Bangladesh9(1/2):
117-125.
Jackson, M. L. (1967). Soil Chemical Analysis,
prentice Hall of India Pvt. Ltd., New Delhi, 205.
Kumar, V. and Singh A.P.(2010). Long –term
effect of green manuring and FYM on yield and soil
fertility status in rice- wheat cropping system.
Science.58(4): 409-412. Laxminarayana, K. and Patiram(2006). Effect of
Integrated Use of Inorganic, Biological and Organic
Manures on Rice Productivity and Soil Fertility in
Ultisols of Mizoram. Journal of the Indian Society of
Soil Science.54(2): 213- 220.
Makarim, A.K. and Shuartatik, E. (2005). Partial,
efficiency concept in new rice plant type as indicated
by N uptake. Paper presented at International Rice
Conference, Bali, Indonesia,September 12-14.
Mehdi, S. M., Muhammad S., Abbas, S. T.,
Ghulam, S. and Akhtar, J.(2011). Integrated nutrient management for rice-wheat cropping system
in a recently reclaimed soil .Soil Environ. 30(1): 36-
44.
Moharana,P. C., Sharma, B. M. and Biswar, D.
R.(2012). Long-term effect of nutrient management
on soil fertility and soil organic carbon pools under a
6-year-old pearl millet–wheat cropping system in an
Inceptisol of subtropical India. FieldCrops
Research,136: 32-41.
Palaniappan, S.P. and Annadurai, K.(2007).
Organic Farming: Theory and Practices, PP 169.
Scientific Publishers, Jodhpur. Piper, C.S.(1967). Soil and plant analysis.Indian
reprint. Hans Publications. Bombay.
Ros, M., Herna´ndez, M.T. and Garcı´a, C.(2003).
Soil microbial activity after restoration of a semiarid
soil by organic amendments. Soil Biol. Biochem.,35:
463–469.
Sarathchandra, S.U., Ghani, A., Yeates, G.W.,
Burch, G. and Cox, N.R.(2001). Effect of nitrogen
and phosphate fertilisers on microbial and nematode
diversity in pasture soils. Soil Biol. Biochem. 33, 953–964.
Sarwar, G.(2005). Use of compost for crop
production in Pakistan. Ph.D. Thesis, University of
Kassel, Germany.
Sharma, J.J., Thakur, R.C., Saroch, Kapil. and
Bharbava, Manoj(2004). Long- trem effect of
integrated nutrient management supply in
(Oryzasativa ) – wheat (Triticumaestivum) on system
productivity and soil health under irrigated condition.
National symposium on resource conservation and
agricultural productivity. 22-25, Lughiana, Punjab.
Sharma, R., Dahiva, S., Rathee, A., Singh, D., Nandal, J.K., and Malik, R.K.(2009). Effect of
INM on Growth,Yield, Economics and Soil Fertility
in Rice-Wheat Cropping
Singh, M., Singh,V. P. and Reddy, K. S.(2001).
Effect of integrated use of fertilizer nitrogen and
FYM or Green manure on transformation of N, K
and S and Productivity of rice-wheat system on a
vertisol. Journal of the Indian Society of Soil
Science. 49(3):430-435.
Tejada, M., Herna´ndez, M.T. and Garcı´a,
C.(2006). Application of two organic amendments on soil restoration: effects on the soil biological
properties. J. Environ. ual.,35: 1010– 1017.
Thakur, R., Sawarkar, D., Kauraw, D.L. and
Singh, M.(2010). Effect of inorganic and organic
sources on nutrients availability in a Vertisol.
Agropedology,20(1): 53-59.
Thakur, S.D., Sawarkar, S.D., Vaishya, Vaishya,
U.K. and Singh, M.(2011). Impact of continuous
use of inorganic fertilizers and organic manure on
soil properties and productivity under soybean-wheat
intensive cropping of a vertisol. J. Indian Soc. Soil
Sci.59(1): 74-81.
Yougun, H.E., Qingkui, W., Silong, W. and
Xiaojun, Y.(2007). Characteristics of carbon and
nitrogen of soil microbial biomass and their
relationships with soil nutrients in.
Page 36
*Corresponding Author
________________________________________________ Journal of Plant Development Sciences Vol. 12(4): 223-229. 2020
ASSESSMENT OF MEDICINAL PLANTS THROUGH PROXIMATE AND
MICRONUTRIENTS ANALYSIS
Tamanna Malik*, V.K. Madan2 and Tanya Dhanda
1
1Department of Chemistry, Chaudhary Charan Singh Haryana Agricultural University;
2MAP Section, Department of Genetics and Plant Breeding, Chaudhary Charan Singh Haryana
Agricultural University; [email protected]
Email: [email protected]
Received-10.04.2020, Revised-28.04.2020
Abstracts: The leaves, roots, bark and fruits of medicinal plants have various health-promoting effects on human and animals. These materials may be suitable singly or in combination as therapeutic agents and are important raw materials for manufacturing traditional and modern medicines. Indigenous medicinal plants have been playing a significant role in the economy of our country. Proximate compositions of seeds, aerial parts and roots of amla (Emblica officinalis), Bahera (Terminalia belerica) and Harad (Terminalia chebula) of indigenous origin were determined. The mineral contents [Iron (Fe), Copper (Cu), Zinc (Zn) and Manganese (Mn)] from the fruit pulp of these plants were determined. The moisture
content (%), crude fat (%), ash (%), crude protein (%), crude fibre (%) and total carbohydrates (%) were evaluated in the proximate composition. It was found that the overall proximate composition in seeds was highest when compared to aerial parts and roots. Therefore, fruits of Amla, Bahera and Harad have good nutritional value and hold their potential for nutraceutical development.
Keywords: Medicinal plants, Micronutrients, Modern, Traditional
INTRODUCTION
ver the past decade, herbal medicine has
become a topic of global importance, making an
impact on both world health and international trade.
Among ancient civilizations, India has been known
to be rich repository of medicinal plants. The forest
in India is the principal repository of large number of
medicinal and aromatic plants, which are largely collected as raw materials for manufacture of drugs
and perfumery products. About 8,000 herbal
remedies have been codified in AYUSH systems in
INDIA. Ayurveda, Unani, Siddha and Folk (tribal)
medicines are the major systems of indigenous
medicines. Among these systems, Ayurveda and
Unani Medicine are most developed and widely
practiced in India. Recently, WHO (World Health
Organization) estimated that 80 percent of people
worldwide rely on herbal medicines for some aspect
of their primary health care needs. According to WHO, around 21,000 plant species have the potential
for being used as medicinal plants.
Medicinal plants continue to play a vital role in the
healthcare system of large proportions of the world’s
population [1]. Different herbs are obtained from
different parts of the plant they may come from
roots, leaves, barks, seeds or flowers of a plant [2].
Triphala is a widespread polyherbal drug, which has
been used to treat a number of diseases in the
traditional systems since the ancient times. Triphala
is a composite mixture of three herbs Amalaki
(Emblica officinalis), Haritaki (Terminalia chebula) and Vibhitaki (Terminalia belerica) also known as
the ‘three myrobalans’. Emblica officinalis Gaertn.
belongs to Euphorbiaceae, and Terminalia chebula
Retz. Terminalia belerica belongs to Combretaceae
family.
Different parts of Terminalia chebula Retz,
Terminalia belerica Roxb, and Emblica officinalis
Gaertn are widely used in the Indian traditional
system of medicine [3]. The half ripe fruit of T.
belerica and the pericarp of T. chebula fruit were
reported to be purgative [3]. The fruit of T. chebula
was traditionally used to cure asthma, urinary disorders, heart disease and it has cardiotonic activity
[4,5]. In Ayurveda, the fruit of E. officinalis is used
as a cardiotonic, cerebral and intestinal tonic [6], and
it is also reported to have anticancer properties [7,6].
The fruit of E. officinalis is a rich source of vitamin
C, a well-known antioxidant [8]. The crude extract of
E. officinalis was reported to counteract the
hepatotoxic and renotoxic effects of metals [7] due to
antioxidant properties.
Emblica officinalis is commonly called the ‘Indian
gooseberry’. It belongs to the family Euphorbiaceae, and is known as Amla in Hindi, and Amalaki in
Sanskrit. It is a small to medium-sized tree with a
crooked trunk and spreading branches, and grayish-
green bark that peels off in flakes. The branchlets are
glabrous or finely pubescent, 10–20 cm long, usually
deciduous, with the leaves simple, subsessile, and
closely set along the branchlets. The leaves are light
green, resembling pinnate leaves. The flowers are
greenish-yellow, born in axillary fascicles, and give
way to globose fruit. The fruits are depressed globose
in shape, 1–2.5 cm in diameter, fleshy, and obscurely
six-lobed, containing six trigonous seeds. They are green when unripe, and turn light yellow or brick red
when mature.
O
RESEARCH ARTICLE
Page 37
224 TAMANNA MALIK, V.K. MADAN AND TANYA DHANDA
Terminalia chebula is a medium to large deciduous
tree growing to 30 m (98 ft) tall, with a trunk up to 1
m (3 ft 3 in) in diameter. The leaves are alternate to
sub opposite in arrangement, oval, 7–8 cm (2.8–3.1
in) long and 4.5–10 cm (1.8–3.9 in) broad with a 1–3
cm (0.39–1.18 in) petiole. They have an acute tip, cordate at the base, margins entire, glabrous above
with a yellowish pubescence below. The fruit is
drupe-like, 2–4.5 cm (0.79–1.77 in) long and 1.2–2.5
cm (0.47–0.98 in) broad, blackish, with five
longitudinal ridges. The dull white to yellow flowers
are monoecious, and have a strong, unpleasant odor.
They are borne in terminal spikes or short panicles.
The fruits are smooth ellipsoid to ovoid drupes,
yellow to orange-brown in colour, with a single
angled stone.
Terminalia belerica (Gaertn.) Roxb. leaves are about
15 cm long and crowded toward the ends of the branches. It is considered a good fodder for cattle.
Terminalia belerica seeds have an oil content of 40%,
whose fatty-acid methyl ester meets all of the major
biodiesel requirements in the USA, Germany and
European Union. The seeds are called bedda nuts.
Triphala (in Sanskrit, tri = three and phala = fruits) is
another important Ayurvedic medicinal preparation
comprising three fruits: Phyllanthus emblica or
Emblica officinalis, Terminalia chebula, and
Terminalia belerica. Triphala is one of the most
well-studied Ayurvedic formulations, and experiments have shown it to possess antibacterial,
antifungal, free radical scavenging, antioxidant, anti-
inflammatory, laxative, antiarthritic, anticataleptic,
hypolipidemic, antihyperlipidimic, hepatoprotective,
anti-stress, antidiabetic, antimutagenic, anticancer,
chemopreventive, chemoprotective, radioprotective,
and immunomodulatory properties.
Although, the medicinal properties and presence of
antioxidants in these plant products are well
recognized, data with regard to their chemical
composition is scanty. It is necessary to evaluate the
proximate and nutraceutical composition of those plants in addition to their components that promote
health care. So, this present study is aimed to assess
the proximate composition and nutritional parameters
in different parts of Amla, Bahera and Harad viz.
seeds, aerial parts and roots.
MATERIALS AND METHODS
Apparatus used: In the present studies, the
apparatus used are Spatula, Filter Paper, Water
bath, Oven, Beaker, Test tubes, Sieve, Funnel, Measuring cylinder, Soxhlet Extraction unit,
Hand grinder, Sample bottle, Detergent, Wash
Bottle, Aluminium foil etc.
Sample collection: The different parts of were
Amla, Bahera and Harad viz. seeds, aerial parts
and roots were procured from Chaudhary Charan
Singh Haryana Agricultural University, Hisar.
Sterilization of glass wares: All glass wares
used during the experimental investigation were
washed properly with detergent, rinsed with
distilled water and air dried. They were also then
sterilized in hot air oven by wrapping with
Aluminium foil. Sample preparation: The procured plant
samples were dried under shade and grinded into
fine powder followed by transferring to airtight
containers with proper labelling for future use.
Proximate analysis: The proximate analysis
(moisture, crude fibre, ash, crude fat, crude
protein and Total carbohydrates) of all the
samples were determined in triplicates as per the
standard technique of AOAC.
Estimation of moisture content
The dried powdered samples (seed, aerial parts and
roots) of Amla, Bahera and Harad (2g each) were taken in triplicates and dried initially at lower
temperature (80-90°C) and finally at higher
temperature (100-102°C) then weight of dried
samples was noted until constant weights were
obtained. The moisture content (%) was estimated
using the formula as follows:
Moisture content (%) =
Wt. of fresh plant part – Wt. of dry plant part
X 100
Wt. of fresh plant part
Estimation of crude fat content The dried powdered samples (seed, aerial parts and
roots) of Amla, Bahera and Harad (2g each) were
taken in a thimble and placed in a Soxhlet extractor.
Approximately 150-175 ml of petroleum ether was
added up to one and a half siphons in a dried and pre-
weighed round bottom flask connected to soxhlet
assembly. The extraction was carried as long as for
8h. After extraction, weight of the round bottomed
flask along with the extract was determined again
when almost all the petroleum ether gets evaporated
from RB flask upon heating. The crude fat contents
(%) were calculated as follows:
Crude Fat content % = Weight of fat
Weight of sample ×100
Estimation of ash content In a pre-weighed and ignited crucibles, the powdered
samples (seed, aerial parts and roots) of Amla,
Bahera and Harad (2g each) were transferred and
placed in a muffle furnace (pre-heated 600°C). The crucibles having samples were placed directly from
the furnace into a desiccator, and weight was taken
after cooling. The formula for ash contents (%) is as
follows:
Ash content % = Weight of ash
Initial weight of sample×100
Estimation of Crude protein content
The conventional microkjeldahl’s method was
adopted for the estimation of Crude protein content.
Multiplication % of N with the factor of 6.25 is done
for calculating crude protein.
Page 38
JOURNAL OF PLANT DEVELOPMENT SCIENCES VOL. 12(4) 225
Reagents
Digestion mixture: sulphuric acid and perchloric
acid were mixed in the ratio of 9:1.
N/100 sulphuric acid
N/100 sodium hydroxide
40% sodium hydroxide
Methyl red indicator
Method 100 mg of sample was taken in 100 mL micro-
kjeldahl’s digestion flask. (9:1) K2SO4 ∶ CuSO4
(⁓1g each) was added to it followed by 10 mL conc.
sulphuric acid. Continuous heating was done to
obtain clear solution. The flask was cooled and the
sample contents were diluted and final volume was
made upto 100 mL with double distilled water. 5 mL
aliquots of the digest were transferred to conical flask. 10 mL of N/100 sulphuric acid was taken in
the receiving flask. Then, 10 mL of the digested
sample was transferred to the steam chamber of the
apparatus followed by the addition of 10 mL of 40%
NaOH. Ammonia was distilled till 30-40 mL of
distillate was collected in the receiving flask. The
contents in the receiving flask were titrated against
N/100 NaOH and volume of NaOH used was noted.
The end point was reached when colour changed
from pink to yellow. The titration is performed with
the blank under the identical conditions.
Calculations Amount of nitrogen (%) = A-B
Where, A = Volume of NaOH used for blank
B = Volume of NaOH used for sample
Crude Protein content (%) in sample = Nitrogen
content in sample × 6.25
Crude fibre content
The modified method of Maynard (1970) was
followed for the estimation of crude fibre content
(%).
Reagents
1) 1.25% Sulphuric acid 2) 1.25% Sodium hydroxide
Method
The powdered sample (seed, aerial parts and roots) of
Amla, Bahera and Harad (2g each) was weighed and
transferred to a clean one litre beaker and added 200
mL of 1.25% (w/v) sulphuric acid. For heating, hot
plate was used to place the beaker and the contents
were allowed to reflux for 30 minutes’ time was
noted from onset of boiling and shaking is done after
every 5 min. After 30 min beaker was removed from
hot plate and filtration was performed using suction
through a muslin cloth. Washing of the residue was done with hot water till it became free from acid,
then the material was transferred to the same beaker
and after the addition of 200 mL of 1.25% NaOH
solution, the contents were again refluxed for 30 min.
It was followed by the filtration again through muslin
cloth with the help of suction pump and to free the
residue from alkali, it was washed with hot water and
then transferred to a crucible and placed in hot air
oven, allowed to dry to constant weight at 80-110°C
and recorded its weight. The residue was ignited in
muffle furnace at 550-660°C for 2-3 h, then cooled
and weighed again. The loss of weight due to
ignition is weight of crude fibre.
100sample of wt.Original
fibre crude of Wt. (%)content fibre Crude
Total carbohydrates content
The difference is used for the calculation of Total
carbohydrates content as follows:
Total carbohydrates content (%) =
100 – [Moisture (%) + Crude Fat (%) + Ash (%) +
Crude Protein (%) + Crude fibre (%)]
Minerals content
Reagents 1) Diacid mixture: HNO3: HClO4 (4:1) just before use.
2) Hydrochloric mixture (1%): Conc. HCl (1 ml) in
50 mL distilled water and Distilled water was used in
making Vfinal as 100 mL.
Method The powdered sample of fruit pulp of Amla, Bahera
and Harad (⁓1g) was digested with 15 mL of di-acid
mixture (4HNO3:1HClO4) in a conical flask by
heating on hot plate in open space till clear white
precipitates settled down at bottom of conical flask.
The precipitates were dissolved in 1% HCl prepared by dilution with double distilled water, filtered and
Vfinal of filterate was made 50 mL using double
distilled water.
RESULTS AND DISCUSSION
Proximate composition
Moisture content
The statistics of moisture content in different parts of
Amla, Bahera and Harad is given in Table 4.1.
Moisture content in seeds, aerial parts and roots of Amla was 34.12, 7.85 and 5.36%, respectively.
Moisture content in seeds, aerial parts and roots of
Bahera was 32.35, 7.64 and 4.48%, respectively. The
corresponding values of moisture content in Harad
were 17.27, 7.58 and 3.28%, respectively.
Crude Fat content The data of crude fat content in different parts of
Amla, Bahera and Harad is given in Table 1. Fat
content in seeds, aerial parts and roots of Amla was
2.95, 1.10 and 0.19%, respectively. Fat content in
seeds, aerial parts and roots of Bahera was 3.44, 0.55
and 4.23%, respectively. The corresponding values of fat content in Harad were 2.97, 1.40 and 0.58%,
respectively.
Ash content
The data of ash content in different parts of Amla,
Bahera and Harad is given in Table 1. Ash content in
seeds, aerial parts and roots of Amla was 11.28, 3.75
and 4.78%, respectively. Ash content in seeds, aerial
parts and roots of Bahera was 11.75, 2.75 and 0.84%,
respectively. The corresponding values of ash
Page 39
226 TAMANNA MALIK, V.K. MADAN AND TANYA DHANDA
content in Harad were 8.56, 2.61 and 3.48%,
respectively.
Crude Protein content The data of crude protein content in different parts of
Amla, Bahera and Harad is given in Table 1. Crude
Protein content in seeds, aerial parts and roots of Amla was 10.39, 13.93 and 7.63%, respectively.
Protein content in seeds, aerial parts and roots of
Bahera was 18.29, 3.17 and 1.71%, respectively. The
corresponding values of crude protein content in
Harad were 18.45, 3.70 and 2.24%, respectively.
Crude fibre content
The data of crude fibre content in different parts of
Amla, Bahera and Harad is given in Table 1. Crude
fibre content in seeds, aerial parts and roots of Amla
was 5.23, 33.45 and 36.22%, respectively. Crude
fibre content in seeds, aerial parts and roots of
Bahera was 14.84, 42.85 and 43.57%, respectively.
The corresponding values of crude fibre content in
Harad were 16.45, 48.62 and 40.67%, respectively
Total carbohydrates content The data of total carbohydrates content in different
parts of Amla, Bahera and Harad is given in Table 1.
Total carbohydrates content in seeds, aerial parts and
roots of Amla was 35.98, 40.42 and 45.30%,
respectively. Total carbohydrates content in seeds,
aerial parts and roots of Bahera was 19.30, 43.23 and
49.22%, respectively. The corresponding values of
total carbohydrates content in Harad were 36.31,
43.49 and 49.76%, respectively.
Page 40
JOURNAL OF PLANT DEVELOPMENT SCIENCES VOL. 12(4) 227
Fig. 1. Proximate composition in different parts of Amla, Bahera and Harad
Table 1. Proximate composition in different parts of Amla, Bahera and Harad
Plant Parameter Seeds Aerial Parts Roots
AMLA
Moisture (%) 34.12 ± 0.1 7.85±0.03 5.36±0.01
Crude Fat (%) 2.95 ± 0.03 1.10±0.003 0.70±0.06
Ash (%) 11.28 ±0.01 3.25±0.01 4.78±0.01
Crude Protein (%) 10.39±0.02 13.93±0.02 7.63±0.01
Crude fibre (%) 5.23±0.02 33.45±0.01 36.22±0.02
Total Carbohydrates (%) 35.98±0.10 40.42±0.04 45.30±0.01
BAHERA
Moisture (%) 32.35 ± 0.03 7.64±0.02 4.48±0.01
Crude Fat (%) 3.44 ± 0.01 0.55±0.01 0.19±0.01
Ash (%) 11.75±0.01 2.56±0.02 0.84±0.01
Crude Protein (%) 18.29±0.02 3.17±0.02 1.71±0.01
Crude fibre (%) 14.84±0.02 42.85±0.01 43.57±0.01
Total Carbohydrates (%) 19.3±0.04 43.23±0.02 49.22±0.03
HARAD
Moisture (%) 17.27± 0.01 7.58±0.02 3.28±0.01
Crude Fat (%) 2.97 ± 0.01 1.40±0.11 0.577±0.01
Ash (%) 8.56±0.003 2.61±0.01 3.48±0.01
Crude Protein (%) 18.45±0.03 3.70±0.01 2.24±0.01
Crude fibre (%) 16.45±0.02 48.62±0.01 40.67±0.01
Total Carbohydrates (%) 36.31±0.02 43.49±0.03 49.76±0.02
The above mentioned plants were selected to
compare the proximate parameters and
micronutrients composition. Since many of these
herbal products are used orally, therefore, to know
proximate and nutrient analysis of these products and
raw material used therein plays a crucial role in
assessing nutritional significance and health effects [9-11]. The result of proximate analysis shows
variant concentration/proportions of bio-chemicals
and other contents. The difference found in the
proportion of proximate parameter of these medicinal
plants might be attributed to the conditions on which
the plant species are harvested along with
environmental parameters [12,13].
Mineral composition
Iron (Fe) content
The data of Fe content in fruit pulp of Amla, Bahera
and Hard is given in Table 2. Fe content in the fruit
pulp of Amla, Bahera and Harad was 62.13, 220.53
and 30.05 ppm, respectively.
Copper (Cu) content
The data of Cu content in fruit pulp of Amla, Bahera
and Harad is given in Table 2. Cu content in the fruit
pulp of Amla, Bahera and Harad was 5.94, 6.37 and
7.33 ppm, respectively.
Zinc (Zn) content
The data of Zn content in the fruit pulp of Amla,
Bahera and Harad is given in Table 2. Zn content in
the fruit pulp of Amla, Bahera and Harad was 38.04,
32.87 and 20.18 ppm, respectively.
Manganese (Mn) content
The data of Mn content in the fruit pulp of Amla,
Bahera and Harad is given in Table 2. Mn content in
the fruit pulp of Amla, Bahera and Harad was
204.74, 50.38 and 34.57 ppm, respectively.
Page 41
228 TAMANNA MALIK, V.K. MADAN AND TANYA DHANDA
Table 2. Minerals content (ppm) in the fruit pulp of Amla, Bahera and Harad
Plant
part
Minerals
Plants
Mineral content (ppm)
Amla Bahera Harad
Fruit
Fe 62.13 ±0.04 220.53 ± 0.238 30.05±0.019
Cu 5.94 ± 0.052 6.37 ± 0.120 7.33±0.145
Zn 38.04±0.012 32.87±0.291 20.18±0.007
Mn 204.74 ± 0.15 50.38± 0.01 34.57±0.088
SE(m) 0.09 0.225 0.085
CD at 5% 0.316 0.795 0.301
CV% 0.20 0.503 0.642
SE(d) 0.13 0.319 0.121
Fig. 2. Minerals content (ppm) in the fruit pulp of Amla, Bahera and Harad
The mineral content analysis of the medicinal plant
species showed considerable variation among
different micronutrients. However, for some species
difference or higher concentration was recorded,
which may be due to prevailing environmental and
soil conditions and the season when the plants were
collected for analysis [13-15].
CONCLUDING RESULTS
Trends in Proximate Composition
Parameter Order
Moisture (%) Amla>Bahera>Harad (Seeds>Aerial parts> Roots)
Crude Fat (%) Bahera>Harad>Amla (Seeds>Aerial parts> Roots)
Ash (%) Bahera>Amla> Harad (Seeds>Roots>Aerial parts)
Crude Protein (%) Harad>Bahera>Amla (Seeds>Aerial parts> Roots)
Crude Fibre (%) Harad>Bahera>Amla (Roots>Aerial parts> Seeds)
Total Carbohydrates (%) Harad>Amla>Bahera (Seeds>Aerial parts> Roots)
Page 42
JOURNAL OF PLANT DEVELOPMENT SCIENCES VOL. 12(4) 229
Trends in Minerals Composition
CONCLUSION
Different parts of these medicinal plants namely
Amla, Bahera and Harad were analyzed in order to
get some useful information to be used in the
preparation of therapeutic and nutraceutical foods.
As there are no chief reports in literature on detailed
proximate composition and nutritional parameters of medicinal plants’ parts, this paper should be
considered as a contribution to the course, being, a
far from the knowledge for the active constituents
formation from these medicinal parts of herbal
plants.
ACKNOWLEDGEMENT
We are thankful to CSIR, New Delhi for providing
the financial support and help during the research
work.
REFERENCES
[1] Koduru, S., Grierson, D.S. and Afolayan, A.J. (2007). Ethnobotanical information of medicinal
plants used for treatment of cancer in the Eastern
Cape Province, South Africa. Current Science, 92(7),
906-908.
[2] Singh, G., Choudhary, P., Yaqoob, S.A. and
Rawat, R.S. (2016). Antibacterial and antioxidant
activity of Triphala extracts. International Journal of
Current Research, 8(09), 38335-38348. [3] Chopra RN, Nayar SL, Chopra IC (1956).
Glossary of Indian Medicinal Plants. CSIR, New
Delhi, India:106. 241, 242.
[4] Reddy VRC, Kumari SVR, Reddy BM, Azeem
MA, Prabhakar MC, Appa Rao AVN (1990).
Cardiotonic activity of the fruit of Terminalia
chebula. Fitoterapia, LXI:517-525.
[5] Lee, H.S., Won, N.H., Kim, K.H., Lee, H., Jun,
W. and Lee, K.W. (2005). Antioxidant effects of
aqueous extract of Terminalia chebula in vivo and in
vitro. Biol Pharm Bull, 28:1639-1644.
[6] Aslokar, L., Kakkar, K.K. and Chakre, O.J. (1992). Supplement to Glossary of Indian Medicinal
Plants with Active Principles. Directorate CSIR, New
Delhi, India:291-293.
[7] Rajarama, Rao, M.R. and Siddiqui, H.H. (1964). Pharmacological studies on Emblica
officinalis Gaetn. Indian Exp BioI, 2:29-31.
[8] Halliwell, B. and Gutteridge, J.M.C. (1985). Free radicals, ageing and disease. In Free Radicals in
Biology and Medicine Clarendon: Oxford;279-315.
[9] Kochhar, A., Nagi, M. and Sachdeva, R. (2006). Proximate Composition, Available
Carbohydrates, Dietary Fibre and Anti Nutritional
Factors of Selected Traditional Medicinal Plants. J.
Hum. Ecol., 19(3): 195-199.
[10] Pandey, M., Abidi, A.B., Singh, S. and Singh,
R.P. (2006). Nutritional Evaluation of Leafy
Vegetable Paratha J. Hum. Ecol. 19 (2): 155-156
[11] Taiga, A., Suleiman, M.N., Aina, D.O., Sule, W.F. and Alege, G.O. (2008). Proximate analysis of
some dry season vegetables in Anyigba, Kogi State,
Nigeria. Afr. J. Biotechnol. 7(10): 1588-1590.
[12] Nordeide, M.B., Hatloy, A., Folling, M., Lied,
E. and Oshaug, A. (1996). Nutrient composition and
nutritional importance of green leaves and wild food
resources in an agricultural district, Koutiala, in
southern Mali. Int. J. Food Sci. Nutr., 47: 455–478.
[13] Kutbay, H.G. and Ok, T. (2001). Foliar N and
P resorbtion and nutrient levels along an elevational
gradient Zelkova carpinifolia (Pall.) C. Koch subsp.
Yomraensis. Ann. Agric. Bio. Res., 6:1-8. [14] Patterson, E. (1996). Standardized extracts:
herbal medicine of the future? Herb Market Rev. 2:
37-8.
[15] Odebunmi, E.O., Oluwaniyi, O.O., Awolola,
G.V. and Adediji, O.D. (2009). Proximate and
nutritional composition of kola nut (Colanitida),
bitter cola (Garcinia cola) and alligator pepper
(Afromomum melegueta). Afr. J. Biotech., 8 (2): 308-
310.
Minerals composition Order
Fe content (ppm) Bahera>Amla>Harad
Cu Content(ppm) Harad>Bahera>Amla
Zn Content (ppm) Amla>Bahera>Harad
Mn Content (ppm) Amla>Bahera>Harad
Page 43
230 TAMANNA MALIK, V.K. MADAN AND TANYA DHANDA
Page 44
*Corresponding Author
________________________________________________ Journal of Plant Development Sciences Vol. 12(4): 231-237. 2020
VALIDATION OF MAS DERIVED LINES FOR INTROGRESSED GENE AGAINST
BLAST AND BLB RESISTANCEIN SOUTHERN CHHATTISGARH
Prafull Kumar*
S.G. College of Agriculture and research Station, Jagdalpur, IGKV, Raipur, Chhattisgarh
Email: [email protected]
Received-07.04.2020, Revised-29.04.2020
Abstract: The experiment was carried out at SGCARS, Jagdalpur, IGKV Raipur, Chhattisgarh to validate Marker Assisted Selection (MAS) derived genotypes, from ICAR-IIRR, Hyderabad, against blast and bacterial leaf blight resistance and access recurrent parent recovery. BPT 5204 (Samba Mahsuri) the recurrent parent 01 (RP 1) for the four test genotype recorded average plot yield of 4.00 kg/ha placing second in the experiment. When the recurrent parent 02 (Improved Sambha Mahsuri) was taken into account, genotype RP-Patho-1-2-15 recorded higher plot yield (4.23 kg). RP-Patho-1-2-15 and RP-Patho-3-56-11 were similar to the recurrent parent with heading spanof 78 and 79 DAS accordingly while RP-Patho-3-73-6
was six days in advance (70 days) to the recurrent parent (76 days). The entire test Near Isogenic Lines (NILs) with a plant height of 79-85 cm were similar to the recurrent parent (82 cm). Blast and bacterial leaf blight resistance gene carrying genotypes RP-Patho-2-18-5 and RP-Patho-2-16-4gave plot grain yield 3.77kg, which out yielded recurrent parent 02 but lesser than recurrent parent 01.Incidence of blast reported in Tetep (1-2%), C 101 LAC (8-10%)and average (5-8%) in all NILs.Blast resistance genes Pi 1 carrying genotypes RP-Patho-1-2-15 and RP-Patho-1-6-5, the infestation the comparatively higher (Score 6) than those with Pi 54 (RP-Patho-3-56-11 and RP-Patho-3-73-6, RP-Patho-3-56-11 and RP-Patho-3-73-6 (Score 4). However, dual genetic resistance background i.e. blast and bacterial blight resistance genes Xa 21+ Pi-54, provided excellent resistance even in hot spot centre for the disease. There was noincidence of Bacterial Leaf Blight (BLB)in
all the isogenic line including donor and recurrent parents which may because of plant defence system or incompatible environmental condition for disease prevalence. Keywords: NILs, Marker Assisted Selection, Recurrent parent, Blast, Bacterial Leaf Blight
INTRODUCTION
ice (Oryza sativa L.) is one of the vital
cultivated crop, which provides food for more
than half of the world’s population and constitutes a major source of calories for urban and rural
inhabitants (Singh et al., 2015,Kumar et al., 2015a),
regrettably, whose production is constrained by
substantial number of fungal, bacterial and viral
origin diseases. Rice blast (caused by
Magnaporthegrisea) and bacterial leaf blight (BLB,
caused by Xanthomonas oryzaepv. Oryzae, Xoo) are
two most destructive diseases leading to severe yield
losses in rice production worldwide (Zhan et al.,
2012). Bacterial leaf blight (BLB) is one of the most
devastating diseases affecting entire rice acreages
and causes severe yield losses of up to 74-81% depending upon crop stage, cultivar susceptibility
index and the environmental phenomenon
(Srinivasan et al., 2005). Rice blast, caused by the
filamentous ascomycete fungus Magnaportheoryzae
(anamorph Pyriculariaoryzae), is another major
threats for rice production and leads to significant
yield loss, as high as 70–80% during an epidemic
(Khushet al., 2009).The most effective approach to
prevent the two diseases is the genetic improvement
using resistant varieties however, narrow genetic
diversity in existing gene pool is problematic in breeding for adaption to these major biotic stresses
(Sattariet al., 2014). Therefore, exploitation of host
plant resistance is emerging as most effective,
economical and environmentally safe measure for
controlling paddy blast and bacterial leaf blight in
combination with pathological management. So far,
73 blast resistance genes and 31 BLB resistance
genes have been identified (Balliniet al, 2008,
Ruanet al., 2008, Cheema et al., 2008, Sujatha et al., 2011) and some of them have been incorporated into
modern rice varieties (Sundaram et al., 2008, 2009)
through marker assisted selection (MAS).Among
these, few genes like Pi-1, Pi-2, Pi-9, Pi-54 etc. (for
blast resistance) and Xa5, Xa 13,Xa21, etc. (for
bacterial leaf blight resistance) are being extensively
used in ricebreeding programmes globally as are
highly effective and having tightly linked molecular
markers.
Marker Assisted Backcross Selection (MABS) has
previously been used in rice breeding toincorporate
Sub1gene of mega-variety Swarna to a submergencetolerant variety and IR64SUB1 for
developing a newsubmergence tolerant rice variety
ASS996-SUB1(Neerajaet al. 2007, Septiningsihet al.
2009, Luuetal. 2012). It was also used to
incorporatebadh2 and Wxgene from Basmati into
Manawthukha for cookingquality parameters (Yi et
al. 2009), and Pup1 under Phosphorus
deficientlowland/irrigated conditions into
SituBagendit and Batur (Chin et al. 2011). Rice
salttolerance on BT7 cultivar, FL478 was used as a
donorparent of SaltolQTL (Linh et al. 2012) and threeresistance genes (Xa4 + xa5 + Xa21) to bacterial
leafblight were transferred from an indica donor
(IRBB57)to Korean rice Mangeumbyeo (Suh et al.
2013). More recently Fatimah et al., (2014)
R
RESEARCH ARTICLE
Page 45
232 PRAFULL KUMAR
successfully transferred hd2genein rice for early
heading date.With these background, some of
theICAR-IIRR (Formerly DRR) Hyderabad
developed MAS breeding lines, obtained under
AICRIP programme, possessing high level of
resistance against blast (conferred by Pi1 or Pi54) and bacterialblight (conferred by Xa21) was
evaluated for trait verification and for substantial
equivalence with the recurrent parents in southern
Chhattisgarh province.
MATERIALS AND METHODS
The Study Material
The breeding materials were obtained from Indian
Institute of Rice Research, (ICAR-IIRR, formerly
DRR), Hyderabad under AICRIP programme in
Advanced Varietal Trial 01- Near Isogenic Lines (AVT-1-NILs). The trial was constituted with 6 test
entries, 2 recurrentparents and 2 donor parents. Entry
RP-Patho-1-2-15 and RP-Patho-1-6-5 possess Pi-1,
resistant to leaf blast. Entry RP-Patho-3-56-11 and
RP-Patho-3-73-6 possess Pi-54, conferring resistance
to leaf blast(DRR, 2014). Entry RP-Patho-2-18-5 and
RP-Patho-2-16-4were derived from backcross
between Improved Samba Mahsuri(recurrent parent)
and Tetep (donor parent) possessing combined
resistance to leaf blastand bacterial leaf blight as they
possess the resistance genes Pi-54 and Xa21 respectively(DRR, 2014, Table 01).
Experiment Conduction and Statistical Analysis
The trireplicated field experiment was conducted at
Rice Research Block of S. G. College of Agriculture
and Research Station, Jagdalpur, Chhattisgarh, India
in Kharif 2013-14 with 5x2.6m (Net plot) plot size,
Randomized Complete Block Design. Standard
agronomic package was followed to raise the crop.
Restriction selection indice was constructed based on
previous research review and four quantitative
parameters were selected for genetic evaluation. The
observation was recorded on net plot basis (heading date and plot yield), unit plot basis (panicles/sq M)
and arithmetic mean basis among random
selections.Days to 50 percent flowering was recorded
when half of plant flowered among the plot. Panicle
count was made with one square meter square at
maturity. The disease scoring was made
visually giving the score 1-9. Statistical analysis was
done with SPARK 2.
RESULTS AND DISCUSSION
Rice is oldest domesticated cereal crop imparting diet
to three billions globally (Shrivastava et al., 2014) of
which irrigated rice account for 55 percent of area
and 75 percent of production (Kumar et al., 2015b).
Era of input oriented agriculture and changing
climate have led this important crop susceptible to
many diseases mainly Blast and BLB and scenario
became more critical when narrowed crop genetic
base and expending pathogen biotype failed the
monogenic plant breeding approach.Recently,
pyramiding of more than one major resistance gene
has been proven to deliver durable resistance
(Rajpurohitet al., 2010).Since, conventional breeding
tools are inefficient for gene pyramiding, particularly in recessively inherited resistance, such as xa5 and
xa13, marker assisted selection (MAS) enables to
address these limitations by the evaluation of the
expression status of resistance gene(s).
Genotypic response referring to Recurrent and
Donor parent
The test entries were evaluated at Jagdalpur centre,
hot spot location for rice blast disease, under natural
field conditions. The experimental yield ranged from
2.67kg/plot(Improved sambhaMahsuri) to 4.23/plot
(RP-Patho-1-2-15). The Recurrent parent 01 (BPT
5204) was the earliest to flower with 50% flowering in 91 DASfollowed by donor parent 01 (92 DAS)
while RP-Patho-1-2-15 and RP-Patho-3-73-6
recorded to be late flowering genotypes with 113
DAS days to 50 percent flowering. The experimental
mean for blooming period was 101 DAS. RP-Patho-
3-73-6, BPT 5204 and RP-Patho-1-2-15 were short
in plant height (70, 76 and 78cms respectively) while
Tetep was recorded to be tallest (115cms) (Table 02)
whereas, the mean plant height was reported to be
84.5 cms. Panicles count wassignificantly higher for
BPT 5204, RP-Patho-3-73-11 and RP-Patho-1-6-5 (348, 324 and 312 correspondingly) while RP-Patho-
1-2-15 and Tetep exhibited comparative lower count.
The grain yield was in perfect direction with panicles
number. BPT 5204 (Samba Mahsuri) the recurrent
parent 1 (RP 1) for the four test genotype
recordedaverageplot yield of 4.00 kg/ha placing
second in the experiment. None of the entry recorded
on par with recurrent parent 01 statically however, all
the genotypes no significant difference was observed
with respect to grain yield. When the recurrent parent
02 (Improved Sambha Mahsuri) was taken into
account, genotype RP-Patho-1-2-15 recorded higher plot yield (4.23 kg) and was at par. Flowering
duration wise, RP-Patho-1-2-15 and RP-Patho-3-56-
11 were similar to the recurrent parent with
flowering of 78 and 79 DAS accordingly while RP-
Patho-3-73-6 was six daysin advance (70 days) to the
recurrentparent (76 days). All the test isogenic lines
with a plant height of 79-85 cm were similar to
therecurrent parent (82 cm).Blast and bacterial leaf
blight resistance gene carrying genotypes RP-Patho-
2-18-5 and RP-Patho-2-16-4gave plot grain yield
3.77kg, which out yielded recurrent parent 02 but lesser than recurrent parent 01. However flowering
was delayed (96 DAS and 99 DAS) and plant height
was increased in both the isogenic lines (83cms and
81 cms). The same trend was continued with panicle
count. The donor lines Tetep (DP 1) and C 101 LAC
(DP 2) showed optimal adaption to Southern
Chhattisgarh rice growing ecology. Average plant
height of Tetep was 91 cms and attained 50 percent
Page 46
JOURNAL OF PLANT DEVELOPMENT SCIENCES VOL. 12(4) 233
flowering by 98 DAS. Since vegetative span was
lengthened, panicle count (300) and plot yield also
increased accordingly (3.43). Taking into
accountanother donor parent (Tetep), it exhibited
faster growth rate and attained 115cms plant height
by 92 DAS of preflowering period. Compare to DP 2produced lesser panicle population (264) and plot
grain yield (3.15kg).
Resistance breeding by deploying target genes has
always been a topic of interest and intense research
for breeders and molecular biologist (Sundramet al.,
2008, Zhan et al., 2012). Pyramiding major genes to
enhance resistance spectrum in commercial cultivars
has been proven by many workers (Hittalmaniet al,
2000, Chen et al, 2001, Zhan and Cheng, 2001,
Narayanan et al, 2002, 2004, Joseph et al, 2004,
Neerja et al., 2007, Chen et al., 2008, 2009, Fujita et
al., 2010).Marker-assisted selection for genes and disease evaluation for genetic verification can be
conducted in laboratory conditions during seedling
stage at first followed by field evaluation to access
the environmental play. The subsequent selection for
complex quantitative traits such as combining ability,
grain qualityand grain yield can be carried out in the
fields during heading and maturity stage. Combined
laboratory and field evaluation at early and late
stages make MAS breeding more efficient and
assured than conventional breeding (Zhan et al.,
2012). Once disease resistance genes are standardised by MAS, rice breeding can be focused
on combining and restoring the agronomic traits
(Lang et al., 2008, Pinta et al., 2013). The biphasic
selection in breeding programmeis promising to
overcome the defects of conventional hybridization
breeding in which restorer genes and resistance genes
usually have low recombinant frequency (Cao et al.,
2003) that requires immense effort to identify the
individuals combining both the resistance and
restoring ability in research programme.
Scoring for Blast and Bacterial Leaf Blight
Morphologically all the isogenic lines were parallel to the respective recurrent parent, blast prevalence
was modest inboth Recurrent Parents. Incidence of
blast reported in Tetep (1-2%), C 101 LAC (8-10%),
all isogenic lines (5-8%).Blast resistance genes Pi 1
carrying genotypes RP-Patho-1-2-15 and RP-Patho-
1-6-5, the infestation the comparatively higher (Score
6) however those with Pi 54 (RP-Patho-3-56-11 and
RP-Patho-3-73-6). Similarly RP-Patho-3-56-11 and
RP-Patho-3-73-6, having the blast resistance gene,
(Pi 54) showed average disease incidence (Score 4).
However, dual genetic resistance background i.e. both blast and bacterial blight resistance genes Xa
21+ Pi-54, provided excellent resistance even in hot
spot centre for the disease. In previous studies
multiple resistance gene pyramiding has been
reported by Chen et al., 2009 and Zhan et al., 2012.
In genotype RP-Patho-2-16-4 the disease was scaled
to be 01, which was quite similar to recurrent parent
02 (Improved Sambha Mahsuri). Visual evaluation of
donor parents revealed average disease incidence
(score 4).There was noincidence of Bacterial Leaf
Blightin all the isogenic line including donor and
recurrent parents which may because of plant
defence system or incompatible environmental
condition for disease prevalence.Plant adopts several strategies to defend against pathogens, including the
production of antibacterialchemicals, which are
either preformed (i.e. already present in plant tissue
in variableamounts) or induced following infection
(e.g. de novo synthesized phytoalexins) (Sattariet al.,
2014). Many of the phytoalexins or pre-formed
chemicals belong to the phenolic group (Latif, 2007).
Phenolic compounds are secondary metabolites
synthesized in plantsand play a role in plant defence
against pathogens through antimicrobial properties,
involvement in cell wall reinforcement, modulation
and induction of plant responses (Aly, 2002). Generally, when a plant is infected, its phenolic
content increases in response todefence reaction (Ma,
2002). In addition, biochemical resistance is another
complex but equally vital mechanism in plant
pathogen defence specifically accumulation of
peroxidase, catalase and other pathogenesis related
proteins.
Recovery of Recurrent Parent
Almost all the genotypes exhibited stable recovery of
one or both recurrent parents indicating stabilization
of population allelic recombination. Perusing radar chart of recurrent parent recovery (Fig 01)
reproductive behaviour were similar to BPT 5205
and Improved SambhaMahsuri for all genotypes
except RP-Patho-1-2-15 and RP-Patho-2-16-4 but it
may attribute to G x E interactions rather than
genetic segregation. Similarly, for above ground
plant canopy length all test genotypes were relatively
more closure to both the recurrent parents which
shows comparative expression of photosynthates
source sink balance in Near Isogenic Lines (NILs).
However, donor parent i.e. Tetep, plant height was
significantly higher might be due to regional quantitative adaptability. Looking for sink strength,
BPT 5205 recorded significantly higher potential of
dry matter accumulation than remaining population
due to genetic establishment in given environment.
Parallel observation was recorded for RP-Patho-3-
56-11, RP-Patho-3-73-6 and RP-Patho-2-18-5
showing potent leaf blast and bacterial leaf blight
resistance for Southern province of Chhattisgarh.
Ultimately, when crop yield was taken into account,
the normal distribution curve shifted towards the
recurrent parent 01 and the entire test entries lied between 1750 kg/ha to 3075 kg/ha. Summarily,
sustainable yield potential was realized despite of
target disease incidence all genotypes may be
considered as resistance genotypes.
The varietal improvement for resistance to major
prevalent and destructive diseases is necessary for
sustainable grain yield. Past attempts to achieve
Bacterial Leaf Blight (BLB) resistance is not very
Page 47
234 PRAFULL KUMAR
much encouraging, largely due to disease variability
level in growing areas (Sreewongchai, 2010).
Pyramiding disease resistant genes into a single
genetic background might be expected to give more
durable disease resistance, as more resistant genes
are incorporated into single genotypes (Koide, 2010).Till date, as many as 24 major genes of host
plant resistance which have been identified and used
in rice improvement programme (Rao, 2002).The
BLB resistance becomes quantitative when using
NILs with four resistance genes (R gene) (Xa4, xa5,
xa13, and Xa21) that express a higher level and more
durable resistance. Further, the resistant genes to
BLB, Xa4, and xa13, links to microsatellites markers
RM144 and RM122, respectively, and xa5 links to
STS marker (RG136) (Sattariet al., 2014).
CONCLUSION
Many disease resistant varieties have been developed
but they have not been widely adopted as tolerant
varieties lack many of desirable traits of the widely
grown mega varieties and hencereplacement of these
megavarieties with modern cultivars cannot be
possible.However, these megavarieties despite
having many agronomically desirablecharacters,
often susceptible to biotic and abiotic stress. With advances in molecular biology, breeding for
resistance genes has become wise and efficient
strategy in crop improvement. In present
investigation evaluation was made of DRR bred
materials for hot spot of paddy blast. All the
genotypes were similar to recurrent parent with
respect to flowering duration, canopy length, and plot
grain yield and disease reaction indicating the
recovery of crossed material to desired genetic
background after introgression of dual resistance
gene and equally and effectivelyeven in hot spot
centre for the disease. No incidence of bacterial leaf blight (BLB) was observed and the reason may be
excellent resistant source or environmental cause.
Table 1. Composition of Entries (Near Isogenic Lines) for Recurrent Parent Recovery Analysis (RPRA) S
No
Genotype Cross Combination Resistance Gene Grain
Type
01. RP-Patho-1-2-15 BPT 5204*2/C 101 LAC Blast Resistance Gene Pi-1 MS
02. RP-Patho-1-6-5 BPT 5204*2/C 101 LAC Blast Resistance Gene Pi-1 MS
03. RP-Patho-3-56-11 BPT 5204*2/ Tetep Blast Resistance Gene Pi-kh (Pi-54) MS
04. RP-Patho-3-73-6 BPT 5204*2/Tetep Blast Resistance Gene Pi-kh (Pi-54) MS
05. RP-Patho-2-18-5 Improved Sambha
Mahsuri/Tetep
Blast and Bacterial Blight Resistant Gene
Xa21+Pi-kh (Pi-54)
MS
06. RP-Patho-1-2-15 Improved Sambha
Mahsuri/Tetep
Blast and Bacterial Blight Resistant Gene
Xa21+Pi-kh (Pi-54)
MS
07. BPT 5204 Recurrent Parent 01(RP 01)
08. Improved Sambha
Mahsuri
Recurrent Parent 02 (RP 02)
09. Tetep Donor parent 01 (DP 01)
10. C 101 LAC Donor Parent 02 (DP 02)
Source: DRR Annual Report, 2014.
Table 2. Ancillary Traits Data following Restriction Selection Indices Plant Height (cm) Days to 50 percent Flowering Panicles/sqm Grain Yield/Plot
Mean SE Mean SE (±) Mean SE (±) Mean SE (±)
RP- Patho-1-2-15 78 4.98 113 0.88 257 12.42 4.23 0.15
RP- Patho-1-6-5 90 3.84 108 0.33 312 24.12 3.87 0.41
RP- Patho-3-56-11 79 4.33 113 0.83 324 12.2 3.7 0.3
RP- Patho-3-73-6 70 4.97 107 1.16 331 12.44 3.03 0.35
RP- Patho-2-18-5 83 4.33 99 0.88 286 7.26 3.87 0.26
RP- Patho-2-16-4 81 3.18 96 0.81 272 5.81 3.87 0.23
BPT 5204 (RP 1) 76 4.63 91 0.67 348 10.1 4 0.17
Improved Samba Mahsuri (RP 2) 82 2.72 94 0.58 276 8.95 2.67 0.09
Tetep (DP 1) 115 4.53 92 0.57 264 6.96 3.17 0.34
Page 48
JOURNAL OF PLANT DEVELOPMENT SCIENCES VOL. 12(4) 235
C 101 LAC (DP 2) 91 3.53 98 0.33 300 10.44 3.43 0.2
Critical Difference 8.74 2.39 37.54 0.68
Standard Error (difference) 4.13 1.13 17.73 0.32
Standard Error (mean) 2.92 0.79 12.54 0.23
Coefficient of Variation (%)
(Relative measure of dispersion) 5.97 1.37 7.31 11.01
Fig 1. Radar chart of Recurrent parent recovery pattern
*A- Days to 50 percent flowering, B-Plant height, C-Panicle per square meter, D-Grain Yield
ACKNOWLEDGEMENT
The authors acknowledge Indian Institute of Rice Research (ICAR-IIRR formerly DRR), Hyderabad
for providing study material and financial support.
REFERENCES
Aly, M.A., Rathinasabapathi, B. and Kelley, K.
(2002). Somatic embryogenesis in perennial
staticeLimoniumbellidifolium, Plumbaginaceae.
Plant cell, tissue and organ culture, 68(2): 127-135.
Ballini, E., Morel, J. B., Droc, G., Price, A.,
Courtois, B., Notteghem, J. L. and Tharreau, D. (2008). A genome-wide meta-analysis of rice blast
resistance genes and quantitative trait loci provides
new insights into panial and complete resistance. Mol
Plant Microbe Int, 2l(7):859–868.
Cao, L. Y., Zhuang, J. Y., Zhan, X. D., Zheng, K.
L. and Cheng, S. H. (2003). Hybrid rice resistant to
bacterial blight developed by marker assisted
selection. Chin J Rice Sci, 17: 184–186. (in Chinese
with English abstract)
Cheema, K. K., Grewal, N. K.,Vikal, Y.,Sharma,
R., Lore, J. S., Das, A., Bhatia, D., Mahajan, R.,
Gupta, V., Bharaj, T. S. and Singh, K. (2008). A novel bacterial blight resistance gene from Oryza
nivara mapped to 38 kb region on chromosome 4 and
transferred to Oryza sativa L. Genet. Res, 90: 1-11.
Chen, H. Q., Chen, Z. X., Ni, S., Zuo, S. M., Pan,
X. B. and Zhu, X. D. (2008). Pyramiding three
genes with resistance to blast by marker-assisted
selection to improve rice blast resistance of Jin23B.
Chin J Rice Sci, 22: 23–27. (in Chinese with English
abstract)
Chen, J. M., Fu, Z. Y., Quan, B. Q., Tian, D. G.,
Li, G. and Wang, F. (2009). Breeding hybrid rice restoring line with double resistance to rice blast and
bacterial blight by marker-assisted selection. Mol
Plant Breeding, 7(3): 465–470.
Chin, J.H., Gamuyao, R., Dalid, C., Bustamam,
M., Prasetiyono, J., Moeljopawiro, S.,Wissuwa,
M. and Heuer, S. (2011). Developing rice with high
yield under phosphorus deficiency: Pup1 sequence to
application. Plant Physiol,156: 1202-1216.
Page 49
236 PRAFULL KUMAR
Directorate of Rice Research. (2014). Progress
Report, 2013, Vol.1, Varietal Improvement. All India
Coordinated Rice Improvement Programme (ICAR).
Directorate of Rice Resaerch, Rajendranager,
Hyderabad-500030, India.
Fatimah, P. J., Dadang, A. and Tasliah. (2014). Improvement of early maturity in rice variety by
marker assisted backcross breeding of hd2 gene.
Indones. J. Agric. Sci,15 (2): 55-64
Fujita, D., Yoshimura, A. and Yasui, H. (2010).
Development of near-isogenic lines and pyramided
lines carrying resistance genes to green rice
leafhopper (NephotettixcincticepsUhler) with the
Taichung 65 genetic background in rice (Oryza
sativa L.). Breeding Science, 60:18–27.
Hittalmani, S., Parco, A., Mew, T. V., Zeigier, R.
S. and Huang, N. (2000). Fine mapping and DNA
marker-assisted pyramiding of the three major genes for blast resistance in rice. TheorAppl
Genet,100:1121–1128.
Joseph, M., Gopalakrishnan, S., Sharma, R. K.,
Singh, V. P., Singh, A. K. and Singh, N. K. (2004).
Combining bacterial blight resistance and Basmati
quality characteristics by phenotypic and molecular
marker-assisted selection in rice. Mol Breeding,13:
377–387.
Khush, G. S. and Jena, K. K. (2009). Current status
and future prospects for research on blast resistance
in rice (Oryza sativa L.). In: G. L. Wang, and B. Valent (eds), Advances in Genetics, Genomics and
Control of Rice Blast Disease, 1-10. Springer, New
York.
Koide, Y., Kawasaki, A., Yanoria, M.J.,
Hairmansis, T., Nguyet, A., Bigirimana, N.T.M.,
Fujita, J.D., Kobayashi, N. and Fukuta, Y. (2010).
Development of pyramided lines with two resistance
genes, Pish and Pib, for blast disease
(MagnaportheoryzaeB. Couch) in rice (Oryza sativa
L.). Plant Breed,129:670-675.
Kumar, Prafull, Sao, A., Kanwar. R.R. and
Salam, J.L. (2015a). AMMI Biplot analysis and Genotype x Environment interaction studies in
rainfed upland rice accessions. Oryza,52 (1): 27-33.
Kumar, Prafull., Sao, A., Thakur, A.K. and
Kumari, P. (2015b). Assessment of crop phenology
and genotype response under unpredictable water
stress environments of upland rice. Annals of Plant
and Soil Research,17(3): 303-306.
Lang, N.T., Luy, T.T., Khuyeu, B.T.D. and Buu,
B.C. (2008). Genetics and breeding for blast and
bacterial leaf blight resistance of rice (Oryza sativa.
L). Omonrice, 16: 41-49. Latif, Z., Nasir, I. and Riazuddin, S. (2007).
Indigenous production of synthetic seeds in
Daucuscarota. Pak J Bot, 39(3): 849-855.
Linh, L.H., Linh, T.H., Xuan, T.D., Ham, L.H.,
Ismail, A.M. and Khanh, T.D. (2012). Molecular
breeding to improve salt tolerance of rice (Oryza
sativa L) in the Red River Delta of Vietnam.Int. J.
Plant Genomics, 1-9.
Luu, M.C., Huyen, L.T.N., Hien, P.T.M., Hang,
V.T.T., Dam, N.Q., Mui, P.T., Quang, V.D.,
Ismail, A.M. and Ham, L.H. (2012). Application of
marker assisted backcrossing to introgress the
submergence tolerance QTL SUB1 into the Vietnam
elite rice variety-AS996. Am. J. Plant Sci,3: 528-536. Ma, G. and Xu, Q. (2002). Induction of somatic
embryogenesis and adventitious shoots from
immature leaves of cassava. Plant cell, tissue and
organ culture,70(3): 281-288.
Narayanan, N. N., Baisakh, N., Oliva, N. P.,
VeraCruz, C. M., Gnanamanickam, S. S., Datta,
K. and Datta, S. K. (2002). Molecular breeding for
the development of blast and bacterial blight
resistance in rice cv IR50. Crop Sci,42: 2072–2079.
Narayanan, N. N., Baisakh, N., Oliva, N. P.,
VeraCruz, C. M., Gnanamanickam, S. S., Datta,
K. and Datta, S. K. (2004). Molecular breeding: Marker-assisted selection combined with biolistic
transformation for blast and bacterial blight
resistance in indica rice (cv. CO39). Mol
Breeding,14: 61–71.
Neeraja, C.N., Maghirang-Rodriguez, R.,
Pamplona, A., Heuer, S., Collard, B.C.Y.,
Septiningsih, E.M., Vergara, G., Sanchez, D., Xu,
K., Ismail, A.M. and Mackill, D.J. (2007). A
marker-assisted backcross approach for developing
submergence-tolerant rice cultivars. Theor Appl
Genet, 115:767-776.
Pinta, W., Toojinda, T., Thummabenjapone, P.
and Sanitchon, J. (2013). Pyramiding of blast and
bacterial leaf blight resistance genes into rice cultivar
RD6 using marker assisted selection. African Journal
of Biotechnology,12(28): 4432-4438.
Rajpurohit, D., Kumar, R., Kumar, M., Paul, P.,
Awasthi, A. A., Basha, P.O., Puri, A., Jhang, T.,
Singh, K. and Dhaliwal, H.S. (2010). Pyramiding of
two bacterial blight resistance and a semi dwarfing
gene in Type 3 Basmati using marker-assisted
selection. Euphytica,178: 111-126.
Rao, K.K., Lakshminarasu, M. and Jena, K.K. (2002). DNA markers and marker-assisted breeding
for durable resistance to bacterial blight disease in
rice.Biotechnology Advance,20:33-47.
Ruan, H. H., Yan, C. Q., An, D. R. and Chen, J. P.
(2008). Progress of identification, mapping and
cloning of resistance genes to bacterial blight of rice.
Let Biotechnol,19(3): 463–467.
Sattari, A., Fakheri, B., Noroozi, M. and Gudarzi,
K.M. (2014). Leaf blight resistance in rice: a review
of breeding and biotechnology. Intl J Farm & Alli
Sci,3(8): 895-902.
Septiningsih, E.M., Pamplona, A.M., Sanchez,
D.L.,Neeraja, C.N., Vergara, G.V., Heuer, S.,
Ismail A.M. and Mackill. D.J. (2009).
Development of submergence tolerant rice cultivars:
The SUB1 locus and beyond. Ann. Bot,103: 151-160.
Singh, A.K., Rohini, N. and Singh, P.K. (2015).
Identification of bacterial leaf blight resistance genes
in rice (Oryza Sativa L.). Int J Sci Nat,6(2):283-287.
Page 50
JOURNAL OF PLANT DEVELOPMENT SCIENCES VOL. 12(4) 237
Sreewongchai, T., Toojinda, T., Thanintorn, N.,
Kosawang, C., Vanavichit, A., Harreau, D. and
Sirithunya, P. (2010). Development of elite indica
rice lines with wide spectrum of resistance to Thai
blast isolates by pyramiding multiple resistance
QTLs. Plant Breeding,129:176-180. Srinivasan, B. and Gnanamanickam, S. (2005).
Identification of a new source of resistance in wild
rice, Oryza rufipogonto bacterial blight of rice
caused by Indian strains of Xanthomonas oryzaepv.
oryzae. Curr. Sci, 88: 1229-1231.
Suh, J.P., Jeung, J.U., Noh, T.H., Cho, Y.C., Park,
S.H., Park, H.S., Shin, M.S., Kim, C.K. and
Jena,K.K. (2013). Development of breeding lines
with three pyramided resistance genes that confer
broad-spectrum bacterial blight resistance and their
molecular analysis in rice. Rice, 6: 5-15.
Sujatha, K., Natarajkumar, P., Laha, G.S.,
Mishra, B., Srinivasa Rao, K., Viraktamath, B.C.,
Kirti, P.B., Hari, Y., Balachandran, S.M.,
Rajendrakumar, P., Ram, T., Hajira, S.K.,
Madhav, M.S., Neeraja, C.N. and Sundaram,
R.M. (2011). Inheritance of bacterial blight
resistance in the rice cultivar Ajaya and high-
resolution mapping of a major QTL associated with
resistance. Genet. Res. Camb, 93: 397-408.
Sundaram, R.M., Vishnupriya, M.R., Birdar,
S.K., Laha, G.S., Reddy, G.A., Shoba Rani, N.,
Sarma, N.P. and Ramesh, V. S. (2008). Marker
assisted introgression of bacterial blight resistance in
Samba Mahsuri, an elite indica rice variety.
Euphytica,160: 411-422.
Sundaram, R. M., Vishnupriya, M. R., Laha, G.
S., Shobha Rani, N., Srinivas Rao, P.,
Balachandaran, S. M., Reddy, G. A., Sarma, N. P.
and Shonti, R. V. (2009). Introduction of bacterial
blight resistance into Triguna, a high yielding, mid-
early duration rice variety. Biotechnol. J, 4:400-407.
Yi, M., Nwe, K.T., Vanavichit, A., Chaiarree, W.
and Toojinda, T. (2009).Marker assisted backcross
breeding to improve cooking quality traits in
Myanmar rice cultivar Manawthukha. Field Crops
Res,113: 178-186.
Zhan, X.D. and Cheng, S.H. (2001).Resistance reaction to bacterial blight mixed isolates of IRBB
series lines and their application in breeding restorer
lines. Hybrid Rice,16: 10–12. (in Chinese with
English abstract).
Zhan, X.D., Zhou, H.P., Chai, R.Y., Zhuang, J.Y.,
Cheng, S.H. and Cao, L.Y. (2012). Breeding of
R8012, a rice restorer line resistant to blast and
bacterial blight through marker-assisted
selection.Rice Science,19(1): 29−35.
Page 51
238 PRAFULL KUMAR
Page 52
*Corresponding Author
________________________________________________ Journal of Plant Development Sciences Vol. 12(4): 239-245. 2020
FORECASTING MONTHLY PRECIPITATION MODEL FOR DANTEWADA,
JAGDALPUR AND SUKMA REGION (CHHATTISGARH) USING ARIMA MODEL
Anosh Graham*1, Avinash Yadu
2 and Atul Galav
3
1,3
Department of Environmental Sciences and NRM, College of Forestry, Sam Higginbottom
University of Agriculture, Technology & Sciences Allahabad-211007,
Uttar Pradesh, India 2Department of Agrometeorology, Indra Gandhi Krishi Vishwavidyalaya,
Raipur-492012, Chhattisgarh (India)
Received-05.04.2020, Revised-27.04.2020
Abstract: Earlier forecasting was based on observing weather patterns. Latter-days weather forecasting involves a combination of computer models, observations and knowledge of tends and patterns. This paper describes the Box-Jenkins time series seasonal ARIMA (Auto Regression Integrated Moving Average) approach for prediction of rainfall on monthly scales. ARIMA model of Dantewada (0, 0, 1) (0, 1, 1), Jagdalpur (0, 0, 0) (1, 1, 1), Sukma (0, 0, 1) (1, 1, 1) for rainfall was identified the best model to forecast rainfall for next 5 years with confidence level of 95 percent by analyzing last 30 year ’s
data (1989-20018). Previous years data is used to formulate the seasonal ARIMA model and in determination of model parameters. The performance evaluations of the adopted models are carried out on the basis of correlation coefficient (R2) and root mean square error (RMSE). The study conducted at three cities Dantewada, Jagdalpur & Sukma, Chhattisgarh (India). The results indicate that the ARIMA model provide consistent and satisfactory predictions for rainfall parameters on monthly scale.
Keywords: Rainfall, ARIMA, Correlation Coefficient (R2), Root Mean Square Error (RMSE)
INTRODUCTION
ainfall is a stochastic process which depends on
so many parameters and these properties make
forecasting of rainfall a formidable challenge.
Information about rainfall is really essential for the
planning and management of water resources.
Forecasting of rainfall is vital as it is very much
important for flood warning. Rainfall mostly occurs
during a season called Monsoon and major part of
the annual rainfall occurs in this monsoon.
A wide range of rainfall forecast methods are
employed in weather prediction at regional and
national levels. According to Somvanshi et al.
(2006), rainfall is natural climatic occurrences and its
prediction remains a difficult challenge as a result of
climatic variability. The forecast of precipitation is
particularly relevant to agriculture, growth of plants
and development, which profoundly contribute to the
economy of Africa. In the statement of the above
authors, attempts have been made to predict
behavioral pattern of rainfall using autoregressive
integrated moving average (ARIMA) technique. In
agricultural planning the understanding of rainfall
variability and its prediction has great significance in
the agricultural management and helps in decision
making process. Rainfall information is an important
input in the hydrological modeling, predicting
extreme precipitation events such as droughts and
floods, for planning and management of irrigation
projects and agricultural production is very important
[Nirmala 2015]. Etuk and Mohamed (2014) fitted a
SARIMA (0, 0, 0) x (0, 1, 1)12 model to monthly
rainfall in Gadaref, Sudan. The Box-Jenkins
Seasonal ARIMA (SARIMA) model has several
advantages over other models, particularly over
exponential smoothing and neural network, due to its
forecasting capability and richer information on
time-related changes. ARIMA model consider the
serial correlation which is the most important
characteristic of time series data. ARIMA model also
provides a systematic option to identify a better
model. Another advantage of ARIMA model is that
the model uses less parameter to describe a time
series.
MATERIALS AND METHODS
Study area
Dantewada - The Dantewada lies on 370m above sea
level. The climate here is tropical. When compared
with winter, the summers have much more rainfall.
This location is classified as Aw by Köppen and
Geiger. The temperature here averages 26.2 °C | 79.1
°F. The annual rainfall is 1391 mm | 54.8 inch. The
driest month is December, with 3 mm | 0.1 inch of
rain. In August, the precipitation reaches its peak,
with an average of 405 mm | 15.9 inch.
Sukma - The Sukma lies on 216m above sea level.
Sukma has a tropical climate. The summers are much
rainier than the winters in Sukma. The Köppen-
Geiger climate classification is Aw. The temperature
R
RESEARCH ARTICLE
Page 53
240 ANOSH GRAHAM, AVINASH YADU AND ATUL GALAV
here averages 27.0 °C | 80.6 °F. The rainfall here is
around 1477 mm | 58.1 inch per year. The driest
month is February, with 3 mm | 0.1 inch of rainfall.
The greatest amount of precipitation occurs in July,
with an average of 416 mm | 16.4 inch.
Jagdalpur - The Jagdalpur lies on 558m above sea
level .The climate here is tropical. When compared
with winter, the summers have much more rainfall.
The climate here is classified as Aw by the Köppen-
Geiger system. The average annual temperature is
25.0 °C | 77.0 °F in Jagdalpur. The annual rainfall is
1451 mm | 57.1 inch. The driest month is January,
with 7 mm | 0.3 inch of rain. In August, the
precipitation reaches its peak, with an average of 371
mm | 14.6 inch.
Data Collection
Daily rainfall data (mm) for the past 30 years from
1989 to 2018 was collected from Department of
Agrometeorology IGKV Raipur, for forecasting.
Software used
SPSS Auto Regressive Integrated Moving Average
(ARIMA) models were selected using SPSS software
to find the best fit of a time series to past values of
this time series in order to make forecasts.
METHODOLOGY
Box and Jenkins (1976) have effectively put
together in a comprehensive manner, the relevant
information required to understand and use time
series ARIMA models. A detailed strategy for the
construction of linear stochastic equation describing
the behavior of time series was examined. Consider
the function Zt represents forecasted rainfall and
temperature at time t month. Yt is series of observed
data of rainfall and temperature at time t. If series is
stationary, then an ARIMA process can be
represented as
∇pZt = ∇qYt …. (1)
Where ∇ is a back shift operator. If series Y is not
stationary then it can be reduced to a stationary series
by differencing a finite number of times.
∇pZt = ∇q (1-B) d Yt …. (2)
Where d is a positive integer, and B is back shift
operator on the index of time series so that
B Yt = Yt -1; B2Yt = Yt -2 and so on. Thus further
equation (2) can be simplified into following
equation.
(1-Ф1B-Ф2B2-…….-ФpBp) Zt = θ0+ (1-θ1B-θ2B2-
………- θqBq) at ….. (3)
Where at’s a sequence of identically distributed
uncorrelated deviates, referred to as “white noise”.
Combining equations (2) and (3) yields the basic
Box-Jenkins models for non stationary time series (1-
Ф1B-Ф2B2-…….-ФpBp) (1-B)d Yt =θ0+ (1-θ1B-
θ2B2- ………-θqBq) at ….(4) Equation (4)
represents an ARIMA process of order (p,d,q).
Seasonal ARIMA model represented as follows for a
stationary series i.e. differencing parameters (d &ds
= 0) equal to Zero, used for forecasting rainfall.
∇ps ∇pZt =∇ qs ∇q Yt ….(5)
Where ps and qs are the seasonal parameters
corresponding to AR and MA process. Model of type
of equation (5) was fitted to given set of data using
an approach consists of mainly three steps (a)
identification (b) estimation (c) application
(forecasting) or diagnostic checking. At the
identification stage tentative values of p, d, q and ps,
ds, qs were chosen. Coefficients of variables used in
model were estimated. Finally diagnostic checks
were made to determine, whether the model fitted
adequately describes the given time series. Any
inadequacies discovered might suggest an alternative
form of the model, and whole iterative cycle of
identification, estimation and application was
repeated until a satisfactory model was obtained.
RESULTS AND DISCUSSION
The model that seems to represent the behavior of the
series is searched, by the means of autocorrelation
function (ACF) and partial auto correlation function
(PACF), for further investigation and parameter
estimation. The behavior of ACF and PACF is to see
whether the series is stationary or not. For modeling
by ACF and PACF methods, examination of values
relative to auto regression and moving average were
made. An appropriate model for estimation of
monthly rainfall for Dantewada, Jagdalpur, Sukma
was finally found. Many models for Dantewada,
Jagdalpur, Sukma, according to the ACF and PACF
of the data, were examined to determine the best
model. The model that gives the minimum Bayer’s
Information Criterion (BIC) is selected as best fit
model, as shown in Table 1. Obviously, model
ARIMA Dantewada (0, 0, 1) (0, 1, 1), Jagdalpur (0,
0, 0) (1, 1, 1), Sukma (0, 0, 1) (1, 1, 1) has the
smallest values of BIC. Observed and predicted
values of next five years are determined and plotted
as shown in figure: 8,9,10.
Page 54
JOURNAL OF PLANT DEVELOPMENT SCIENCES VOL. 12(4) 241
Fig. 1. Observed rainfall of Sukma, Jagdalpur & Dantewada district (Jan1989-Dec2018)
Fig. 2. Autocorrelation function of rainfall Sukma.
Fig. 3. Partial Autocorrelation function of rainfall Sukma.
0
500
1000
1500
2000
2500
Jan
-89
Mar
-90
May
-91
Jul-
92
Sep
-93
No
v-9
4
Jan
-96
Mar
-97
May
-98
Jul-
99
Sep
-00
No
v-0
1
Jan
-03
Mar
-04
May
-05
Jul-
06
Sep
-07
No
v-0
8
Jan
-10
Mar
-11
May
-12
Jul-
13
Sep
-14
No
v-1
5
Jan
-17
Mar
-18
sukma jagdalpur dantewada
Page 55
242 ANOSH GRAHAM, AVINASH YADU AND ATUL GALAV
Fig. 4. Autocorrelation function of rainfall Jagdalpur.
Fig. 5. Partial Autocorrelation function of rainfall Jagdalpur.
Page 56
JOURNAL OF PLANT DEVELOPMENT SCIENCES VOL. 12(4) 243
Fig. 6. Autocorrelation function of rainfall Dantewada.
Fig. 7. Partial Autocorrelation function of rainfall Dantewada.
Page 57
244 ANOSH GRAHAM, AVINASH YADU AND ATUL GALAV
Fig. 8. Observed and fitted values of rainfall for Sukma.
Fig. 9. Observed and fitted values of rainfall for Jagdalpur.
Fig. 10. Observed and fitted values of rainfall for Dantewada
Page 58
JOURNAL OF PLANT DEVELOPMENT SCIENCES VOL. 12(4) 245
Table 1.
Dantewada Jagdalpur Sukma
Rainfall model (0, 0, 1) (0, 1, 1), (0, 0, 0) (1, 1, 1), (0, 0, 1) (1, 1, 1)
R2 0.788 0.76 0.68
RMSE 78.678 71.713 104.698
CONCLUSION
The Box-Jenkins ARIMA methodology was used to
develop monthly rainfall of Dantewada, Jagdalpur,
Sukma. The monthly rainfall is panning over the
period of 1989-2018 at Dantewada and the results are good for this region. In Jagdalpur region the
observed and forecasted data are fitted and showed
good results, In Sukma region the results were not so
good. The performance of resulting ARIMA model
was evaluated by using the data from the year 1989-
2018 through graphical comparison between the
forecasted and observed data. In ARIMA model the
forecasted and observed data of rainfall showed good
results. The study reveals that Box-Jenkins
methodology can be used as an appropriate tool to
forecast rainfall in Dantewada, Jagdalpur, Sukma for upcoming years.
REFERENCES
Box, G.E.P. and Jenkins, G.M. (1976). Time series
analysis: forecasting and control, Prentince Hall, Inc,
575.
Nirmala, M. and Sundaram, S.M. (2010). A
Seasonal Arima Model for Forecasting monthly
rainfall in Tamil Nadu. National. Journal on
Advances in Building Sciences and Mechanics.
1(2):43-47.
Etuk, E.H. and Mohamed, T.M. (2014). Time
Series Analysis of Monthly Rainfall data for the
Gadaref rainfall station, Sudan, by SARIMA
Methods. International Journal of Scientific Research in Knowledge. 2(7):320-327.
Reddy, J.C., Ganesh, T., Venkateswaran, M. and
Reddy, P.R.S. (2017). Forecasting of Monthly Mean
Rainfall in Coastal Andhra International Journal of
Statistics and Applications, 7(4): 197-204
Kaushik, I. and Singh, S.M. (2008). Seasonal
ARIMA model for forecasting of monthly rainfall
and temperature. International Journal of Agriculture
Sciences. 5(8):112-25.
Mohamed, T.M. and Ibrahim, A. (2016). Time
Series Analysis of Nyala Rainfall Using ARIMA Method Journal of Engineering and Computer
Science (JECS). 17(1):5-11.
Somvanshi, V., Pandey, O., Agrawal, P.,
Kalanker, N., Prakash, M.R. and Chand, R.
(2006). Modeling and prediction of rainfall using
artificial neural network and ARIMA techniques.
The Journal of Indian Geophysical Union. Vol. 10.
No. 2 p. 141–151.
Nirmala, M. (2015). Computational models for
forecasting annual rainfall in Tamilnadu. Applied
Mathematical Sciences. Vol. 9. Iss. 13 p. 617–621.
Page 59
246 ANOSH GRAHAM, AVINASH YADU AND ATUL GALAV
Page 60
*Corresponding Author ________________________________________________ Journal of Plant Development Sciences Vol. 12(4): 247-251. 2020
DISEASE CONTROLLING POTENTIAL OF TRICHODERMA HARZIANUM AND
TRICHODERMA VIRIDE AGAINST COLLAR ROT OF CHICKPEA
Shweta Mishra*, Devendra Nishad and R.K.S. Tiwari
Department of Plant Pathology, Indira Gandhi Krishi Viswavidyalaya
Raipur (492001) Chhattisgarh
Email: [email protected]
Received-06.04.2020, Revised-25.04.2020 Abstracts: Disease controlling potential of Trichoderma strains are evaluated in vivo against collar rot in chickpea. Ten Trichoderma strains (T1,T2,T3,T4,T5,T6,T7,T18,T28) were taken among which nine were Trichoderma harzianum and one Trichoderma viride (T18) .All strains of Trichoderma harzianum / Trichoderma viride was superior over control for disease controlling parameters i. e mortality percentage , no. of pods per / plant ,yield (quintal/hectare), yield (g/plot),Test weight. Plant population / plot were counted from each plot after 25 days of sowing Trichoderma strains T18 and T28 were more effective showing higher degree of parasitism on Sclerotium rolfsii under field against collar rot in chickpea. Keywords: Chickpea, Sclerotium rolfsii ,Trichoderma harzianum, Trichoderma viride
INTRODUCTION
hickpea is known in this country since ancient
times. It is a widely grown major pulse crop in
India, accounts for nearly 75 per cent of the total
pulse production in the world. Chickpea crop is
prone to many diseases viz., Fusarium wilt, dry root
rot, collar rot, Ascochyta blight, Verticillium wilt,
black root rot, Phytophthora root rot, wet root rot,
foot rot, Pythium rot and seed rot etc. Among these,
collar rot caused by Sclerotium rolfsii which is
gaining importance. Sclerotium rolfsii is an
economically important pathogen on numerous crops worldwide. It has an extensive host range; at least
500 species in 100 families are susceptible, the most
common hosts are legumes, crucifers and cucurbits,
and commonly occurs in the tropics, subtropics, and
other warm temperate regions (Punja, 1985).
Sclerotium rolfsii has wide host range, abundant
growth of the pathogen and its capability of
producing excessive sclerotia that may persist in soil
for several years (Chet and Henis, 1972). Hence
management of Sclerotium rolfsii causing collar rot
of chickpea is difficult to achieve chemically, in this
context plant extracts and bioagents can be used as an alternative source for controlling soil-borne
diseases.
MATERIALS AND METHODS
Experiment was conducted under direct sown
conditions chickpea cultivar Garouv in upland
chickpea field having clay loam soil. The land was
well prepared by ploughing two three times. Sick soil
was prepared using Sclerotia of Sclerotium rolfsii @
3800/ plot. Talc powder based formulations of different strains of Trichoderma spp. were developed
and used as seed treatment. Seeds of chickpea were
treated with Different strains of Trichoderma spp. @
10 g /kg seed. Hexaconazole +Zineb were used @ 3
g kg/seed. Untreated control was kept for making
comparison. Seeds @ 100 kg/ha were sown in each plot under randomized block design with three
replications. Fertilizers i.e. NPK @ 20:60:0/ha were
applied as basal dose. Plant population / plot were
counted from each plot after 25 days of sowing.
Plant growth parameters i.e. root & shoot length /
plant, fresh /dry weight of root and shoot/ plant,
number of nodules / plant and weight of nodules
/plant were recorded randomly from three plants of
each plot. Number of dead plants were counted form
each plot at an interval of 15 days till the harvest of
crop. Mortality per cent was calculated taking number of dead plant and total number of plant from
each plot. Number of pods / plant, yield g/plot, yield
q/ha were calculated from each treatment.
Glasswares and plasticwares
Whenever required, the glasswares of Borosil make
plastic plates of Tarson make, blotter paper of
standard grade and chemicals of standard grade
(Merck, Qualigens, S.D. fine etc.) were used during
the course of investigation. All the glasswares,
polythene bags, ethyl alcohol, formalin, chemicals
and other materials were procured from the Thakur
Chhedilal Barrister College of Agriculture and Research Station Bilaspur (C.G.).
Equipments used
The following equipments or materials used in
present investigation were-
1. Autoclave for media sterilization
2. BOD incubator for incubation
3. Binocular research microscope
4. Compound microscope
5. Hot air oven for glassware sterilization
6. Forceps, needles, blades, inoculation needle, cork
borer, petri dishes 7. Growth chamber
8. Laminar air flow for isolation and purification
Preparation of bio mass of strains of Trichoderma
viride and Trichoderma harzianum
C
RESEARCH ARTICLE
Page 61
248 SHWETA MISHRA, DEVENDRA NISHAD AND R.K.S. TIWARI
Potato dextrose broth was prepared and sterilized in
500 ml conical flasks. Sterilization of media was
done by autoclaving at 1.41 kg cm-² pressure for 20
minutes. Broth containing flasks were further
inoculated with fungal disc of different strains and
incubated at 25 ± 20C inside the B.O.D. Incubator for 15 days. Green biomass along with extract was
homogenized using grinder mixer for developing
formulations.
Preparation of Talc based formulations of strains
of Trichoderma viride and Trichoderma harzianum Talc powder in 250 g poly bags was sterilized.
Sterilization of talc powder was done by autoclaving
at 1.41 kg cm-² pressure for 20 minutes.
Homogenized green biomass of each strain was
incorporated in talc powder in the ration of 1: 10
(one part of bio mass in 10 parts of talc powder) and
thus 10 % (W/V) talc based formulation of each strain was obtained. Talc based formulations of
different strains were used as seed treatment, soil
treatment and foliar on different crops under various
sets of experiments. CFUs were also counted from
talc based formulations and it was ranged between
109 to 1010 / g sample.
Chemicals used
Analytical grade chemicals supplied by different
manufacturers and some of the chemicals were
procured from Thakur Chhedilal College of
Agriculture and Research Station Bilaspur (C.G.). 4.Disease parameters : Mortality per cent
(Number of wilted plant / total number of plant x
100)
RESULTS AND DISCUSSION
Experiment was conducted under in vivo to study
the plant growth promoting and disease controlling
potential of Trichoderma harzianum / Trichoderma
viride strains against collar rot of chickpea caused
by Sclerotium rolfsii. All strain used as seed
treatment @10g/kg seed along with recommended
dose of fertilizer and agronomical practices. Data
indicates that all strains of Trichoderma harzianum
and Trichoderma viride were found significantly
effective in reducing mortality % and enhancing
yield and yield components over control.However, Trichoderma strains i.e Trichoderma viride (T 18),
Trichoderma harzianum (T 28) were more effective
in controlling collar rot of chickpea. All strains of
Trichoderma harzianum / Trichoderma viride was
superior over control for disease controlling
parameters i. e mortality percentage , no. of pods
per / plant ,yield (quintal/hectare), yield (g/plot).
Minimum mortality percentage was recorded in
Trichoderma viride strain number T18 followed by
T8, T28 and maximum mortality percentage was
recorded in Trichoderma strain T1 and T7. Highest
number of pod /plant was recorded in Trichoderma strain number T6 (55.20) followed by T5 whereas
least number of pod / plant recorded in T4 (26.80)
but superior over control (7.40). Higher yield in
quintal / hectare was recorded in Trichoderma strain
T18 (18.97) followed by T 28(17.05) ,T 6(16.99) ,T
7 (16.20) whereas least yield in quintal/hectare was
recorded in Trichoderma strain T3 (10.84) .
similarly higher yield g/ plot was recorded in T18
(0.22),T8 (0.21), T6 (0.19),T5 (0.17),T7 (0.17)
whereas least in strain T2 (0.12 ).test weight (weight
of 100 grain ) was maximum recorded in strain T6 (16.02), T18 (13.54) which is statistically at par
among themselves followed by strain T8 (13.04),T3
(12.08), T6 (12.06) and least test weight was
recorded in strain T2 (10.10). Similar study were
proposed by Jabber et al. (2014) in vitro shows the
bio efficacy of eight antagonists tested through dual
culture technique respectively against S. rolfsii
causing collar rot of chickpea. Among the eight
bioagents tested against S. rolfsii, Trichoderma
harzianum-55 IIHR recorded maximum inhibition of
70% followed by T. harzianum (62%).
Table 1. Disease controlling potential of indigenous strains of Trichoderma harzianum / Trichoderma viride as
seed treatment against collar rot of chickpea.
Trichoderma strains Designation
Mortality
%
No. of
pods /
plant
Yield
qt./ ha
Yield
g/plot Test
weight
Trichoderma
harzianum
T1 9.04 31.60 11.41 0.13 11.90
Trichoderma
harzianum
T2 6.94 19.60 11.93 0.12 10.10
Trichoderma
harzianum
T3 7.71 16.00 10.84 0.13 12.08
Trichoderma
harzianum
T4 4.83 26.80 14.71 0.15 11.70
Trichoderma
harzianum
T5 6.15 51.40 15.98 0.17 12.06
Trichoderma
harzianum
T6 5.81 55.20 16.99 0.19 16.02
Trichoderma
harzianum
T7 9.89 27.60 16.20 0.17 11.30
Page 62
JOURNAL OF PLANT DEVELOPMENT SCIENCES VOL. 12(4) 249
Trichoderma
harzianum
T8 3.23 28.80 11.66 0.21 13.04
Trichoderma
viride
T18 1.14 37.80 18.97 0.22 13.54
Trichoderma
harzianum
T28 3.76 37.40 17.05 0.19 15.02
Control
12.29 7.40 7.64 0.13 6.65
S E m( ±)
CD 5%
0.39
1.16
0.51
1.50
0.61
1.84
0.01
0.05
0.83
2.48
Fig. 1. Disease controlling potential of indigenous strains of Trichoderma harzianum / Trichoderma viride as
seed treatment against collar rot of chickpea.
Plate 1: Effect of different indigenous strains of Trichoderma viride and Trichoderma harzianum against disease
controlling potential against Collar rot of chickpea.
0
10
20
30
40
50
60
70
80
90
100
1 2 3 4 5 6 7 8 9 10 11 12 13 14 15
Test weight
Yield g/plot
Yield
No. of pods / plant
Designation
Page 63
250 SHWETA MISHRA, DEVENDRA NISHAD AND R.K.S. TIWARI
Page 64
JOURNAL OF PLANT DEVELOPMENT SCIENCES VOL. 12(4) 251
REFERENCES
Chet, I. and Henis, Y. (1972). The response of two
type of Sclerotium rolfsii to factors affecting
Sclerotium formation. J. Gen. Microbol., 73: 483-
486.
Kulkarni, V. R. (2007). Epidemiology and
integrated management of potato wilt caused by
Sclerotium rolfsii Sacc. Ph. D. Thesis, Univ. Agric. Sci. Dharwad. p. 191. Manu, T. G. 2012. Studies on
Manu, T. G. (2012). Studies on Sclerotium rolfsii
(Sacc.) causing foot rot disease on finger millet
M.Sc. (Agri) Thesis, Univ. Agric. Sci., Bangalore.
pp. 1-76. Morton, D. T. and Stoub
Punja, Z. K. (1985). The biology, ecology, and
control of Sclerotium rolfsii. Annu. Review of
Phytopathology. 23: 97-127.
Sivan, A., Elad, Y. and Chet, I. (1984). Biological
control effects of a new isolate of Trichoderma
harzianum on Pythium aphanidermatum. J.
Phytopathol. 74: 498-501.
Seshakiran, K. (2002). Use of phytochemicals in the
management of stem rot of groundnut caused by
Sclerotium rolfsii Sacc. M.Sc. (Agri.) Thesis, Uni.
Agric. Sci Dharwad.
Singh, S. R., Prajapati, R. K., Srivastava, S. S. L., Pandey, R. K. and Gupta, P. K. (2007). Evaluation
of different botanicals and non-target pesticides
against Sclerotium rolfsii causing collar rot of lentil.
Indian Phytopathol. 60(4): 499-501.
Sab, J., Nagraja, A. and Nagamma, G. (2014).
Efficasy of biopesticide against Sclerotium rolfsii
SACC. Causing collar rot of chickpea(Cicer
arientum L.).The bioscan. 9(1): 335-339.
Page 65
252 SHWETA MISHRA, DEVENDRA NISHAD AND R.K.S. TIWARI
Page 66
*Corresponding Author
________________________________________________ Journal of Plant Development Sciences Vol. 12(4): 253-256. 2020
PRODUCTION POTENTIAL AND ECONOMICS OF INTERCROPPING IN
AUTUMN PLANTED- SUGARCANE UNDER NORTH HILL ZONE OF
CHHATTISGARH
Prakash Kumar Sahu, D.K. Gupta* and V.K. Singh
Department of Agronomy, RMD College of Agriculture and Research Station, Ambikapur (C.G.)- 497001
Received-03.04.2020, Revised-25.04.2020
Abstract: A field experiment was conducted during autumn season of 2017-18 at Instructional-cum-research farm RMD CARS, Ambikapur to evaluate the most profitable crops grown as intercrops with winter planted sugarcane under thirteen
treatments formulated with intercropping i.e. sugarcane sole, sugarcane + onion (1:3), sugarcane + onion (1:4), sugarcane + potato (1:1), sugarcane + potato (1:2) , sugarcane + sweetcorn (1:1), sugarcane + sweetcorn (1:2), sugarcane + wheat (1:2), sugarcane + wheat (1:3), sugarcane + frenchbean (1:2), sugarcane + frenchbean (1:3), sugarcane + mustard (1:1) and sugarcane + mustard (1:2) in randomized block design. Based on the one year study, onion (1:3) intercropping was selected as most remunerative in autumn/winter cane with the highest no. of millable cane (93.69 x 10³ ha-1), millable cane length (309.26 cm), cane weight (2.72 kg cane-1), cane yield (255.41 t ha-1), cane equivalent yield (295.95 t ha-1) and net return and B:C ratio (Rs. 799244 ha-1 and 9.08) among all the intercropping systems. Sugarcane + onion (1:4) and sugarcane + potato (1:1) intercropping were also found comparable with sugarcane + onion (1:3). Whereas, lowest no. of millable cane (44.55 x
103 ha-1), millable cane length (258.33 cm), cane weight (1.61 kg cane-1), cane yield (71.79 t ha-1), cane equivalent yield (89.58 t ha-1) and net return and B:C ratio (Rs. 189227 ha-1and 2.38 ) recorded under sugarcane + wheat (1:3) intercropping system among the intercrops.
Keywords: Production potential, Economics, Sugarcane, Intercropping, Cane equivalent yield
INTRODUCTION
utumn planted sugarcane is most suitable for
growing intercrops due to its delayed
germination and slow growth because of low
temperature during December to February and
condition are favorable for short duration crops. Sugarcane planted under autumn season gives about
20-25 % higher cane yield and also 0.5 unit higher
sugar recovery as compared to spring cane. Inspite of
these benefits, farmers are least interested to grow
autumn sugarcane and are growing cereal, oilseed
and pulse rabi crops, as per demand in the area of
priority in autumn and sugarcane in spring which
leads to loss in production potential per unit area and
time. Sugarcane requires 4 to 6 weeks for
germination and initial growth is also very slow for
first two months. This time required for germination and subsequent initial slow growing period can be
made better use of growing short duration intercrop
as a bonus crop. As sugarcane is planted at wider row
spacing and this inter row space practically remains
vacant in early growth stages which extends nearly 3
to 4 months where suitable short duration winter
crops may be grown as intercrop that increase total
crop equivalent yield, higher net return and greater
resource utilization and fulfils the diversified needs
of the farmers and also introduce mechanization in
sugarcane to reduce cost of production in constrast to
conventional method of planting. Intercropping in sugarcane with various short duration crops like
onion, potato, mungbean and cabbage etc. have been
proven beneficial in comparison to growing
sugarcane as sole crop (Alam et al., 2000, Panghal,
2010 and Chaudhary et al., 2010). Hence, the
experiment had been conducted to know the
production potential of vegetables as intercrops in
autumn planted sugarcane under North hill zone of
Chhattisgarh.
MATERIALS AND METHODS
The present field experiment was conducted during
rabi seasons of 2017-18 at Instructional-cum-
research farm RMD CARS, Ambikapur, Surguja
(Chhattisgarh). The soil of experimental field was
‘Inceptisols’ which is locally known as ‘Chawar’.
The soil was acidic (pH 5.7) in nature with low
fertility having 0.35% soil organic carbon, low N
(235 kg ha-1) and P2O5 (12.5 kg ha-1) and medium
K2O (290 kg ha-1). The experiment comprised of thirteen (13) treatments i.e. sugarcane sole, sugarcane
+ onion (1:3), sugarcane + onion (1:4), sugarcane +
potato (1:1), sugarcane + potato (1:2) , sugarcane +
sweetcorn (1:1), sugarcane + sweetcorn (1:2),
sugarcane + wheat (1:2), sugarcane + wheat (1:3),
sugarcane + french bean (1:2), sugarcane + french
bean (1:3), sugarcane + mustard (1:1) and sugarcane
+ mustard (1:2) in randomized block design with
three replications. Autumn cane (CO-8036) was
planted in first week of December. Recommended
dose of fertilizer on sugarcane viz., 250:100:150 N:
P: K kg ha-1 with 10 ton FYM ha-1 was used for field experiment. At the time of sowing of crop give 34 kg
N, 10 kg P2O5 and 8 kg K2O as a basal and the
remaining dose of fertilizer of N, P and K was
A
RESEARCH ARTICLE
Page 67
254 PRAKASH KUMAR SAHU, D.K. GUPTA AND V.K. SINGH
applied through drip fertigation at different stages of
crop growth. In case of intercrops gives there
recommended dose of fertilizer as a basal and side
placement at the time as per recommended of
practices viz., onion, potato, wheat, mustard, sweet
corn and french bean.
RESULTS AND DISCUSSION
Yield Attributes and Yield
Millable cane length (cm):- A critical analysis of
data clearly reveals that in general, gradual increase
in cane length with intercropping was observed
significant by during harvesting stage which has been
presented in Table 1. The maximum millable cane
length (309.26 cm) was observed when sugarcane
was intercropped with onion (1:3) followed by
sugarcane+ onion (1:4) , sugarcane + potato (1:1), sugarcane + potato (1:2) , sole sugarcane and the
lowest millable cane length (258.33 cm) recorded
when sugarcane intercropped with sugarcane + wheat
(1:3), which were statistically equal to that sugarcane
intercropped with wheat (1:2), mustard (1:1),
mustard (1:3), frenchbean (1:2), frenchbean (1:3),
sweetcorn (1:1) and sweetcorn (1:2).
Onion and potato as intercropping with sugarcane
does not show any adverse effect on sugarcane yield
and growth. Potato intercropped plots produced
second highest tiller, highest millable cane, maximum height, diameter, unit stalk weight and
yield of sugarcane. These findings were strongly
corroborated with Miah et al. (1994). This might be
possible due to beneficial effects of crop
management practices for onion and potato that
ultimately helped to produce better yield attributes
and yield.
Cane weight (kg cane-1
):- The maximum cane
weight (2.72 kg plant-1) was recorded when
sugarcane was intercropped with onion (1:3)
followed by sugarcane + onion (1:4), sole sugarcane,
sugarcane + potato (1:1) and sugarcane + potato (1:2). The lowest cane weight (1.61 kg plant-1) was
recorded when sugarcane was intercropped with
wheat (1:3) which was found at par with sugarcane +
wheat (1:2), sugarcane + mustard (1:2), sugarcane +
mustard (1:1), sugarcane + sweetcorn (1:2)
sugarcane + sweetcorn (1:1) sugarcane + frenchbean
(1:3) and sugarcane + frenchbean (1:2) Singh et al.
(2010) who also gave similar reports that the onion
as vegetable produced canes of similar weight and
were significantly heavier than all the other
intercropping systems. The production of taller and heavier canes under the onion intercropping systems
indicated that these intercrops did not compete with
main crop.
Number of millable cane (x103
ha-1
):- It is clear
from data that number of millable canes was
significantly influenced due to sugarcane
intercropped with onion (1:3) and it recorded
maximum number of millable canes (93.69 x10³ ha
-1)
which was comparable to sugarcane + onion (1:4), sugarcane + potato (1:1), sole sugarcane and
sugarcane + potato (1:2) but significantly superior
over sugarcane + wheat (1:3), sugarcane + wheat
(1:2), sugarcane + mustard (1:2), sugarcane +
mustard (1:1), sugarcane + sweetcorn (1:2),
sugarcane + sweetcorn (1:1), sugarcane + frenchbean
(1:2) and sugarcane + frenchbean (1:3). The lowest
number of millable cane (44.55 x10³ ha-1) was
recorded when sugarcane was intercropped in wheat
(1:3).The reduction in number of millable canes was
attributed to poor short proliferation under
intercropping situation as a result of higher inter-specific competition.
Cane yield and cane equivalent yield (t ha-1
):- The
maximum cane yield and cane equivalent yield
(255.41 and 295.75 t ha-1) was recorded when
sugarcane was intercropped with onion (1:3) and it
was statistically at par with sugarcane + onion (1:4),
sole sugarcane, sugarcane + potato (1:1) and
sugarcane + potato (1:2) but significantly superior
over sugarcane + wheat (1:3), sugarcane + wheat
(1:2), sugarcane + mustard (1:2), sugarcane +
mustard (1:1), sugarcane + sweetcorn (1:2), sugarcane+ sweetcorn (1:1), sugarcane + frenchbean
(1:2) and sugarcane + frenchbean (1:3). The lowest
cane yield and cane equivalent yield (71.79 and
89.58 t ha-1) was recorded when sugarcane was
intercropped in wheat (1:3).Similar findings was
reported by Kumar et al. (2003) they reported that
the reduction in cane yield as a result of sarson and
wheat was attributed to exhaustive competition
between the component crops for essential nutrients,
water and other growth factors. Lower yield was
observed when sugarcane was intercropped with
wheat may be due to late vacation of field and competition between wheat and cane plant during
that period resulted in production of lower number of
tillers and millable canes and cane yield as compared
to sole sugarcane.
Economics
Gross return, Net returns (Rs ha-1
) and B: C
ratio: - Higher gross return, net return and B:C ratio
(Rs. 887236, 799244 ha-1 and 9.08 ) was obtained
with sugarcane intercropped with onion (1:3)
followed by sugarcane + onion (1:4), sugarcane +
potato (1:1) . The lowest gross return, net return and B:C ratio (Rs. 268727, 189227 ha-1and 2.38) was
recorded when sugarcane was intercropped with
wheat (1:3) followed by sugarcane + mustard (1:1)
and sugarcane + wheat (1:2).
Page 68
JOURNAL OF PLANT DEVELOPMENT SCIENCES VOL. 12(4) 255
Table 1. Effect of different intercropping system on no. of millable cane, cane length and cane weight of
sugarcane
Treatments No. of Millable
cane
(x103
ha-1
)
Millable cane length
(cm)
Cane weight
(kg cane-1
)
T1- S.cane + Onion (1:3) 93.69 309.26 2.72
T2- S.cane + Onion (1:4) 92.99 303.00 2.52
T3- S.cane + Potato (1:1) 86.75 300.06 2.45
T4–S.cane + Potato (1:2) 83.33 298.46 2.44
T5-S.cane + Sweetcorn (1:1) 60.79 270.00 1.90
T6-S.cane + Sweetcorn (1:2) 58.99 266.00 1.87
T7-S.cane + Wheat (1:2) 55.38 260.40 1.67
T8- S.cane + Wheat (1:3) 44.55 258.33 1.61
T9-S.cane + Frenchbean (1:2) 77.36 277.86 2.01
T10-S.cane + Frenchbean (1:3) 77.36 275.40 2.00
T11- S.cane + Mustard (1:1) 56.39 264.33 1.69
T12- S.cane + Mustard (1:2) 56.12 262.40 1.69
T13- Sole Sugarcane 86.29 299.53 2.45
SEm± 5.39 6.28 0.24
CD (P=0.05) 16.29 19.50 0.70
Table 2. Effect of different intercropping system on sugarcane yield, intercrop yield and sugarcane equivalent
yield
Treatments S. cane yield
(t ha-1
)
Intercrop yield
(q ha-1
)
S. cane equivalent
yield (CEY , t ha-
1)
T1-Sugarcane + Onion (1:3) 255.41 110 (43.3) 295.75
T2- Sugarcane + Onion (1:4) 236.50 144 (52.80) 289.30
T3 -Sugarcane + Potato (1:1) 212.76 80 (27.46) 240.22
T4 - Sugarcane + Potato (1:2) 204.53 103 (21.33) 225.87
T5-Sugarcane + Sweetcorn (1:1) 115.43 83 (27.66) 143.09
T6-Sugarcane + Sweetcorn (1:2) 110.11 90 (30.0) 140.12
T7- Sugarcane + Wheat (1:2) 92.55 21 (12.88) 105.44
T8- Sugarcane + Wheat (1:3) 71.79 29 (17.78) 89.58
T9-Sugarcane + Frenchbean (1:2) 162.67 12 (4.00) 166.67
Page 69
256 PRAKASH KUMAR SAHU, D.K. GUPTA AND V.K. SINGH
T10-Sugarcane + Frenchbean (1:3) 160.14 13 (4.33) 164.47
T11- Sugarcane + Mustard (1:1) 95.51 05 (7.00) 102.50
T12- Sugarcane + Mustard (1:2) 94.66 07 (9.80) 104.47
T13- Sole Sugarcane 213.74 - 213.74
SEm± 22.90 - 22.88
CD (P=0.05) 67.24 - 67.17
Table 3. Effect of different intercropping system on gross return, net return and B:C ratio on sugarcane
Treatments Cost of
cultivation (Rs
ha-1
)
Gross return (Rs
ha-1
)
Net return (Rs
ha-1
)
B:C
ratio
T1- S. cane + Onion (1:3) 87992 887236 799244 9.08
T2- S. cane + Onion (1:4) 88900 867910 779010 8.76
T3- S. cane + Potato (1:1) 90900 720662 629762 6.93
T4 -S. cane + Potato(1:2) 92917 677597 584680 6.29
T5-S.cane + Sweetcorn (1:1) 78667 429272 350605 4.46
T6-S.cane + Sweetcorn (1:2) 79700 420352 340652 4.27
T7- S.cane + Wheat (1:2) 78900 316320 237420 3.01
T8- S.cane + Wheat (1:3) 79500 268727 189227 2.38
T9-S.cane + Frenchbean (1:2) 76600 500016 423416 5.53
T10-S.cane + Frenchbean (1:3) 77000 493421 416421 5.41
T11- S.cane + Mustard (1:1) 78950 307515 228565 2.90
T12- S.cane + Mustard (1:2) 79300 313402 234102 2.95
T13- Sole Sugarcane 73166 641240 568074 7.76
SEm± - 68632 68633 0.84
CD (P=0.05) - 201518 201518 2.47
REFERENCES
Alam, M.J., Rahman, M.M. and Zaman, A.K.M.M. (2000). Impact of paired row Sugarcane
with double intercrops. Bangladesh Journal of
Sugarcane, 22: 1- 9.
Chaudhary, S., Dorge, J.T. and Tilekar, S.N. (2010). Impact of agricultural technologies and
development of cane productivity of sugarcane in
Western Maharashtra. Cooperative Sugar, 41(11):
69-74.
Kumar, S., Rana, N.S. and Saini, S.K. (2003).
Effect of NPK fertilization on production potential of
autumn cane based intercropping system. Indian
journal sugarcane technology, 18 (1/2):55-58.
Miah, M.A.M., Sabur, S.A. and Islam, M.S. (1994). Comparative economics of sugarcane with
intercrops in Jaipurhat. Sugar mill area, Bangladesh
journal of sugarcane, 16: 5-9.
Panghal, S.S. (2010). Cane production
mechanization – A solution for labour problems.
Indian Sugar, 45: 27-32.
Singh, K., Singh, A., Gill, M. S., Singh, D., Uppal,
S. K. and Bhullar, M. S. (2010). Intercropping in
single bud vertical planted sugarcane. Journal
Research Punjab Agriculture University, 47(3 & 4):
138-42.
Page 70
*Corresponding Author
________________________________________________ Journal of Plant Development Sciences Vol. 12(4): 257-259. 2020
EXISTING PRODUCTION PATTERNS AMONG THE MAIZE GROWERS
P.K. Netam*, Basanti Netam and Virendra Kumar Painkra
1Department of Agricultural Extension CARS,Kanker, IGKV, Raipur, Chhattisgarh 2Department of Senior Agriculture Development Officer, Dhamtari,Chhattisgarh
3Department of Agricultural Extension CoA, IGKV, Raipur, Chhattisgarh
Email: [email protected]
Received-01.04.2020, Revised-22.04.2020 Abstracts: This investigation was carried out in three district of Bastar plateau of Chhattisgarh State to assess the level of existing production pattern among the respondents. 270 farmers were considering as respondents for this study. Respondents were interviewed through personal interview. Collected data were analyzed with the help of suitable statistical methods. The analysis of the results showed that major crop prevailed in Kharif season among different respondents was rice followed by maize, while predominant crop in Rabi season was maize covering 64.44 percent area.
Keywords: Production pattern, Area, Productivity, Economic assessment
INTRODUCTION
aize (Zea mays L.) is one of the most
important cereal crops in the world and has the
highest production among all the cereals. It is a
miracle crop, it has very high yield potential, there is
no cereal on the earth which has so immense
potentiality and that is why it is called ‘queen of
cereal’. Besides, maize has many types like normal
yellow, white grain, sweet corn, baby corn, pop corn,
waxy corn, high amylase corn, high oil corn, quality
protein maize, etc. Maize is the most important crop in the world after wheat and rice (Verheys,Undated).
It is an important staple food in many countries and
is also used as animal feed and many industrial
applications. Maize is 3rd major crop in India after
rice and wheat (Cox, R., 1956 & Reddy et. al. 2013).
Maize is important cereal crop which provides food,
feed, fodder and serves as a source of basic raw
material for a number of industrial products viz,
starch, protein, oil, food sweeteners, alcoholic
beverages, cosmetics, bio-fuel etc, it is cultivated
over 8.12 million hectare area with an annual production of 19.77 million tones and an average
productivity of 2,435 kg ha-1 (Langade et. al. 2013).
Maize is the third most important food grain in India
after wheat and rice. In India, about 28% of maize
produced is used for food purpose, 11% as livestock
feed, 48% as poultry feed, 12% in wet milling
industry (for example starch and oil production) and
1% as seed (AICRP on Maize, 2007). Maize crop in
the state has an area of 123430 ha with the
production 254134 MT (C.G. Agriculture Statistic
Report 2014).The area and production of Maize crop
in Kanker district was 11511 ha and 25705 MT respectively, area of maize crop in Kondagaon
district is 13586 ha with production of 31831 MT
while the coverage of maize in Bastar district is 9560
ha with the production of 22398 (C.G. Ag. statistic
Report 2014). The existing production pattern
indicate the used to pattern which is now present in
operation is made according to the exact dimension of particular style with allowance. The present study
was undertaken with specific objectives to assess the
existing production pattern of maize of the maize
growers of Bastar plateau of Chhattisgarh.
MATERIALS AND METHODS
The present study was carried out in Bastar plateau
of Chhattisgarh State. Three districts in the zone i.e.
Kanker, Kondagaon and Bastar were undertaken for
the study. Two blocks from each of the selected
district Block Antagarh and Koylibeda in Kanker
District, Keshkal and Baderajpur in Kondagaon,
Bastar and Bakawand in Bastar District. Each
selected block 3 villages viz. Irrabodi, Amagaon,
Godri, in Antagarh Block, Chotekapsi,
Kodosalhebhat, Manegaon, in Koylibeda Block,
Cherbeda, Toraibeda, Amoda in Keshkal Block,
Baderajpur, Toraipara, Khargaon(Manduki) in
Baderajpur Block, Ikchapur, Bagmohlai,
Dubeumargaon in Bastar Block, Belputi, Khotlapal
and Mangnar in Bakawand Block were selected and
from each selected village, 15 farmers were selected
randomly. In this way total two hundred seventy
respondents were selected to response as per the
interview schedule designed for the study. Collected
data were analyzed by the help of various statistical
tools i.e. frequency, percentage, mean, standard
deviation, correlation and regression, etc. In this
study, the existing production pattern indicate the
used to pattern which is now present in operation is
made according to the exact dimension of particular
style with allowance.
RESULTS AND DISCUSSION
The result and discussion of the present study have
been summarized on the basis of response of
M
SHORT COMMUNICATION
Page 71
258 P.K. NETAM, BASANTI NETAM AND VIRENDRA KUMAR PAINKRA
respondents regarding to area, productivity and
economics of the major Kharif and Rabi crops
prevailing among the respondents are represented in
the Table No.1. Major crop prevailed in Kharif
season among different respondents was rice
followed by maize, while predominant crop in Rabi season was maize covering 64.44 percent area while,
it covered 87.77 percent area covered in Kharif
season. The major variety of Kharif rice taken up by
the respondents was hybrid, MTU-1010, MTU-1001
and IR-64. Irrigated area under Kharif maize was 48
ha. while 129ha. area was unirrigated. The total
irrigated area under Rabi maize among different
respondents was 187.2 ha. Average productivity of
Kharif maize under irrigated condition and was
47qha-1 whereas, it is lower in unirrigated condition
and found 38 qha-1 comparatively higher productivity
of Rabi maize was found as 58 qha-1 . Average productivity of rice hybrid under irrigated condition
was 46qha-1 whereas, it is 44 qha-1 under unirrigated
condition. Average productivity of rice variety viz
MTU-1010, MTU-1001and IR-64 under irrigated
condition was 46, 32, 25 and 29 qha-1 respectively,
whereas under unirrigated condition it gave
productivity of 44, 31, 24 and 27 qha-1.
Average cost of cultivation of rice varieties viz.
Hybrid, MTU-1010, MTU-1001 and IR-64 was
Rs.33000, Rs.27000, Rs.26000 and Rs.27000 per
hectare under irrigated condition which was almost same or slightly lower under unirrigated condition.
Gross return among the rice variety was maximum in
rice hybrids followed by MTU-1010,IR-64 and
MTU-1001. Net return (Rs.ha-1) also followed the
same trends. Among the different rice variety
maximum benefit: cost ratio was obtained with rice
hybrid (1.81) followed by MTU-1010(1.54), IR-
64(1.39) and MTU-1001(1.25).The highest net return
of Rs. 51,170 ha-1 in Rabi maize whereas, the net
return in Kharif maize under irrigated condition was
Rs.36155ha-1 and under unirrigated condition it was
Rs.28870ha-1 . The maximum benefit cost ratio of 2.82 was obtained in Rabi maize compared to 2.19 in
Kharif season under irrigated condition. Under
unirrigated condition the B:C rato in Kharif maize
was 1.57.
Table 1. Area, Productivity and economics assessment of major crops among the respondents during Kharif and
Rabi season
Season /
Crop
No percent Area (ha) AC (Rs.000/ha.)
AP (Q./ha)
GR (Rs./ha.)
Net return (Rs./ha.)
B:CRatio
I UI I UI I UI I UI I UI I UI
Kharif
Rice (vr.)
Hybrid 191 70.74 100 38 33 32 46 44 59800 57200 26800 25200 1.81 1.78
MTU-1010 207 76.67 51 85 27 27 32 31 41600 40300 14600 13300 1.54 1.49
MTU- 1001 34 12.59 4.4 24 26 26 25 24 32500 31200 6500 5200 1.25 1.20
HMT 13 4.81 2.8 7.6 29 28 31 27 40300 35100 11300 9100 1.38 1.25
IR-64 20 7.40 2.8 14.8 27 26 29 27 37700 35100 10700 9100 1.39 1.35
Safri 36 13.33 3.6 24 26 25 25 24 32500 31200 6500 6200 1.25 1.24
Gurmutiya 12 4.44 2 6.4 25 25 21 21 27300 27300 2300 2300 1.09 1.09
Maize 237 87.77 48 129 28 23 47 38 64155 51870 36155 28870 2.19 1.57
Rabi Maize 164 64.44 187.2 - 28 - 58 - 79170 51170 - 2.82 -
*Data are based on multiple responses
Note: Data are based on multiple responses, I- irrigated, UI-un irrigated, AC-average cost, AP- average
production,
GR- gross return, NR-net return, B: C- benefit: cost, vr- variety
Page 72
JOURNAL OF PLANT DEVELOPMENT SCIENCES VOL. 12(4) 259
Fig. 1. Distribution of the respondents on the basis of their Major crops
CONCLUSION
From the above research findings it can be concluded
that Major crop prevailed in Kharif season among
different respondents was rice followed by maize,
while predominant crop in Rabi season was maize
covering 64.44 percent area.
REFERENCES
Chhattisgarh (2014). Annual statistics report.
CIMMYT (2005). Maize in India: production
systems, constraints, and research priorities.
FAOSTAT (2012). Statistical databases and data
sets of the food and agriculture organization of the
United Nations.
FARA (2009). Pattern of change in maize production
in Africa: implication for policy development.
Ministerial policy brief services, No.3 December
2009 Accra, Ghana: forum for Agricultural Research
in Africa (FARA). Gecho, Yishak and Punjabi, N.K. (2011).
Determination of adoption of improved Maize
technology in Damot Gale, Wolaita, Ethiopia. Raj. J.
Ext. Edu., 19: 1-9.
Gupta, Km. Saroj and Gyanpur, S.R.N. (2012).
Sustainability of scientific maize cultivation practice
in Uttar Pradesh, India. Journal of Agricultural
Technology. 8 (3): 1089-1098.
Kumari, Sunita, Sharma, F.L. and Nidhi (2017).
Study of profile characteristics of wheat and maize
growers in Udaipur District of Rajasthan. IMPACT:
International Journal of Research in Applied, Natural
and Social Sciences, 5(2): 1-12.
Langade, D. M., Shahi, J.P., Agrawal, V. K. and
Sharma, A. (2013). Maize as emerging source of oil
in india: an overview. Maydica, 58(3/4): 224-230.
Nyangena, Wilfred and Juma, Ogada Maurice (2014). Impact of Improved Farm Technologies on
Yields: The case of improved Maize Varieties and
Inorganic fertilizer in Kenya. Environment for
Development.
R. Cox (1956). Control of helminthosporium
turcicum blight disease of sweet corn in South
Florida. Phytopathology, 5: 68-70.
Singha, K. and Chakravorty, A. (2013). Crop
diversification in India: a study of maize cultivation
in Karnataka. Scientific Journal of Review, 2(1): 1-10.
Wokabi, S. M. (1998). Sustainability of maize
production in Kenya. Kenya Agricultural Research
Institute, Nairobi, Kenya. p. 2.
191 207 34 13 20 36 12 237 164
70.74% 76.67% 12.59% 4.81% 7.40% 13.33% 4.44% 87.77% 64.44%
99%
100%
100%
100%
Page 73
260 P.K. NETAM, BASANTI NETAM AND VIRENDRA KUMAR PAINKRA