Phase formation and microstructure in lithium-carbon intercalationcompounds during lithium uptake and release
Martin Drüe a, *, Martin Seyring a, Markus Rettenmayr a, b
a Friedrich Schiller University, Otto Schott Institute of Materials Research, L€obdergraben 32, D-07743 Jena, Germanyb Friedrich Schiller University, Center for Energy and Environmental Chemistry, Philosophenweg 7, D-07743 Jena, Germany
The intercalation and de-intercalation behavior of lithium in graphite was investigated with respect tothe formation of lithium graphite intercalation compounds (Li-GICs) using a combination of XRD mea-surements and metallography. Microstructural features and the evolution of phases and structural detailsof Li-GICs during Li uptake and release are correlated for the first time, giving new insight into theformation of Li-GICs. Lithium evaporation loss during annealing was exploited for studying the phaseevolution during lithium de-intercalation, whereas phase formation during lithium uptake was studiedin a sample exhibiting a lithium concentration gradient. The experiments indicate that growth anddissolution of the compound LiC6 do not occur by an inverse mechanism, as shown by the formation ofdifferent intermediate phases. The compound LiC12 was found to be a non-stoichiometric solid solution.LiC6 can be clearly identified in micrographs by the color and distinct phase boundaries, while LiC12 issituated in the vicinity of the LiC6 phase with varying coloration depending on the Li content.
Rechargeable lithium ion batteries are widely used for energy
e).
storage in the entire variety of mobile devices. The battery perfor-mance is strongly influenced by the anode material, which usuallyconsists of carbonaceous materials, in most of the cases graphite[1e3]. Despite extended efforts to introduce elements with higherspecific capacity such as Sn [4e6] or Si [7e9], graphite remains themost commonly used anode material. The reason is its low volumeexpansion during Li uptake. During charging, lithium graphite
M. Drüe et al. / Journal of Power Sources 353 (2017) 58e66 59
intercalation compounds (Li-GICs) are formed when Li ions inter-calate in between the graphene layers of the graphite [10,11]. Thesecompounds form by different ‘stages’, which are defined by thenumber of graphene layers separating two Li containing layers[12,13]. LiC6, the intercalation compound with the highest Li con-tent, is also labeled as stage 1, LiC12 as stage 2 and so on. The stagingphenomenon is of major importance for understanding thecharging behavior of rechargeable lithium batteries and has thusbeen investigated thoroughly by means of X-ray [14e21], electron[22] and neutron diffraction [23e30]. Several different stages of upto stage 4 [15,21,31] or stage 8 [16] have been reported in theliterature. In LiC6 and LiC12, the Li atoms were found to form a√3�√3 superstructure [13], but also ‘dilute stages’ 1 [15,24] and 2[17,32] at lower Li content or higher temperatures without a Lisuperstructure were observed. Higher stages, beginning with stage3, were found to show a solid solution-like structure [26,27] withno 2D ordering of Li atoms inside the intercalated layers [18].
In addition to the various diffractionmethods, optical imaging ofgraphite electrodes was used for clarifying the phase formationduring Li intercalation [33e36]. Nevertheless, the formationmechanisms of the different stages and the phase evolution duringLi uptake and release are still under discussion. The mentionedoptical measurements do not contain the visualization of micro-structural features of the lithiated graphite using metallographicmethods, which should be the basis of a comprehensive under-standing of the microstructural evolution. Due to the high sensi-tivity of Li alloys to humidity, oxygen and nitrogen, theirmetallographic preparation is by nomeans straightforward. Severalauthors reported preparation routines for metallic Li [37e39], Li-B[40] and Li-Si alloys [41,42]. Metallographic techniques were alsoused to investigate aging mechanisms [43] and evaluatemanufacturing quality [44,45] of commercial rechargeable Li-ionbatteries. Due to the risk of short circuits, rechargeable batteriescan only be dismantled and prepared metallographically in thedischarged state. The investigation of lithiated anode materialsrequires a completely water- and oxygen-free procedure. Recently,a preparation routine for lithiated graphite has beenworked out bythe present authors [46].
In this work, the variation of the microstructure of Li-C inter-calation compounds is studied during Li-uptake and release. Asamplewith a pronounced Li gradient was synthesized and used forstudying the intercalation process; de-intercalation was investi-gated by annealing LiC6 samples and following the gradual decreaseof Li content due to the evaporation loss. For the first time, X-raydiffraction used for phase identification is combined with micro-graphs to characterize different intercalation stages. The
Fig. 1. a) LiC6 samples exhibiting the typical shiny golden color typical for stage 1 intercadifferent Li content) were defined, reaching from area 1 (left side) with the highest Li contenblack coloration. (For interpretation of the references to colour in this figure legend, the re
adjustment of the Li concentration and the different stages ofintercalation is different from previous work in this field wheretemperature variations [22,47] or electrochemical cycling ofgraphite electrodes [16,26e28,48] were used. The micrographs incombination with the information on the crystal structures of thedifferent intercalation stages provide new insight into the inter-calation process.
2. Experimental
All experiments were carried out under purified Ar atmospherein order to avoid contamination of the sensitive samples. Details ofthe synthesis of the various Li-C samples and the characterizationvia X-ray diffraction (XRD) and Metallography are described below.
2.1. Synthesis of Li-C intercalation compounds
2.1.1. Initial material LiC6LiC6 samples were synthesized as described in a previous paper
[49]. Graphite plates of 1 … 2 mm thickness (SGL Carbon Sigrafine7500) and Lithium granules (Alfa Aesar, 99%) were placed layerwiseinside a steel crucible with a molar ratio of Li:C ¼ 1:5. The cruciblewas linedwith graphite foil. Themixturewas annealed at 330 �C for24 h. The LiC6 plates exhibit a shiny golden color (Fig. 1a), which istypical for stage 1 carbon intercalation compounds [10,11,50]. AnXRD scan of such a LiC6 sample is shown in Fig. 2.
2.1.2. Controlled de-intercalation of LiC6Some of the yellow LiC6 plates underwent an additional heat
treatment in order to produce partially de-intercalated samples.The heat treatments were carried out under similar conditions asthe synthesis: the annealing temperature was 330 �C, and a steelcrucible lined with graphite foil was used. Heat treatment wascarried out for the annealing times of 72 h, 96 h, 144 h and 240 h,respectively.
2.1.3. Sample with Li gradientThe first step for synthesizing a graded Li sample was the pro-
duction of a pellet of metallic lithiumwith a diameter of 12mm anda height of about 10 mm, which was carried out by compressinglithium granules in a steel dye using a lever press. A slit was cut intothe lithium pellet using a box cutter, inwhich a 8� 15mm graphiteplate was positioned so that half of its height was covered withmetallic Li. In order to achieve better contact between C and Li priorto the annealing, the pellet was pressed on the surface of the platewith a pincer. The sample was annealed at 330 �C for 24 h, similarly
lation compounds; b) sample with Li gradient. Seven areas with different color (andt and golden coloration to area 7 (right side) with the lowest Li content and dark blue/ader is referred to the web version of this article.)
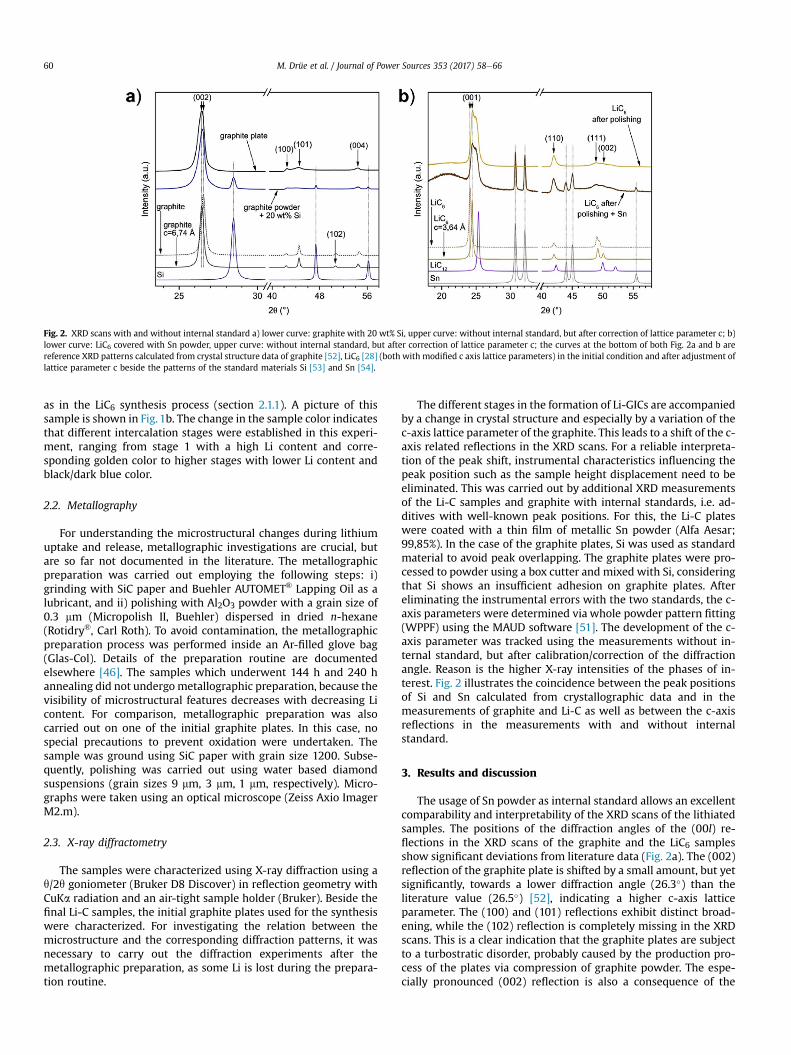
Fig. 2. XRD scans with and without internal standard a) lower curve: graphite with 20 wt% Si, upper curve: without internal standard, but after correction of lattice parameter c; b)lower curve: LiC6 covered with Sn powder, upper curve: without internal standard, but after correction of lattice parameter c; the curves at the bottom of both Fig. 2a and b arereference XRD patterns calculated from crystal structure data of graphite [52], LiC6 [28] (both with modified c axis lattice parameters) in the initial condition and after adjustment oflattice parameter c beside the patterns of the standard materials Si [53] and Sn [54].
M. Drüe et al. / Journal of Power Sources 353 (2017) 58e6660
as in the LiC6 synthesis process (section 2.1.1). A picture of thissample is shown in Fig. 1b. The change in the sample color indicatesthat different intercalation stages were established in this experi-ment, ranging from stage 1 with a high Li content and corre-sponding golden color to higher stages with lower Li content andblack/dark blue color.
2.2. Metallography
For understanding the microstructural changes during lithiumuptake and release, metallographic investigations are crucial, butare so far not documented in the literature. The metallographicpreparation was carried out employing the following steps: i)grinding with SiC paper and Buehler AUTOMET® Lapping Oil as alubricant, and ii) polishing with Al2O3 powder with a grain size of0.3 mm (Micropolish II, Buehler) dispersed in dried n-hexane(Rotidry®, Carl Roth). To avoid contamination, the metallographicpreparation process was performed inside an Ar-filled glove bag(Glas-Col). Details of the preparation routine are documentedelsewhere [46]. The samples which underwent 144 h and 240 hannealing did not undergometallographic preparation, because thevisibility of microstructural features decreases with decreasing Licontent. For comparison, metallographic preparation was alsocarried out on one of the initial graphite plates. In this case, nospecial precautions to prevent oxidation were undertaken. Thesample was ground using SiC paper with grain size 1200. Subse-quently, polishing was carried out using water based diamondsuspensions (grain sizes 9 mm, 3 mm, 1 mm, respectively). Micro-graphs were taken using an optical microscope (Zeiss Axio ImagerM2.m).
2.3. X-ray diffractometry
The samples were characterized using X-ray diffraction using aq/2q goniometer (Bruker D8 Discover) in reflection geometry withCuKa radiation and an air-tight sample holder (Bruker). Beside thefinal Li-C samples, the initial graphite plates used for the synthesiswere characterized. For investigating the relation between themicrostructure and the corresponding diffraction patterns, it wasnecessary to carry out the diffraction experiments after themetallographic preparation, as some Li is lost during the prepara-tion routine.
The different stages in the formation of Li-GICs are accompaniedby a change in crystal structure and especially by a variation of thec-axis lattice parameter of the graphite. This leads to a shift of the c-axis related reflections in the XRD scans. For a reliable interpreta-tion of the peak shift, instrumental characteristics influencing thepeak position such as the sample height displacement need to beeliminated. This was carried out by additional XRD measurementsof the Li-C samples and graphite with internal standards, i.e. ad-ditives with well-known peak positions. For this, the Li-C plateswere coated with a thin film of metallic Sn powder (Alfa Aesar;99,85%). In the case of the graphite plates, Si was used as standardmaterial to avoid peak overlapping. The graphite plates were pro-cessed to powder using a box cutter and mixed with Si, consideringthat Si shows an insufficient adhesion on graphite plates. Aftereliminating the instrumental errors with the two standards, the c-axis parameters were determined via whole powder pattern fitting(WPPF) using the MAUD software [51]. The development of the c-axis parameter was tracked using the measurements without in-ternal standard, but after calibration/correction of the diffractionangle. Reason is the higher X-ray intensities of the phases of in-terest. Fig. 2 illustrates the coincidence between the peak positionsof Si and Sn calculated from crystallographic data and in themeasurements of graphite and Li-C as well as between the c-axisreflections in the measurements with and without internalstandard.
3. Results and discussion
The usage of Sn powder as internal standard allows an excellentcomparability and interpretability of the XRD scans of the lithiatedsamples. The positions of the diffraction angles of the (00l) re-flections in the XRD scans of the graphite and the LiC6 samplesshow significant deviations from literature data (Fig. 2a). The (002)reflection of the graphite plate is shifted by a small amount, but yetsignificantly, towards a lower diffraction angle (26.3�) than theliterature value (26.5�) [52], indicating a higher c-axis latticeparameter. The (100) and (101) reflections exhibit distinct broad-ening, while the (102) reflection is completely missing in the XRDscans. This is a clear indication that the graphite plates are subjectto a turbostratic disorder, probably caused by the production pro-cess of the plates via compression of graphite powder. The espe-cially pronounced (002) reflection is also a consequence of the
M. Drüe et al. / Journal of Power Sources 353 (2017) 58e66 61
production process. The (001) reflection of the LiC6 sample isshifted to a higher diffraction angle (24.5� instead of 24.1�), indi-cating a lower value for the c-axis lattice parameter as compared tothe literature value [28]. The disorder in the graphite is found to bepreserved in the lithiated samples that are prepared from com-pressed graphite, as illustrated by the broad (110) and (111) re-flections in the XRD scan of LiC6 (Fig. 2b). This is again most likelycaused by the compressed graphite used as initial material duringthe LiC6 synthesis: the compressed graphite particles are hinderedin their volume expansion during lithiation. Due to this experi-mental particularity, reference patterns of LiC6 and graphite withslightly adapted c-axis parameters (3.64 and 6.74 Å) were used forphase identification and evaluation (see Fig. 2).
Fig. 3a displays XRD scans of LiC6 in the initial, polished andheat-treated conditions. For reasons of comparison, an XRD patternof the starting material graphite is also plotted. The as-prepared,golden colored LiC6 sample (not polished, not heat treated) ex-hibits a pronounced peak at 24.5� which can be allocated to the(001) reflection of LiC6 when the adapted c-axis parameter of 3.64 Åis taken into account. The reflection is relatively broad. This mayeither be due to a poor crystallinity of LiC6, arising from the dis-order in the initial graphite, or to the presence of a considerableamount of LiC12 in the sample. Regarding the fact that the (002)peak in the XRD scan of the used graphite is very sharp compared tothe (001) peak of LiC6 (Figs. 2 and 3) and the results of the XRDmeasurements on the polished and heat treated samples (Fig. 3),the second option (presence of LiC12 in the as-prepared sample)appears to be more likely.
After polishing, the (002) reflection of the LiC12 phase at 24.9� isclearly distinguishable from the (001) reflection of LiC6 (Fig. 3),illustrating that the metallographic preparation of Li-GICs causes aslight change in the phase composition due to Li loss [46]. However,the reflection occurs at a lower diffraction angle than expectedfrom the literature [28], indicating a larger lattice parameter (seediscussion of the intercalation mechanism below). The micro-structure of this sample is shown in Fig. 4a. A bright yellow phase,consisting of particles of about 10e20 mm size are visible, sur-rounded by a dark red phase. The sample contains pores which
Fig. 3. a) XRD scans of the initial, polished and annealed LiC6 samples and of graphite (frographite (thin lines at the bottom); the c-axis value in the reference pattern of LiC6 was cpattern, a c-axis value of 6,74 Å (somewhat larger compared to [52]) was used for the calc
appear black in the image and can already be found in the micro-graph of the initial graphite sample (Fig. 4d). Themicrostructures ofthis sample and the sample annealed for 72 h were already shownin Ref. [46] and are correlated here with the phase characterizationby XRD. Heat treatment at 330 �C for different annealing times wasused to achieve the targeted de-intercalation of the samples. After72 h annealing, the (002) reflection of LiC12 is more pronounced,while the intensity of the (001) reflection of LiC6 is decreased(Fig. 3a). Thus, the fraction of LiC12 has increased with respect toLiC6 due to Li evaporation. The (002) reflection position is shiftedtowards a higher diffraction angle as compared to the untreatedsample. The microstructure of this sample still contains the abovementioned phase particles, although the color of the phase appearsto be less bright and more reddish as compared to the initialsample. The fraction of the surrounding phase, which changed itscolor from dark red to violet, has increased slightly. After 96 h,according to the XRD scan the sample does not contain LiC6anymore, and the position of the (002) reflection of LiC12 is shiftedto a higher 2q value. No yellow phase can be identified in themicrograph (Fig. 4c). Instead, small red dots are visible. The color ofthe surrounding phase changed to dark violet. The white regions inthe image can be attributed to residuals of the polishing suspen-sion. Regarding the fact that the fraction of visible phase particlesdecreases with decreasing LiC6 content as observed in the XRDscans, this phase was allocated to LiC6 [46]. Meanwhile, the sur-rounding phase is identified as stage 2 Li-GIC with variable Licontent, as shown by the color change from dark red (higher Licontent) to dark violet (lower Li content) and shift of the (002)reflection. In the sample annealed for 144 h, the reflection positionremains nearly unchanged with respect to the 96 h sample. After240 h, the (002) reflection has shifted to a much higher diffractionangle (29�) and thus a distinctly smaller c-axis parameter. The (101)reflection of graphite can be identified at 44.5�, and the (004)reflection at 53.5�. Obviously, this sample consists of graphite withLi atoms uniformly dissolved in the lattice. This phase has beennamed ‘dilute stage 1’ in the literature [15,24].
The c-axis parameters of the Li-GIC samples in the initial, pol-ished and heat-treated conditions are shown in Fig. 3b. The errors
m top to bottom) in comparison with calculated reference patterns of LiC6, LiC12 andhanged to 3,64 Å compared to the value given in Ref. [28]. For the graphite referenceulation. b) c-axis parameters for the samples, depending on processing conditions.
Fig. 4. Microstructures of Li-C intercalation compounds and graphite, decreasing Li content from a) to d). a) LiC6 after polishing: bright yellow phase regions are surrounded by a redphase, b) annealed at 330 �C for 72 h: phase regions with slightly darkened coloring compared to the non-annealed sample, the fraction of the surrounding phase has increased andits color has changed to red-violet, c) annealed at 330 �C for 96 h: only a few spots with red-violet color, the predominant phase has changed its color to dark blue, d) graphite, usedas initial material for Li-C synthesis: only a single phase and pores are visible. (For interpretation of the references to colour in this figure legend, the reader is referred to the webversion of this article.)
M. Drüe et al. / Journal of Power Sources 353 (2017) 58e6662
calculated by the MAUD software are extremely small and thus notplotted. The c-axis parameter of LiC6 is found to be nearly constantin the annealed samples, indicating that this phase keeps itsstacking and interplanar distance until it is dissolved (Fig. 3). Theshift of the (002) LiC12 reflection towards higher diffraction anglesis accompanied by a decrease of the c lattice parameter for the stage2 phase (Fig. 3b). The c values are somewhat larger than reportedfor LiC12 in the literature (7.02 Å) [28] for all heat treated samplesexcept the one annealed for 240 h. The c-axis parameter of thissample (6.85 Å) is below the literature value for LiC12, but still abovethe c axis parameter of graphite [52], indicating that a ‘dilute stage1’ has formed which can be considered as a solid solution of Li ingraphite. This is also confirmed by the occurrence of the (101) and(004) reflections of graphite in the XRD scan of this sample asalready mentioned above (Fig. 3a).
The polished LiC6 sample and the sample that underwent the72 h heat treatment apparently contain two phases, because the(001) reflection of LiC6 and the (002) reflection of LiC12 are presentsimultaneously. However, when the LiC6 phase has disappearedcompletely (96 h annealing or longer), only one phase is present.This phase is attributed to stage 2 or LiC12, although slight de-viations in the lattice parameters with respect to literature valuesare observed. The peak position of the (002) reflection shifts to-wards higher diffraction angles with increasing annealing time toapproximately the c value of graphite. This behavior is typical forsolid solutions. A similar effect is documented for higher stagesthan 2 in the literature [25e28]. The solid solution hypothesis issupported by the micrographs that show no distinct contrast, (i.e.former phase particles) when the LiC6 phase has disappearedcompletely.
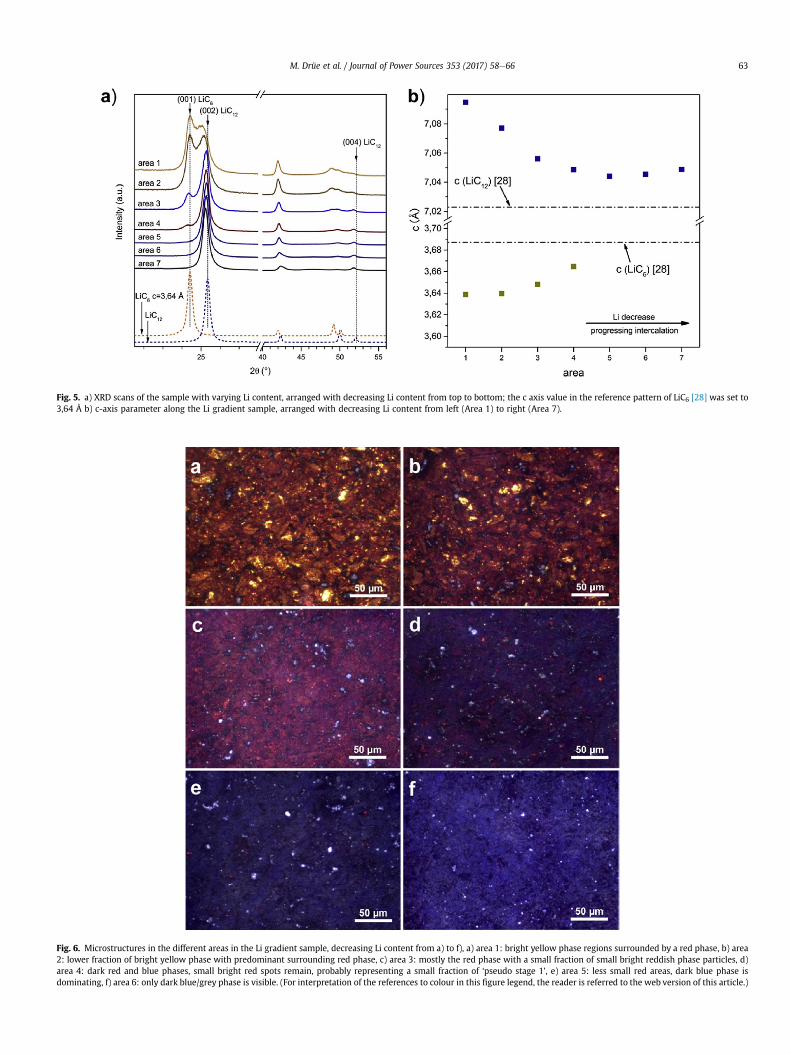
A similar behavior is found for the sample with Li concentrationgradient, which was used for the investigation of the intercalationmechanism. The sample is divided into seven areas, area 1
representing the highest and area 7 the lowest Li content (Fig. 1b).The microstructure in the Li rich area 1 (Fig. 6a) displays bright
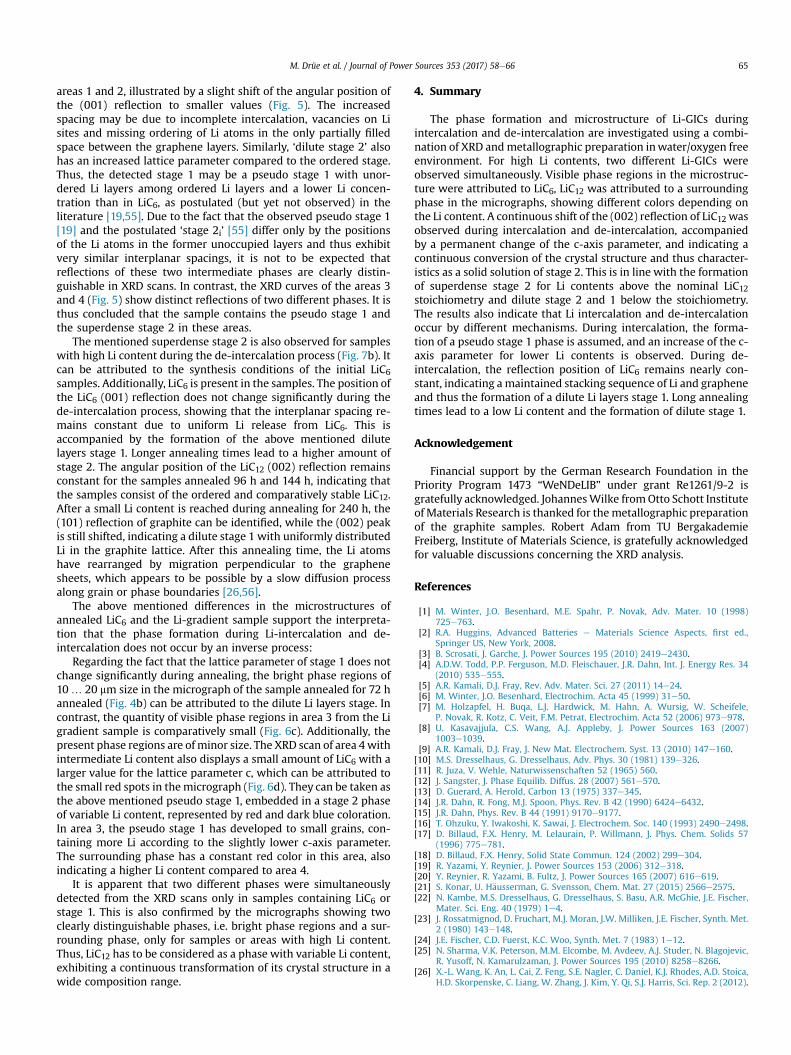
yellow phase regions and a surrounding red phase, correspondingto the as-prepared LiC6 sample. With decreasing Li content, thebright yellow phase gradually disappears, and the color of thesurrounding phase changes from dark red to violet (Fig. 6b,c,d) andfinally to dark blue and grey (areas 6 and 7) (Fig. 6 e,f). The XRDscans show reflections of both LiC6 and LiC12 for the areas 1 to 4. The(001) reflection of LiC6 is shifted towards a higher diffraction angleas compared to literature values, as observed in the samplesdescribed above. The (002) reflection of LiC12 is found to changefrom its 2q position depending on the Li content, starting with alower 2q value in the Li rich region that increases to higherdiffraction angles with decreasing Li content. As already observedin the heat treated samples, the value of the lattice parameter c ishigher than the literature value of LiC12 [28], possibly a conse-quence of the observed disorder in the initial graphite. The devel-opment of the c-axis lattice parameter as a function of Li content inthis sample is comparable to the samples in the annealing experi-ments (Fig. 5b). However, there are some slight differences. In theareas 6 and 7 with low Li content, a small increase of the c valuecompared to the preceding areas with higher Li content is observed,resulting in lower diffraction angles of the (002) reflection (Fig. 5a).
The results of the XRD analysis of the Li-GICs in combinationwith metallography presented in this work show slight, butnoticeable differences between the annealed samples and the Li-gradient sample. In the annealed samples, the lattice parameter cof LiC6 remains essentially constant (Fig. 3b), independent of the Li-content. The behavior of c of LiC6 in the gradient sample is notexactly the same. In the areas with a low LiC6 phase fraction, i.e.areas 3 and 4, the (001) reflection of LiC6 shows a shift towardslower diffraction angles compared to areas 1 and 2 (Fig. 5a),implying an increase of lattice parameter c with decreasing LiC6
Fig. 5. a) XRD scans of the sample with varying Li content, arranged with decreasing Li content from top to bottom; the c axis value in the reference pattern of LiC6 [28] was set to3,64 Å b) c-axis parameter along the Li gradient sample, arranged with decreasing Li content from left (Area 1) to right (Area 7).
Fig. 6. Microstructures in the different areas in the Li gradient sample, decreasing Li content from a) to f), a) area 1: bright yellow phase regions surrounded by a red phase, b) area2: lower fraction of bright yellow phase with predominant surrounding red phase, c) area 3: mostly the red phase with a small fraction of small bright reddish phase particles, d)area 4: dark red and blue phases, small bright red spots remain, probably representing a small fraction of ‘pseudo stage 1’, e) area 5: less small red areas, dark blue phase isdominating, f) area 6: only dark blue/grey phase is visible. (For interpretation of the references to colour in this figure legend, the reader is referred to the web version of this article.)
M. Drüe et al. / Journal of Power Sources 353 (2017) 58e66 63
M. Drüe et al. / Journal of Power Sources 353 (2017) 58e6664
content. Additionally, the micrographs of area 3 in the gradientsample and the sample annealed for 72 h, which both have a similarcomposition according to the intensity ratios of the LiC6 (001) andLiC12 (002) reflections, show differences in the microstructures. Apre-dominant red-violet phase (Figs. 4b and 6c) can be identified inboth samples, but the annealed sample also contains a considerablefraction of LiC6 phase regions, which appear darker than the grainsin the initial LiC6 sample and exhibit a size of about 10… 20 mm; incontrast, in the micrograph of area 4 only a small amount of brightreddish, spot-like phase regions of minor size can be identifiedbeside the red-violet phase (Fig. 6c). These differences in XRD scansand microstructures are interpreted as indications that Li interca-lation and de-intercalation in graphite do not proceed perfectlyinversely by a symmetric mechanism. Such a behavior was alreadyreported for electrochemical cycling of graphite electrodes[19,26,27,55]. According to the literature, several different phasesbeside the stoichiometric LiC6 and LiC12 occur during Li uptake andrelease, depending on the Li content.
For low Li contents, dilute stages 1 and 2 were reported in theliterature [15,17,24,32], showing the same stacking sequencesobserved in LiC6 and LiC12 but a lack of the Li superstructure. Dilutestage 2 is characterized by somewhat larger mean layer spacing,causing a small increase of the c axis lattice parameter compared tothe ordered LiC12 [21]. In dilute stage 1, Li is uniformly distributedbetween the graphene layers of the graphite, which results in anincrease of the interplanar spacing as compared to graphite [15].
For Li contents between LiC6 and LiC12, some intermediatestages are under discussion. According to literature work, furtherlithiation of LiC12 leads to the intercalation of more Li than expectedfrom the stoichiometry inside the already occupied layers, resultingin a ‘superdense’ stage 2 [19]. Filhol et al. stated an intermediatestage 2, or ‘stage 2i’ with Li in fixed positions in the formerly un-occupied layers of stage 2 as the most probable intermediate phaseduring Li uptake from first principles calculations [55]. Additionally,‘fractionary’ stages with unoccupied layers amongst occupied Lilayers [19] were described as possible intermediate phases during
Fig. 7. Schematic representation of the Li-GICs observed in this work a) intercalation via dintercalation via dilute Li layers stage 1 observed in the annealing experiments.
intercalation. During the de-intercalation process starting withLiC6, it was reported that Li is removed equivalently from everyoccupied layer, forming a ‘dilute Li layers stage 1’with a somewhatlower Li content [19,55] while the stacking sequence of stage 1 ismaintained. Regarding the results in this work and taking the abovementioned references into account, the phases formed during Liintercalation and de-intercalation are interpreted as shown inFig. 7:
During the intercalation process (Fig. 7a), a dilute stage 2 isformed at low Li content in the areas 6 and 7 of the Li gradientsample. This is indicated by the lower diffraction angles of the(002) reflection compared to the Li richer areas (Fig. 5), due to asomewhat larger mean layer spacing, which is typical for dilutestage 2 [17,21]. Higher stages with lower Li contents were notobserved in this sample. In Area 5, the c-axis parameter of stage 2reaches a minimum (Fig. 5b), indicating that the dilute stage 2 hastransformed to ordered LiC12, although the theoretical c value ofLiC12 is not attained. Phase transformation from dilute stage 2 toLiC12 has also been reported with increasing Li content uponelectrochemical Li intercalation [20]. In Area 4, the (001) reflectionof LiC6 occurs beside the (002) LiC12 reflection. Towards areas 2and 1 with the highest Li contents, a continuous shift of theangular position (Fig. 5a) of the LiC12 (002) reflection to lowervalues and an increase of the c-axis parameter (Fig. 5b) is moni-tored in the sample. Regarding the fact that the c-axis relatedreflections of stage 1 and stage 2 can still be clearly distinguishedin the XRD scan and thus the stacking sequence is maintained, it ismost likely that the Li intercalation of LiC12 is accompanied by aformation of a superdense stage 2 [19]. Despite the fact that thestacking sequence is not changed, the higher Li density probablycauses higher repulsive interactions between the Li layers, leadingto a higher interplanar spacing and a shift of the (002) peak ofLiC12 to lower diffraction angles. In contrast, the formation of theabove mentioned ‘stage 2i’ [55] is questionable due to theobserved intermediate stage 1 phase: The c-axis parameter of LiC6is found to be larger in the areas 3 and 4 as compared to the Li-rich
ense stage 2 and pseudo stage 1 observed in the sample with the Li gradient; b) de-
M. Drüe et al. / Journal of Power Sources 353 (2017) 58e66 65
areas 1 and 2, illustrated by a slight shift of the angular position ofthe (001) reflection to smaller values (Fig. 5). The increasedspacing may be due to incomplete intercalation, vacancies on Lisites and missing ordering of Li atoms in the only partially filledspace between the graphene layers. Similarly, ‘dilute stage 2’ alsohas an increased lattice parameter compared to the ordered stage.Thus, the detected stage 1 may be a pseudo stage 1 with unor-dered Li layers among ordered Li layers and a lower Li concen-tration than in LiC6, as postulated (but yet not observed) in theliterature [19,55]. Due to the fact that the observed pseudo stage 1[19] and the postulated ‘stage 2i’ [55] differ only by the positionsof the Li atoms in the former unoccupied layers and thus exhibitvery similar interplanar spacings, it is not to be expected thatreflections of these two intermediate phases are clearly distin-guishable in XRD scans. In contrast, the XRD curves of the areas 3and 4 (Fig. 5) show distinct reflections of two different phases. It isthus concluded that the sample contains the pseudo stage 1 andthe superdense stage 2 in these areas.
The mentioned superdense stage 2 is also observed for sampleswith high Li content during the de-intercalation process (Fig. 7b). Itcan be attributed to the synthesis conditions of the initial LiC6
samples. Additionally, LiC6 is present in the samples. The position ofthe LiC6 (001) reflection does not change significantly during thede-intercalation process, showing that the interplanar spacing re-mains constant due to uniform Li release from LiC6. This isaccompanied by the formation of the above mentioned dilutelayers stage 1. Longer annealing times lead to a higher amount ofstage 2. The angular position of the LiC12 (002) reflection remainsconstant for the samples annealed 96 h and 144 h, indicating thatthe samples consist of the ordered and comparatively stable LiC12.After a small Li content is reached during annealing for 240 h, the(101) reflection of graphite can be identified, while the (002) peakis still shifted, indicating a dilute stage 1 with uniformly distributedLi in the graphite lattice. After this annealing time, the Li atomshave rearranged by migration perpendicular to the graphenesheets, which appears to be possible by a slow diffusion processalong grain or phase boundaries [26,56].
The above mentioned differences in the microstructures ofannealed LiC6 and the Li-gradient sample support the interpreta-tion that the phase formation during Li-intercalation and de-intercalation does not occur by an inverse process:
Regarding the fact that the lattice parameter of stage 1 does notchange significantly during annealing, the bright phase regions of10… 20 mm size in the micrograph of the sample annealed for 72 hannealed (Fig. 4b) can be attributed to the dilute Li layers stage. Incontrast, the quantity of visible phase regions in area 3 from the Ligradient sample is comparatively small (Fig. 6c). Additionally, thepresent phase regions are ofminor size. The XRD scan of area 4withintermediate Li content also displays a small amount of LiC6 with alarger value for the lattice parameter c, which can be attributed tothe small red spots in themicrograph (Fig. 6d). They can be taken asthe above mentioned pseudo stage 1, embedded in a stage 2 phaseof variable Li content, represented by red and dark blue coloration.In area 3, the pseudo stage 1 has developed to small grains, con-taining more Li according to the slightly lower c-axis parameter.The surrounding phase has a constant red color in this area, alsoindicating a higher Li content compared to area 4.
It is apparent that two different phases were simultaneouslydetected from the XRD scans only in samples containing LiC6 orstage 1. This is also confirmed by the micrographs showing twoclearly distinguishable phases, i.e. bright phase regions and a sur-rounding phase, only for samples or areas with high Li content.Thus, LiC12 has to be considered as a phase with variable Li content,exhibiting a continuous transformation of its crystal structure in awide composition range.
4. Summary
The phase formation and microstructure of Li-GICs duringintercalation and de-intercalation are investigated using a combi-nation of XRD andmetallographic preparation inwater/oxygen freeenvironment. For high Li contents, two different Li-GICs wereobserved simultaneously. Visible phase regions in the microstruc-ture were attributed to LiC6, LiC12 was attributed to a surroundingphase in the micrographs, showing different colors depending onthe Li content. A continuous shift of the (002) reflection of LiC12 wasobserved during intercalation and de-intercalation, accompaniedby a permanent change of the c-axis parameter, and indicating acontinuous conversion of the crystal structure and thus character-istics as a solid solution of stage 2. This is in line with the formationof superdense stage 2 for Li contents above the nominal LiC12stoichiometry and dilute stage 2 and 1 below the stoichiometry.The results also indicate that Li intercalation and de-intercalationoccur by different mechanisms. During intercalation, the forma-tion of a pseudo stage 1 phase is assumed, and an increase of the c-axis parameter for lower Li contents is observed. During de-intercalation, the reflection position of LiC6 remains nearly con-stant, indicating a maintained stacking sequence of Li and grapheneand thus the formation of a dilute Li layers stage 1. Long annealingtimes lead to a low Li content and the formation of dilute stage 1.
Acknowledgement
Financial support by the German Research Foundation in thePriority Program 1473 “WeNDeLIB” under grant Re1261/9-2 isgratefully acknowledged. JohannesWilke fromOtto Schott Instituteof Materials Research is thanked for themetallographic preparationof the graphite samples. Robert Adam from TU BergakademieFreiberg, Institute of Materials Science, is gratefully acknowledgedfor valuable discussions concerning the XRD analysis.
References
[1] M. Winter, J.O. Besenhard, M.E. Spahr, P. Novak, Adv. Mater. 10 (1998)725e763.
[2] R.A. Huggins, Advanced Batteries e Materials Science Aspects, first ed.,Springer US, New York, 2008.
[3] B. Scrosati, J. Garche, J. Power Sources 195 (2010) 2419e2430.[4] A.D.W. Todd, P.P. Ferguson, M.D. Fleischauer, J.R. Dahn, Int. J. Energy Res. 34
(2010) 535e555.[5] A.R. Kamali, D.J. Fray, Rev. Adv. Mater. Sci. 27 (2011) 14e24.[6] M. Winter, J.O. Besenhard, Electrochim. Acta 45 (1999) 31e50.[7] M. Holzapfel, H. Buqa, L.J. Hardwick, M. Hahn, A. Wursig, W. Scheifele,
P. Novak, R. Kotz, C. Veit, F.M. Petrat, Electrochim. Acta 52 (2006) 973e978.[8] U. Kasavajjula, C.S. Wang, A.J. Appleby, J. Power Sources 163 (2007)
1003e1039.[9] A.R. Kamali, D.J. Fray, J. New Mat. Electrochem. Syst. 13 (2010) 147e160.
[10] M.S. Dresselhaus, G. Dresselhaus, Adv. Phys. 30 (1981) 139e326.[11] R. Juza, V. Wehle, Naturwissenschaften 52 (1965) 560.[12] J. Sangster, J. Phase Equilib. Diffus. 28 (2007) 561e570.[13] D. Guerard, A. Herold, Carbon 13 (1975) 337e345.[14] J.R. Dahn, R. Fong, M.J. Spoon, Phys. Rev. B 42 (1990) 6424e6432.[15] J.R. Dahn, Phys. Rev. B 44 (1991) 9170e9177.[16] T. Ohzuku, Y. Iwakoshi, K. Sawai, J. Electrochem. Soc. 140 (1993) 2490e2498.[17] D. Billaud, F.X. Henry, M. Lelaurain, P. Willmann, J. Phys. Chem. Solids 57
(1996) 775e781.[18] D. Billaud, F.X. Henry, Solid State Commun. 124 (2002) 299e304.[19] R. Yazami, Y. Reynier, J. Power Sources 153 (2006) 312e318.[20] Y. Reynier, R. Yazami, B. Fultz, J. Power Sources 165 (2007) 616e619.[21] S. Konar, U. H€ausserman, G. Svensson, Chem. Mat. 27 (2015) 2566e2575.[22] N. Kambe, M.S. Dresselhaus, G. Dresselhaus, S. Basu, A.R. McGhie, J.E. Fischer,
Mater. Sci. Eng. 40 (1979) 1e4.[23] J. Rossatmignod, D. Fruchart, M.J. Moran, J.W. Milliken, J.E. Fischer, Synth. Met.
2 (1980) 143e148.[24] J.E. Fischer, C.D. Fuerst, K.C. Woo, Synth. Met. 7 (1983) 1e12.[25] N. Sharma, V.K. Peterson, M.M. Elcombe, M. Avdeev, A.J. Studer, N. Blagojevic,
R. Yusoff, N. Kamarulzaman, J. Power Sources 195 (2010) 8258e8266.[26] X.-L. Wang, K. An, L. Cai, Z. Feng, S.E. Nagler, C. Daniel, K.J. Rhodes, A.D. Stoica,
H.D. Skorpenske, C. Liang, W. Zhang, J. Kim, Y. Qi, S.J. Harris, Sci. Rep. 2 (2012).
M. Drüe et al. / Journal of Power Sources 353 (2017) 58e6666
[27] A. Senyshyn, O. Dolotko, M.J. Muhlbauer, K. Nikolowski, H. Fuess,H. Ehrenberg, J. Electrochem. Soc. 160 (2013) A3198eA3205.
[28] B. Vadlamani, K. An, M. Jagannathan, K.S.R. Chandran, J. Electrochem. Soc. 161(2014) A1731eA1741.
[29] A. Senyshyn, M.J. Mühlbauer, O. Dolotko, M. Hofmann, T. Pirling, H. Ehrenberg,J. Power Sources 245 (2014) 678e683.
[30] A. Senyshyn, M.J. Mühlbauer, O. Dolotko, H. Ehrenberg, J. Power Sources 282(2015) 235e240.
[31] S. Taminato, M. Yonemura, S. Shiotani, T. Kamiyama, S. Torii, M. Nagao,Y. Ishikawa, K. Mori, T. Fukunaga, Y. Onodera, T. Naka, M. Morishima, Y. Ukyo,D.S. Adipranoto, H. Arai, Y. Uchimoto, Z. Ogumi, K. Suzuki, M. Hirayama,R. Kanno, Sci. Rep. 6 (2016).
[32] D.P. Divincenzo, C.D. Fuerst, J.E. Fischer, Phys. Rev. B 29 (1984) 1115e1117.[33] Y. Guo, R.B. Smith, Z. Yu, D.K. Efetov, J. Wang, P. Kim, M.Z. Bazant, L.E. Brus,
J. Phys. Chem. Lett. 7 (2016) 2151e2156.[34] S.J. Harris, A. Timmons, D.R. Baker, C. Monroe, Chem. Phys. Lett. 485 (2010)
265e274.[35] P. Maire, H. Kaiser, W. Scheifele, P. Novak, J. Electroanal. Chem. 644 (2010)
127e131.[36] Y. Qi, H.B. Guo, L.G. Hector, A. Timmons, J. Electrochem. Soc. 157 (2010)
A558eA566.[37] J.S. Bowles, Trans. Am. Inst. Min. Metallurgical Eng. 191 (1951) 44e46.[38] M. Krystian, W. Pichl, Mater. Charact. 46 (2001) 1e9.[39] M. Krystian, W. Pichl, Phys. Rev. B 62 (2000) 13956e13962.[40] S. Dallek, D.W. Ernst, B.F. Larrick, in: Progress Report, Naval Surface Weapons
Center, 1978.[41] J.B. Ratchford, B.A. Crawford, J. Wolfenstine, J.L. Allen, C.A. Lundgren, J. Power
Ratchford (Ed.), Army Research Laboratory, Adelphi, MD :, 2011.[43] S. Gorse, B. Kugler, T. Samtleben, T. Waldmann, M. Wohlfahrt-Mehrens,
G. Schneider, V. Knoblauch, Prakt. Metallogr.-Pract. Metallogr. 51 (2014)829e848.
[44] C. Hafner, T. Bernthaler, V. Knoblauch, G. Schneider, Prakt. Metallogr.-Pract.Metallogr. 49 (2012) 75e85.
[45] C. Weisenberger, G. Guth, T. Bernthaler, V. Knoblauch, Prakt. Metallogr.-Pract.Metallogr. 51 (2014) 5e31.
[46] M. Drüe, M. Seyring, A. Grasemann, M. Rettenmayr, Prakt. Metallogr.-Pract.Metallogr. 53 (2016) 745e759.
[47] J.E. Fischer, H.J. Kim, Synth. Met. 23 (1988) 121e126.[48] J.R. Dahn, R.E. Mar, M.D. Fleischauer, M.N. Obrovac, J. Electrochem. Soc. 153
(2006) A1211eA1220.[49] M. Drüe, M. Seyring, A. Kozlov, X. Song, R. Schmid-Fetzer, M. Rettenmayr,
J. Alloy. Compd. 575 (2013) 403e407.[50] L.B. Ebert, Annu. Rev. Mater. Sci. 6 (1976) 181e211.[51] L. Lutterotti, S. Matthies, H. Wenk, in: Proceeding of the Twelfth International
Conference on Textures of Materials (ICOTOM-12), NRC Research Press,Ottowa, Canada, 1999, p. 1599.
[52] P. Trucano, R. Chen, Nature 258 (1975) 136e137.[53] H. Wu, M.R. Hartman, T.J. Udovic, J.J. Rush, W. Zhou, R.C. Bowman, J.J. Vajo,
Acta Crystallogr. Sect. B Struct. Sci. 63 (2007) 63e68.[54] R.W.G. Wyckoff, Sample known as white tin, in: Crystal Structures, Inter-
science Publishers, New York, 1963, pp. 7e83.[55] J.S. Filhol, C. Combelles, R. Yazami, M.L. Doublet, J. Phys. Chem. C 112 (2008)
3982e3988.[56] K. Persson, V.A. Sethuraman, L.J. Hardwick, Y. Hinuma, Y.S. Meng, A. van der
Ven, V. Srinivasan, R. Kostecki, G. Ceder, J. Phys. Chem. Lett. 1 (2010)1176e1180.