A Stated Preference Analysis of Real-Time Public Transit Stop Information A New Customer Satisfaction Index for Evaluating Transit Service Quality Bus Transit Service Planning and Operations in a Competitive Environment Transit Response to Congestion Pricing Opportunities: Policy and Practice in the U.S. Integrating Bicycling and Public Transport in North America e Concept of a Regional Maintenance Center Volume 12, No. 3, 2009 Journal of Public Transportation N C T R Brian Caulfield Margaret O’Mahony Laura Eboli Gabriella Mazzulla Ahmed M. El-Geneidy John Hourdos Jessica Horning Matthew H. Hardy John Pucher Ralph Buehler Mario G. Beruvides James L. Simonton Natalie M. Waters Ean Ng Siva Chaivichitmalakul Cheng-Chu Chiu-Wei Pelin Z. Altintas Phil Nash Luis Barroso Paul Moon
Transcript
A Stated Preference Analysis of Real-Time Public Transit Stop Information
A New Customer Satisfaction Index for Evaluating Transit Service Quality
Bus Transit Service Planning and Operations in a Competitive Environment
Transit Response to Congestion Pricing Opportunities: Policy and Practice in the U.S.
Integrating Bicycling and Public Transport in North America
The Concept of a Regional Maintenance Center
Volume 12, No. 3, 2009
Vo
lum
e 12, No
. 3
Jo
urn
al of P
ub
lic Transp
ortatio
n
2009 N C T R
Brian CaulfieldMargaret O’Mahony
Laura EboliGabriella Mazzulla
Ahmed M. El-GeneidyJohn HourdosJessica Horning
Matthew H. Hardy
John PucherRalph Buehler
Mario G. BeruvidesJames L. SimontonNatalie M. WatersEan NgSiva ChaivichitmalakulCheng-Chu Chiu-WeiPelin Z. AltintasPhil NashLuis BarrosoPaul Moon
Volume 12, No. 3, 2009ISSN 1077-291X
The Journal of Public Transportation is published quarterly by
National Center for Transit ResearchCenter for Urban Transportation Research
University of South Florida • College of Engineering4202 East Fowler Avenue, CUT100
A Stated Preference Analysis of Real-Time Public Transit Stop Information Brian Caulfield, Margaret O’Mahony ...............................................................................................1
A New Customer Satisfaction Index for Evaluating Transit Service QualityLaura Eboli, Gabriella Mazzulla ....................................................................................................... 21
Bus Transit Service Planning and Operations in a Competitive EnvironmentAhmed M. El-Geneidy, John Hourdos, Jessica Horning .......................................................... 39
Transit Response to Congestion Pricing Opportunities: Policy and Practice in the U.S.Matthew H. Hardy .................................................................................................................................. 61
Integrating Bicycling and Public Transport in North AmericaJohn Pucher, Ralph Buehler ................................................................................................................. 79
The Concept of a Regional Maintenance CenterMario G. Beruvides, James L. Simonton, Natalie M. Waters, Ean Ng, Siva Chaivichitmalakul, Cheng-Chu Chiu-Wei, Pelin Z. Altintas, Phil Nash, Luis Barroso, Paul Moon ....................................................................................................................105
A Stated Preference Analysis of Real-Time Public Transit Stop Information
1
A Stated Preference Analysis of Real-Time Public Transit
Stop Information Brian Caulfield and Margaret O’Mahony
Trinity College, Dublin, Ireland
Abstract
This paper presents the results of a study conducted to examine the benefits derived from real-time public transit stop information. This research examines the prefer-ences between several options of receiving real-time public transit stop information. The literature states that one of the main reasons individuals access real-time infor-mation is to remove the uncertainty when using public transit. This relationship was examined to ascertain if the provision of real-time public transit information can remove the uncertainty and frustration associated with using public transit.
A nested logit model structure was applied in this study to examine the benefits derived from accessing real-time public transit information. These models are estimated on seg-ments of the dataset to ascertain how the mode of transport used by the respondents impacts the benefits derived from using real-time public transit information. The results of this study demonstrate that passengers derive the greatest benefit from access-ing transit stop information from real-time information displays. Respondents were shown to obtain the second highest utility when accessing transit stop information via a mobile phone short message service (SMS). Bus users were found to gain the highest benefit from the provision of real-time transit stop information.
Journal of Public Transportation, Vol. 12, No. 3, 2009
2
Introduction and Background Real-time public transit information is an individual-specific travel demand management tool that is used to facilitate individuals while planning their public transit trips. The provision of such information has been shown to encourage indi-viduals to examine their public transit options and choose the service that meets their requirements.
The public transport system in Dublin consists of a large bus network, two light rail lines, and a heavy rail network. At the time of this study, there was no single source of public transit information on all modes of transit available in Dublin. This lack of information can act as a barrier to individuals making integrated public transit trips. Each of the public transit operators provides a website that contains timetables of all of the scheduled services and the routes provided. Dublin Bus in 2004 introduced a short message service (SMS) called “BUSTXT.” This service pro-vides users with the departure time from the terminus of the next three services in either direction when the user sends a message requesting information on a specific bus route. This service is available at a charge of 30c per message (Dublin Bus 2007). The information provided by this service is not real-time. In the same year, Irish Rail introduced a similar service for urban rail users called “DARTXT.” The service works in a way similar to the Dublin Bus service; however, the informa-tion provided is real-time information. The cost of the service is 30c per message (Irish Rail 2007).
One of the main motivations for this research was to examine what information individuals require while waiting at their transit stop or station. Given that the cost of investment in providing real-time information is so large, it is important to understand what information individuals require. This research examines indi-viduals’ preferences for accessing real-time public transit information. To measure these preferences, a stated preference study was conducted to ascertain how respondents would value the introduction of several methods of public transit stop information.
Preferences for real-time public transit information are examined in this paper using a nested multi-nominal logit model. Several characteristics of an individual’s trip, such as working hours and wait-time at stop/station, are examined to deter-mine what impact they have on the benefits derived from real-time public transit information.
A Stated Preference Analysis of Real-Time Public Transit Stop Information
3
Public transit users traditionally tend to overestimate their waiting time at stops/stations (Nijkamp et al. 1996). Several studies have been conducted to ascertain if the provision of real-time information at bus stops reduces passengers’ perceived wait time. A study conducted on bus users in Stockholm demonstrated that passengers with real-time information displays at their stop overestimated their wait-time by 9-13 percent, compared to 24-30 percent without real-time informa-tion (Kronborg et al. 2002). In London, the provision of real-time information at stops was found to reduce perceived wait time by 26 percent (Schweiger 2003). A 2007 study conducted in the Netherlands examined the introduction of pas-senger information display (PID) on a tram line in The Hague and found that the introduction of this service reduced perceived wait time by 20 percent (Dziekan and Kottenhoff 2007).
Wolinetz et al. (2001) conducted a survey of residents in San Francisco to identify their preferences for real-time transport information via a call center. Initially, respondents were asked to identify their preference for paying for the service; 17 percent indicated they would pay on a monthly basis, 56 percent on a call-by-call basis, and 22 percent said they would not use the service if they had to pay. A total of 53 percent were found to be willing to pay up to $1 (USD) per call, and 38 per-cent indicated they would pay up to $7 (USD) per month for this service.
The empirical evidence demonstrates that individuals are very price-sensitive when it comes to paying for real-time information. Polydoropoulou et al. (1997), in an examination of the traffic information system SmarTraveler system in Bos-ton, found that respondents in the stated preference survey were very sensitive to an increase in price. Englisher et al. (1997) conducted a study of the same system in Boston and also found respondents to be very price-sensitive to an increase in the price of accessing traffic information. The authors found that when respon-dents were asked if they would pay a fee to access real-time traffic information, the projected use of the system fell by 36 percent. In 2003, a similar study of the multimodal transport information system TavInfo in San Francisco found that respondents to a stated preference study were found to be quite sensitive to an increase in price (Khattak et al. 2003). Dedicated real-time public transit informa-tion systems also have been shown to be price sensitive. Molin et al. (2007), in a study of providing real-time information at public transit interchange points, found that the price of receiving this information was one of the most important attributes, demonstrating that respondents were highly price-sensitive.
Journal of Public Transportation, Vol. 12, No. 3, 2009
4
Wardman (2003) examined the perceived reduction in transit stop wait-time for bus passengers after the introduction of real-time information for three bus routes in London. The findings show that respondents, in a face-to-face survey, indicated that 65 percent, 24 percent, and 21 percent (at each of the routes) demonstrated that they had a shorter wait time due to the provision of real-time information. The same study examined anxiety of waiting at a bus stop at night and found that 46 percent of respondents felt safer at their bus stop if they knew when the bus was due to arrive.
In a public transit network with a large number of passengers transferring between different modes, the requirements for accurate real-time information increases. In Hong Kong, it was estimated that up to one-fifth of passengers make a transfer during their daily commute (Abdel-Aty 2001). In a study conducted in Hong Kong to examine passenger preferences for real-time information, it was found that respondents derived the greatest benefit from information delivered via a mobile device, either a mobile phone or a personal digital assistant (PDA). The authors found that as travel time and trip complexity increased, so, too, did the likelihood that an individual would choose to access real-time information using SMS (short message service) or a PDA. The results also demonstrated that females, those with higher incomes, and those on a monthly mobile phone contract were more likely to choose to obtain real-time information.
DataData Collection To establish individual preferences between real-time public transit information options, a stated preference survey was conducted. The survey took place over a two-week period from the April 18 - May 9, 2005, using web-based methods. A controlled sample was taken of office workers in Dublin city center. The selected companies were contacted via their human resources departments, and the survey was then sent out centrally to all employees. A total of 1,500 surveys were distrib-uted to the employees of the companies targeted, and 495 fully-completed surveys were returned, resulting in a response rate of 33 percent. It should be noted that this sample contains only individuals who have access to the internet and work in Dublin City center. As such, this may result in some bias in the results.
A Stated Preference Analysis of Real-Time Public Transit Stop Information
5
Stated Preference Design In the stated preference scenarios examined in this study, respondents were asked to choose between three options of accessing real-time public transit stop infor-mation: SMS, a passenger information display, or a call center. A preliminary study was conducted to ascertain individual preferences for receiving real-time public transit stop information. The results of this study are presented in Caulfield and O’Mahony (2007). The purpose of this preliminary study was to gain feed back on individual opinions of public transit information in Dublin and to inform the design of the main stated preference study (the results of which are presented in this paper). As SMS or call centers could be accessed prior to the respondent reaching the transit stop, respondents were instructed that they could choose only one of these options when they arrived at their transit stop. Each of the options considered had three cost levels, three reduction in wait-time percentages, and two options for the type of information provided. The attributes and attribute levels for each of the options considered by the respondents are as follows:
Passenger information display: 0, 10, and 20 percent reductions in wait time •at transit stop; 0, 15, and 30c increase in public transit fare per-trip; real-time information provided or static information provided.
SMS: 0, 10, and 20 percent reductions in wait time; 0, 15, and 30c increase •in public transit fare per trip; real-time information provided or static information provided.
Call center: 0, 10, and 20 percent reductions in wait time; 0, 15, and 30c •increase in public transit fare per trip; real-time information provided or static information provided.
An example of one of the stated choice scenarios presented to the respondents can be seen in Figure 1.
The data collected from the stated preference survey are modelled using a nested multinomial logit model. For more detail on this approach, see Hensher et al. (2005), Train (2003), or Louviere et al. (2000). In the survey, respondents were asked to choose between different stated preference scenarios. Respondents were presented with information on each of the options provided. The call center option was described as having an automated response providing real-time infor-mation. To aid respondent comprehension of the scenarios presented, a number of pictures of real-life examples of real-time information services were shown to the respondents in the survey. The survey also was piloted to test that individuals understood the choice scenarios presented in the survey.
Journal of Public Transportation, Vol. 12, No. 3, 2009
6
Situation One: Please consider the following options A-C below, and based upon the information provided, choose your preferred method of receiving public transport information.
Figure 1. Stated Preference Scenario
Results Characteristics of the Sample Table 1 presents characteristics of the sample and compares the age and gender profiles of the sample with those of the population using 2006 Census of Ireland data (CSO 2007). The results show that the sample collected provides a fairly reasonable approximation of the population. The income levels of respondents are not compared, as this information is not released from the Central Statistics Office. The results show that 43 percent of the respondents were male and 57 percent were females. In the questionnaire, respondents were asked to indicate their age using one of the five age bands; under 24, 25-34, 35-44, 45-54 and over 55. A total of 42 percent of respondents were found to be age 25-34, 24 percent were 35-44 and 21 percent were 45-54. Table 1 presents the reported incomes of the respondents to the questionnaire. The results show a wide distribution of income. A total of 37 percent of respondents were found to earn between €20,000 and €50,000 per annum, and 41 percent earn between €50,000 and €100,000 per annum (see Table 1).
Table 2 details the characteristics of the respondents’ trips to work. The findings demonstrate that approximately one-quarter of the respondents use a private car to get to work, with 22 percent driving alone and 3 percent travelling as passengers (see Table 2). The proportion of individuals that either walk or cycle to work was 14 percent and 8 percent, respectively. The remaining respondents in the sample (53%) use public transport, with the majority of these individuals using the bus
A Stated Preference Analysis of Real-Time Public Transit Stop Information
7
Table 1. Characteristics of the Sample
(29%) and the remainder using one of the light/heavy rail options. Seventeen percent of respondents said that they took more than one mode of public transit when travelling to work (see Table 2).
The reported walk times of the respondents from their home to the nearest public transit stop/station are contained in Table 2. A total of 42 percent of respondents are less than a five-minute walk and 28 percent between a 5- and 10-minute walk from their stop/station. The reported wait times at stop/station are presented in Table 2. As with the walk time to stop/station, the majority of respondents indi-cated that the wait time was less than 10 minutes. A total of 32 percent indicated that they had a less than a 5-minute wait, and 44 percent were found to have a wait time of between 5 and 10 minutes.
Journal of Public Transportation, Vol. 12, No. 3, 2009
8
Table 2. Trip Characteristics of the Sample
Opinions of Public Transit Table 3 presents the results of a series of questions asked to ascertain what causes respondents frustration when using public transit. The results in Table 2 are segmented by the mode of transport the respondent said they used on a daily basis, bus, rail and all respondents. Respondents were initially asked if uncertainty regarding the arrival time of their service caused frustration. A total of 80 percent of all users, 79 percent of bus users, and 78 percent of rail users indicated that uncertainty as to the arrival time of their service caused frustration. In the sec-ond question, respondents were asked if not knowing if the service had already
A Stated Preference Analysis of Real-Time Public Transit Stop Information
9
departed caused them frustration. A total of 69 percent of all users, 70 percent of bus users, and 55 percent of rail users said this caused frustration. This result shows that not knowing if the public transit service had already passed caused a higher level of frustration with bus users compared to rail users. Finally, respondents were asked if uncertainty as to the departure time of their public transit service caused frustration. The results in Table 3 show that 70 percent of all users, 73 percent of bus users, and 63 percent of rail users found this uncertainty to cause frustration. This result again shows that rail users are less frustrated with uncertainty.
Table 3. Frustration with Public Transit
Respondents to the survey were asked when they would be most likely to access real-time public transit information. As shown in Table 4, 79 percent of bus users and 78 percent of rail users said they would use real-time information if the weather was bad; 41 percent of all respondents said they would use real-time public transit information if the weather was bad; 45 percent of all respondents and 55 percent of rail respondents said they would consult real-time public transit information if using more than one mode of public transit. Of bus users, 70 percent indicated that they would access real-time public transit information if using a more than one mode of public transit. This result shows that bus users have a higher informa-tion requirement when taking more than one mode of public transit.
In the survey, respondents were asked if they would they consult real-time public transit information if they were running late. Table 4 indicates that 43 percent of all respondents, 46 percent of bus users, and 48 percent of rail users would access
Journal of Public Transportation, Vol. 12, No. 3, 2009
10
real-time information when running late. Respondents were asked if they would consult real-time public transit information if they were using a service for the first time. The results indicated that 73 percent of bus users and 63 percent of rail users would access real-time information when using a service for the first time.
Table 4. Accessing Real-Time Information
Opinion of Real-Time Public Transit Information Provision In the survey, respondents were asked to rate a number of aspects of public transit information provision in Dublin using a five-point scale from “very good” (5) to “very poor” (1). For each of the public transit information options analysed, an average rating was taken for bus users, rail users, and “other” users (drivers, walk-ers, and cyclists). Respondents were asked to rate the quality of maps provided at bus stops/train stations. Bus users were found to have the lowest rating of 1.88, followed by the “other” user group and rail users with ratings of 2.02 and 3.92, respectively (see Table 5). These results suggest that bus users have the lowest opinion of maps provided at bus stops, followed by the “other” user group and rail users. When asked to evaluate the provision of timetables, bus users were found to have the lowest rating of 2.05, followed by the “other” group with a rating of 2.10. Rail users were shown to have a considerably higher rating of 4.05, indicating that the majority of rail users in the sample were satisfied with the quality of timetables provided at rail stations.
A Stated Preference Analysis of Real-Time Public Transit Stop Information
11
Rail users were found to have the highest average rating of 3.99 when evaluating the quality of public transit websites. The “other” user group were found to have the lowest rating of 2.14, followed by bus users with a rating of 2.17 (see Table 5). The average rating for the bus and the “other” user groups were very similar, indi-cating these user groups found the quality of public transit websites to be equally poor. One explanation for this may be that the main internet site for urban rail services in Dublin provides passengers with real-time arrival information. The results show that each of the different user groups was found to equally rate the availability of information on the cost public transit, regardless of mode, with a low ranking.
Table 5. Opinion of Public Transit Information Services
Modelling Results The nested multinomial logit model results estimated in this study are presented in Table 6. For mode detail on this modelling approach, see Hensher et al. (2005). The nested structure that provided the most consistent results in terms of 2(0) and 2(c) values is presented in Figure 2. As shown in Figure 2, the nested structure had two limbs, SMS information on one limb, and passenger information display and call center on the other. The model specifications for all three models produce good 2(0) and 2(c) values. The model 1 2(0) and 2(c) values were estimated to be 0.265 and 0.222; the values for model 2 (bus user) were 0.281 and 0.231, and 0.271 and 0.211 for model 2 (rail user).
Journal of Public Transportation, Vol. 12, No. 3, 2009
12
Table 6. Nested Multinomial Logit Models
* Significant at the 95% confidence level
** Significant at the 99% confidence level
Figure 2. Nested Model Structure
The estimated coefficients for wait time saved for the SMS option were found to be negative and significant at the 99% confidence level (see Table 6). The reduc-tion in wait time coefficient for bus users was found to be -0.034, and -0.027 and
A Stated Preference Analysis of Real-Time Public Transit Stop Information
13
for the rail model (see Table 6). These estimates demonstrate that bus users derive a slightly higher utility from wait time saved compared to rail users.
The coefficients for cost of SMS information were found to be negative and signifi-cant at the 99% confidence level (see Table 6). Bus users were shown to have the lower cost disutility (-0.042) compared to rail users (-0.073). The estimated cost coefficients indicate that bus users are the least likely to object to paying for infor-mation via SMS. The information coefficient for SMS information was estimated to be highest for bus users (-1.062), followed by rail users (-0.718) (see Table 6). These findings suggest that, as with the other real-time information options, bus users derive the highest benefit from real-time information provided via SMS.
The coefficients for wait-time saved using a call center were found to be negative and significant at either the 95% or 99% confidence intervals (see Table 6). Bus users were estimated to derive the highest utility from wait-time saved with an estimated coefficient of -0.031. These findings indicate that bus users derive the highest benefit from a reduction in wait-time while at their bus stop. The higher preference for a reduction in wait time by bus users compared to rail users may be attributed to the perceived lack of reliability in arrival of bus services relative to rail services.
The cost coefficients for information provision via a call center were shown to be negative and significant at the 99% confidence level in each of the segmented models. Bus users were found to have the lowest cost coefficient (-0.031), followed by rail users (-0.065) (see Table 6). These cost coefficients indicate that bus users are less likely to object to paying to use the call center option compared to rail users.
The wait time saved coefficient estimates for passenger information display were estimated to be negative and significant at the 95% or 99% confidence levels (see Table 6). The bus user model produced the highest negative coefficient (-0.088), followed by rail users (-0.042). This result demonstrates that bus users derive the highest utility from the provision of information via a passenger information dis-play while at a stop/station. These findings show that time saving is more impor-tant to bus users compared to rail users.
The cost coefficients for information provision via passenger information display were found to be negative and significant at the 99% confidence level (see Table 6). The disutility of cost was found to be lowest for bus users, with an estimated coefficient of -0.38, followed by rail users (-0.039). The coefficients for bus and rail
Journal of Public Transportation, Vol. 12, No. 3, 2009
14
users were estimated to be very similar. This demonstrates that both groups have a similar willingness to pay for real-time information from a passenger information display. This finding demonstrates that public transit users are more open to pay-ing for the provision of transit stop/station information provided via a passenger information display, compared to the other user groups.
The information coefficients for the provision of information via a passenger infor-mation display were found to be negative and significant at the 99% confidence level for all models (see Table 6). A negative value implies a preference for real-time information rather than static information. Of the estimated coefficients, bus users were found to have the highest value (-1.215), followed by rail users (-1.037). These findings demonstrate that bus users derive a higher benefit from the provi-sion of real-time information being provided via a passenger information display compared to the other user groups.
A comparison between the methods of receiving public transit information dem-onstrates that all three user groups derive the highest utility for wait-time saved when the information was provided via a passenger information display.
Additional Variables This section of the paper examines a number of additional variables that were added to ascertain how certain factors impact the utility derived from real-time public transit stop information. The first variable examined in this section mea-sures how wait time impacts the utility derived from real-time public transit stop information. The wait-time variable is a categorical variable and is defined in Table 7. A positive value for WAIT would indicate that as wait time increases, individuals are likely to derive a benefit from the use of real-time public transit information. The WAIT coefficients were estimated to be significant at the 99% confidence level (see Table 6). Each of the coefficients estimated was found to be positive. This indicates that as the wait time at stop/station increases, so, too, does the utility derived from accessing real-time public transit information. This result is in line with other studies that have shown the provision of real-time public transit stop information reduces perceived wait times and improves user perceptions of public transit (Schweiger 2003, Dziekan and Kottenhoff 2007). A comparison between the wait-time coefficients demonstrates that wait time was most likely to impact upon bus users (0.696), as this coefficient was found be higher than the coefficient estimated for rail users (0.309) (see Table 6).
A Stated Preference Analysis of Real-Time Public Transit Stop Information
15
Table 7. Description of Additional Variables
The first “work pattern” variable to be examined was daily departure time. The purpose of examining this variable is to ascertain if departure time impacts an individual’s choice between transit information options. A categorical variable for departure time DEPT was created and is defined in Table 7. A negative or low coefficient value would indicate those who depart early derive a higher utility from transport information than those who depart later. The results for departure time were found to be significant at the 99% confidence level (see Table 6). The departure time coefficients were found to be positive, indicating that as departure time increases, so, too, does the likelihood that the individual will derive a benefit from real-time information. The bus user departure time coefficient was found to be greater than that of the rail user coefficient. This result suggests that bus users, who depart later to work, are more likely to derive a benefit from real-time infor-mation, compared to the same group of rail users.
The dummy variable FIXW was created to represent those individuals who have to arrive at work at a specific time each day. This variable examines if those on fixed start or flexible start times are more likely to use real-time information. The dummy variable FIXW is defined in Table 6. A positive value for the FIXW variable would indicate that those individuals who have to arrive at work at a specific time are more likely to use real-time information and vice versa. The FIXW variables also were found to be negative and significant at the 99% confidence level (see Table 6).
Journal of Public Transportation, Vol. 12, No. 3, 2009
16
This model demonstrates that individuals who do not have a fixed working sched-ule are more likely to derive a benefit from real-time public transit information.
The results from Table 4 are used to create a variable to measure frustration while waiting at a public transit stop/station. The FRUST variable adds the individual responses to the questions posed in Table 3 to produce a combined frustration score (see Table 7). If the respondent indicates, for example, that not knowing the arrival time was frustrating; it is indicated by a +1, which is then added to their responses to the other two questions. This method was used to calculate the total frustration score. Therefore, the final frustration score of the individual is the sum of the responses to each of the individual questions. A positive FRUST score would indicate that the respondent was frustrated while waiting for his/her public transit service to arrive. The FRUST coefficient in each of the models examined was found to be positive and significant at either the 95% or 99% confidence levels (see Table 6). This finding indicates that as the frustration score increases, so, too, does the likelihood that the individual will derive a benefit from real-time public transit information. This result was as one would expect. The FRUST variable was estimated to be 0.088 for bus users and 0.035 for rail users (see Table 6). This result indicates that bus users who experience high frustration levels are more likely to derive a benefit from real-time public transit information compared to rail users experiencing the same levels of frustration.
Individuals who transfer between modes of transport to complete a single journey require information on two or more modes of transport. The MULTI variable was a dummy variable that takes a value of 1 if the respondent indicated that he/she uses more than one mode of transport to travel to work, and 0 otherwise (the MULTI variable is defined in Table 7). In model 1, the MULTI variable was found to be positive and significant at the 95% confidence level with a t-ratio of 2.0 (see model 1, Table 6). This positive value suggests that, all things being equal, those who undertake a trip using more than one public transit service are more likely derive a benefit from real-time public transit information. The MULTI variable was also found to be significant in the bus and rail models. The bus model coef-ficient was estimated to be 0.241, and the rail model coefficient was found to be 0.147 (see models 2 and 3 in Table 6). A comparison between the three results for the MULTI variable shows that bus users that transfer between modes of public transit derive the greatest benefit from the provision of real-time public transit information.
A Stated Preference Analysis of Real-Time Public Transit Stop Information
17
The WALKSTOP variable examines the impact the distance a respondent has to walk to his/her nearest bus stop or train station has upon the benefits derived from real-time public transit information. The WALKSTOP variable is a categori-cal variable (defined in Table 7). The WALKSTOP variable in model 1 was found to have a positive coefficient value of 0.417 and significant at the 99% level (t-ratio of 3.2) (see model 1 in Table 6). This result indicates that as the time taken to walk to the stop increases, so, too, does the likelihood that the respondent will derive a benefit from real-time public transit information. The bus user and rail user WALKSTOP coefficients were estimated to be 0.324 and 0.781, respectively (see models 2 and 3 in Table 6). This finding shows rail users with longer walk times derive a greater benefit from real-time public transit information compared to bus users. This result differs from the other results presented in this paper in that rail users were found in this instance to derive a greater benefit from real-time public transit information. One possible explanation for this result is that on average rail users had longer walk times to reach their station compared to bus users.
Conclusions The research presented in this paper examines an individual’s choice between real-time information options and investigates how this choice varies between bus and rail users. This paper also addresses how a number of factors such as work schedule and frustration experienced while waiting at a bus stop/train station can impact the utility derived from real-time public transit information. While the results presented in this paper provide an indication of the individual preferences for real-time public transit stop information, it should be noted that the sample used in this study was that of office-based workers in Dublin’s central business district, and as such may not be representative of the whole population.
The need for real-time public transit stop information is clearly outlined in the results. The vast majority of respondents (80%) indicated that not knowing the arrival time of their service caused frustration. A similar result was found when respondents were asked if not knowing had their bus/rail service passed caused frustration; 69 percent found this frustrating. The findings presented in this paper show that for each of the different methods of obtaining real-time information considered, bus users were found to derive the greatest benefit from these ser-vices. This finding was echoed in the additional variables examined in this paper, such as in the frustration and wait-time variables. These results show that bus
Journal of Public Transportation, Vol. 12, No. 3, 2009
18
users who experience longer wait times and greater frustration levels were more likely to derive a benefit from using real-time information.
When examining the preferences for the different methods of accessing real-time public transit information, the results show respondents derive the greatest ben-efit from real-time public transit stop information displays. This result was as one would expect, as this is one of the most effective methods of relaying real-time public transit stop information. Accessing information via SMS was found to be the second most attractive option to respondents, as respondents derived a greater utility from this option compared to using a call center.
The results from this paper demonstrate which public transit users are most likely to benefit from the provision of real-time information. The findings presented in this paper can be used to demonstrate how to prioritize investment in real-time information by highlighting the users who are most likely to benefit from real-time information services. To this extent, the results of this research demonstrate that bus users derive the greatest benefit from the provision of real-time public transit information, and as such, investment should be concentrated on providing bus users with real-time public transit information. The results also demonstrate that individuals derive a benefit from the provision of real-time information and are willing to pay for this information. The research presented in this paper could be further extended by examining different types of trips such as off-peak trips, leisure trips, and retail trips. As previously mentioned, this study is limited in that it concentrates on office-based workers in Dublin City center. A further extension to this study would be to look at other groups of respondents such as individuals who work in the suburbs and in industrial areas.
Acknowledgment
The research was supported by the Department of Transport under the Pilot Trans-port Research Programme, administered by the Higher Education Authority.
References
Caulfield, B., and M. M. O’Mahony. 2007. An examination of the public transit information requirements of users. IEEE Transactions on Intelligent Transport Systems 8(1).
A Stated Preference Analysis of Real-Time Public Transit Stop Information
19
CSO. 2007. Census of population of Ireland 2006, Place of Work, Census of Ano-nymised Records (POWCAR) Users Guide. CSO, Dublin, Ireland.
Dublin Bus. 2007. Available at http://www.dublinbus.ie/home/bus_text.asp [accessed 20th June 2007].
Dziekan, K., and K. Kottenhoff. 2007. Dynamic at-stop real-time information dis-plays for public transport: effects on customers. Transportation Research Part A: Policy and Practice 41(6): 489-501.
Englisher, L., R. Juster., S. Bergman., and A. Willson. 1997. Promoting advanced trav-eller information systems among cellular and land-line phone users. Transpor-tation Research Record 1588: 63-69.
Hensher, D. A., J. M. Rose, and W. H. Greene. 2005. Applied choice analysis: A primer. London: Cambridge University Press.
Irish Rail. 2007. Available at http://www.iarnrodeireann.ie/news_centre/general_news.asp?action=view&news_id=71 [accessed 19th June 2007].
Kronborg, P., A. Lindkvist, and E. Schelin. 2002. Fungera transportinformatik I prakitken? 4 fallstudier I syfte att undvika misstaf I framtiden (No. 2002:18) TFK Stockhlom.
Khattak. A. J., Y. Yim., and L. S. Prokopy. 2003. Willingness to pay for travel informa-tion. Transport Research Part C 11:137-159.
Louviere, J. J., D. A. Hensher, and J.D. Swait. 2000. Stated choice methods: Analysis and application. London: Cambridge University Press.
Molin, E., C. Chorus, and R. van Sloten. 2007. The need for advanced public tran-sit information services when making transfers. 86th Annual Meeting of the Transportation Research Board (CD-ROM), Washington, D.C.
Nijkamp, P., G. Pepping, and D. Banister. 1996. Telematics and transport behaviour, Chapter 7: Public transit information systems: An English case study. Heidel-burg: Springer.
Polydoropoulou, A., D. Gopinath, and M. Ben-Akiva. 1997. Willingness to pay for advanced traveller information systems: SmarTraveler case study. Transporta-tion Research Record 1588: 1-9.
Schweiger, C. L. 2003. Customer and media reactions to real-time bus arrival infor-mation systems. Transportation Research Board, Report No. 48.
Journal of Public Transportation, Vol. 12, No. 3, 2009
20
Tam, M. L, and W. H. Lam. 2005. Modelling the market penetration of personal public transit information systems in Hong Kong. Journal of Intelligent Trans-portation Systems 9(2): 81-89.
Train, K. 2003. Discrete choice methods with simulation. London: Cambridge Uni-versity Press.
Warman, P. 2003. Measured impacts of real-time control and information systems for bus services. Transport Direct, UK Department for Transport.
Wolinetz, L., A. J. Khattak, and Y. B. Yim. 2001. Why will some individuals pay for travel information when it can be free? Analysis of a Bay Area traveller survey. Transport Research Record 1759: 9-18.
About the Authors
Brian Caulfield ([email protected]) is a lecturer in Civil Engineering in the Department of Civil, Structural, and Environmental Engineering at Trinity College Dublin. He has published and has interests in public transit services, stated prefer-ence modelling, environmental impacts of transport, and road safety.
Margaret O’Mahony ([email protected]) is the Professor of Civil Engineering and Director of the Centre for Transport Research at Trinity College Dublin. She leads a large number of interdisciplinary research projects that focus on transport policy, transport planning, network modelling, optimisation of transport networks, demand management, transport pricing, urban freight solutions, vehicle instrumentation, and innovative road materials.
A New Customer Satisfaction Index for Evaluating Transit Service Quality
21
A New Customer Satisfaction Index for Evaluating Transit Service
QualityLaura Eboli and Gabriella Mazzulla
University of Calabria, Italy
Abstract
In this paper, an index based on customer perspective is proposed for evaluating transit service quality. The index, named Heterogeneous Customer Satisfaction Index, is inspired by the traditional Customer Satisfaction Index, but takes into account the heterogeneity among the user judgments about the different service aspects. The index allows service quality to be monitored, the causes generating customer satis-faction/dissatisfaction to be identified, and the strategies for improving the service quality to be defined. The proposed methodologies show some advantages compared to the others adopted for measuring service quality, because it can be easily applied by the transit operators.
IntroductionTransit service quality is an aspect markedly influencing travel user choices. Cus-tomers who have a good experience with transit will probably use transit services again, while customers who experience problems with transit may not use transit services the next time. For this reason, improving service quality is important for customizing habitual travellers and for attracting new users. Moreover, the need for supplying services characterized by high levels of quality guarantees compe-tition among transit agencies, and, consequently, the user takes advantage of
Journal of Public Transportation, Vol. 12, No. 3, 2009
22
better services. To achieve these goals, transit agencies must measure their per-formance.
Customer satisfaction represents a measure of company performance according to customer needs (Hill et al. 2003); therefore, the measure of customer satisfac-tion provides a service quality measure. Customers express their points of view about the services by providing judgments on some service aspects by means of ad hoc experimental sample surveys, known in the literature as “customer satisfac-tion surveys.”
The aspects generally describing transit services can be distinguished into the characteristics that more properly describe the service (e.g., service frequency), and less easily measurable characteristics that depend more on customer tastes (e.g., comfort). In the literature, there are many studies about transit service qual-ity. Examples of the most recent research are reported in TRB (2003a, 2003b), Eboli and Mazzulla (2007), Tyrinopoulos and Antoniou (2008), Iseki and Taylor (2008), and Joewono and Kubota (2007). In these studies, different attributes determining transit service quality are discussed; the main service aspects characterizing a tran-sit service include service scheduling and reliability, service coverage, information, comfort, cleanliness, and safety and security. Service scheduling can be defined by service frequency (number of runs per hour or per day) and service time (time during which the service is available). Service reliability concerns the regularity of runs that are on schedule and on time; an unreliable service does not permit user travel times to be optimized. Service coverage concerns service availability in the space and is expressed through line path characteristics, number of stops, distance between stops, and accessibility of stops. Information consists of indications about departure and arrival scheduled times of the runs, boarding/alighting stop loca-tion, ticket costs, and so on. Comfort refers to passenger personal comfort while transit is used, including climate control, seat comfort, ride comfort including the severity of acceleration and braking, odors, and vehicle noise. Cleanliness refers to the internal and external cleanliness of vehicles and cleanliness of terminals and stops. Safety concerns the possibility that users can be involved in an accident, and security concerns personal security against crimes. Other service aspects char-acterizing transit services concern fares, personnel appearance and helpfulness, environmental protection, and customer services such ease of purchasing tickets and administration of complaints.
The objective of this research is to provide a tool for measuring the overall transit service quality, taking into account user judgments about different service aspects.
A New Customer Satisfaction Index for Evaluating Transit Service Quality
23
A synthetic index of overall satisfaction is proposed, which easily can be used by transit agencies for monitoring service performance. In the next section, a critical review of indexes for measuring service quality from a user perspective is made; observations and remarks emerge from the comparison among the indexes analy-sed. Because of the disadvantages of the indexes reported in the literature, a new index is proposed. The proposed methodology is applied by using experimental data collected by a customer satisfaction survey of passengers of a suburban tran-sit service. The obtained results are discussed at the end of the paper.
Customer Satisfaction IndexesThe concept of customer satisfaction as a measure of perceived service quality was introduced in market research. In this field, many customer satisfaction techniques have been developed. The best known and most widely applied technique is the ServQual method, proposed by Parasuraman et al. (1985). The ServQual method introduced the concept of customer satisfaction as a function of customer expectations (what customers expect from the service) and perceptions (what customers receive). The method was developed to assess customer perceptions of service quality in retail and service organizations. In the method, 5 service quality dimensions and 22 items for measuring service quality are defined. Service quality dimensions are tangibles, reliability, responsiveness, assurance, and empathy. The method is in the form of a questionnaire that uses a Likert scale on seven levels of agreement/disagreement (from “strongly disagree” to “strongly agree”).
ServQual provides an index calculated through the difference between perception and expectation rates expressed for the items, weighted as a function of the five service quality dimensions embedding the items. Some variations of this method were introduced in subsequent years. For example, Cronin and Taylor (1994) intro-duced the ServPerf method, and Teas (1993) proposed a model named Normed Quality (NQ). Although ServQual represents the most widely adopted method for measuring service quality, the adopted scale of measurement for capturing customer judgments has some disadvantages in obtaining an overall numerical measure of service quality; in fact, to calculate an index, the analyst is forced to assign a numerical code to each level of judgment. In this way, equidistant num-bers are assigned to each qualitative point of the scale; this operation presumes that the distances between two consecutive levels of judgment expressed by the customers have the same size.
Journal of Public Transportation, Vol. 12, No. 3, 2009
24
A number of both national and international indexes also based on customer per-ceptions and expectations have been introduced in the last decade. For the most part, these satisfaction indexes are embedded within a system of cause-and-effect relationships or satisfaction models. The models also contain latent or unobserv-able variables and provide a reliable satisfaction index (Johnson et al. 2001). The Swedish Customer Satisfaction Barometer (SCSB) was established in 1989 and is the first national customer satisfaction index for domestically purchased and con-sumed products and services (Fornell 1992). The American Customer Satisfaction Index (ACSI) was introduced in the fall of 1994 (Fornell et al. 1996). The Norwegian Customer Satisfaction Barometer (NCSB) was introduced in 1996 (Andreassen and Lervik 1999; Andreassen and Lindestad 1998). The most recent development among these indexes is the European Customer Satisfaction Index (ECSI) (Eklof 2000). The original SCSB model is based on customer perceptions and expecta-tions regarding products or services. All the other models are based on the same concepts, but they differ from the original regarding the variables considered and the cause-and-effect relationships introduced. The models from which these indexes are derived have a very complex structure. In addition, model coefficient estimation needs of large quantities of experimental data and the calibration pro-cedure are not easily workable. For this reason, this method is not very usable by transit agencies, particularly for monitoring service quality.
More recently, an index based on discrete choice models and random utility the-ory has been introduced. The index, named Service Quality Index (SQI), is calcu-lated by the utility function of a choice alternative representing a service (Hensher and Prioni 2002). The user makes a choice between the service habitually used and hypothetical services. Hypothetical services are defined through Stated Preferences (SP) techniques by varying the level of quality of aspects characterizing the service. Habitual service is described by the user by assigning a value to each service aspect. The design of this type of SP experiments is generally very complex; an example of an SP experimental design was introduced by Eboli and Mazzulla (2008a). SQI was firstly calculated by a Multinomial Logit model to evaluate the level of qual-ity of transit services. Hierarchical Logit models were introduced for calculating SQI by Hensher et al. (2003) and Marcucci and Gatta (2007). Mixed Logit models were introduced by Hensher (2001) and Eboli and Mazzulla (2008b). SQI includes, indirectly, the concept of satisfaction as a function of customer expectations and perceptions. The calculation of the indexes following approaches different from SQI presumes the use of customer judgments in terms of rating. To the contrary, SQI is based on choice data; nevertheless, by choosing a service, the user indirectly
A New Customer Satisfaction Index for Evaluating Transit Service Quality
25
expresses a judgment of importance on the service aspects defining the services. In addition, the user expresses a judgment of satisfaction about the service aspects when he/she describes the service habitually used. Also, SQI is calculated by a very complex procedure. Choice data can give more reliable results because the user must make a choice and makes a simultaneous comparison of all the service attributes; to the contrary, the evaluation of the attributes by rating generally influence the user to assign a high level of importance to each service attribute, and the user evaluates each attribute one by one. Nevertheless, SQI has some dis-advantages because choice data are not usual for customer satisfaction surveys; in addition, this type of data must be collected by well-designed SP experiments.
A more direct measure for service quality evaluation is provided by an overall index, often called “Customer Satisfaction Index” (CSI) (Hill et al. 2003). CSI repre-sents a measure of service quality on the basis of the user/consumer perceptions on service aspects expressed in terms of importance rates, compared with user/consumer expectations expressed in terms of satisfaction rates. CSI plugs the gap of ServQual because is based on judgments expressed according to a numerical scale. Compared to all the described indexes, CSI is based on a simple procedure, fully described in the next section, which allows the index to be easily calculated0 by transit operators.
CSI does not take into account the heterogeneities among user judgments. To the contrary, the index proposed by the authors provides an overall service qual-ity measure introducing the dispersion of the importance and satisfaction rates among users.
MethodologyThe methodology adopted in this research aims to obtain a concise indicator that provides an overall measure of service quality by considering different service aspects. The indicator can be calculated on the basis of user judgments expressed by a numerical scale; this kind of scale has some advantages compared to the scales with points described by means of words (e.g., Likert and verbal scale) because it allows quantitative techniques of analysis to be applied. To measure customer satisfaction, different numerical values can be used, generally from 1 to 3, from 1 to 5, from 1 to 7, from 1 to 9, etc. The adopted scale can also have an even number of levels, for example, the traditional numeric scholastic scale composed of points from 1 to 10.
Journal of Public Transportation, Vol. 12, No. 3, 2009
26
As mentioned above, this research focuses on CSI, which is calculated by means of the satisfaction rates expressed by users, weighted on the basis of the importance rates, according to the following formula:
(1)
in which
is the mean of the satisfaction rates expressed by users on the service qual-ity k attribute
(importance weight) is a weight of the k attribute, calculated on the basis of the importance rates expressed by users. Specifically, is the ratio between the mean of the importance rates expressed by users on the k attribute and the sum of the average importance rates of all the service quality attributes:
(2)
CSI represents a good measure of overall satisfaction because it summarizes the judgments expressed by users about various service attributes in a single score. The more accurate the selection of the attributes, the more accurate the measure of the overall satisfaction. For this reason, the selected attributes should describe the service aspects exhaustively.
However, not all the attributes are important for the user in the same way; an index based only on satisfaction rates cannot take into account these differences. As an example, we consider five attributes with average satisfaction and impor-tance rates reported in Table 1, according to a scale from 1 to 10. By considering only the satisfaction rates, the overall satisfaction is 7.16, and the attribute with the highest satisfaction score is attribute 2, which contributes to the overall sat-isfaction with an aliquot of 1.66; on the other hand, if importance rates also are considered, the attribute with the highest aliquot to the overall satisfaction is the attribute 4 (weighted score equal to 1.94). The less important attribute is attribute 5, with an aliquot of 1.05. The value of CSI is 7.28 out of 10. By converting this score
A New Customer Satisfaction Index for Evaluating Transit Service Quality
27
into a percentage, the satisfaction index shows that the service is about 73 percent successful in satisfying its customers. By comparing CSI with the average of all the satisfaction scores, it can be observed that there is a difference between the value of these two indicators, because each attribute adds up to overall satisfaction according to a different weighted score.
Table 1. Example of Calculating CSI (Scale of 1 to 10)
However, when all the importance scores are close to a certain value, the impor-tance weights are similar, and then the CSI value is close to the average of all the satisfaction scores. In this eventuality, CSI does not give any additional information compared to the indicator calculated by considering only the satisfaction scores. In addition, the average importance scores result from the rates expressed by a sample of customers, which can be very heterogeneous; the dispersion of the rates can be represented by the variance or the standard deviation from the mean. In the same way, the satisfaction rates can be very heterogeneous among users. These heterogeneities cannot be taken into account in the CSI calculation.
To overcome this lack, importance weights can be corrected according to the dis-persion of the importance rates from the average value. Analogously, satisfaction scores can be corrected according to the dispersion of the satisfaction rates from the average value. These adjustments have been introduced for calculating a new indicator, called Heterogeneous Customer Satisfaction Index (HCSI). The differ-ences between CSI and HCSI are shown in Figure 1.
Journal of Public Transportation, Vol. 12, No. 3, 2009
28
Figure 1. CS Index versus Heterogeneous CS Index
From a mathematical point of view, HCSI is calculated by the following formula:
(3)
in which
is the mean of the satisfaction rates expressed by users on the k attribute corrected according to the deviation of the rates from the average value
is the weight of the k attribute, calculated on the basis of the importance rates expressed by users, corrected according to the dispersion of the rates from the average value.
is calculated by the following formula:
(4)
The adjustment factor is calculated as the mean of the satisfaction rates expressed by users on the k attribute divided by the mean of the average satisfaction rates
A New Customer Satisfaction Index for Evaluating Transit Service Quality
29
of all the service quality attributes, weighted on the variance of the satisfaction rates.
is calculated as the mean of the importance rates expressed by users on the k attribute divided by the sum of the average importance rates of all the service quality attributes, weighted on the variance of the importance rates, according to the following formula:
(5)
The introduction of the variance for adjusting the importance and satisfaction rates allows the attributes characterized by more homogeneous user judgments to be considered more significant; to the contrary, the attributes with heterogeneous judgments are considered less significant.
The mathematical basis of the HCSI formula is demonstrated by assuming that all the customers surveyed gave satisfaction scores of 10 out of 10 for every service characteristic, and the average satisfaction scores would all be 10. When the vari-ance of the satisfaction judgments expressed by the customers tends to zero for all service characteristics, the mean of the satisfaction rates divided by the deviation from the mean of each k attribute would tend to the maximum value of 10, and
would tend to . Therefore, total customer satisfaction on all their attributes would produce a satisfaction index of 100 percent.
Application of MethodologyThe proposed methodology was applied by considering an experimental case study regarding transit services in a medium-sized urban area. The urban area includes the town of Cosenza, which is a provincial capital of the Calabria region in southern Italy. Cosenza forms a single built-up area with the town of Rende, in a northerly direction. The urban area has grown over the years also because of the presence of the University of Calabria, which expanded north of Rende at the beginning of the 1970s. Cosenza and Rende represent a center of attraction for the province because of the administrative functions, job opportunities, and supply of services. The urban area has about 110,000 inhabitants. In addition, many univer-
Journal of Public Transportation, Vol. 12, No. 3, 2009
30
sity students live in Rende or Cosenza; approximately 35,000 students attend the University of Calabria.
The analysed transit service is a suburban bus service offering the connection between the urban area and several small villages north and south of Cosenza. A survey was addressed to the habitual passengers of two bus lines, Line 17 and Line 1, to measure transit service quality from a user point of view. Line 17 runs in a southward direction and serves a catchment area of about 5,000 inhabitants; Line 1 runs in a northward direction and serves a catchment area of about 7,000 inhabitants. Bus line characteristics are reported in Table 2.
Table 2. Transit Service Characteristics
ServiceCharacteristics Line 1 Line 17
Path length 19 km 18 km
# of bus stops 23 13
Travel demand 800 pass/day 700 pass/day
Service time 14 hours (from 6:00 a.m. to 8:00 p.m.)
Service frequency 1 run/hr from 6:00 a.m to 2:00 p.m.; only 2 runs in the afternoon
Ticket cost from 0.50 to 1.50 Euros (depending on the covered distance)
The survey was conducted in the spring of 2008. An operator effected face-to-face interviews on board during the service time; 218 passengers were interviewed.
Although the population is evenly spread between male and female, the major-ity of the habitual transit users is female (66% of the sample). Most of the inter-viewed users are students (49%) and younger than 20 years (44%); only 9% of the population are students, and 22% are young people. The majority of the employed respondents are clerks or workers (92%) and work in the private or public sec-tor (71%); these percentages are the same for the population. About 65% of the sample belongs to a middle class of family income and about 28% to a lower class; the classes of income refer to the net monthly income of the family unit, expressed in Euros (Table 3).
On average, the number of family members in a family unit is 3.8 and each family has 1.64 cars. Of the 218 respondents, 77 get one-way tickets, 64 get one-day travel cards, and 69 use monthly travel cards.
A New Customer Satisfaction Index for Evaluating Transit Service Quality
31
Table 3. Socio-Economic Characteristics
# %
Gender male 74 34
female 144 66
218 100
Age up to 20 years 95 44
from 21 to 40 years 65 30
from 41 to 65 years 46 21
over 65 years 12 5
218 100
Employment employed 66 30
unemployed 15 7
housewife 16 7
student 106 49
pensioner 15 7
218 100
Sector of Employment energy 1 2
business 18 27
private sector 26 39
public sector 21 32
66 100
Professional Position businessman 1 2
freelancer 3 5
clerk 35 53
worker 26 39
artisan 1 2
66 100
Family Income Level up to 1,000 Euros 62 28
from 1,000 to 2,000 Euros 96 44
from 2,000 to 3,000 Euros 34 16
from 3,000 to 4,000 Euros 10 5
from 4,000 to 5,000 Euros 4 2
over 5,000 Euros 12 6
218 100
Journal of Public Transportation, Vol. 12, No. 3, 2009
32
To evaluate bus service quality, users provided information about 26 service attributes. They expressed a rating of importance and a rating of satisfaction on each attribute on a scale from 1 to 10 (decimal included); in addition, a rating of overall service in terms of perceived quality was requested. The service attributes describe the main aspects characterizing bus services, including route and service characteristics, service reliability, comfort, cleanliness, fare, information, safety and security, personnel, customer services, and environmental protection (Table 4). A first evaluation of transit service quality is effected by analyzing the rate of satisfac-tion and importance by means of the calculation of the average satisfaction and importance scores (Table 4).
Generally, the attributes with an average satisfaction score lower than 6.0 can be considered critical service aspects. For the analyzed services, only two attributes had an unsatisfactory average score, availability of shelter and benches at bus stop and availability of schedule/maps at bus stops, and announcements. The attri-butes with the highest average satisfaction scores were ease of purchasing a ticket, security against crimes on bus, and “personnel appearance.”
By analyzing the importance rates, the most important attributes for the passen-gers can be identified. By observing the average importance scores, it appears that all the service attributes are considered very important by the passengers; in fact, each attribute is characterized by an average importance score close to or higher than 9.0, and for only two attributes the average score is lower than 9.0: number of bus stops/distance between bus stops and cleanliness of bus exterior.
Satisfaction and importance rates were analyzed also by means of the variance (Table 4). This type of measures allows the heterogeneity of passengers in the evaluation of service quality to be verified. In this case, the passenger judgments on expected quality (rate of importance) are much more homogeneous than the judgments on the perceived quality (rate of satisfaction). In fact, the value of vari-ance, calculated by considering the rates expressed on all the attributes, is 1.42 for the importance and 6.16 for the satisfaction; the coefficients of variation are 12.6 and 32.5 percent, respectively.
Satisfaction and importance rates expressed by the bus passengers were used for the calculation of the CSI and HCSI (Table 5). In the third and sixth column, the weighted scores are reported, which represent the contribution of each attribute to the final value of CSI and HCSI, respectively.
A New Customer Satisfaction Index for Evaluating Transit Service Quality
33
Table 4. Importance and Satisfaction Statistics
Journal of Public Transportation, Vol. 12, No. 3, 2009
DiscussionFrom the experimental results, the value of CSI is 7.63. By weighting satisfaction and importance scores on the variance, we obtain a value of HCSI equal to 8.04. The difference between the CSI and HCSI values are due to the different contribu-tions of each service attribute to each index. Obviously, if the variance of impor-
A New Customer Satisfaction Index for Evaluating Transit Service Quality
35
tance rates is the same for all the attributes and, contemporaneously, the variance of satisfaction rates has the same value for all the attributes, HCSI and CSI values are equal.
By analyzing the weighted scores regarding CSI, it emerges that the attributes giving the highest contribution to overall satisfaction are ease of purchasing the ticket, security against crimes on bus, reliability of runs that come on schedule, and personnel appearance. However, the values of the weighed scores range from 0.15 to 0.37 (Table 5); therefore, other attributes also make a considerable contribu-tion. Although the gap between the two indexes is 0.41, the weighted scores of CSI are very different compared to those of HCSI, which range from 0.04 to 1.55. The attribute with the highest weighted score for the HCSI regards vehicle reliability and competence of drivers. The four most relevant service attributes for CSI are also relevant for HCSI. In addition, also the attribute regarding personnel helpful-ness shows a considerable weight.
From the experimental results, HCSI can be considered a useful tool for measuring transit service quality to monitor transit agency performances and fulfil customer requirements. The index allows the causes generating customer satisfaction/dis-satisfaction to be identified and the strategies for improving the service quality to be defined. HCSI introduces heterogeneity into user judgments because impor-tance and satisfaction rates are corrected according to dispersion from the aver-age value. By effecting this adjustment, more significance is given to the attributes characterized by homogeneous user judgments, while less significance is given to the more heterogeneous attribute.
References
Andreassen, T.W., and L. Lervik. 1999. Perceived relative attractiveness today and tomorrow as predictors of future repurchase intention. Journal of Service Research 2: 164-172.
Andreassen, T.W., and B. Lindestad. 1998. The effect of corporate image in the formation of customer loyalty. Journal of Service Marketing 1: 82-92.
Berry, L.L., V.A. Zeithaml, and A. Parasuraman. 1990. Five Imperatives for Improv-ing Service Quality. Sloan Management Review Summer 9-38.
Journal of Public Transportation, Vol. 12, No. 3, 2009
36
Cronin, J.J., and S.A. Taylor. 1994. SERVPERF versus SERVQUAL: Reconciling perfor-mance-based and perceptions-minus-expectations measurement of service quality. Journal of Marketing 58(1): 125-131.
Eboli, L., and G. Mazzulla. 2007. Service quality attributes affecting customer satis-faction for bus transit. Journal of Public Transportation 10(3): 21-34.
Eboli, L., and G. Mazzulla. 2008a. An SP Experiment for Measuring Service Quality in Public Transport. Transportation Planning and Technology 31(5): 509-523.
Eboli, L., and G. Mazzulla. 2008b. Willingness-to-Pay of Public Transport Users for Improvement in Service Quality. European Transport 38: 107-118.
Eklof, J.A. 2000. European customer satisfaction index pan-European telecommu-nication sector report based on the pilot studies 1999. European Organization of Quality and European Foundation for Quality Management, Stockholm, Sweden.
Fornell, C., M.D. Johnson, E.W. Anderson, J. Cha, and B. Everitt Bryant. 1996. The American Customer Satisfaction Index: Nature, purpose, and findings. Journal of Marketing 60: 7-18.
Fornell, C. 1992. A national customer satisfaction barometer: The Swedish experi-ence. Journal of Marketing 56: 6-21.
Hensher, D.A., and P. Prioni. 2002. A service quality index for an area-wide contract performance assessment regime. Journal of Transport Economics and Policy 36(1): 93-113.
Hensher, D.A., P. Stopper, and P. Bullock. 2003. Service quality-developing a service quality index in the provision of commercial bus contracts. Transportation Research Part A 37: 499-517.
Hensher, D.A. 2001. Service quality as a package: What does it mean to heteroge-neous consumers. 9th World Conference on Transport Research, Seoul, Korea, 22-27 July.
Hill N., G. Brierley, and R. MacDougall. 2003. How to Measure Customer Satisfaction. Gower Publishing, Hampshire.
Iseki, H., and B.D. Taylor. 2008. Style versus service? An analysis of user perceptions of transit stops and stations in Los Angeles. 87th Annual Meeting of the TRB, Washington, D.C., January 13-17.
A New Customer Satisfaction Index for Evaluating Transit Service Quality
37
Joewono, T.B., and H. Kubota. 2007. User perception of private paratransit opera-tion in Indonesia. Journal of Public Transportation 10(4):99-118.
Johnson, M.D, A. Gustafsson, T.W. Andreassen, L. Lervik, and J. Cha. 2001. The evo-lution and future of national customer satisfaction index models. Journal of Economic Psychology 22: 217-245.
Marcucci, E., and V. Gatta. 2007. Quality and public transport service contracts. European Transport 36: 92-106.
Parasuraman, A., V.A. Zeithaml, and L.L. Berry. 1985. A conceptual model of service quality and its implication for future research. Journal of Marketing 49:41-50.
Teas, R.K. 1993. Expectations, performance evaluation, and consumers’ percep-tions of quality. Journal of Marketing 57(4): 18-34.
Transportation Research Board. 2003a. A Guidebook for Developing a Transit Performance-Measurement System. Transit Cooperative Research Program, Report 88, Washington, D.C, National Academy Press.
Transportation Research Board. 2003b. Transit Capacity and Quality of Service Manual. Transit Cooperative Research Program, Report 100, Washington, D.C, National Academy Press.
Tyrinopoulos, Y., and C. Antoniou. 2008. Public transit user satisfaction: Variability and policy implications. Transport Policy 15(4):260-272.
About the Authors
Laura Eboli ([email protected]) is researcher in Transportation Engineering at the University of Calabria, Italy, where she undertakes research in transit plan-ning and service quality in public transport. She holds a Ph.D. in Technologies and Environmental Planning and a master’s degree in Transport System Management from the University of Calabria.
Gabriella Mazzulla ([email protected]) holds a Ph.D. in Road Infrastructure and Transportation System from the University Federico II in Naples, Italy. She is a senior researcher in Transportation Engineering at the University of Calabria, Italy and teaches Urban and Metropolitan Transport and Traffic Flow Theory. Her primary areas of research are transportation planning and transport demand modelling.
Journal of Public Transportation, Vol. 12, No. 3, 2009
38
39
Bus Transit Service Planning and Operations in a Competitive Environment
Bus Transit Service Planning and Operations in a Competitive
EnvironmentAhmed M. El-Geneidy, McGill University John Hourdos, University of Minnesota
Jessica Horning, Cambridge Systematics, Inc.
Abstract
Transit services are currently facing several challenges in the United States and around the world. For many reasons, among which the fluctuations in gas prices and the state of the economy are the major ones, transit demand has noticed a consider-able increase. The challenge that transit agencies are facing is to make these increases permanent by maintaining transit’s competitive edge over the private vehicle with more dense and reliable service. Current methodologies for scheduling new as well as improving existing transit routes should be able to respond to the dynamic nature of urban traffic as it is evolving through ITS and more comprehensive traffic manage-ment strategies. In this research paper, we correlate travel time obtained from buses to travel time obtained from floating vehicles in the Twin Cities metropolitan region. This research helps to introduce more reliable estimates of travel time for planning new and competitive transit services. Specifically, this work studied two bus routes over a variety of different roadway types and traffic conditions and produced statis-tical models that can estimate travel time based on measurements collected from buses and regular vehicle probes. The generated models revealed the characteristics causing bus service to be generally slower. Altering bus route characteristics can reduce overall travel time and minimize the travel time disparity between buses and private vehicles. In particular, the models presented in this paper lend support to
Journal of Public Transportation, Vol. 12, No. 3, 2009
40
bus-only shoulder policies, stop consolidation, serving major streets with fewer stop signs, and implementation of smart transit signal priority.
IntroductionTransit services are facing several challenges around the world, even more in the United States. In recent days transit demand has noticed an increase, which some researcher relate to the increase in gas prices. For such surge in demand to become permanent, transit agencies need to manage their systems strategically and offer a service that can be competitive to private vehicles. A service competi-tive to private vehicles is possible when a reliable service to passengers is present. A reliable service to a passenger is the service that can be easily accessed at origin and destination, arrives on time, has a short travel time/run time (similar or better than private vehicle travel time), and has low variance in travel time and a short waiting time (Furth and Muller 2006, 2007; Koenig 1980; Murray and Wu 2003; Turnquist 1978; Welding 1957). Achieving such service requires expanding the existing transit operations with routes that follow realistic schedules to which a bus can adhere, in addition to improving the existing service in several aspects. Schedulers rely primarily on using software that is designed based on operations research methods to introduce schedules for new bus services. Such software takes into account the expected operating environment. Unfortunately, a generic solution in transit planning based on optimization is not the best way to go and always requires some kind of fine-tuning. Some transit agencies use floating vehicles driving along corridors where new routes are planned. The vehicles are used to estimate travel time and compare it to schedules generated from optimi-zation software prior to implementation of new service. Doing so without having an accurate understanding of the differences between floating cars and real bus service makes the outputs questionable. Currently, several agencies are looking toward increased implementation of faster services such as limited, express, and Bus Rapid Transit (BRT) services. By implementing these services, transit agencies try to compete with private vehicles to attract more choice riders (Krizek and El-Geneidy 2007). Implementing any of these services requires a full understand-ing of the operating environment. In this research paper, we correlate travel time obtained from buses to travel time obtained from floating vehicles in the Twin Cit-ies metropolitan region. This research helps to introduce more reliable estimates of travel time for planning new and competitive transit services. Previous research concentrating on relating travel time between buses and floating vehicles along
41
Bus Transit Service Planning and Operations in a Competitive Environment
corridors used visualization and simple statistics (Bertini and Tantiyanugulchai 2004). They concentrated mainly on the use of transit vehicles as probes to esti-mate corridor travel time for systemwide implementation. Although this is not the focus of this study, findings from this study can be used in a similar manner as well. The main goal of this research is to better understand the factors affecting bus travel time towards offering a competitive service to the private vehicle in a highly complex environment. In this research, we analyze information from dif-ferent roadway types (freeways, arterials, and local streets) to uncover potential traffic-flow-related dependencies.
Literature ReviewTravel/Run TimeTravel time, or run time, is the amount of time it takes for a bus to travel along its route or along a specified segment. Abkowitz and Engelstein (1984) found that mean run time is affected by route length, passenger activity, and number of sig-nalized intersections. Most researchers agree on the basic factors affecting bus run times (Abkowitz and Engelstein 1983; Abkowitz and Tozzi 1987; Guenthner and Sinha 1983; Levinson 1983; Strathman, et al. 2000). Table 1 contains a summary of known factors affecting run times.
Table 1. Factors Affecting Transit Travel Times
Variables Description
Distance Segment lengthIntersections Number of signalized intersectionsBus stops Number of bus stopsBoarding Number of passenger boardings Alighting Number of passenger alightings Time Time period Driver Driver experiencePeriod of service How long the driver has been on service in the study periodDeparture delay Observed departure time minus scheduled Stop delay time Time lost in stops based on bus configuration (low floor, etc.)Nonrecurring events Lift usage, bridge opening, etc.Direction Inbound or outbound serviceWeather Weather-related conditionsRoad Road characteristics
Journal of Public Transportation, Vol. 12, No. 3, 2009
42
Since buses travel with regular traffic, they are affected by the overall dynamics of the transportation system, where changes occur on both regular (i.e., peak hour traffic congestion) and random (i.e., road construction, accidents, special events) bases. These changes influence the amount of time it takes for a bus to travel from one stop to another and the level of service it provides to passengers. Street characteristic is another major element affecting bus travel time. For example, in the Twin Cities region, buses are allowed to use highway shoulders when the speed along the main lanes drops below 35 miles/hour. Buses can drive as fast as 15 miles/hour faster than the regular traffic sitting in the congested lanes, but they cannot exceed the 35 miles/hour threshold. These special privileges that buses have along the Twin Cities highway system makes estimating their travel time through regular practices difficult. It also gives buses an advantage over regular vehicles in terms of speed. Accordingly, relating travel time from buses in the Twin Cities to floating vehicles can reveal new opportunities for other agencies around the world.
DataThe goal of this research is to relate bus travel time to floating cars along a transit corridor in the Twin Cities metropolitan area. This relation helps to introduce more reliable estimates of travel time for planning new and competitive transit service along the specified corridor. In addition, it can work as a base for adjust-ing new bus schedules when compared to floating vehicles. The Minnesota Valley Transit Authority (MVTA), which is a relatively small suburban transit provider in the Twin Cities region, is currently planning to expand its service and upgrade levels of service along Cedar Avenue. The Cedar Avenue corridor is planned to incorporate a BRT system in addition to the current regular service. MVTA data collection is currently limited to semi-annual manual passenger counts and sev-eral TrackStick Global Positioning System (GPS) units.
To determine current travel times along the study corridor, the research team col-lected travel time data from two MVTA bus routes serving the Cedar Avenue cor-ridor, Routes 442 and 444, shown in Figure 1. Route 442 is a commuter route that runs south along Cedar Avenue and Highway 77. Of all of the existing MVTA bus routes, Route 442 most closely resembles the service that will be provided by the Cedar Avenue BRT. Route 444 is also primarily a commuter route running south along Cedar Avenue and Highway 77. However, after crossing the Minnesota River, Route 444 turns westward and travels along Highway 13 and several residential
43
Bus Transit Service Planning and Operations in a Competitive Environment
streets. Route 444 was chosen for data collection to construct comparisons between car and bus travel times on freeways, arterials, and local streets.
Figure 1. Studied Routes
Journal of Public Transportation, Vol. 12, No. 3, 2009
44
Travel time data for buses on these routes were collected using QStarz GPS data loggers provided by the research team and several TrackStick GPS units owned by MVTA. MVTA’s existing GPS units were programmed to take a data point at regular time intervals (approximately every 7 seconds), so the research team programmed the QStarz units to record points at the same interval. The research team collected data from buses running on Route 444 during the month of Octo-ber 2007. Due to contractor issues, data collection on Route 442 was delayed until the following spring. The research team collected data from buses running on this route during the months of March and April 2008. During the fall data collection period, no major weather issues were present that might have an effect on travel time. Data from spring days with inclement weather (i.e., snow storms) were removed from the analysis.
Travel time data for private vehicles on Routes 442 and 444 were collected during the same time periods using probe vehicles equipped with QStarz GPS units. The research team recruited student volunteers to drive their personal vehicles along each studied transit route. Students were instructed to leave the first station on the route at the same time as a bus and to drive at the speed of traffic until they reached the end of the route.
To establish the relationship between travel times for buses and private vehicles in the study area, each bus trip was matched with a probe vehicle trip that departed at approximately the same time. After cleaning and matching the car and bus data, this data collection effort resulted in a sample of 286 matched trips (143 probe vehicle trips matched to 143 bus trips). This sample represents 130 matched trips on Route 442 and 156 matched trips on Route 444. These trips were distributed throughout the day during AM, PM, and off-peak periods.
Using these data, it is possible to determine travel times along transit routes. Unfortunately, it is not possible to accurately determine when buses make stops to serve passengers. Many of the stops along Routes 442 and 444 are located on the nearside of signalized or high-traffic intersections. Due to this combination of stop placement and the small amount of passenger activity at most stops (one passenger boarding or alighting at non-park-and-ride stops), it is not possible to distinguish actual passenger stops from regular traffic stops.
45
Bus Transit Service Planning and Operations in a Competitive Environment
MethodologyTo determine current travel times along the studied corridor and examine the relationship between travel times for personal vehicles and buses, the research team used two levels of analysis. This paper first presents a comparison of travel times for different vehicle types along Routes 442 and 444 as a whole. It then pres-ents a comparison of travel times for different vehicle types along smaller route segments. Routes 442 and 444 provide service to a variety of areas and travel along different types of roads. To evaluate the impact of these different route charac-teristics on bus and private vehicle travel time, the research team divided the two routes into smaller segments with similar attributes (i.e., speed, travel direction, road classification, etc.) for analysis. Figure 2 illustrates these segments.
Using travel time data for the routes and the analysis segments, the research team conducted basic statistical analyses to determine travel time patterns. Paired t-tests also were used to examine the relationship between car and bus run times. Using only the data for the analysis segments, the research team estimated two different multivariate regression models to determine the influence of various route characteristics on travel time for both buses and private vehicles. The speci-fications of the models are:
(1) Run Time = f (northbound, AM, PM, length, freeway, vehicle, signals, stop signs, bus stops, ramp meters)
(2) Natural Log of Difference between Car and Bus Run Time = f (north bound, AM, PM, length, freeway, county road, signals, bus stops, meters, route)
Table 2 describes each of the dependent and independent variables used in the models. The first model examines the factors contributing to travel time for probe vehicles and buses along analysis segments. The covariants in the regressions rep-resent the most theoretically relevant variables included in empirical studies of this type. A dummy variable for whether each vehicle is a bus or probe is included in this model. Several variables such as number of traffic signals and bus stops are also included to control for operating environment. Run time is expected to be less for private vehicles relative to buses. Run time is also expected to be less for vehicles traveling on freeway segments relative to vehicles traveling on arterials or residential streets. It is expected to increase with the number of possible stops in a segment, number of traffic signals, number of stop signs, and length of the seg-
Journal of Public Transportation, Vol. 12, No. 3, 2009
46
Figu
re 2
. Rou
tes
442
and
444
Ana
lysi
s Se
gmen
ts
47
Bus Transit Service Planning and Operations in a Competitive Environment
ment. Vehicles traveling during AM or PM peak hours are expected to have longer run times than vehicles traveling during off-peak hours.
The second model evaluates the impact of different route characteristics on the difference between run time for buses and private vehicles. The difference in run time equals the run time for a private vehicle along a segment minus the run time for a bus traveling along the same segment at the same time of day. The depen-dent variable for this model is the natural log of the difference in run times. This functional form not only helps linearize a nonlinear relationship but also provides a useful interpretation for the coefficients of the independent variables. As a result,
Table 2. Variable Descriptions
Variable Description
Run time The run time along an analysis segment (see Figure 2).
LN Difference Run Time The natural log of the difference between run times for a private vehicle and bus traveling on the same analysis segment during the same time of day.
Northbound A dummy variable that equals 1 if the car or bus is traveling north- (traveling towards bound (towards downtown Minneapolis). downtown)
AM Peak A dummy variable that equals 1 if the observed car or bus trip started during the AM peak.
PM Peak A dummy variable that equals 1 if the observed car or bus trip started during the PM peak.
Length of Segment The length of the analysis segment in kilometers.
Freeway A dummy variable that equals 1 if the car or bus is traveling on a freeway segment (no stops and a speed limit of 60 mph).
County Road A dummy variable that equals 1 if the car or bus is traveling on an arterial or county road segment (signalized stops and a speed limit of 40 mph).
Vehicle A dummy variable that equals 1 if the observed vehicle is a car.
# of Traffic Signals The number of traffic signals located on the analysis segment.
# of Stop Signs The number of stop signs located on the analysis segment.
# of Bus Stops The number of bus stops located on the analysis segment. This vari able includes all possible bus stops, not the number of stops actually made.
# of Ramp Meters The number of active ramp meters located on the analysis segment. This variable is equal to 0 for all off-peak observations.
Route A dummy variable that equals 1 if the observed trip is along the Route 442.
Journal of Public Transportation, Vol. 12, No. 3, 2009
48
the coefficients in this model can be interpreted as the percent change in the difference in run times that results from a one-unit increase in the independent variable. For this model, the research team hypothesized that the same relation-ships exist with the independent variables, with the exception that the AM and PM peak variables may have negative coefficients because buses may use shoulder lanes in some areas to bypass congested traffic. If the numbers of bus stops and traffic signals have significant positive coefficients in both of these models, it is an indication that providing BRT service with consolidated stops and ITS improve-ments such as signal priority will lead to significant run time savings.
Travel Time AnalysisRoute Travel Time AnalysisUsing travel time data for the routes, the research team conducted basic statistical analyses to determine run time patterns. Figures 3 through 6 show the run time distributions for buses and private vehicles on Routes 442 and 444. For the 130 matched trips on Route 442, the run times for buses ranged from 21 to 42 minutes. The run times for private vehicles on this route ranged from 17 to 26 minutes, with a median value of 21 minutes. The standard deviation of personal vehicle run times is, not surprisingly, smaller than the standard deviation for buses. This clearly indicates that bus run time is subject to higher variation. The median observed run time for buses is 3.6 minutes longer than that for personal vehicles.
For the 156 matched trips on Route 444, the run times for buses ranged from 17 to 27 minutes, with a median value of 20.3 minutes. The run times for private vehicles on this route ranged from 13 to 24 minutes. The standard deviation of personal vehicle run times on this route is slightly larger than the standard deviation for buses. This indicates a lower variation in running time along the bus route, which can be related mainly to the length of the route. However, it is again the case that the median observed run time for personal vehicles is equal to the minimum observed run time for buses. The difference between median observed run times for buses and personal vehicles on this route is almost the same as that found for Route 442. This fact suggests that the route type, residential or arterial, does not affect the relationship between bus and private vehicle travel times. The median run time for buses on this route is 3.5 minutes longer than that for personal vehicles. Since this finding needs to be validated statistically, a detailed statistical analysis is presented in the following section.
49
Bus Transit Service Planning and Operations in a Competitive Environment
Figure 3. Route 442 Bus Run Time Distribution
Figure 4. Route 442 Private Vehicle Run Time Distribution
Journal of Public Transportation, Vol. 12, No. 3, 2009
50
Figure 5. Route 444 Bus Run Time Distribution
Figure 6. Route 444 Private Vehicle Run Time Distribution
51
Bus Transit Service Planning and Operations in a Competitive Environment
Statistical AnalysisPaired T-TestsAfter examining the distributions of run times, the research team used paired t-tests to examine the relationship between car and bus run times along routes and route segments. Table 3 presents the results of each of the t-test comparisons. Both of the route-level comparisons are significant at the 99% level of confidence. At the route level, the mean difference between run times for buses and private vehicles is 3.98 minutes for Route 442 and 3.59 minutes for Route 444. The difference in bus and car run times at the route level ranges from 3.08 to 4.87 minutes for Route 442 and from 2.91 to 4.26 minutes for Route 444. This statistical analysis indicates that for the bus service to be competitive along either one of the studied routes, it needs a certain amount of travel time savings ranging from 2.91 to 4.87 minutes.
Table 3. Paired T-Test Comparisons
Mean 95% Confidence interval Road Difference of the difference Type (minutes) Lower Upper t Sig. Route 442 Route -3.98 -4.87 -3.08 -8.87 .000Route 444 Route -3.59 -4.26 -2.91 -10.56 .000All Segments - -0.52 -0.59 -0.45 -13.95 .000
Segment 1 Local Street -0.74 -1.13 -0.35 -3.81 .000Segment 2 Freeway -0.91 -1.45 -0.36 -3.32 .002Segment 3 Local Street -0.40 -0.82 0.02 -1.95 .059Segment 4 Arterial -0.48 -0.60 -0.36 -8.33 .000Segment 5 Local Street -0.46 -0.75 -0.16 -3.06 .003Segment 6 Arterial -0.38 -0.93 0.17 -1.40 .171Segment 7 Arterial -0.60 -0.92 -0.28 -3.85 .001Segment 8 Local Street -0.89 -1.13 -0.65 -7.43 .000Segment 9 Arterial -0.22 -0.37 -0.07 -2.93 .007Segment 10 Local Street -0.59 -0.88 -0.31 -4.30 .000Segment 11 Arterial -0.08 -0.14 -0.03 -3.11 .003Segment 12 Local Street -0.35 -0.68 -0.02 -2.10 .040Segment 13 Freeway -0.05 -0.22 0.13 -0.55 .586Segment 14 Arterial -1.53 -1.83 -1.12 -10.19 .000Segment 15 Local Street -0.85 -1.05 -0.66 -8.57 .000Segment 16 Local Street -0.35 -0.56 -0.13 -3.19 .002Segment 17 Arterial -0.11 -0.32 0.10 -1.029 .307Segment 18 Local Street 0.23 -0.03 0.48 1.79 .080Segment 19 Local Street -0.83 -1.18 -0.48 -4.83 .000
Journal of Public Transportation, Vol. 12, No. 3, 2009
52
All but three of the t-tests conducted at the route segment level are significant at the 90% level of confidence. Segments 6 and 13 are mainly the first two seg-ments in each route, while segment 13 is part of a 2.5-mile segment along highway 77. Observing the statistical output can help in identifying the sections where improvements in run time are needed and can lead to substantial saving and in making the transit service competitive. The second step is to understand the built environment along the selected corridors and the effects of each variable on run time to help in maximizing the savings in run time.
Regression ModelsUsing only the data for the analysis segments, the research team estimated two multivariate regression models to determine the influence of various route char-acteristics on travel time for both buses and private vehicles. The first model examines the factors contributing to travel time for probe vehicles and buses along analysis segments. In this model, observed run time (in seconds) along a route segment is used as the dependent variable. Table 4 shows the output for this model. Note that statistically significant variables are in bold.
Table 4. Run Time Model
Independent Variables B t
(Constant) 20.06 4.77 ***
Traveling towards Downtown -10.75 -4.22 ***
AM Peak 11.26 3.51 ***
PM Peak 17.02 5.22 ***
Length of Segment 37.51 26.24 ***
Traveling on Freeway -11.04 -1.15
Vehicle is a Car -30.27 -12.28 ***
# of Traffic Signals 25.85 25.25 ***
# of Stop Signs 15.80 7.42 ***
# of Possible Bus Stops 8.70 13.05 ***
# of Ramp Meters -6.42 -1.66 *
Adjusted R-square 0.69
N 2,138
Dependent Variable Segment Run time (seconds) * Significant at the 90% level*** Significant at the 99% level
53
Bus Transit Service Planning and Operations in a Competitive Environment
This model has an R-square of 0.69, with all variables having a statistically-signif-icant effect on run time except for the freeway variable. In addition, all variables in the model have the expected sign and follow transit operation theory. For example, run time increases by 37.51 seconds for each kilometer a vehicle must travel. Relative to run times during off-peak hours, run time along each segment increased by 11.26 seconds during the AM peak and 17.02 seconds during the PM peak, holding all else constant.
For each traffic signal on a route segment, run time increases by 25.85 seconds. There are currently eight traffic signals located on the Cedar Avenue corridor through which the planned service will pass. If transit signal priority (TSP) is pro-vided at these lights for buses, this would lead to a 3.4-minute run time savings. Each stop sign on a route segment increases run time by 15.8 seconds. By running straight down the Cedar Avenue corridor and avoiding residential areas with stop signs currently served by Route 442, the bus service will gain additional travel time savings. Route 442 currently travels through four stop signs, which add just over one minute to the route’s run time. Similarly, each possible bus stop along a route segment increases run time by 8.7 seconds, whether the bus actually stops to serve passengers or not.1 By consolidating bus stops and cutting the number of possible stops along Cedar Avenue in half, the bus will achieve more run time reductions. The 20 possible stops along Route 442 currently account for 2.7 minutes of each bus’s run time. The Cedar Avenue limited or BRT, alternatively, will serve a longer segment of the corridor with only 10 possible stops, adding only 1.35 minutes to each bus’s travel time.
Variables in this model with a negative effect on run time are direction of travel, number of ramp meters, traveling on the freeway, and traveling in a car. All else held constant, northbound trips have a 10.75 second shorter run time on each route segment. Each ramp meter reduces run time by 6.42 seconds. As expected, type of vehicle has the largest negative impact on travel time. On each route seg-ment, private vehicles have a 30.27-second shorter travel time than buses. Route 442 is divided into eight segments southbound and nine segments northbound, which translates into a 4-minute shorter travel time for cars traveling south and 4.5-minute shorter travel time for cars traveling north relative to buses, all else being equal. This difference can be easily minimized if the City and the transit agency implemented some of the above-mentioned strategies for travel time sav-ings.
Journal of Public Transportation, Vol. 12, No. 3, 2009
54
The second model evaluates the impact of different route characteristics on the difference between run time for buses and private vehicles. The dependent vari-able for this model is the natural log of the difference in run times. As a result, the coefficients in this model can be interpreted as the percent change in the difference in run times that results from a one-unit increase in the independent variable. Table 5 shows the outputs of this model.
Table 5. Run Time Difference Model
Independent Variables B t
(Constant) -0.99 -9.20 ***
Traveling towards Downtown -0.21 -3.01 ***
AM Peak 0.18 1.98 **
PM Peak -0.08 -0.86
Length of Segment 0.16 3.78 ***
Traveling on Freeway -1.07 -3.46 ***
Traveling on County Road -0.08 -0.84
# of Traffic Signals 0.19 7.04 ***
# of Possible Bus Stops 0.03 1.93 **
# of Ramp Meters 0.04 0.28
Route 442 -0.08 -1.03
Adjusted R-square 0.18
N 762
Dependent Variable Natural Log of Difference
between Car and Bus Run time
* Significant at the 90% level ** Significant at the 95% level *** Significant at the 99% level
This model has an R-square of 0.18, with the majority of variables having a statisti-cally-significant impact on the log of the difference between bus and car run times. Again, the variables in this model have the expected signs and follow transit opera-tion theory. The difference between car and bus run times is 18 percent greater during the AM peak hours relative to off-peak hours, all else held constant. For each additional kilometer traveled, the difference between car and bus run times increases by 16 percent. Each traffic signal increases the run time difference by 19 percent due to buses’ slower acceleration time and other factors. For each possible stop, the difference in run time increases by 3 percent, whether the bus stops or
55
Bus Transit Service Planning and Operations in a Competitive Environment
not. The small magnitude of this variable could be because of the large number of possible stops and small number of actual stops being made on the studied routes. Alternatively, some of the impact of stops may be attributed to traffic signals in this model due to the prevalence of stops located on the nearside of signalized intersections along the Cedar corridor. Regardless, these results show that consoli-dating bus stops and implementing TSP as part of the Cedar Avenue corridor will help to reduce the travel time disparity between buses and private vehicles in the region and increase the attractiveness of transit service.
Several factors have a statistically-significant negative impact on the difference between run times for private vehicles and buses. The difference between car and bus run times is 21 percent less for northbound trips heading towards downtown Minneapolis. On freeway route segments, buses actually had a shorter travel time than personal vehicles on average, all else being equal. This is likely due to the fact that buses can bypass congested traffic and ramp queues on freeway segments of the Cedar Avenue corridor by using bus-only shoulder lanes.
Conclusions/RecommendationsThe analysis presented in this paper highlights several issues related to the Cedar Avenue transit corridor in particular and to transit planning in general. This research has evaluated conditions along the Cedar Avenue corridor that will influence bus and private vehicle travel time. It has also outlined an innovative approach for estimating travel time for new transit lines based on GPS data collected by probe vehicles. The statistical analyses used in this research were conducted at two levels: the route level and the route segment level. The research team’s analysis of route level travel time patterns shows that Cedar Avenue corridor buses have greater variation in their run times than vehicles. However, for both of the studied routes, the median travel time for private vehicles was equal to the minimum travel time for buses. The difference between median car and bus travel times for both routes was approximately 3.5 minutes.
The analysis of route-segment-level data provides a more detailed understand-ing of the relationship between vehicle type, route characteristics, and run time. While personal vehicles have an inherent travel time advantage over buses under existing conditions on the Cedar Avenue corridor (and most major arterials), our analysis shows that altering route characteristics can reduce overall travel time and minimize the travel time disparity between buses and cars. In particular, the
Journal of Public Transportation, Vol. 12, No. 3, 2009
56
models presented in this paper lend support to bus stop consolidation and imple-mentation of transit signal priority along the Cedar Avenue corridor. Providing transit signal priority at the eight traffic signals currently located on the corridor would reduce bus travel time by 4 minutes for southbound trips and 4.5 minutes for northbound trips. This strategy would also eliminate the travel time advantage of private vehicles over buses on the corridor, according to our second model. Reducing the number of possible bus stops from 20 to 7 will remove an additional 1.7 minutes from the current bus travel time along this section of the corridor. Bus-only shoulder policies seem to have a great effect on the competiveness of transit vehicles over regular cars; accordingly, it is recommended to use this policy in other regions and when running bus service along congested freeway corridors. Finally, by running straight down the Cedar Avenue corridor and avoiding smaller local streets, the bus will save an additional one minute in travel time that is cur-rently spent at stop signs. In addition to these travel time savings, remaining on the main corridor where there are freeway-like conditions will help to reduce the difference between travel time for buses and personal vehicles even more. Under these conditions, travel time via BRT running along this corridor would be approx-imately 2.5 minutes shorter than median run time via personal vehicle. This travel time would increase the amenity value of the BRT, attract ridership, and help to ensure the competitiveness of this transit line.
In conclusion, it should be noted that the analyses presented in this paper are based on a very limited run time dataset collected using handheld GPS units. This project was adapted to focus on the Cedar Avenue corridor, and a new methodol-ogy was developed to predict travel time for a transit provider with no existing ITS data collection systems. Due to the placement of many MVTA bus stops on the nearside of signalized intersections, the research team was not able to determine when actual passenger stops were being made. Also, budgetary restrictions pre-vented MVTA or the research team from being able to collect passenger counts for the entire study period. It is recommended that MVTA implement an AVL and APC system.
Future research should include budget for passenger counts for the entire study period. The number of possible stops and actual stops should be included in the future to better model the effects of bus stop consolidations. Other data that should be included in these models and may be available from transit agencies with more advanced ITS systems include smart card use, lift use, bus-only shoulder use, etc.
57
Bus Transit Service Planning and Operations in a Competitive Environment
Acknowledgments
This research was funded through Hennepin County, Minnesota; accordingly, acknowledgment is given to Robb Luckow and Larry Blackstad of Hennepin County Community Works & Transit. The authors would like to express their appreciation to Michael Abegg from MVTA for his support in collecting the data, to the students who volunteered to drive the probe vehicles, and to the Minnesota Traffic Observatory, which supported this research and provided the facilities for conducting the analysis. Finally, the authors would like to thank the three anony-mous reviewers for their feedback on the earlier version of the manuscript.
Endnotes1 Unfortunately, using the data collected by handheld GPS units taking points at regular time (as opposed to distance) intervals, it was not possible for the research team to determine when buses actually stopped to serve passengers. In future research, the number of actual stops made as well as the number of possible stops should be included as variables in this model.
References
Abkowitz, M., and I. Engelstein. 1983. Factors affecting running time on transit routes. Transportation Research Part A 17(2): 107-113.
Abkowitz, M., and I. Engelstein. 1984. Methods for maintaining transit service regularity. Transportation Research Record 961: 1-8.
Abkowitz, M., and J. Tozzi. 1987. Research contributing to managing transit service reliability. Journal of Advanced Transportation 21 (Spring): 47-65.
Bertini, R., and S. Tantiyanugulchai. 2004. Transit buses as traffic probes: Use of geolocation data for empirical evaluation. Transportation Research Record 1870: 35-45.
Furth, P., and T. Muller. 2006. Service reliability and hidden waiting time: Insights from automatic vehicle location data. Transportation Research Record 1955: 79-87.
Journal of Public Transportation, Vol. 12, No. 3, 2009
58
Furth, P., and T. Muller. 2007. Service reliability and optimal running time sched-ules. Paper presented at the Transportation Research Board 86th Annual Meeting.
Guenthner, R. P., and K. C. Sinha. 1983. Modeling bus delays due to passengers boardings and alightings. Transportation Research Record 915: 7-13.
Koenig, J. G. 1980. Indicators of urban accessibility: Theory and application. Trans-portation 9: 145-172.
Krizek, K. J., and A. M. El-Geneidy. 2007. Segmenting preferences and habits of tran-sit users and non-users. Journal of Public Transportation 10(3): 71-94.
Levinson, H. 1983. Analyzing transit travel time performance. Transportation Research Record 915: 1-6.
Murray, A., and X. Wu. 2003. Accessibility tradeoffs in public transit planning. Jour-nal of Geographical Systems 5(1): 93-107.
Strathman, J. G., K. J. Dueker, T. J. Kimpel, R. L. Gerhart, K. Turner, P. Taylor, et al. 2000. Service reliability impacts of computer-aided dispatching and auto-matic location technology: A Tri-Met case study. Transportation Quarterly 54(3): 85-102.
Turnquist, M. 1978. A model for investigating the effect of service frequency and reliability on bus passenger waiting times. Transportation Research Record 1978: 70-73.
Welding, P. I. 1957. The instability of a close-interval service. Operational Research Quarterly 8(3): 133-142.
About the Authors
Ahmed El-Geneidy ([email protected]) is an Assistant Professor at McGill University in Quebec, Canada. His research interests include land use and transportation planning, transit operations and planning, travel behavior analysis including both motorized (auto and transit) and non-motorized (bicycle and pedestrian) modes of transportation, travel behavior of disadvantaged popula-tions (seniors and people with disabilities), and measurements of accessibility and mobility in urban contexts.
59
Bus Transit Service Planning and Operations in a Competitive Environment
John Hourdos ([email protected]) is the director of the Minnesota Traffic Observatory at the Department of Civil Engineering, University of Minnesota. His research focuses on microscopic simulation, traffic model calibration, and inci-dent detection and prevention. Recently, in collaboration with the ITS Institute, he designed, assembled, and deployed an array of advanced traffic detection and surveillance stations in the highest freeway accident area in the Twin Cities.
Jessica Horning ([email protected]) is a transportation planner at Cam-bridge Systematics in Bethesda, Maryland. She has a master’s degree in Urban Plan-ning from the University of Minnesota. Her research interests include land use and transportation planning, transit planning and operations, and active transportation especially cycling.
Journal of Public Transportation, Vol. 12, No. 3, 2009
60
61
Transit Response to Congestion Pricing Opportunities
Transit Response to Congestion Pricing Opportunities:
Policy and Practice in the U.S.Matthew H. Hardy
Noblis
Abstract
This research assesses how U.S. transit agencies have taken advantage of congestion pricing projects and answers two questions: (1) what role has transit played in U.S. congestion pricing projects, and (2) how have transit agencies responded to conges-tion pricing projects through service planning, operating practices, capital invest-ment, and institutional arrangements. First, transit is seen as a direct beneficiary of congestion pricing projects since transit systems operate free of charge, thereby achieving a more reliable and/or faster travel time, thereby as well as facilitating a shift to a higher occupancy mode (buses). Second, a micro-level analysis comparing two congestion pricing projects in Northern Virginia is made.
IntroductionCongestion pricing is designed to reduce traffic congestion by charging users a higher fee when roads are busier and a lower fee when they are not and is based upon fundamental economic principles of allowing market forces and pricing to allocate the use of finite transportation system capacity (Rouwendal and Verhoef 2006). The primary intent of congestion pricing is to mitigate the effect of too much demand on the roadway infrastructure and ensure efficient system utiliza-tion. Historically, two concerns of deploying congestion pricing projects in the
Journal of Public Transportation, Vol. 12, No. 3, 2009
62
United States have been technical feasibility and political acceptability (Giuliano 1992). While technical feasibility has been addressed through the development of open-road tolling and other ITS technologies, political acceptability has not been fully addressed.
Concerning political acceptability, in the commissioned paper Curbing Gridlock: Peak-Period Fees to Relive Congestion, Kain (1994) suggests that little political attention had been given to transit in the past because the effects are complex and require a number of assumptions that are difficult to defend. However, recent experience suggests two components concerning the political acceptability of congestion pricing projects related to transit. First, transit is seen as a direct ben-eficiary of congestion pricing projects since transit systems operate free of charge, thereby achieving a more reliable and/or faster travel time, thereby facilitating a shift to a higher occupancy mode (buses). For example, according to Small’s (2005) assessment of London’s congestion pricing system, “…better [transit] service was made possible, desirable, and financially viable by congestion pricing itself.” Sec-ond, transit addresses the concern of fairness (or social equity) regarding the use of publically-funded transportation infrastructure (Giuliano 1994). Concerns about social equity center around the effect that congestion pricing may have on lower-income groups1 (Viegas 2001). Recently, an NCHRP study regarding the public opinion of congestion pricing projects articulates social equity as a key concern of the public as well as how revenue generated by the project is used (Zmud and Arce 2008). Weinstein and Sciara conclude that social equity has a tendency to shape the overall design of the project, which often includes spending the revenue gener-ated on alternate transportation options for users (Weinstein and Sciara 2006).
Thus, it would appear that including transit in the planning and design of con-gestion pricing projects appears to be essential to make it politically tenable. If congestion pricing projects require some type of transit involvement, the question becomes, with more than 15 years having passed since the U.S. implemented its first congestion pricing system in California, what role has transit really played? New initiatives by the U.S. Department of Transportation (U.S.DOT), including more than $1 billion to further demonstrate congestion pricing in the U.S., pro-vide the opportunity to address this question more in-depth. Additionally, two congestion pricing projects using private equity being constructed in the Com-monwealth of Virginia that will bring on-line nearly 150 lane-miles of congestion pricing by 2013 further add to the available data from which to draw. This paper addresses the following two research questions:
63
Transit Response to Congestion Pricing Opportunities
What role has transit played in U.S. congestion pricing projects currently in 1. the operation, construction, or design stage of the project life-cycle?
How have transit agencies responded to congestion pricing projects through 2. service planning, operating practices, capital investment, and institutional arrangements?
Methodology and DataThese research questions are investigated through a macro- and micro-level analysis of congestion pricing projects in the U.S. First, a macro-level analysis of 21 congestion pricing projects that were either operating or in the design/construc-tion stage of the project life-cycle were identified based upon interviews with people at the federal, state, and local levels. This research purposefully excluded those projects in the planning stage since the overall role of transit was either too early to assess or too vague in nature to be of any value. Second, for each of the 21 projects, data were gathered regarding overall project characteristics from a number of sources, including planning documents, federal project applications, interviews with key project personnel, and project evaluations. Third, a ranking was given to each regarding both the involvement and impact of transit within the project. Finally, a micro-level analysis of two Virginia congestion pricing proj-ects was undertaken. This analysis includes a more detailed review of the available planning documents associated with the projects and in-depth interviews with key personnel, including the Virginia Department of Transportation (VDOT) multimodal liaison, transit agency planning staff, and the metropolitan planning organization transportation director.
The congestion pricing projects included in this assessment are listed in Table 1, sorted according to operational year and including the following relevant data:
1. Location
2. Length
3. Type—Type of congestion pricing project based upon the U.S. DOT Fed-eral Highway System classification system: variably priced lanes (VPL), variable priced toll road (VP-TR), cordon pricing (CP), or area-wide pricing (AWP).
4. Status
5. Operational Year
Journal of Public Transportation, Vol. 12, No. 3, 2009
64
6. System Type—New construction (New) or conversion of existing roadway (Conversion).
7. Operations—Privately- or publicly-operated system.
8. Transit Involvement—A ranking of transit involvement in the overall con-gestion pricing project planning and design that was conducted indepen-dently by the author using available documents, reports, presentations, conference proceedings and discussions.
Low—No existing transit service in the congestion pricing corridor. •No mention of transit as an important element in the planning docu-ments.
Medium—Existing transit service in the congestion pricing corridor. Tran-•sit mentioned as an important element within the documents reviewed. Revenue from congestion pricing could be used to offer alternatives but no additional funding has been identified for transit improvements.
High—Existing transit service in congestion pricing corridor. Funding •is codified in state law for transit improvements or funding for transit improvements have been identified and made available.
9. Transit Impact—An assessment of the overall impact of transit because of the congestion pricing project. The assessment is based upon Kain’s (1994) analysis of transit’s likely response to congestion pricing which includes improvements in speed, reliability, ridership and load factors as well as an overall expansion of service.
• NotSignificant(NotSig.)—Transitservicehasbeenunaffectedbythecongestion pricing project (e.g., no improvement or service expan-sion).
• Significant(Sig.)—Transitservicehasbeenimprovedasaresultofthecongestion pricing either through improved service and expanded operations.
10. Transit Revenue Source—Source of transit funding.
65
Transit Response to Congestion Pricing Opportunities
Tabl
e 1.
U.S
. Con
gest
ion
Pric
ing
Proj
ect S
umm
ary
Proj
ect
Loca
tion
Leng
th
(mile
s)Ty
peSt
atus
Ope
rati
onal
Ye
arSy
stem
Ty
peO
pera
tion
s
Tran
sit E
ffect
s
Invo
lvem
ent
Impa
cts
Reve
nue
Sour
ce
SR-9
1O
rang
e Co
unty
10V
PLO
pera
ting
1995
New
Priv
ate
Med
ium
Not
Sig
.no
ne
I-15
FasT
rak
San
Die
go8
VPL
Ope
ratin
g19
96N
ewPu
blic
Hig
hSi
g.V
PL R
even
ue
Katy
Fre
eway
(I-1
0)H
oust
on13
VPL
Ope
ratin
g19
98Co
nver
sion
Publ
icLo
wN
ot S
ig.
none
LeeW
ayLe
e Co
unty
2aV
P-TR
Ope
ratin
g19
98Co
nver
sion
Publ
icLo
wN
ot S
ig.
none
Nor
thw
est F
reew
ay (U
S 29
0)H
oust
on14
VPL
Ope
ratin
g20
00Co
nver
sion
Publ
icLo
wN
ot S
ig.
none
New
Jers
ey T
urnp
ike
Aut
h.Va
rious
148
VP-
TRO
pera
ting
2000
Conv
ersio
nPu
blic
Low
Not
Sig
.no
ne
Port
Aut
horit
y N
Y/N
JN
Y/N
J Int
erst
ate
Cros
sings
6 a
VP-
TRO
pera
ting
2001
Conv
ersio
nPu
blic
Hig
hSi
g.V
P-TR
Rev
enue
San
Joaq
uin
Hill
s (73
) Tol
l Rd
Ora
nge
Coun
ty15
VP-
TRO
pera
ting
2002
New
Publ
icLo
wN
ot S
ig.
none
I-394
MnP
ASS
Min
neap
olis
9V
PLO
pera
ting
2005
Conv
ersio
nPu
blic
Hig
hN
ot S
ig.
VPL
Rev
enue
I-25
Expr
ess L
anes
Den
ver
7V
PLO
pera
ting
2006
Conv
ersio
nPu
blic
Hig
hN
ot S
ig.
VPL
Rev
enue
I-15
Salt
Lake
City
38V
PLO
pera
ting
2006
Conv
ersio
nPu
blic
Low
Not
Sig
.no
ne
SR 1
67Se
attle
9V
PLO
pera
ting
2008
Conv
ersio
nPu
blic
Med
ium
Not
Sig
.no
ne
I-95
HO
T La
nes
Mia
mi
21V
PLCo
nstr
uctio
n20
09Co
nver
sion
Publ
icH
igh
Sig.
UPA
Fed
eral
Gra
nt
SR-5
20Se
attle
6.5
VP-
TRCo
nstr
uctio
n20
09Co
nver
sion
Publ
icH
igh
Sig.
UPA
Fed
eral
Gra
nt
Gol
den
Gat
e Br
idge
San
Fran
cisc
o1*
VP-
TRD
esig
n20
09Co
nver
sion
Publ
icH
igh
Sig.
UPA
Fed
eral
Gra
nt
I-95/
395
HO
T La
nes
Nor
ther
n V
irgin
ia56
VPL
Des
ign
2010
Conv
ersio
nPr
ivat
eH
igh
Sig.
Publ
ic-Pr
ivat
e
Part
ners
hip
Neg
otia
tion
Swoo
pSa
n D
iego
27V
PLD
esig
n20
10N
ewPu
blic
Hig
hSi
g.U
PA F
eder
al G
rant
I-35W
Min
neap
olis
15V
PLCo
nstr
uctio
n20
10Co
nver
sion
Publ
icH
igh
Sig.
UPA
Fed
eral
Gra
nt
I-10
Los A
ngel
es28
**V
PLD
esig
n20
10Co
nver
sion
Publ
icH
igh
Sig.
CRD
Fed
eral
Gra
nt
I-110
Los A
ngel
es33
VPL
Des
ign
2010
Conv
ersio
nPu
blic
Hig
hSi
g.C
RD F
eder
al G
rant
I-495
HO
T La
nes
Nor
ther
n V
irgin
ia12
VPL
Cons
truc
tion
2013
New
Priv
ate
Low
Not
Sig
.no
ne
* Thes
e va
lues
repr
esen
t the
num
ber o
f brid
ges a
nd tu
nnel
s inc
lude
d as
par
t of t
he c
onge
stio
n pr
icin
g pr
ojec
t.**
Lan
e-m
iles o
f con
gest
ion
pric
ing
road
way
.
Journal of Public Transportation, Vol. 12, No. 3, 2009
66
Macro Assessment of Transit Role in Congestion Pricing ProjectsAs seen in Table 1, the involvement of transit shows 13 of the 21 projects receiv-ing a rank of High, while two were ranked Medium, and seven ranked as Low. This indicates that as part of the project design stage, transit has played an important role in shaping the congestion pricing project. For example, the I-15 project in San Diego was implemented as a tool to use available capacity on the HOV lanes on I-15 between Poway and San Diego as well as provide a revenue source to fund new transit service along the same corridor (Hultgren and Kawada 1999). Thus, transit had a vested interest in the success of the project. Other examples of high involvement include projects in Colorado and Minnesota, both of which have legislation indicating that excess revenue generated by the projects can be used to fund transit service within the corridor. Finally, there are the eight congestion pricing projects funded as part of the U.S. DOT’s Fight Gridlock Now program, which includes large federal grants to demonstrate congestion pricing as well as fund transit service as an integral part of those projects.
While transit involvement in congestion pricing projects appears to be substantial, the reality of how transit has been affected by these projects is quite different. An initial review of the data in Table 1 indicates that the impact on transit has been substantial with 50 percent of the projects receiving a ranking of Significant and 50 percent receiving a ranking of Not Significant. Taken in isolation, this would indicate that most transit systems significantly benefit from congestion pricing projects. However, a more careful assessment shows something remarkably dif-ferent. First, of the 12 operational projects, only 2 have had a significant impact on transit (compared to 4 of the 12 having a ranking of High in terms of transit involvement). This indicates that while the potential for transit is high (measured by transit involvement), the reality is that the impact on transit has not been sig-nificant for the operational projects (measured by transit impact).
Second, examining those projects in the design or construction stage reveals that each one receiving an involvement ranking of High also received a transit impact ranking of Significant. The reason is the revenue source for the transit improve-ments. All of the projects receiving a Significant ranking for transit impact that are in the design and construction stage have a dedicated lump-sum source of reve-nue that will be used to make the transit improvements. These projects do not rely on the variability of revenue generated by the congestion pricing project through tolls and user fees. All but one of the non-operational projects will use a federal
67
Transit Response to Congestion Pricing Opportunities
grant as the means to make the transit improvements. The funding arrangement of the non-operational projects is in contrast to the operating congestion pricing projects where those projects receiving a transit involvement ranking of High rely on revenue generated by the congestion pricing projects to make transit improve-ments, with only two of the four receiving a transit impact rating of Significant.
In the four cases where transit involvement was ranked High, all relied on revenue generated by the congestion pricing project to fund transit improvements. Only two of the four projects resulted in significant impact to transit operations. The first is the Port Authority of NY/NJ, which implemented congestion pricing on the six interstate crossings and has produced a significant increase in funding for transit. The second is the I-15 congestion pricing project in San Diego, where revenue was used to establish a new transit service in the corridor. The other two operational congestion pricing projects (I-394 MnPASS and I-25 Express Lanes) have not generated enough revenue to cover operational costs, let alone provide additional funding for transit improvements in the corridor.
The results of this macro-level analysis revealed three common themes among the 21 projects:
1. Transit involvement is high, but long-term opportunities are lacking—Half of the operational congestion pricing projects that include high opportunities for improved transit service as part of state enabling legislation have not provided any revenue to the transit agency. Of the 9 non-operational systems, none include specific language as to sources of revenue for improved transit service beyond those made available as part of an initial federal grant or project nego-tiation. The lack of on an ongoing revenue source indicates that while transit is perceived to have an important role in the overall project, the long-term impact is by no means guaranteed.
2. Congestion pricing projects with significant transit impact include a dedicated funding source, not just a portion of revenue—Transit has been included as a key player in many congestion pricing projects that are either operating or in the design/construction stage. However, there is a clear distinction between the potential for transit (indicated by its involvement) and the overall impact it has. Generally, those congestion pricing projects with a significant impact on transit included a dedicated source of funding independent of the expected revenue generated.
Journal of Public Transportation, Vol. 12, No. 3, 2009
68
3. Transit must be a major partner—In the two operational systems where transit had a significant impact, transit was an important project partner even though the role was different for each. One of the stated goals of the Port Authority of NY/NJ congestion pricing project was to encourage use of mass transit in cor-ridors with transit alternatives along with reducing traffic congestion. A similar set of goals was established for the I-15 FasTrack system. However, the same is not true for the other operational congestion pricing projects. For example, the Katy Freeway in Houston has the goal of utilizing excess capacity on the HOV lanes and the LeeWay project has the goal of reducing peak-period demand.
Micro Assessment of Transit Role in Congestion Pricing ProjectsThe second dimension of this assessment is to assess how transit agencies have responded to congestion pricing projects through service planning, operating practices, capital investment and institutional arrangements. Based on the data gathered from the 22 congestion pricing projects in the U.S., this was difficult to accomplish since only the I-15 FasTrak system in San Diego included the opera-tion of new transit service as a direct response to the congestion pricing system being implemented. The other congestion pricing project with significant transit impacts, Port Authority of NY/NJ, did not include any major modification to ser-vice planning, operating practices, or institutional arrangements as a result of the project.2
However, what was gleaned from the data gathering and assessment was an inter-esting difference between the two congestion pricing projects currently being designed and constructed in northern Virginia. These two projects will add more than 150 lane-miles of priced lanes to the region along some of the most highly-congested corridors. Both are being constructed using private equity under the Virginia Public Private Transportation Act (PPTA). While the I-95/395 HOT Lanes include more than $195 million in funding for improved transit service, the I-495 HOT Lanes project includes no monies. The following case study assessment pro-vides an overview of each project and concludes with an analysis comparing and contrasting the two.
69
Transit Response to Congestion Pricing Opportunities
Northern Virginia Congestion Pricing Project Summaries3
I-495 Capital Beltway HOT Lanes4
Construction of the I-495 HOT Lanes began in summer 2008 with an expected completion date of 2013. The congestion pricing project will include the construc-tion of four new variably-priced lanes along the Virginia section of the Capital Beltway between the Springfield Interchange and just south of Georgetown Pike. A consortium led by Flour-Transurban is financing and constructing the entire 14-mile project. When completed, the HOT lanes will allow transit and HOV-3 vehicles to travel free, while SOV and HOV-2 vehicles will pay a variable toll based on current travel demand to provide free-flow travel conditions. The Flour-Tran-surban consortium will hold a 75-year operating lease with any financial success (above and beyond benchmarks set forth in the PPTA agreement) shared with the Commonwealth of Virginia.
Initial acceptance of the HOT lanes project ran into local government and commu-nity opposition based on the perceived exclusiveness of the lanes (“Lexus Lanes”), limited community involvement, and the lack of support for alternative modes of transportation (Hardy 2008). To address these concerns, the Flour-Transurban consortium began to include more community involvement and highlight the benefits to other transportation modes. For example, the literature describing the project labeled the HOT lanes as “HOV/Bus/HOT Lanes” to promote the multi-model nature of the project. Also, the consortium emphasized the infrastructure improvements being made will create more bicycle and pedestrian access points that currently do not exist on many of the bridges crossing the Capital Beltway.
However, the role of transit within the HOT lanes project is still small, which may be a reflection of current transit service along this section of the Capital Beltway. Currently, no transit service operates on this section of the beltway due primarily to the unreliability of travel times even though two of the largest employment centers and housing areas within Fairfax County are located at either ends of the project: Springfield and Tysons Corner. The only transit service serving these two areas is Fairfax Connector Bus 401 operating on thirty-minute headways but using local streets adjacent to the beltway. Fairfax County (operator of the Fairfax Connector bus service) is currently creating a ten year long range bus plan and intends to incor-porate the availability of the HOT lanes into this plan (Fairfax County Department of Transportation 2008). The Potomac Rappahannock Transportation Commission (PRTC) has listed the unreliability of travel time on the Capital Beltway as one reason they do not provide service to Tyson’s Corner from southern Prince William County
Journal of Public Transportation, Vol. 12, No. 3, 2009
70
(Marx 2008). Ironically, however, PRTC will be operating an express bus service dur-ing construction of the I-495 HOT Lanes between Springfield and Tyson’s Corner as part of the work zone transportation management plan to mitigate mobility impacts as a result of the construction (Pardo 2008). Whether these express bus routes remain after construction is complete is not known.
I-95/395 HOT Lanes5
The I-95/395 HOT Lanes congestion pricing project will expand existing HOV lanes located on both I-95 and I-395 from two to three lanes and extend the lanes into Spotsylvania County near Fredericksburg. The HOT lanes will be variably priced and switch direction based upon peak period demand (northbound in the morn-ing and southbound in the evening). Once complete, users will be able to use the HOT lanes for 56 miles from Fredericksburg to Washington, D.C. The project is being pursued under the Virginia PPTA by the Flour-Transurban consortium where private equity will be used to build-operate-maintain the HOT lanes for a 75-year lease period with any financial success (above and beyond benchmarks set forth in the PPTA agreement) shared with the Commonwealth of Virginia.
The I-95/395 corridor is currently used by many different transit agencies and opera-tors including private bus service, express buses, local buses, heavy rail and commuter rail. In addition, there are numerous park-and-ride lots and subsequent slug lines (ad hoc carpools formed on-the-fly at commuter park-and-ride lots along I-95). In a reflec-tion of transit’s heavy use within the corridor, the I-95/395 HOT lanes project includes a number of direct benefits to transit users, including infrastructure improvements such as more on/off ramps that will enable faster travel times, new transit stations, additional roadway capacity and a contribution by Flour-Transurban towards capital investment for transit (purchase of buses, construction of park-ride-lots, etc.). Because of this contribution, negotiated as part of the PPTA agreement, the Commonwealth Transportation Board instructed the Virginia Department of Rail and Public Transpor-tation (VDRPT) to develop a comprehensive transit/TDM study for the corridor to better determine how the available funding could be used (VDRPT 2008).
Project Comparison and AnalysisWhile the two Virginia congestion pricing projects appear to be similar in terms of location, institutional arrangements, and the use of private equity to design-build-operate, the overall impact to transit is very different. Table 2 provides a summary of the differences and commonalities between the two projects as they relate to transit impacts.
71
Transit Response to Congestion Pricing Opportunities
Table 2. Comparison of Transit Impacts for Virginia Congestion Pricing Projects
I-495 HOT Lanes I-95/395 HOT Lanes
Existing Transit Service Route 401 bus service •(approximately 2 buses per hour during the service period)
127 buses per hour (peak)•10 Metrorail trains per hour •2 Virginia Railway Express (VRE) trains •every hour2 Amtrak trains (peak)•
Operating Agencies and Services within Corridor
Fairfax Connector• Potomac and Rappohannock •Transportation CommissionWashington Metropolitan Area Transit •AuthorityVirginia Railway Express•Fairfax County•AMTRAK•City of Alexandria•Arlington County•Fredericksburg Regional Transit•Private Commuter Bus•Slug Lines•Park-and-ride Lots•
Construction Type New• Conversion•New•
Long-Range Planning Included in Constrained •Long-Range Plan
Included in Constrained Long-Range Plan•
Service Planning Fairfax County includ-•ing new transit service options on I-495 HOT lanes as part of a 10-year long-range bus plan
Extensive Transit/TDM Study conducted •to determine most effective use of transit service on HOT lanesLocal agencies incorporating into service •planning
Operating Practices New express bus being •implemented as part of work zone transporta-tion management plan
New BRT service being considered•
Institutional Arrangements PPTA• PPTA•VDRPT took lead role in developing •Transit/TDM Study
Capital Investment into Transit None• $195 million lump sum payment•
OnGoing Revenue Source* Potential for revenue• Potential for revenue•
Direct Benefits to Transit Improvements
Transit operates free •on HOT lanes
Transit operates free on HOT lanes•28-mile southern extension of existing •HOV lanes3,000 new park-and-ride spaces in the •corridor33 new entry/exit ramp facilities•In-line BRT station in Lorton•Enhancements to 12 existing bus stations•
*Both projects include revenue sharing clauses that will provide Virginia with a portion of the revenue generated above certain benchmarks.
Journal of Public Transportation, Vol. 12, No. 3, 2009
72
As seen in Table 2, there are a number of commonalities between the two proj-ects. First, both are constructed under the Virginia PPTA and include a clause that enables Virginia to benefit from any success of the HOT lanes in terms of revenue generation above and beyond what is stipulated in the agreements. Thus, if demand is higher than projected there is the potential for an additional revenue source for Virginia; but, whether it would be spent on transit is not known. Second, both projects have been included in the regional constrained long-range plan, meaning they will be taken into account as part of the regional travel demand modeling efforts and service planning. Third, in both projects, transit will be able to use the HOT lanes free of charge. In the case of the I-495 project, this means new infrastructure on which to operate. For the I-95/395 project, this means additional capacity and access points. Finally, construction of both will include new roadway infrastructure, and the I-95/395 project also includes conversion of existing HOV lanes to HOT lanes. Previous congestion pricing projects that have converted existing HOV lanes to HOT lanes have included concerns about the impact on transit. For example, the SR 167 HOT lanes included construction of barrier sepa-ration which forced transit buses to alter their travel patterns on the lanes. How-ever, conversion on I-95/395 will not have similar concerns since additional entry and exit points are being constructed.
What is most striking in Table 2 are the differences between the two projects in terms of existing transit service and the number of operating agencies within the corridor. The I-95/395 HOT lanes includes significantly more transit service and agencies compared with the I-495 HOT lanes project, which may have been a major factor in VDOT negotiating with the Flour-Transurban consortium a $195 million contribution towards transit improvements within the corridor as part of the PPTA. In addition, the existence of a strong transit user base more than likely contributed to the need to better articulate exactly how transit users would ben-efit as part of the I-95/395 HOT lanes project. With the I-495 project, no transit user base existed except for a local bus service that operated on streets adjacent to the Capital Beltway. Thus, when an assessment was made as to current demand for transit among the three major activity centers (Springfield, Merrifield, and Tyson’s Corner), there were little data to use except the single bus route and speculation as to what type of demand may be created by the HOT lanes. However, with the I-95/395 HOT lanes, the amount of existing demand was easily calculated along with future demand for new transit service.
73
Transit Response to Congestion Pricing Opportunities
The micro-level analysis of the two Virginia congestion pricing projects revealed the following observations:
1. Establishing a transit user base is important—On one hand, for transit to be an integral player, an existing user base needs to be established. The I-95/395 project had a tremendous number of existing transit users whose concerns had to be addressed for the project to move forward. A similar transit user base was not identified for the I-495 project. On the other hand, congestion pricing proj-ects could stimulate a new transit user base to be formed if the system were designed to take advantage of the transportation infrastructure. For example, the I-495 HOT lanes would create a corridor with more reliable and faster travel times for buses, enabling Fairfax County to establish new transit service, thereby establishing a new user base.
2. Transit agencies need to adapt quickly to congestion pricing projects—Both the I-95/395 and I-495 HOT lanes projects have moved forward very quickly con-sidering the length of time each has been in the planning stage. This presents a barrier to many transit agencies that are not able to adapt to such an aggressive schedule. In the case of the I-495 HOT lanes, the local operating agency has just begun to incorporate the new facility into its operations. A similar observation can be made of the I-95/395 project, where VDRPT has produced an overall study about new transit service in the corridor but no changes have actually been made. The speed with which VDRPT has moved is in contrast to VDOT, which very quickly adapted to the congestion pricing proposals when they were submitted.
3. Transit agencies need to consider innovative operations—There is little evi-dence to suggest that any types of new or innovative operating practices are being considered for the Virginia HOT lanes, which may be one of the more critical elements to ensuring transit benefits from congestion pricing. Taken together, the two Virginia congestion pricing projects provide an example of a network-based HOT lane application where new transit service could operate (Poole and Orski 2003). However, it requires extensive planning and changes to existing operations and infrastructure. For example, a bus rapid transit (BRT) network could be established between Springfield and Tyson’s Corner with in-line stations along the HOT lanes right-of-way and pedestrian access via the bridges going over the roadway. Establishing a BRT network that incorporates innovative operations, however, requires forethought prior to final design and construction.
Journal of Public Transportation, Vol. 12, No. 3, 2009
74
ConclusionsThe purpose of this research was to assess how U.S. transit agencies have taken advantage of opportunities provided by congestion pricing projects. The macro-level assessment of the 21 U.S. congestion pricing projects shows that while transit agencies have been included as important players, they have not had an active role to date. Of the 12 operating congestion pricing projects, only two have seen any type of significant impact on transit. Thus, while the involvement of transit has been significant in congestion pricing projects, the overall impact on transit has been small. This is an important finding since much of the literature states that congestion pricing could be a means to better fund transit operations. What this analysis found is that very few congestion pricing projects resulted in long-term, ongoing sources of revenue for a transit agency to provide new service or improve existing service.
However, the establishment of the U.S. DOT Urban Partnership Agreements and Congestion Reduction Demonstration programs may prove otherwise since a sig-nificant amount of the federal grants associated with these projects will directly benefit transit agencies. But, in terms of long-term opportunities for transit (e.g., new revenue sources for capital and operating expenses) none of these projects has demonstrated that to be a reality. For example, while creating a new source of revenue may be more attractive to transit agencies since many are heavily subsi-dized, a congestion pricing project will not guarantee this revenue stream. As seen with the I-394 MnPASS project, even though the law requires 50 percent of rev-enue to be spent on transit within the corridor, current revenue generated by the tolls has not covered the cost to build, operate, and maintain the system (Howard 2005). Thus, guaranteed lump sum payments, such as those being provided as part of the U.S. DOT Urban Partnership Agreements, may be a more attractive option to address immediate needs.
The results of the Virginia case study analysis yield interesting results about transit’s response to congestion pricing projects. In comparing these two projects, there is evidence to suggest that transit agencies operating along the I-95/395 corridors have taken into account the potential opportunities made available to them to improve transit service as a result of the HOT lanes. In fact, VDRPT conducted a comprehensive analysis of transit opportunities as a result of the I-95/395 HOT lanes, but a similar study for the I-495 HOT lanes was not conducted. Recently, however, Fairfax County did begin developing a 10-year long-range bus operation plan that will take into account the two Virginia HOT lanes projects.
75
Transit Response to Congestion Pricing Opportunities
Overall, as more congestion pricing projects are implemented in the U.S., it will be important to collect data and continually monitor and evaluate the role of transit within congestion pricing projects to ensure that social equity is being addressed. The two limitations of this research center upon the availability of data. First, there was little formal evaluation data concerning existing congestion pricing systems and the impact on transit. Many of the systems had limited data, but no detailed assessment (e.g., before/after analysis) of transit operations. Second, the micro-level analysis of the two Virginia projects does not provide a complete picture of all types and flavors of congestion pricing in the U.S. However, this was an oppor-tunity to make a true apples-to-apples comparison to examine transit agency response to congestion pricing projects. Future research should include more case studies at this level of analysis.
Endnotes1 For a more detailed discussion, see Litman (2005), Small (2002), Weinstein and Sciara (2006), and Viegas (2001).
2 This should not be construed as a negative aspect of the project. The New York City metropolitan region already has the highest transit usage rate in the U.S., and any additional funding for operations and maintenance is important.
3 The description and discussion of the I-495 and I-95/395 HOT Lanes projects was developed based upon an interview with Ms. Valerie Pardo, VDOT Multimodel Liason, on July 3, 2008.
4 A more detailed description of the I-495 Capital Beltway HOT Lanes project is available at http://www.virginiahotlanes.com/beltway-project-info.asp.
5 A more detailed description of the I-95/395 HOT Lanes project is available at http://www.virginiahotlanes.com/i95-project-info.asp.
References
Fairfax County Department of Transportation. 2008. Fairfax Connector and Fairfax Metrobus Service Transit Development Plan (TDP). Public meetings presenta-tion, 29 April 2008 – 4 June 2008. http://www.fairfaxcounty.gov/fcdot/pdf/tdp/presentation_spring08.pdf.
Journal of Public Transportation, Vol. 12, No. 3, 2009
76
Giuliano, G. 1992. An assessment of the political acceptability of congestion pric-ing. Transportation 19: 335-358.
Giuliano, G. 1994. Equity and fairness considerations of congestion pricing. In Curbing gridlock: Peak-period fees to relieve traffic congestion. Washington, DC, Transportation Research Board.
Hardy, M. 2008. A multiple streams analysis of the rise of congestion pricing poli-cies and the urban partnership agreements. ITS World Congress, New York, NY.
Howard, C. 2005. Report on MnPASS I-394 HOT Lane Project. Washington State Transportation Commission.
Hultgren, L., and K. Kawada. 1999. San Diego’s Interstate 15 high-occupancy/toll lane facility using value pricing. ITE Journal.
Jones, J. D., and J. Webb. 2007. Funding new infrastructure: Virginia’s Public Pri-vate Transportation Act experience, 1995-2006. New Voices in Public Policy 1, Spring.
Kain, J. 1994. Impacts of congestion pricing on transit and carpool demand and supply. In Curbing gridlock: Peak-period fees to relieve traffic congestion. Wash-ington, D.C., Transportation Research Board.
Litman, T. 2006. London congestion pricing: Implications for other cities. Victoria, BC, Victoria Transport Policy Institute.
Littman, T. 2005. Using road pricing revenue: Economic efficiency and equity con-siderations. Victoria, BC, Victoria Transport Policy Institute.
Marx, Eric. 2008. Personal discussion with Mr. Marx, Executive Director of the Potomac and Rappohannock Transportation Commission, 9 July, Washing-ton, D.C.
Poole, R. W., and C. K. Orski. 2003. HOT networks: A new plan for congestion relief and better transit. Reason Foundation.
Rouwendal, J., and E. Verhoef. 2006. Basic economic principles of road pricing: From theory to applications. Transport Policy 13: 106-114.
77
Transit Response to Congestion Pricing Opportunities
Schrag, Z. M. 2006. The Great Society Subway: A History of the Washington Metro. Baltimore, MD, The Johns Hopkins University Press.
Schrank, D., and T. Lomax. 2005. The 2005 urban mobility report. Texas Transpor-tation Institute.
Small, K. 1992. Using the revenues from congestion pricing. Transportation Research Part A 19: 359-381.
Small, K. 2005. Unnoticed lessons from London: Road pricing and public transit. Access 26 (Spring).
The State of Colorado. 1999. An Act Concerning High Occupancy Vehicle Lanes.
U.S. Department of Transportation. 2006. Congestion pricing: A primer. Federal Highway Administration.
VDRPT. 2008. I-95/395 transit/TDM study final report. Richmond, VA, I-95/I-395 Transit/TDM Technical Advisory Committee.
Viegas, J. M. 2001. Making urban road pricing acceptable and effective: Search for quality and equity in urban mobility. Transport Policy 8: 289-294.
Weinstein, A., and G. C. Sciara. 2006. Unraveling equity in HOT lane planning: A view from practice. Journal of Planning Education and Research 26.
Zmud, J., and C. Arce. 2008. Compilation of public opinion data on tolls and road pricing. Synthesis 377. National Cooperative Highway Research Program. Washington, D.C, Transportation Research Board.
About the Author
Matthew Hardy ([email protected]) is a Principal in the transportation division of Noblis, based in Washington, D.C. He is a graduate of George Mason University in Fairfax, Virginia, with a B.S. in Urban Systems Engineering and an M.S. in Transportation Policy, Operations and Logistics. He has conducted exten-sive research in the application of ITS technologies to BRT systems and Vehicle Assist and Automation systems for transit applications and was co-author of FTA’s Characteristics of Bus Rapid Transit for Decision-Making. He is a member of the TRB committee on Vehicle Highway Automation and is currently pursuing a Ph.D. at George Mason University in the School of Public Policy.
Journal of Public Transportation, Vol. 12, No. 3, 2009
78
79
Integrating Bicycling and Public Transport in North America
Integrating Bicycling and Public Transport in North America
John Pucher, Rutgers University Ralph Buehler, Virginia Tech
Abstract
This paper provides an overview of bike-transit integration in large American and Canadian cities. It begins with an analysis of national trends in bike-and-ride pro-grams such as the provision of bike racks on buses, accommodation of bikes on rail vehicles, and bike parking at rail stations and bus stops. Most of the paper, however, is devoted to case studies of bike-transit integration in six large American cities (San Francisco, Portland, Minneapolis, Chicago, Washington, and New York) and two Canadian cities (Vancouver and Toronto). Much progress has been made over the past decade in coordinating cycling with public transport, but the demand for bike-and-ride far exceeds the supply of facilities in some cities. More funding, in particu-lar, is needed to provide more secure, sheltered bike parking at rail stations and to increase bike-carrying capacity on rail vehicles.
IntroductionCoordinating bicycling with public transport is mutually beneficial, enhancing the benefits of both modes and encouraging more bicycling as well as more public transport use (Brons et al. 2009, Givoni and Rietveld 2007, Hegger 2007, Martens 2004 and 2007, TRB 2005, U.S. DOT, 1998). Bicycling supports public transport by extending the catchment area of transit stops far beyond walking range and at much lower cost than neighborhood feeder buses and park-and-ride facilities for cars. Access to public transport helps cyclists make longer trips than possible
Journal of Public Transportation, Vol. 12, No. 3, 2009
80
by bike. Transit services also can provide convenient alternatives when cyclists encounter bad weather, difficult topography, gaps in the bikeway network, and mechanical failures.
In the past, bike-and-ride in North America was limited by low overall levels of cycling and public transport use in most cities, just the reverse of the situation in northern Europe (Bassett et al. 2008, Hegger 2007, Martens 2007, Pucher and Buehler 2008). In recent years, however, both cycling levels and public transport use have risen sharply in the U.S. and Canada, and bike-and-ride trips have been increasing as well. Indeed, in some cities it has been so successful that the demand for bike-and-ride facilities exceeds the available supply (TRB 2005, U.S. DOT 1998).
This paper describes the programs and policies currently being implemented in North America to integrate bicycling with public transport. It starts off with a brief overview of the various kinds of integration and the extent of their implementa-tion. Most of the paper, however, is devoted to case studies of bike-transit integra-tion in two large cities in Canada (Toronto and Vancouver) and six large cities in the U.S. (San Francisco, Portland, Minneapolis, Chicago, Washington, DC, and New York City). The case study analysis compares the type and extent of integration measures undertaken in the various cities, noting the strengths and weaknesses of each city’s integration policies. The paper concludes by identifying the most inno-vative and successful policies in the eight cities and offers policy recommendations for future improvements.
North American Trends in Bike-Transit IntegrationIn recent years, levels of cycling and public transport use have reached record highs in both the U.S. and Canada. Between 1995 and 2008, public transport trips rose by 38 percent in the U.S. and by 46 percent in Canada (APTA 2009a and 2009b). Similarly, levels of cycling have increased considerably since 1990. In the U.S., the total number of bike trips to work increased by 32 percent from 1990 to 2005-2007 (averaged) (U.S. Census Bureau 2009a and 2009b). Over the shorter period 1996 to 2006, the number of bike trips to work in Canada rose by an even larger 42 percent (Statistics Canada 2009).
While rising public transport use and increased cycling have provided the ratio-nale for more bike-transit integration, federal funding in the U.S. has provided the necessary financing for a wide range of projects implemented in recent years at the
81
Integrating Bicycling and Public Transport in North America
state and local government levels (Clarke 2003, Thunderhead Alliance 2007, TRB 2005, U.S. DOT 1998). Indeed, the federal government finances some categories of bike-transit integration projects with an especially high 95 percent federal share. There is no federal funding for urban transport in Canada, but provincial and local governments have provided large increases in funding for public transport and bicycling in recent years, including projects aimed at better integration (CUTA 2008, Pucher and Buehler 2006, Transport Canada 2006).
As documented in this article, virtually every large city in the U.S. and Canada has undertaken a range of measures to promote bike-and-ride. There are five main categories of measures to promote bike-transit integration:
provision of bike parking at rail stations and bus stops, with different degrees 1. of shelter and security
multi-functional bike stations providing not only parking but also a range 2. of services such as bike rentals, repairs, parts and accessories, bike washing, showers and lockers, and touring advice
bike racks on buses, usually exterior, but occasionally interior storage3.
bikes on board vehicles, usually rail vehicles, sometimes with special bike 4. racks, hooks, or even bike cars on trains
bike paths, lanes, and on-street routes that lead to public transport sta-5. tions and stops, thus facilitating the bike’s role as feeders and collectors for public transport
Extent of Bike-and-Ride Facilities in North AmericaThe only available national statistics on bike parking at public transport stops are from recent surveys of 272 American and Canadian transit systems by the American Public Transportation Association (APTA 2006 and 2008a). In the U.S., the supply of bike parking spaces in 2008 was 24,178 at rail stations, 9,005 at bus stops, and 176 at ferry terminals. For the same year, Canadian systems reported 2,892 bike parking spaces at rail stations and 481 at bus stops. Between 2006 and 2008, the supply of bike parking increased by 67 percent in Canada and 26 percent in the U.S. (APTA 2006 and 2008a).
Unattended bike lockers are the main form of secure bike parking at North Ameri-can public transport stops. Of the 56 large American and Canadian transit systems surveyed by the Transportation Research Board (2005), 14 systems provided bike
Journal of Public Transportation, Vol. 12, No. 3, 2009
82
lockers at some of their rail and bus stops, but the actual number of lockers was not reported. The same TRB survey reported eight staffed bike parking stations in 2005, mainly on the West Coast. A few more bike stations have opened since then (Litman 2009).
By far the most important form of bike-transit integration in North America is bike racks on buses. That is not surprising since 60 percent of all public transport trips in the U.S. are by bus (APTA 2009b). Bike racks are inexpensive to install, easy to operate, and do not take up space on the vehicles themselves (TRB 2005). The 2005 TRB survey found that systems throughout the U.S. and Canada provide bike racks on buses and that most systems have eliminated fees they had previously charged for rack use. As shown in Figure 1, the percentage of buses with bike racks almost tripled in the U.S. in only eight years, from 27 percent in 2000 to 71 percent in 2008 (APTA 2008b and 2009a).
Source: APTA, Public Transportation Factbook 2008, Table 23
Figure 1. Trend in Percentage of Buses with Exterior Bicycle Racks in the U.S., 2000-2008
Another important form of bike-transit integration is the permission to take bikes on board public transport vehicles, since that enables cyclists to ride their bikes to and from public transport stops at both ends of their trips. Few public transport systems permit bikes to be taken on board buses unless they are compact, folding bikes, but most systems permit bikes on light rail, metro, and suburban rail trains, except during
83
Integrating Bicycling and Public Transport in North America
peak hour periods when crowding makes this infeasible (TRB 2005). Moreover, an increasing number of public transport systems are providing special accommodations for bikes on trains, such as bike racks, bike hooks, special bike holding areas near the doors, and even special bike cars—although rarely (APTA 2008b; TRB 2005).
The last aspect of bike-transit integration is the coordination of bike routes with public transport stops. No national statistics are available on the extent of imple-mentation, and it would be hard to quantify at any rate. Nevertheless, the eight case studies qualitatively assess this aspect of bike-transit integration in each of the cities.
Case Studies of Bike-Transit IntegrationAll eight of the case study cities are large, but they vary considerably in metropoli-tan area population, ranging from 2.2 million in Portland, Oregon to 18.2 million in New York City. The cities also vary widely in their geographic locations, climate, and topography. Most important for this study, they vary greatly in the share of trips covered by bicycling and public transport, as shown in Figures 2 and 3.
Sources: U.S. Census Bureau (2009b) and Statistics Canada (2009)
Figure 2. Public Transport Share of Work Trips in U.S. and Canadian Cities and Metropolitan Areas, 2006/2007
Journal of Public Transportation, Vol. 12, No. 3, 2009
84
Sources: U.S. Census Bureau (2009b) and Statistics Canada (2009)
Figure 3. Bicycling Share of Work Trips in U.S. and Canadian Cities
and Metropolitan Areas, 2006/2007
In 2006, public transport shares of work trips for central city residents ranged from only 11 percent in Portland to 55 percent in New York (Figure 2). Public transport trip shares for metropolitan areas ranged from 4 percent in Minneapolis to 30 percent in New York. Without exception, public transport use is higher in all eight central cities than in their suburbs.
Levels of cycling also vary greatly among the eight cities (Figure 3). Portland (3.9%) and Minneapolis (3.8%) had the highest bike mode shares of work trips in 2006, but Vancouver (3.0%) and San Francisco (2.8%) were not far behind. By com-parison, cycling to work in New York (0.7%) and Chicago (1.1%) is rare. Similar to levels of public transport use, bicycling is much higher in central cities than in the suburbs.
85
Integrating Bicycling and Public Transport in North America
There are no comparable statistics on levels of bike-and-ride in each of these cities, since the most recent American and Canadian national travel surveys report only the main mode of transport for the work trip. Figures 2 and 3 provide useful back-ground, however, by portraying the overall levels of cycling and public transport in the eight cities and their corresponding metropolitan areas. In general, the higher the levels of both cycling and public transport use, the greater the potential for bike-transit coordination (Hegger 2007, Rietveld 2000, Martens 2004 and 2007).
Variations in Bike-Transit IntegrationEfforts to integrate cycling with public transport vary greatly among the eight case studies. New York City, for example, has done little to promote bike-and-ride, while San Francisco, Vancouver, and Portland have implemented the entire gamut of integration measures. The following section highlights the most important aspects of bike-and-ride policies in each city, noting in particular the strengths and weaknesses of current policies.
Unless otherwise indicated, the information for these case studies was obtained by the authors directly from bicycling planners, public transport systems, metropoli-tan planning organizations, city transport departments, and non-governmental cycling and sustainable transport organizations in each metropolitan area. The same panel of transit and cycling experts also reviewed the case studies of their cities at several stages to check for accuracy, consistency, and completeness.
San FranciscoThe San Francisco Bay Area has been a leader in bike-transit integration efforts in North America. Bay Area Rapid Transit (BART) provides bike parking at almost all 43 stations, with a total of 4,313 bike parking spaces in 2009, including 1,010 in secure bike lockers. To increase convenience and flexibility, BART has been intro-ducing electronic bike lockers (294 as of 2009), which are available on a first-come, first-served basis and do not require advance subscriptions. Caltrain, the suburban rail line from San Francisco south to Palo Alto and San Jose, provides bike parking at all 32 stations, with a total of 1,100 bike lockers and 400 bike racks.
The San Francisco Bay Area had five of the ten bike stations in the U.S. in 2009: 226 bike parking spaces at two Caltrain stations and 433 spaces at three BART stations. Utilization rates of the bike stations vary widely, from over 100 percent at the Berkeley BART station to only 11 percent at the Palo Alto Caltrain station. BART will soon triple the size of the Berkeley bike station and move it above ground to increase accessibility.
Journal of Public Transportation, Vol. 12, No. 3, 2009
86
Source: Bay Area Rapid Transit
Figure 4. Electronic Bike Lockers at North Berkeley BART Station
(Insert shows smart card used to access lockers)
Source: Bay Area Rapid Transit
Figure 5. Bike Station at Berkeley BART station is filled to overflowing but will soon be tripled in size to
accommodate high demand for bike and ride.
87
Integrating Bicycling and Public Transport in North America
Cyclists prefer to take bikes on board, however. A 2008 survey found that 72 per-cent of bike-and-ride passengers carried their bikes with them, compared to only 28 percent who parked them at BART stations. Bikes are allowed on BART trains except during peak hours in the peak direction. Although Caltrain has no time restrictions, cyclists are often denied boarding on rush hour trains because all bike spaces are already occupied. Neither BART nor Caltrain charge a fee for bringing bikes on board. Moreover, Caltrain’s lead cars provide special accommodations for 16-32 bikes, depending on time of day and direction of travel. Most of the numerous ferry lines in the Bay Area also permit bikes on board with no extra fee. Folding bikes are allowed on BART and Caltrain at all times, but are not permitted on board San Francisco’s MUNI buses, streetcars, cable cars, and light rail vehicles. Complementing bike access to BART and Caltrain services, virtually all buses of all public transport systems in the San Francisco Bay Area are equipped with bike racks, free of charge to cyclists.
Due to the extensive and fine-grained network of bus and rail routes in San Fran-cisco, bike routes often lead to public transport stops, even without any explicit coordination. Outside of San Francisco, where public transport routes and sta-tions are farther apart, many communities make an explicit effort to coordinate bike routes with key stops.
Overall, bike-transit integration efforts in the San Francisco Bay Area have been successful. The percentage of public transport trips combined with cycling has more than tripled since 1990. Nevertheless, several problems remain. For example, it is difficult for cyclists to get across the San Francisco Bay during rush hours, since bikes are prohibited from BART trains in peak directions and not permitted on the Bay Bridge. Similarly, Caltrain has problems accommodating bikes on board in the peak hour and often denies boarding to cyclists.
PortlandBike-and-ride in Portland mainly involves bikes on transit vehicles. TriMet, Port-land’s public transport system, estimates that 10 times more bikes are taken on their LRT vehicles than parked at LRT stations (2,100 vs. 200 per weekday). There are no fees, no permit requirements, and no time of day or directional restrictions for taking bikes on LRT vehicles. Every train has a low-floor car especially designed to facilitate bike access, with waiting areas and four bike hooks located near the doors. But passengers without bikes have priority to board crowded trains. All buses in the Portland area have bike racks, another inducement for cyclists to ride with their bikes instead of parking them.
Journal of Public Transportation, Vol. 12, No. 3, 2009
88
By comparison, Portland does not provide much bike parking at train and bus stops. In 2009, there were a total of 670 bike parking spaces at TriMet LRT stops and transit centers (major transfer hubs for several bus or LRT lines). Of those, almost half were bike lockers. In addition, there were city-owned bike lockers at 15 locations in downtown Portland, most of which were near bus or rail services. Portland does not have any bike stations, which is surprising given its high bike mode share and wide range of other pro-bike policies and programs. Bicycling planners and public transport officials plan to improve bike parking at transit stops by installing 196 bike lockers and 168 bike racks at LRT extensions.
Portland cyclists prefer taking their bikes on board transit vehicles. A survey by TriMet indicated that 76 percent of cyclists would not be willing to park their bikes at a transit stop even if there were sheltered and secure bike parking available. The advantage of taking bikes on buses or rail vehicles is that bikes can then be used at both ends of the transit trip. It also reduces the risk of bike theft and vandalism.
Portland carefully and explicitly coordinates its bikeway network with its public transport network. Bike routes are designed to facilitate access to public transport stops. Most transit centers are served by multiple bikeways. Moreover, city plan-ners give special consideration to enhancing bike access to transit stops in outlying areas too far away from the city center for most people to cover by bike alone.
VancouverMetro Vancouver’s unique advantage for bike transit integration is TransLink, the fully integrated, multi-modal regional transportation authority. Unlike the other case studies, public transport, major roadways, and bicycling in Vancouver are all handled within the same agency. The coordination of cycling and public transport is obvious and natural in such a multi-modal agency, as reflected in TransLink’s plans, funding, construction projects, vehicle procurement, and operating proce-dures. Over the past 10 years, TransLink has spent more than $12 million specifi-cally on bike-transit integration.
As in the San Francisco and Portland areas, all buses in Metro Vancouver are equipped with bike racks. Similar to San Francisco’s BART, bikes are allowed on Vancouver’s SkyTrain except during peak hours in the peak direction due to prob-lems of overcrowding. Until recently, there were no special accommodations for bikes on SkyTrains, but all future vehicles will provide a special area for bikes in the rear of each car with a leaning rail and fold-up seats. Bikes are allowed at all times on West Coast Express trains for a $0.50 charge. SeaBus ferries permit bikes on
89
Integrating Bicycling and Public Transport in North America
board at all times without charge. Almost all of TransLink’s rail and ferry services are fully accessible through elevators, ramps or level boarding, thus facilitating bike-and-ride.
Source: TransLink
Figure 6. Easy Access for Bikes on SkyTrain in Vancouver
There are bike racks at all SkyTrain and West Coast Express rail stations as well as park-and-ride lots and transit nodes with interchanges of several bus or rail lines. In 2008, Vancouver had a total of 1,060 parking spaces at transit stops: 660 spaces in racks and 400 secure bike lockers. TransLink plans to increase the overall supply of bike parking at transit stops in the coming years, with a special focus on improv-ing the quality of bike parking, especially secure short-term bike parking.
TransLink explicitly coordinates bike routes with public transport. For example, the construction of three new SkyTrain lines included traffic-protected, parallel bike routes to foster bicyclist access to public transport. Another aspect of Trans-Link’s multi-modalism is the focused promotion of cycling in central corridors where bus and rail vehicles are the most crowded, and where cycling has the potential to divert some of the overload and reduce crowding. That coordination
Journal of Public Transportation, Vol. 12, No. 3, 2009
90
of demand and supply between the two modes is rare and emphasizes the advan-tages of multi-modal agencies such as TransLink.
MinneapolisAlthough Minneapolis is, by far, the coldest of the eight cities, it has the second highest bike share of work trips, almost as high as Portland’s (3.8% vs. 3.9%). Public transport’s share of work trips is slightly higher in Minneapolis than in Portland (13.4% vs. 11.2%), but much lower than in any of the other cities (Figure 2).
Metro Transit had 497 bike parking spaces at its light rail and bus stops in 2007: 271 spaces in bike racks and 226 bike lockers. Minneapolis has a staffed bike sta-tion, the Midtown Bike Center, with 100 bike parking spaces, repairs, rentals, and a café. It is only a block from the Chicago and Lake Streets transit hub, which serves two of the city’s busiest bus lines.
Source: Metro Transit
Figure 7. All Buses in Minneapolis have Bike Racks
All Metro Transit and suburban transit buses are equipped with exterior bike racks, and the city has five stationary bike racks for first-time users to practice loading their bikes. Every light rail vehicle has interior vertical racks that accommodate four bikes. Bike-and-ride has become increasingly popular in Minneapolis. Metro Transit surveys in spring 2007 and fall 2008 found a doubling in the number of bicycles transported on bus racks and a 41 percent increase in bikes on light rail.
91
Integrating Bicycling and Public Transport in North America
There is no explicit policy of coordinating bike routes and transit stops in Minne-apolis, and City officials emphasize the need to improve cycling facilities feeding into public transport stops.
Source: Metro Transit
Figure 8. Vertical Bike Racks on Every Light Rail Vehicle in Minneapolis
ChicagoWith the second largest transit system in the U.S., Chicago has made impressive efforts to integrate cycling with public transport. Its special distinction lies in the innovative provision of bike parking at rail stations, tailoring the design of parking facilities to each station’s particular situation. With 6,420 parking spaces at its rail
Journal of Public Transportation, Vol. 12, No. 3, 2009
92
stations, Chicago has about the same amount of bike-and-ride parking as the San Francisco Bay Area and far more than other cities in North America.
There are 2,153 bike parking spaces at 131 of the 143 CTA subway and elevated rail stations and 4,267 spaces at 50 of the 76 Metra suburban rail stations. Moreover, indoor or sheltered parking is available at 83 CTA stations, more than any other transit system in North America. The specific location of bike racks inside the sta-tions provides both weather protection and greater security, since they are usually placed within easy sight of station attendants and other passengers. Chicago is currently installing additional sheltered bike parking for 382 bikes at four CTA sta-tions, and the city has funding to install bike shelters for 250 more bikes in 2010.
Source: Chicago Transit Authority
Figure 9. Indoor Bike Parking on Concourse of CTA Rail Station in Chicago
The largest bike station in the U.S. is located in Chicago’s Millennium Park, imme-diately above the terminal station for two of Chicago’s suburban rail lines. The bike station is easily accessible from downtown Chicago and the 18-mile Lakefront Trail. It provides secure, indoor parking for 300 bikes as well as convenient lockers, showers and towel service, bike rentals, bike repairs, and guided bicycling tours.
93
Integrating Bicycling and Public Transport in North America
All of Chicago’s buses have bike racks, including CTA buses and PACE suburban buses. Bikes are permitted on CTA and Metra trains except during weekday rush hours. As in most of the other cities, no fees or permits are required for the use of bike racks on buses or for bringing bikes on trains.
The biggest challenge to bike-transit integration in Chicago is the difficult access to train platforms. Because most of the rail lines are so old, only 54 percent of CTA stations and 68 percent of Metra stations are ADA accessible. Thus, cyclists are often forced to carry their bikes up long flights of stairs. Few stations have eleva-tors, and cyclists are not permitted to use escalators.
Chicago DOT, transit agencies, and the cycling community are aware of these problems and have made improvements in bike-transit integration a top prior-ity. Chicago’s Bike Plan 2015 sets goals of further expanding and improving bike parking inside and outside of rail stations, remodeling stations to make them more accessible to bikes, providing more park-and-ride facilities, and establishing a second bike station with better transit connections.
TorontoWith more than 15,000 post-and-ring bike racks throughout the city, Toronto has more bike parking than any other city in North America. That includes bike park-ing at almost all rail stations. In 2008, there were 1,192 short-term spaces in bike racks at Toronto Transit Commission (TTC) subway stations and 579 short-term spaces in racks at GO Transit suburban rail stations.
Yet there is a severe shortage of secure parking, with only 114 bike lockers in the entire transit network. Consequently, Toronto plans on greatly expanding the supply of secure parking in 2009 and 2010 through installation of more bike lockers and completion of a new bike station at Union Station, the main transit hub in downtown Toronto, providing bus, streetcar, subway, and suburban rail connections. The bike station will provide secure, sheltered parking for 200 bikes. Construction of an even larger bike station at City Hall is planned to begin in 2010. That facility will be close to several bus and streetcar lines. The GO Transit subur-ban rail system is improving its bike parking by expanding sheltered parking to all stations by the winter of 2009-2010.
As in most cities with high levels of rail transit use, bikes cannot be taken on TTC subways and streetcars during weekday peak hours. Even when permitted, there are no special provisions for bikes on TTC subway cars. Similarly, bikes are not allowed on any GO Transit trains headed toward or leaving Union Station in
Journal of Public Transportation, Vol. 12, No. 3, 2009
94
the peak periods. Folding bikes are permitted on all public transport vehicles at all times. Bike access to rail transit is limited by the lack of elevators in most sub-way stations. Only 41 percent of TTC subway stations are wheelchair accessible, while 75 percent of GO Transit stations are accessible, either through elevators or ramps.
Toronto is making rapid progress equipping its buses with bike racks, which can be used at any time, even during peak periods. In 2008, only 55 percent of TTC buses had bike racks, but all new buses have racks, and every month about 40 older buses are retrofitted with racks. By the end of 2010, all TTC and GO Transit buses will have bike racks, thus facilitating bike-and-ride throughout the region.
There is almost no explicit coordination of bike routes with transit routes and sta-tion stops. The many transit stations and fine-grained street network in much of the central city facilitate bike access to TTC stations. In suburban areas, however, many streets are circuitous and do not connect across arterials, making it difficult for cyclists to avoid major arterials while en route to a transit station.
WashingtonBike parking is available at almost all of Washington’s 86 Metrorail subway sta-tions, with a total of 1,800 bike racks and 1,300 bike lockers. The parking facilities are popular, with usage rates at most stations ranging from 50-100 percent. In October 2009, a new bike station with spaces for 150 bikes will open next to Union Station, providing convenient connections to Metrorail as well as suburban trains leaving from Union Station. The bike station will also offer bike rentals, repairs, and accessories as well as storage lockers and changing rooms.
In 2008, a new bike-sharing program began in Washington, similar in technology to the Velib system in Paris, but on a much smaller scale: only 120 bikes compared to over 20,000 bikes in Paris. It facilitates bike-and-ride because 8 of the 10 bike-sharing docking stations are at Metrorail stops. The short-term rental bikes can be used to get to and from Metrorail stations, thus serving as feeders and distributors for transit.
Bikes are allowed on Metrorail trains except during morning and afternoon rush hours on weekdays. All 86 Metrorail stations have elevators (271 in total) and are ADA accessible, which facilitates access to platforms for cyclists as well, who are, in fact, required to use the elevators and are not permitted on escalators. In con-trast to Metrorail, MARC suburban trains never allow full-size bikes on board, and VRE allows bikes only on certain trains. Both rail systems allow folding bikes at any
95
Integrating Bicycling and Public Transport in North America
time. All 1,450 WMATA buses have bike racks, but some buses run by suburban agencies do not.
In theory, bike plans for the Washington area establish the goal of coordinating bike routes with transit routes, but, in fact, nothing has really been accomplished in this area except by accident.
New York CityNew York’s transit systems have done little to promote bike-transit integration, far less than any other city in this study. The Metropolitan Transportation Authority (MTA) does not provide bike parking of any kind at the city’s 467 subway stations, so the only option for cyclists is to park on nearby sidewalks. The MTA’s suburban railroads, the Long Island Railroad (LIRR) and Metro-North Railroad (MNR), offer bike parking at some of their stations, but MTA has no information on the total number of spaces (MTA 2009).
Compounding the problem of insufficient bike parking along the many subway and suburban rail lines of the MTA, there is no secure bike parking at any public transport terminals in Manhattan. Train, bus, and ferry terminals do not even offer short-term parking in bike racks. Thus, cyclists must seek out the occasional bike rack on sidewalks within a few blocks of the terminals or lock their bikes to traffic signposts, lampposts, or other stationary objects.
NYC subways are unique in permitting bikes on board trains at all times, but it is difficult to get bikes to the platforms. Only 16 percent of New York’s subway sta-tions are ADA accessible via elevators or ramps. At the remaining 84 percent of stations, cyclists must carry their bikes up and down long flights of stairs, as they are prohibited from using escalators in stations where they are available. Bikes are allowed on the MTA’s two suburban railroads (MNR and LIRR) except during peak hours in the peak direction, but cyclists must register in advance and purchase $5 lifetime permits. Folding bikes are allowed at all times.
Bike-bus integration is almost non-existent in New York City. Not a single bus in the MTA’s fleet of 5,929 buses has a bike rack. That contrasts sharply with 100 per-cent of buses equipped with bike racks in most of the other case study cities. Only since spring 2008 have folding bikes been allowed on most MTA buses.
There is no explicit effort to coordinate bike routes with transit routes in New York City. That is not a severe problem in most of the city because the transit network
Journal of Public Transportation, Vol. 12, No. 3, 2009
96
is so dense that most neighborhoods are served by a nearby subway or bus line. In the suburbs and the outermost portions of the city, however, the complete lack of bike-transit route integration is a serious shortcoming. Precisely in those lower density areas where cycling would provide an ideal feeder mode to more distant transit stops, bikeways are almost exclusively recreational paths that do not con-nect to practical destinations such as transit stations.
Summary of Case StudiesMost of the case study cities have greatly improved the coordination of bicycling and public transport in recent years. They have increased bike parking at transit stops and better accommodated passengers wanting to take their bikes with them on buses and rail vehicles. Only a few transit systems have measured the actual extent of bike-and-ride, but the available evidence is encouraging. In Washington, DC, for example, the number of bicyclists riding on Metrorail increased by 60 percent between 2002 and 2007. At some stations, cyclists accounted for up to four percent of all passenger boardings. In Minneapolis, Metro Transit carries over 250,000 bicycles annually and reports a doubling of bikes on buses between spring 2007 and fall 2008. Roughly four percent of Portland MAX light rail passengers carry their bikes onto the vehicles with them. In the San Francisco Bay Area, the share of passengers accessing BART stations by bike rose from 2.5 percent in 1998 to 3.5 percent in 2008, with an average of 10,920 bike-and-ride trips per day.
As shown in Table 1, there is considerable variation among the eight case stud-ies. The San Francisco Bay Area, for example, provides the full gamut of bike-integration measures and has been at the vanguard of innovations to promote bike-and-ride. By comparison, New York’s transit systems have made few provi-sions to accommodate cyclists, lagging behind the other case study cities in both the quantity and quality of bike integration measures. All eight of the cities have plans to further improve bike-transit integration. Thus, it seems certain that the promising trends of recent years will continue.
97
Integrating Bicycling and Public Transport in North America
Tabl
e 1.
Ove
rvie
w o
f Bik
e-Tr
ansi
t Int
egra
tion
Mea
sure
s in
8 L
arge
Am
eric
an a
nd C
anad
ian
Citi
es
Journal of Public Transportation, Vol. 12, No. 3, 2009
98
Tabl
e 1.
Ove
rvie
w o
f Bik
e-Tr
ansi
t Int
egra
tion
Mea
sure
s in
8 L
arge
Am
eric
an a
nd C
anad
ian
Citi
es (c
ont’d
.)
99
Integrating Bicycling and Public Transport in North America
Tabl
e 1.
Ove
rvie
w o
f Bik
e-Tr
ansi
t Int
egra
tion
Mea
sure
s in
8 L
arge
Am
eric
an a
nd C
anad
ian
Citi
es (c
ont’d
.)
Journal of Public Transportation, Vol. 12, No. 3, 2009
100
Tabl
e 1.
Ove
rvie
w o
f Bik
e-Tr
ansi
t Int
egra
tion
Mea
sure
s in
8 L
arge
Am
eric
an a
nd C
anad
ian
Citi
es (c
ont’d
.)
101
Integrating Bicycling and Public Transport in North America
Conclusions and Policy ImplicationsNorth American cities have been making impressive progress integrating cycling with public transport. Since 2000, the percentage of buses with bike racks has almost tripled. Bike-rail integration has also advanced. Most light rail, metro, and suburban rail systems permit bikes on their rail vehicles except during peak hours, and they increasingly provide special accommodations for cyclists such as bike hooks, racks, and rails in special areas of rail cars. Complementing provisions for bikes on transit vehicles, bike parking at transit stops has been vastly expanded over the past 10 years, with large increases in the number of racks as well as improvements in the convenience, security, and shelter of bike parking.
While cycling and public transport have considerable synergies, there are some inevitable conflicts. Surveys in some cities indicate that cyclists prefer to take their bikes with them on rail vehicles so they can use them at both ends of the trip. That can cause problems during peak hours, however, when all available capacity is needed to accommodate passengers and there is no extra room for bikes. Taking bikes on buses is much less of a problem since bike racks are external and do not reduce passenger-carrying capacity. But even bike racks can be filled to capacity during the peak, forcing cyclists to wait for later buses.
Paradoxically, bike-and-ride can become problematic where it is most successful. Capacity problems are most likely to arise in cities with well-used public transport and high levels of cycling. That is why the European approach to bike-and-ride has favored the provision of ample, sheltered, secure bike parking at transit stops instead of accommodating bikes on transit vehicles. Similarly, in North Ameri-can cities with overcrowding of rail vehicles during rush hours, the focus should probably be on providing improved bike parking at rail stations. Not only is more parking needed, but it should be of higher quality, with more sheltered and secure spaces. Major transit terminals should include multi-service bike stations, such as those in northern Europe. Similar to the concept of “complete streets,” an appro-priate goal of transit systems in North America should be to provide “complete stations,” which fully accommodate the needs of cyclists. That includes making rail platforms more accessible to cyclists, which would also improve accessibility for persons with disabilities.
Such bike-and-ride provisions cost money, but they are much cheaper than park-and-ride facilities for motorists (TRB 2005). Transit systems should shift their focus from park-and-ride to bike-and-ride, which is more cost-effective as well as more environmentally friendly. To encourage that shift, federal, state, and local
Journal of Public Transportation, Vol. 12, No. 3, 2009
102
government agencies should vastly expand funding for further improvements in bike-and-ride measures.
Acknowledgments
The research project on which this paper is based was funded by a grant from the Research and Innovative Technology Administration of the U.S. Department of Transportation. John Neff (American Public Transportation Association), Andy Clarke (League of American Bicyclists) and Gabe Rousseau (U.S. Department of Transportation) provided valuable information and advice on all aspects of the paper. The authors are deeply indebted to the many bicycling experts and transit planners who provided us with detailed information and feedback for the eight case study cities. We list them here grouped by city: San Francisco (Nick Carr, Deirdre Weinberg, Heath Maddox, Laura Timoth, Sarah Syed, Dave Snyder, Leah Shahum, Andy Thornley); Portland (Mia Burke, Roger Geller, Colin Maher); Van-couver (Gavin Davidson); Minneapolis (Shaun Murphy, John Siqveland, James Andrew, Barb Thoman, Tony Hull, Joan Pasiuk); Chicago (Randy Neufeld, Daniel Thomas, Ben Gomberg, Chris Gagnon); Toronto (Dan Egan, Adam Giambrone, Sean Wheldrake, Jennifer Niece, Jana Neumann); Washington (Jim Sebastian, Eric Gilliland, Christine Haldeman, Paul DiMaio); and New York (John Kaehny, Charles Komanoff, Noah Budnick, Caroline Samponaro, Joseph Chan, Ryan Russo, and Joshua Benson).
References
APTA. 2006. 2006 Transit Infrastructure Database. Washington: American Public Transportation Association.
APTA. 2008a. 2008 Transit Infrastructure Database. Washington: American Public Transportation Association.
APTA. 2008b. 2008 Public Transportation Vehicle Database. Washington: Ameri-can Public Transportation Association.
APTA. 2009a. 2008 Public Transportation Fact Book. Washington: American Public Transportation Association.
APTA. 2009b. Transit Statistics. Washington, DC: American Public Transportation Association. Accessible at: http://www.apta.com/research/stats/
103
Integrating Bicycling and Public Transport in North America
Bassett, D., J. Pucher, R. Buehler, D. Thompson, and S. Crouter. 2008 . Walking, cycling, and obesity rates in Europe, North America, and Australia. Journal of Physical Activity and Health 5: 795-814.
Brons, M., M. Givoni, and P. Rietvield. 2009. Access to railway stations and its potential in increasing rail use. Transportation Research A 43: 136-149.
Clarke, A. 2003. Green modes and U.S. transport policy: TEA-21. In Tolley, R. (ed.), Sustainable Transport (Cambridge, UK: Woodhead Publishing): 433-440.
CUTA. 2008. Canadian Urban Transit Fact Book. Toronto: Canadian Urban Transit Assocation.
Givoni, M., and P. Rietveld. 2007. The access journal to the railway station and its role in passengers’ satisfaction with rail travel. Transport Policy 14: 357-365.
Hegger, R. 2007. Public transport and cycling: living apart or together? Public Transport International 2: 38-41.
Litman, T. 2009. Bicycle parking, storage, and changing facilities. Accessible at: http://www.vtpi.org/tdm/tdm85.htm.
Martens, K. 2004. The bicycle as a feedering mode: Experiences from three Euro-pean countries. Transportation Research Part D 9: 281-294.
Martens, K. 2007. Promoting bike and ride: The Dutch experience. Transportation Research Part A 41: 326-338.
MTA. 2008. MTA and bikes. New York: Metropolitan Transportation Authority. Accessible at: http://www.mta.info/bike/
Pucher, J., and R. Buehler, R. 2006. Why Canadians cycle more than Americans: A comparative analysis of bicycling trends and policies. Transport Policy 13: 265-279.
Pucher, J., and R. Buehler. 2008. Making cycling irresistible: Lessons from the Neth-erlands, Denmark, and Germany. Transport Reviews 28(4): 495-528.
Statistics Canada. 2009. Employed labour force by means of transportation. Ottawa, Canada: Statistics Canada. Accessible at: http://www12.statcan.ca/english/census06/data/highlights/POW/Table603.cfm?GH=4&Lang=E&O=A&SC=1&SO=99&T=603.
TRB. 2005. Integration of bicycles and transit. TCRP Synthesis Report 62. Washing-ton, DC: Transportation Research Board, National Research Council.
Journal of Public Transportation, Vol. 12, No. 3, 2009
104
Transport Canada. 2003. Sustainable development strategy, 2004-2006. Ottawa, Canada: Transport Canada.
U.S. Census Bureau. 2009a. American fact finder: 1990 Decennial Census, Journey to Work. Washington, DC: U.S. Department of Commerce.Accessible at: http://factfinder.census.gov.
U.S. Census Bureau. 2009b. American fact finder: 2007 American Community Sur-vey, Journey to Work. Washington, DC: U.S. Department of Commerce. Acces-sible at: http://factfinder.census.gov.
U.S. DOT. 1998. Bicycles and transit: A partnership that works. Washington, DC: U.S. Department of Transportation, Federal Transit Administration.
U.S. DOT. 2004. National bicycling and walking study: Ten year status report. Wash-ington, DC: U.S. Department of Transportation, Federal Highway Administra-tion.
U.S. DOT. 2007. Bicycle parking and storage. Washington, DC: U.S. Department of Transportation, Federal Highway Administration. Accessible at: http://www.tfhrc.gov/safety/pedbike/pubs/05085/chapt17.htm.
About the Authors
John Pucher ([email protected]) is a Professor in the Bloustein School of Planning and Public Policy at Rutgers University in New Brunswick, New Jersey. He specializes in comparative research on transport systems, travel behavior, and public policies in the United States, Canada, and Europe. Over the past 12 years, his research has focused on walking and cycling and how public policies could be improved to encourage these most sustainable of all modes of transport. Cur-rently, he is principal investigator of a research project for the U.S. Department of Transportation examining bicycling trends and policies in large American cities.
Ralph Buehler ([email protected]) is an Assistant Professor in the Urban Affairs and Planning Program at Virginia Tech’s Alexandria Center. His research seeks to disentangle how international differences in travel behavior are shaped by public policies, spatial development patterns, and demographic and socioeconomic fac-tors. The main goal is to determine what countries can learn from each other to improve the sustainability of their urban transportation systems. Together with Pucher, he is co-principal investigator of a research project for the U.S. Department of Transportation examining bicycling trends and policies in large American cities.
105
The Concept of a Regional Maintenance Center
The Concept of a Regional Maintenance Center
Mario G. Beruvides, James L. Simonton, Natalie M. Waters, Ean Ng, Siva Chaivichitmalakul, Cheng-Chu Chiu-Wei, Pelin Z. Altintas, and Phil Nash
Texas Tech University
Luis Barroso, Instituto Tecnológico de Monterrey—San Luis Potosí Paul Moon, Texas Department of Transportation
Abstract
Key contributors to address maintenance concerns for rural transit systems are an aging fleet, poor maintenance practices, and a lack of technical expertise. This lack of local maintenance expertise is especially severe in rural areas. This paper examines the general requirements and maintenance service approach for a Regional Main-tenance Center model in rural transportation systems. Among other findings of this study, it was determined that Regional Maintenance Centers, with a training center for mechanics and drivers, could improve vehicle reliability, increase vehicle longevity, and improve service to transit clientele. Also determined was that a generalized “one-size-fits-all” regional maintenance program could actually be counter-productive. Regional Maintenance Centers must be designed and located so potential use by rural transit service providers is maximized in order to provide superior serviceability and quality customer service.
IntroductionThis article starts with a brief literature review of public transportation in rural areas and continues with current approaches to rural transit vehicle maintenance.
Journal of Public Transportation, Vol. 12, No. 3, 2009
106
The State of Illinois Regional Maintenance Center (RMC) model describes and illustrates a practical application of the RMC concept. Finally, the Regional Main-tenance Center model is detailed with recommendations on minimum specifi-cations, requirements, and service features, along with conclusions. The major benefit of this work is to provide an actual framework for creating an RMC and increase the base knowledge of rural transportation maintenance issues.
Public Transportation in Rural AmericaTransportation services for rural areas are composed of varying programs such as rural transit, elderly and disabled special services, human services, and intercity bus and rail that service rural passengers. In rural counties across the nation, there is an approximate 50 percent availability of public transit, which totals about 1,200 systems (Stommes and Brown 2002). These federally-funded transit systems commonly fall under Section 5310 (Elderly and Disabled Programs), Section 5311 (Rural Areas Program), and Rural Transportation Assistance Program (RTAP) (Federal Transit Administration 2007).
The State of Texas has a population of approximately 23 million people and is expecting a 64 percent increase over the next 25 years (Heiligenstein et al. 2006). Two goals of the Strategic Plan for 2007-2011 for Texas Department of Trans-portation (TxDOT) are to reduce congestion and increase transportation asset values (Heiligenstein et al. 2006). Accomplishment of these goals is connected to TxDOT strategies to empower local and regional leaders to resolve their respec-tive transportation problems. The majority of Texas population is concentrated in metropolitan areas such as Austin, Houston, Dallas-Fort Worth, and San Anto-nio. This leaves a vast number of rural areas in the state where the remaining 17 percent of the population lives. Many of these rural transit systems operate in remote areas with difficult road conditions. Long travel times between destina-tions and poor transit conditions create an additional burden on these vehicles and organizations. Vehicles in these areas are more difficult to maintain and often need replacing more frequently than those in urban settings (Turnbull, Dresser, and Higgins 1999).
Various Approaches to Vehicle Transit MaintenanceCurrently, rural transit service providers obtain maintenance for their vehicles through two major methods: in-house or third-party maintenance contracting.
107
The Concept of a Regional Maintenance Center
In-house maintenance performed by rural transit providers requires the service provider to maintain a technical staff that can service various vehicles types and keep an extensive and potentially expensive parts inventory. The crucial issues in maintaining a successful in-house maintenance program are a good inventory control system, determining the optimal location and design, shaping operating procedures for the maintenance facility, and the realization that maintenance is more than reorganizing or good housekeeping.
Rural transit providers can seek third-party maintenance contracting through approved and selected DOT contractors. The key to success in contracting maintenance to service providers depends mainly on the selection of contractors approved by a particular state DOT. When a state DOT has numerous mainte-nance contractors, difficulties arise in tracking cost and determining overall effec-tiveness of the maintenance provided. A rural transit provider may have to rely on local garages or local dealerships for its maintenance needs. This practice may expose it to untimely repairs, faulty workmanship, and inflated repair costs, all of which can lead to disrupted service if an alternate (loaner) vehicle is not available. Due to this lack of maintenance expertise, and regardless of maintenance method (i.e., third-party, local garage, etc.), other issues affect rural transit maintenance services, such as specialized equipment (e.g., wheelchair lifts), alternative fuel vehicle servicing, and warranty recovery being serviced in a timely manner.
A central or regionalized approach to maintenance would greatly improve overall maintenance for rural transit providers and their vehicle fleets. However, regional maintenance programs have to be developed so they are location specific and have the capacity to support servicing multiple vehicle types. A generalized “one-size-fits-all” regional maintenance program could actually be counter-productive to servicing rural transit providers because of varying factors. It is important to locate a regional maintenance center so the most natural pairing of its closest clients enables the maximum number of rural transit providers to become its potential beneficiaries. The vehicle type, model, age, and environment (climatic and economic) in which that vehicle is used are all factors needed in determining the type and frequency of prescribed maintenance. An RMC would act as a central location with full-time technical expertise to handle varied maintenance repairs efficiently and possibly at fixed costs, thus reducing overall costs for individual rural transit providers.
In an effort to examine the significance of maintenance cost in developing an effec-tive maintenance program, Purdy and Weigmann (1987) studied 68 California
Journal of Public Transportation, Vol. 12, No. 3, 2009
108
transit agencies on the cost elements that contributed to the total cost of vehicle maintenance. They found that transit agencies with fewer than 100 vehicles had maintenance costs amounting to 15-20 percent of the agency’s total budget, while the maintenance cost for agencies with more than 100 vehicles was approximately 20-30 percent of the total budget. The five main elements in maintenance cost are direct labor, maintenance administration, material and supplies, fringe benefits, and maintenance overhead. It would first appear that an agency with less than 100 vehicles has a lower maintenance cost than those with over 100 vehicles. This is somewhat misleading when considering that the increments in scaling were too wide to make an accurate determination. It would have been interesting to see the same data in 50-vehicle increments so the economies of scale could be exam-ined. This would be important information in determining the number of vehicles required for the lowest overall associated cost. The Purdy and Wiegmann study highlights the importance of such economies of scale factors.
Illinois Regional Maintenance CentersOur research revealed that the State of Illinois has, for several years, successfully operated an RMC model that services its rural transit providers. This example highlights the major points of Illinois’ RMC model: commitment to the client, partnership with urban system, RMC locations, background reasons, vehicle loan program, and educational features.
The State of Illinois currently has three RMCs that service rural transit vehicles pur-chased through Illinois Department of Transportation (IDOT) funds. In addition, IDOT focuses on the welfare of the client and allows its RMCs to service non-profit Illinois agencies (nursing homes, hospitals, etc.) with transit vehicles. The IDOT Division of Public Transportation and its urban system, Illinois Mass Transit Sys-tems, have a formal partnership that incorporated the RMCs into the mass transit systems. A formal Memorandum of Understanding (MOU) between these two parties ensures that financial concerns are separate and customer service agree-ments are met (Rural Transit Assistance Center 2006).
Presently, IDOT’s RMCs are located in Springfield, Rockford, and Danville. These RMC facilities became official transit vehicle regional maintenance centers in 2001 for Springfield and Rockford and 2004 for Danville. According to the Rural Transit Assistance Center (2006) annual report prepared for IDOT, the Springfield RMC was the largest facility, servicing 41 agencies; the Rockford RMC serviced
109
The Concept of a Regional Maintenance Center
19 agencies; and the Danville RMC serviced 4 agencies. The number of agencies served by IDOT’s RMCs has increased from 35 in fiscal year 2003 to 64 in fiscal year 2006. Data for fiscal years 2001 and 2002 were unavailable. All agencies must be registered with the State before any repair and maintenance scheduling occurs with any RMC. The RMCs are located such that most transit agencies are within a 60-mile radius (one-hour drive) for travel to their closest naturally-paired RMC.
According to David Spacek, IDOT’s Division of Public and Intermodal Transpor-tation Bureau Chief, the following were primary reasons IDOT moved toward a regional concept to service its transit vehicles:
Funds were being poorly spent on maintenance repairs because vendors •were not repairing vehicles correctly.
Warranty repairs were not being honored. •
Vehicle maintenance issues/concerns needed to be identified sooner.•
There was a lack of standardization and accountability.•
IDOT undertook the RMC initiative after conducting field visits throughout the state and recognizing recurring trends.
For Illinois, the main purpose for RMCs is to perform non-routine maintenance and repairs and not to compete with local garages or vendors. According to Mr. Spacek, an added benefit to IDOT RMCs is that work is completed by mechanics already knowledgeable through experience in Illinois’ urban mass transit system. Because each RMC completed the process to become a warranty center, IDOT’s RMCs are recognized as such and receive authorized parts and labor rates.
Additionally, IDOT RMCs have a loaner vehicle program that is available to State-registered agencies that participate. In the past, transit agencies with an out-of-service vehicle often did not have an extra vehicle to use; thus, clients waited until the transit vehicle was repaired. The loaner vehicle is a 14-passenger van equipped with a wheelchair lift and does not require a commercial driver’s license (CDL) for operation (Rural Transit Assistance Center 2006). If required, the loaner vehicle is allocated when the agency schedules a repair or maintenance through an RMC scheduler. The loaner vehicle is available to all IDOT agencies within the designated 60-mile radius and is serviced on a first-come-first-served basis. If any damage is incurred to the loaner vehicle, the borrowing agency is responsible for repairing those damages. The borrowing agency is also responsible for fuel con-sumed during the loan period.
Journal of Public Transportation, Vol. 12, No. 3, 2009
110
All transit vehicles using State funds are centrally procured through IDOT Divi-sion of Public Transportation. Registered agencies apply for vehicles, and IDOT develops the technical specifications, negotiates with suppliers, purchases desired equipment, and informs agencies of equipment delivery. The IDOT Division of Public Transportation hosts bi-annual training seminars named “Round Tables” for mechanics, IDOT transit representatives, and transit providers. IDOT decision making representatives (executives, maintenance managers, etc.) are important participants in these “Round Tables” because they gain a deeper understanding of critical technical issues and concerns the mechanics and transit operators are addressing and trying to resolve. By actively attending and participating, IDOT decision makers can greatly assist in the resolution of mechanical issues and con-cerns due to their authoritative role.
Regional Maintenance Center ModelSpecifications for a public transportation regional maintenance facility are crucial in ensuring that regional transportation maintenance facilities operate in a similar manner and enable rural transit agencies to reap the maximum benefit of using an RMC. Researchers for this project reviewed the websites of all 50 state Depart-ments of Transportation, related transportation agencies, and associated organi-zations, reviewed more than 100 publications, visited several private entities, and conducted observational interviews to gain a thorough baseline understanding of the state of rural transportation in general and address several critical topics. However, this paper is limited to information specifically relevant to the develop-ment and operation of an RMC.
The following specifications are a conglomeration of reviewed materials and researcher expertise and are the proposed minimum essential requirements for a regional transportation maintenance facility. These specifications are thorough but not exhaustive and cover a general definition, location specifications, building and service requirements, and other general requirements.
General Definition of a Regional Maintenance Center An RMC is defined as a centralized public transportation maintenance facility that provides general maintenance and services to rural transit providers, as indicated in Table 1.
111
The Concept of a Regional Maintenance Center
Table 1. General Description of a RMC
Provides preventive maintenance (PM), preventive inspection, major components repair, and yreplacement services to rural transit agencies within a given service area, county, and/or main-tenance district.
Provides maintenance and repair services beyond the scope that a local garage would provide. y
Provides services to specialized transit vehicles and equipment, including but not limited to ywheelchair lifts and electric, propane and hybrid vehicles.
Serves as a technical information center and provides technical expertise to rural transit agencies, yother transit providers, and private maintenance contractors.
Acts as warranty recovery center for all parts and labor and possibly as a designated warranty ycenter to work on authorized original equipment manufacturing (OEM) parts.
Provides loaner vehicles to rural transit agencies if necessary. y
Regional Maintenance Center Location A critical factor to the success of a regional maintenance center is the strategic location of the RMC as it relates to its potential rural transit providers, as indicated in Table 2.
Table 2. Considerations for RMC Location
Most rural transit would travel routine routes in close proximity to the RMC on a regular basis yto facilitate vehicle repair and maintenance.
Maximize number of rural transit agencies that could utilize and benefit from the facility. y
Minimize overlap in coverage area by each RMC. y
Maximize market and population service. y
Building RequirementsThe building for a RMC may be a newly-constructed facility or a retrofitted facility, but the building requirements for such a facility should adhere to all lawful codes, address security concerns, and have enough operational capacity for vehicle main-tenance and parking (Maintenance Design Group 2007). Each of these require-ments is discussed briefly in Table 3.
Journal of Public Transportation, Vol. 12, No. 3, 2009
112
Table 3. Considerations for RMC Building Requirements
BuILDInG CODE
All RMC facilities must comply with local, state, and federal building codes including but not limited to fire safety, structural safety, and health requirements.
SITE SECuRITY
Maintenance facilities should uphold, at minimum, basic site security including but not limited to visitor sign in, camera surveillance, and secured parking for vehicles that require overnight service.
PHYSICAL SPECIFICATIOn
Square footage, number of bays, washing bays, and types of building should be determined by each regional RMC location and the number of rural transit vehicles serviced by the RMC. An RMC should provide a lobby or waiting area for rural transit vehicle operators waiting for vehicle maintenance.
Service RequirementsThe various types of services an RMC can conduct on rural transit vehicles may range from inspections to towing services. Information on preventive main-tenance, inspections, repairs, warranty services, road calls, wrecker, and loaner services is presented in Table 4. Further details on these services can be found in “TxDOT Maintenance Management and Safety Guide” (Texas Department of Transportation 2003), Schiavone (2007), and “Handbook for Rural Transit Provid-ers” (Kansas University Transportation Center 1997).
Table 4. Typical Service Types of a RMC
PREVEnTIVE MAInTEnAnCE (PM)
RMC should provide PM to rural transit vehicle when requested. PM procedure should comply with federal, state, local guidelines, and vehicle manufacture specifications.
PREVEnTIVE MAInTEnAnCE (PM) InSPECTIOn
PM inspection on all components of a vehicle should be performed on each rural transit vehicle once it has been brought in for maintenance and repair and again before returning it to its corresponding transit agency. PM inspection should comply with federal, state, and local guidelines. An RMC should inform the corresponding agency of any wear and tear, defective or broken parts that require atten-tion noted during the inspection and potentially set an appointment to resolve the noted problem.
SAFETY InSPECTIOn
In addition to safety Inspections specified by federal, state, and local guidelines, an RMC should inspect auxiliary equipment to ensure that all equipment is in working condition. Auxiliary equip-ment on all vehicles serviced should be inspected, including fire extinguishers, seat belts, wheelchair restraint belts, overhead compartments, etc.
REPAIR SERVICES
All services performed by RMCs should comply with the original equipment manufacturer (OEM) and any other manufacturer specifications. Repair and maintenance services an RMC should provide include but are not limited to:
Drive Train y
113
The Concept of a Regional Maintenance Center
Engine services, including but not limited to major services such as repair and replace engine, –replace water pumps, and minor services such as filters and fluid change.
Transmission services, including but not limited to routine checks on existing components, service –on transmission, replacing worn and broken parts, and replacing transmission with refurbished or new system.
Differential services, usually performed in conjunction with brake service, including service, repair, –and replacement of component parts as required.
Diagnostic services, including but not limited to emission testing, transmission electronic code ychecks, and engine diagnostic.
Brake services, including but not limited to pad replacement, turning or replacing brake drum, yinspection and testing of pneumatic or hydraulic systems.
Tire-related repair, including but not limited to repairing punctures, tire balancing, and tire replace- yment.
Alignment and suspension services, including but not limited to replacement of worn or broken ysuspension part, inspection of all steering assemblies, front-end alignment, replacement and repair of worn or broken parts.
Vehicle air conditioning system, including servicing and replacing damaged and worn components. y
Special equipment services, including but not limited to servicing and testing various types of ywheelchair lifts and servicing propane, electric and hybrid vehicles.
WARRAnTY RECOVERY SERVICE
An RMC should recover the warranty on all defective parts on behalf of rural transit agencies. The RMC should strive to be the designated warranty center, i.e., authorized by vehicle manufacturers to repair and replace faulty parts using original parts and authorized labor rates.
ROAD CALL SERVICES
An RMC should have a minimum of one road-call vehicle in the facility to dispatch when a vehicle breaks down.
An RMC should establish an operating procedure for using a road-call vehicle, addressing the respon-sibilities of the RMC and rural transit agencies when using a road-call vehicle, risk and cost sharing.
The mechanic dispatched should be able to diagnose the cause of breakdown and assess the situation. Depending on the severity of the breakdown, the mechanic should:
Perform the repair if the repair job requires less than 30 minutes. y
Dispatch for a replacement vehicle and a wrecker vehicle if the repair requires more than 30 minutes. y
WRECkER SERVICES
An RMC should establish an operating procedure that includes but is not limited to conditions to use a wrecker, a procedure to use a wrecker, and detailed responsibilities of each party involved when using a wrecker vehicle. If an RMC does not own a wrecker, the RMC should sub-contract towing services to local towing/wrecker service provider at the lowest rate possible.
LOAnER VEHICLE SERVICE
Depending on the geographical location and services provided, an RMC should provide loaner vehi-cles to rural transit agencies on a limited basis when the rural transit vehicle requires a prolonged time period for repair. The RMC and funding entity should decide if a loaner vehicle program is needed and establish a program. This program should include but is not limited to operating procedures, conditions when a loaner vehicle is required, any charge(s) imposed on rural transit agencies for the loaner vehicle, certification required to operate a loaner vehicle, responsibilities of the RMC and the rural transit agencies on the loaner vehicle, and risk and cost sharing pertinent to the loaner vehicle.
Journal of Public Transportation, Vol. 12, No. 3, 2009
114
General RequirementsThe general requirements for a RMC should cover safety concerns for the facility, employees, equipment, and maintenance training for technological advances. These factors are presented in Table 5.
Table 5. General Requirements of an RMC
WORkPLACE SAFETY
An RMC should comply with all OSHA rules and regulations pertinent to a vehicle maintenance facil-ity. A comprehensive safety and health program should be recognized, implemented, and enforced in the maintenance workplace to prevent accidents where possible.
EquIPMEnT
An RMC should have equipment that can support the services listed in “Service Requirements.”
COMPuTER SOFTWARE
An RMC should have computer software that enables it to:
Record the details of rural transit agencies of that particular RMC, including but not limited to ythe number of rural transit vehicles owned by each agency, the age of each vehicle, the history of maintenance and repair on each vehicle, and the next date for preventive maintenance.
Classify detailed documentation on each maintenance and repair activity per vehicle. y
Track the warranty recovery process. y
Track inventory, including but not limited to parts, vehicles, equipment, and machinery. y
Schedule and track the work orders within the RMC. y
PERSOnnEL
An RMC should maintain adequate technical and administrative personnel to cover technical assis-tance questions and answers for rural transit agencies or other transit providers, perform routine and non-routine maintenance and repair, ensure efficiencies in handling a vehicle loaner program, provide road call assistance, conduct warranty tracking and processing, and provide wrecker services.
MECHAnICS
Classification: Mechanics should be classified based on skill level, years of experience, and demon-strated competence.
Certification: Mechanics that operate special machinery or perform maintenance and repair of special equipment should obtain proper certifications pertinent to the work performed.
TRAInInG
Proper training should be provided to all mechanics prior to operating any machinery and repairing and performing maintenance on vehicles. Mechanic training on maintenance should comply with federal, state, and local guidelines/regulations.
Training should be provided to transit operators and their drivers on safety, equipment preservation, and RMC general operations.
An RMC should conduct quarterly or bi-annual maintenance roundtable sessions to keep mechanics and decision-makers abreast of issues related to transit vehicle maintenance.
Discussion topics should include frequently-encountered problems in maintenance and repairs, ylatest technologies and techniques in maintenance and repairs, and benefits of PM.
115
The Concept of a Regional Maintenance Center
Special issues, events, and governmental policy changes could be addressed during roundtable ysessions. This includes inviting a guest speaker from the state DOT, etc.
The typical duration of roundtable session is half day to full day. y
Attendance of all mechanics and directors of rural transit agencies (decision makers) should be ymandatory.
ConclusionsThe utilization of the Regional Maintenance Center concept offers many advan-tages over traditional in-house and third-party contracted maintenance. The opportunity to improve maintenance and increase equipment longevity while controlling cost is a very attractive undertaking. It is also important to note that each RMC should be location-specific (natural pairing with local area rural transit service providers). A “one-size-fits-all” approach is not a successful approach. Influential factors such as vehicle type, fleet age, RMC maintenance capacity, and human resource availability are very important. To service rural transit vehicles, there is an expected added cost due to possibly adding mechanics, staff, inventory parts, and specialized equipment. This added cost can be offset by a better utili-zation of physical and human assets. In addition, it is expected that a synergistic effect will be generated by an RMC that is related to training and dissemination of information. A centralized location such as an RMC can be used to offer specific training and certifications for transit operators and their personnel. The problems identified relate mainly to determining where to locate an RMC and what services to offer. The major benefit of this work has been increasing the base knowledge of rural transportation and providing a schema for a Regional Maintenance Center model.
Acknowledgment
Results conveyed in this paper were sponsored by Texas Department of Trans-portation Public Transportation Division Interagency Cooperation Contract # 51-7XXIA006 and partially funded through Rural Technical Assistance Program (RTAP) with Federal Transit Administration funds. Professors and graduate stu-dents at the Texas Tech University Department of Industrial Engineering and a senior researcher from the Texas Tech Center for Multidisciplinary Research in Transportation (TechMRT) have completed this paper in cooperation with the Public Transportation Division of the Texas Department of Transportation. All
Journal of Public Transportation, Vol. 12, No. 3, 2009
116
opinions, errors, omissions, and recommendations are the responsibility of the authors.
References
Federal Transit Administration. 2007. Grant Programs. FTA website, http://www.fta.dot.gov/funding/grants_financing_263.html, accessed May 10, 2007.
Heiligenstein, M., J. Albert, R. Davenport, N. Perales, H. Andrade, and G. Pate .2006. TxDOT has a plan: Strategic plan for 2007-2011. Texas Department of Trans-portation, TxDOT Strategic Plan 2007-2011, ftp://ftp.dot.state.tx.us/pub/txdot-info/lao/strategic_plan2007.pdf, accessed May 1, 2007.
Kansas University Transportation Center. 1997. Handbook for rural transit pro-viders transit vehicle inspections: Delivery, pre-trip and annual inspection procedures. http://www.cutr.usf.edu/bussafety/documents/tvi-handbook.pdf, accessed June 20, 2007.
Maintenance Design Group. 2007. http://www.maintenancedesigngroup.com/, accessed July 17, 2007.
Purdy, J.E., and J.D. Wiegmann. 1987. Vehicle maintenance: Cost relationship and estimating methodology. Transportation Research Record: Journal of the Transportation Research Board 1140: 1-17.
Rural Transit Assistance Center. 2006. Annual report: Illinois Regional Mainte-nance Center fiscal 2006 assessment. Western Illinois University.
Schiavone, J. 1997. Synthesis of transit practice 22: Monitoring bus maintenance performance (TCRP Synthesis 22). Guilford: Federal Transit Administration, Transit Development Corporation.
Stommes, E.S., and D.M. Brown. 2002. Transportation in rural America: Issues for the 21st century. Rural America 16(4): 10.
Turnbull, K.F., G.B. Dresser, and L.L. Higgins. 1999. The rural transportation network in Texas (No. FHWA/TX-99/1437-1), Texas Department of Transportation.
Texas Department of Transportation, Public Transportation Division. 2003. TxDOT maintenance management and safety guide. http://www.dot.state.tx.us/publi-cations/public_transportation/mgmtguide.pdf, accessed June 20, 2007.
117
The Concept of a Regional Maintenance Center
About the Authors
natalie M. Waters ([email protected]) received an M.S. degree in Industrial Engineering from the University of Texas at El Paso and a B.A. degree in Psychology from New Mexico State University. Currently, she is a Research Assistant at Texas Tech University pursuing her doctorate in Industrial Engineering. Previously, she worked for Levi Strauss and Company in its manufacturing and distribution/logistics divisions as an industrial engineer, shift manager, project manager, and operations manager. Her research interests are focused on knowledge workers, teams, knowl-edge management, and engineering management.
Mario G. Beruvides, PhD., P.E. ([email protected]) is the AT&T profes-sor in the Industrial Engineering Department at Texas Tech University and Direc-tor of the Laboratory for Systems Solutions. He received his Ph.D. from Virginia Polytechnic Institute & State University. His major areas of interest are advanced economic analysis, management of technology, engineering management, white-collar/knowledge work, productivity and performance measurement, operations and systems engineering, and macro-ergonomics.
James L. Simonton, PhD., P.E. ([email protected]) received his Ph.D. from Texas Tech University in Industrial Engineering. He holds an M.S. degree in Systems and Engineering Management from Texas Tech University and a B.S. degree in Tex-tiles from Texas Tech University and is a professional engineer in the state of Texas. He is an Assistant Professor of Industrial Engineering at Texas Tech University. His research interests include operational research, engineering economics, logistics, and quality. He worked for 20 years in the manufacturing industry prior to his academic career.
Ean-Harn ng, E.I.T. ([email protected]) is a Ph.D. student in System and Engineering Management from Texas Tech University. She holds an M.S. degree in Industrial Engineering from Texas Tech University and a B.S. degree in Industrial and Manage-ment Engineering from Montana State University. Her research interests include engineering economic, engineering management, engineering education, and organization behavior.
Siva Chaivichitmalakul ([email protected]) is a Ph.D. student in System and Engineering Management from Texas Tech University. He holds a B.S. degree in Civil Engineering from Sirindhorn International Institute of Technology, Thammasat University, Thailand. His research interests are biomass fuels, alternative fuels, economic modeling and engineering economic.
Journal of Public Transportation, Vol. 12, No. 3, 2009
118
Cheng-Chu Chiu-Wei ([email protected]) is a research assistant of Industrial Engineering at Texas Tech University. He received an M.S. in Engineering Manage-ment from Southern Methodist University and a B.A. in Industrial Management from Chung Hua University. His research interests include engineering management, production engineering, and systems solutions.
Pelin Z. Altintas ([email protected]) is a Ph.D. student in the Industrial Engineering Department of Texas Tech University where she received M.S. and B.S. degrees in Industrial Engineering. Her research interests are cost of quality, systems and engineering management, and operation research.
Luis A. Barroso, Ph.D. ([email protected]) is a professor at the Instituto Tecnológico de Monterrey—San Luis Potosí, in México. He received his Ph.D. from Texas Tech University in Systems and Engineering Management and holds an M.S. in Systems and Engineering Management and a B.S. in Computer Science from Univer-sidad de las Américas in Puebla, México. His research interests include engineering economic, systems theory, community development, and systems improvement
Phillip T. nash, P.E. ([email protected]) received M.S. and B.S. degrees in Civil Engineering from Texas Tech University. He currently serves as Director of the Texas Tech Center for Multidisciplinary Research in Transportation. He has more than 20 years of experience in a broad spectrum of transportation research including vehicle crash studies, development of expedient repair techniques for damaged pavements, evaluation of cathodic protection systems to mitigate corrosion of reinforced concrete bridge elements, wind and traffic loadings on highway bridges, development of environmental specifications for roadway construction materi-als, the use of recycled materials in roadway construction, evaluation of military deployment routes throughout Texas, and rapid replacement of bridges damaged by extreme events.
Paul Moon ([email protected]) received an M.A. in Human Services Admin-istration from Saint Edward’s University and a B.A. in Geography from the University of Texas at Austin. Previously, he served in the United States Army’s Transporta-tion Corps as a platoon leader and detachment commander in various posts in the United States, South Korea, and in the Persian Gulf, where he was awarded the Bronze Star. In his current position as fleet planner, he assists transit agencies and transit program managers with fleet management functions including procurement, maintenance, and inventory.


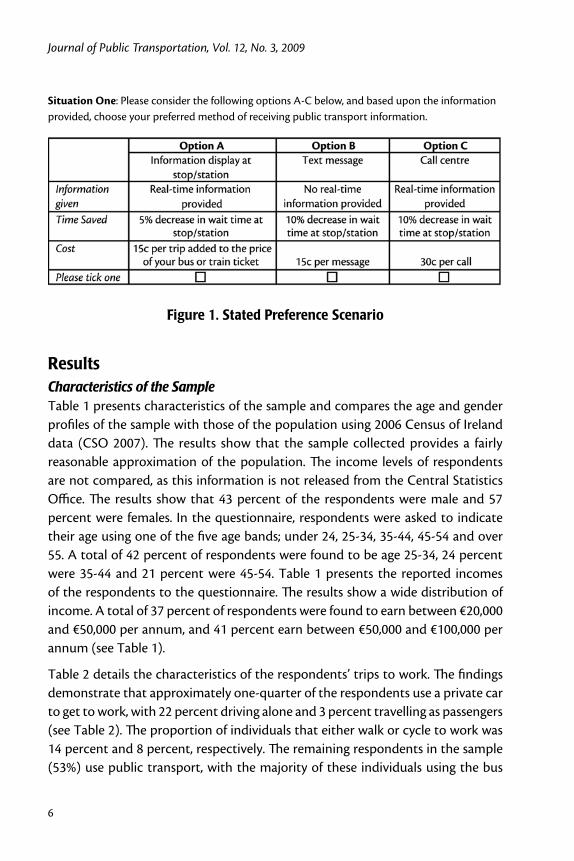
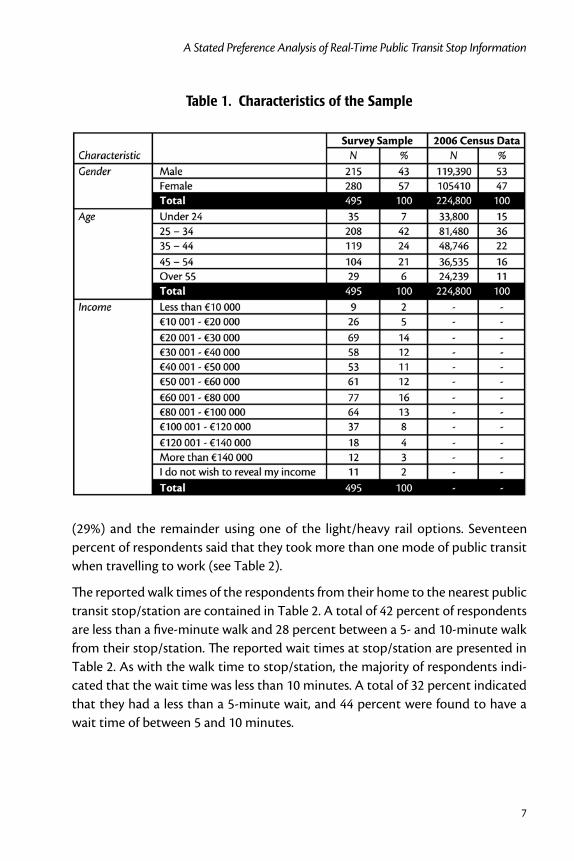
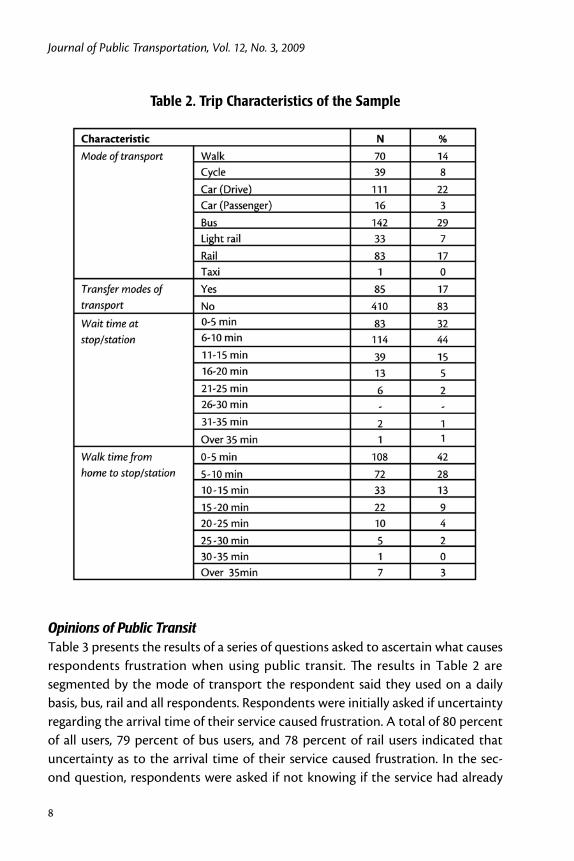
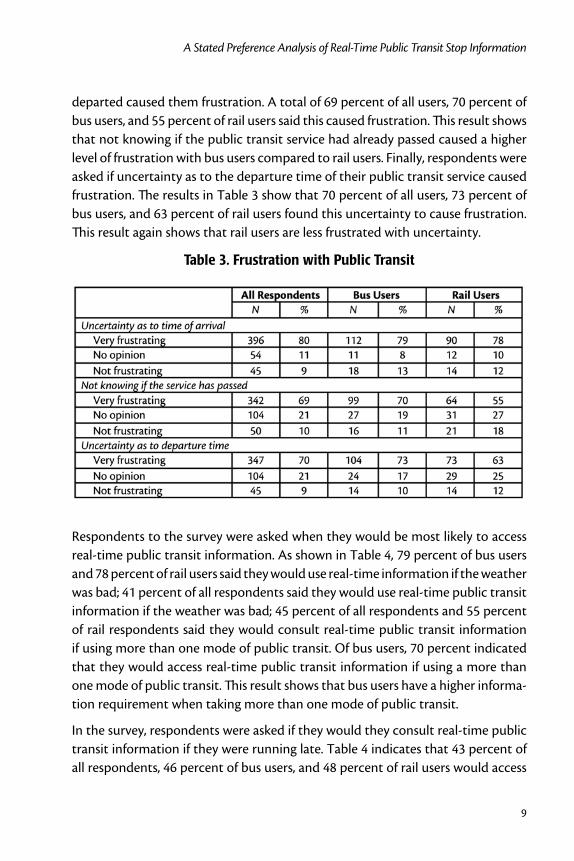
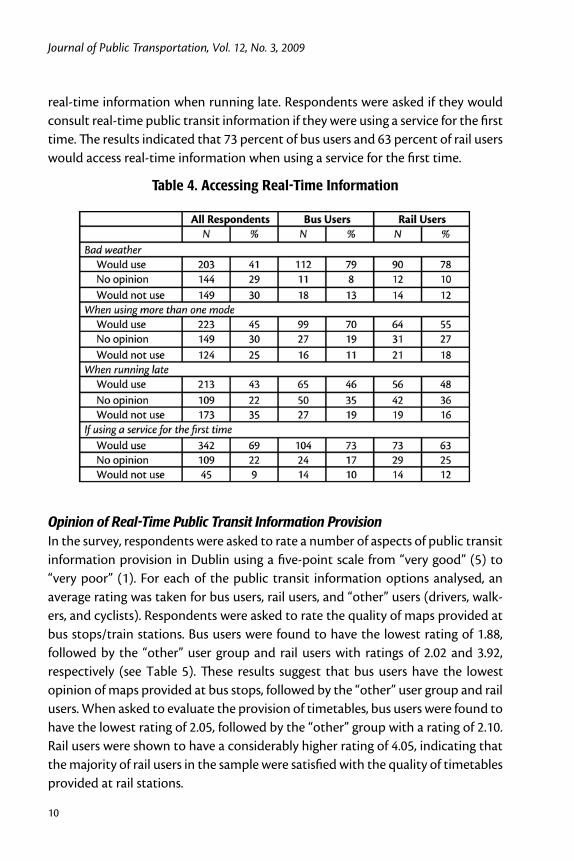

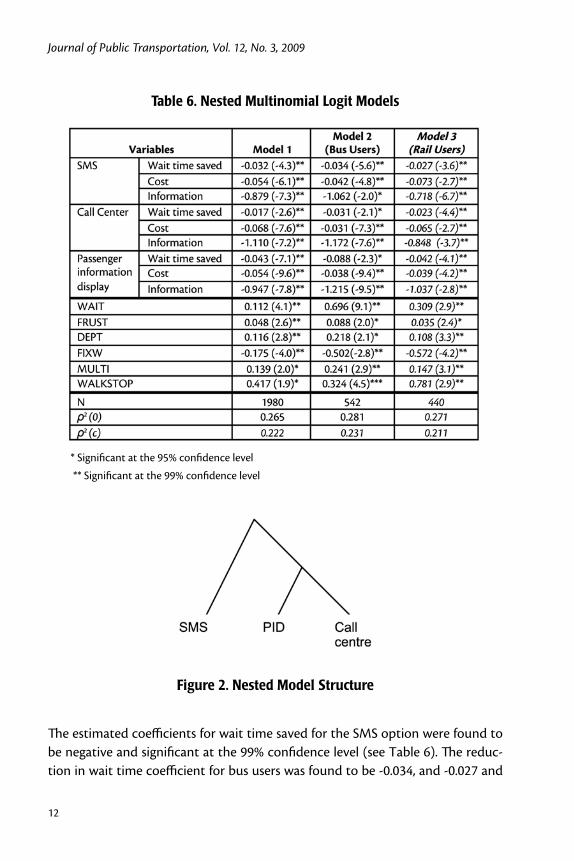


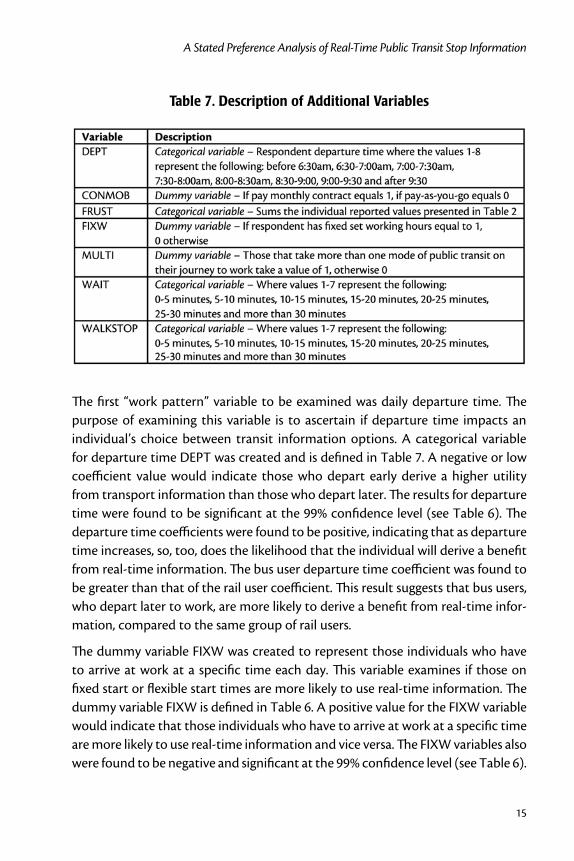


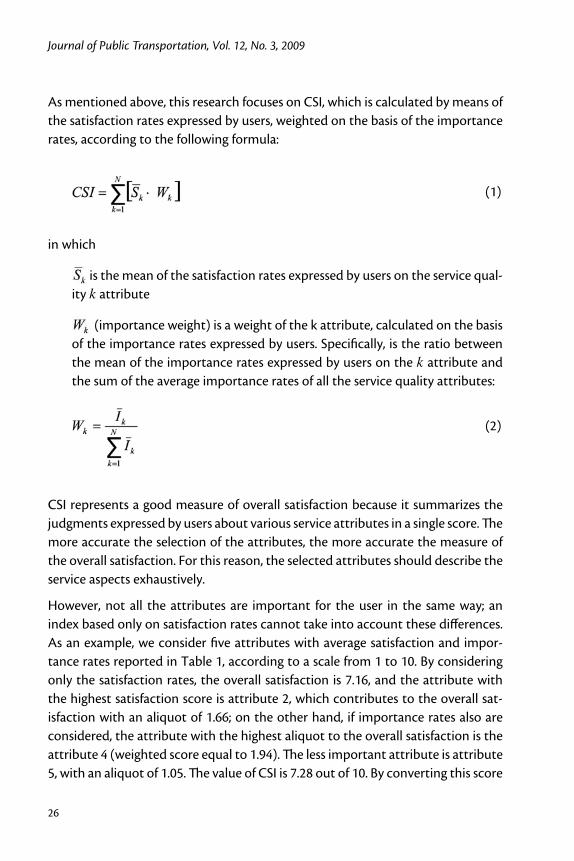
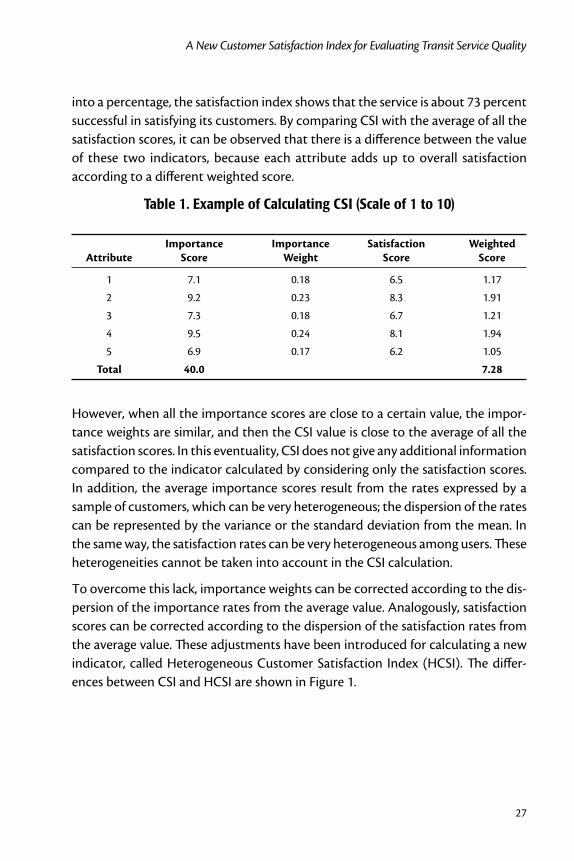
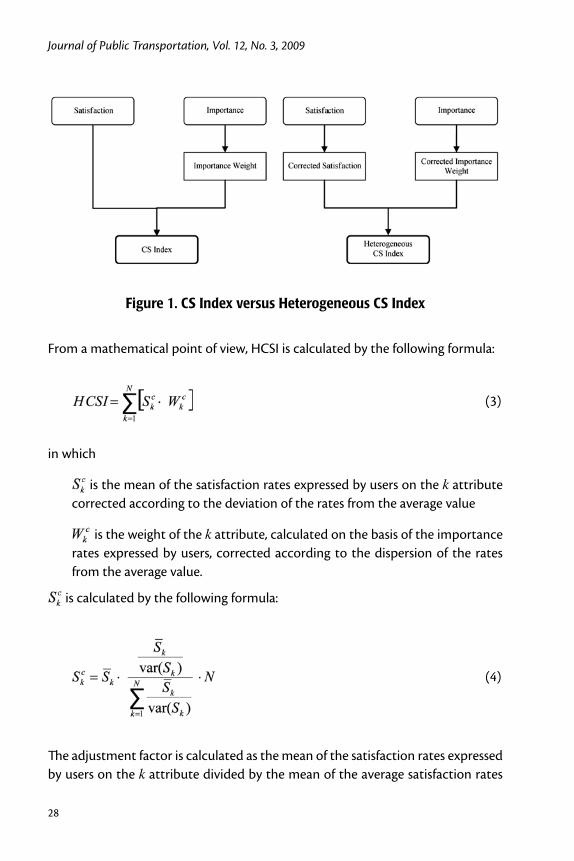

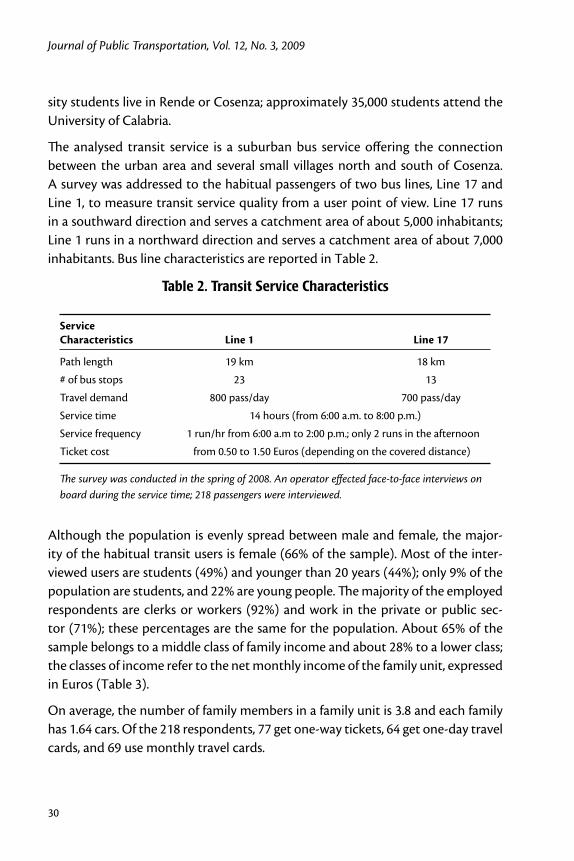

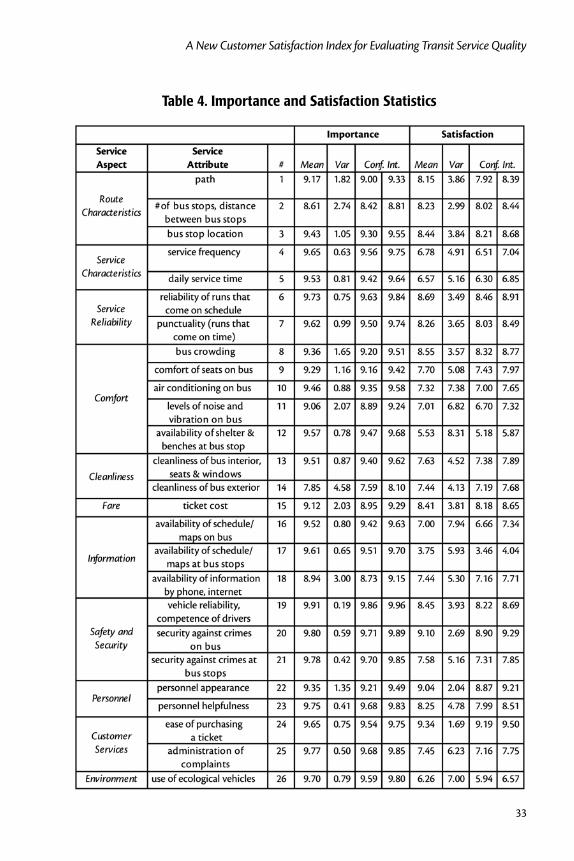
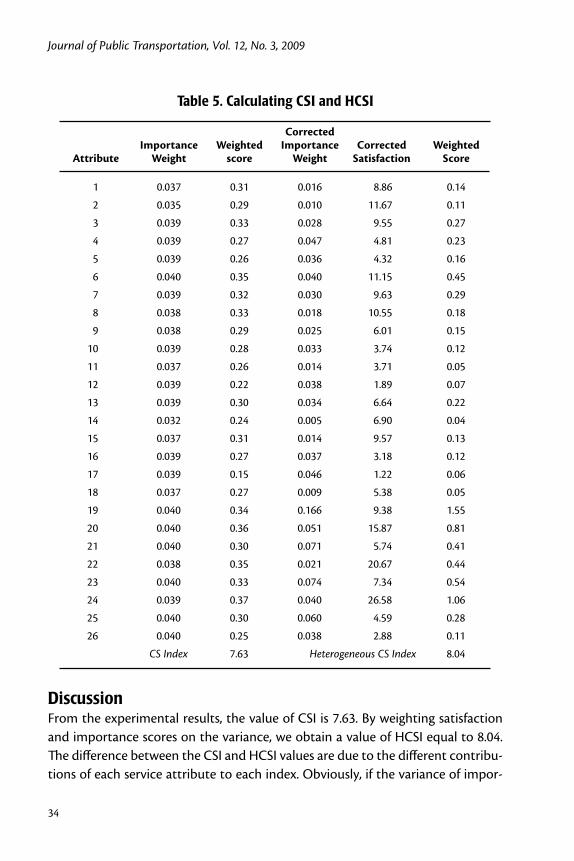
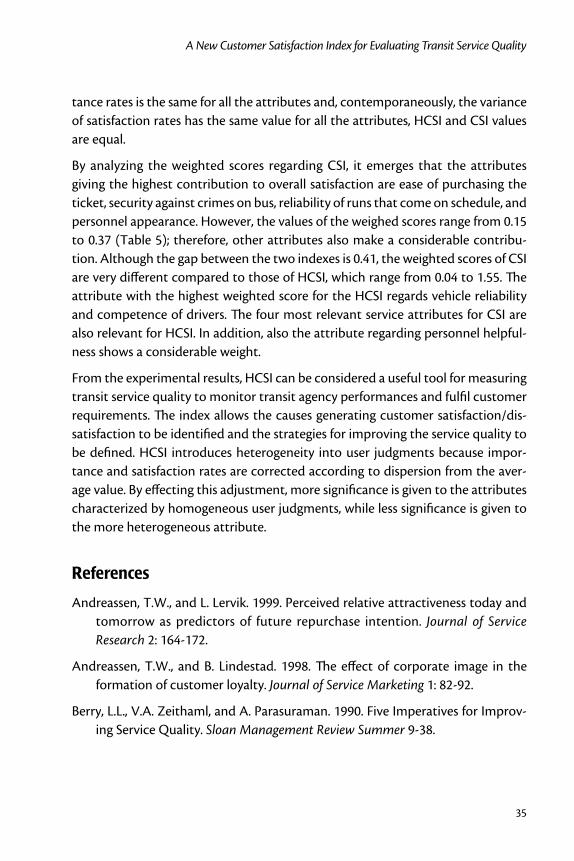


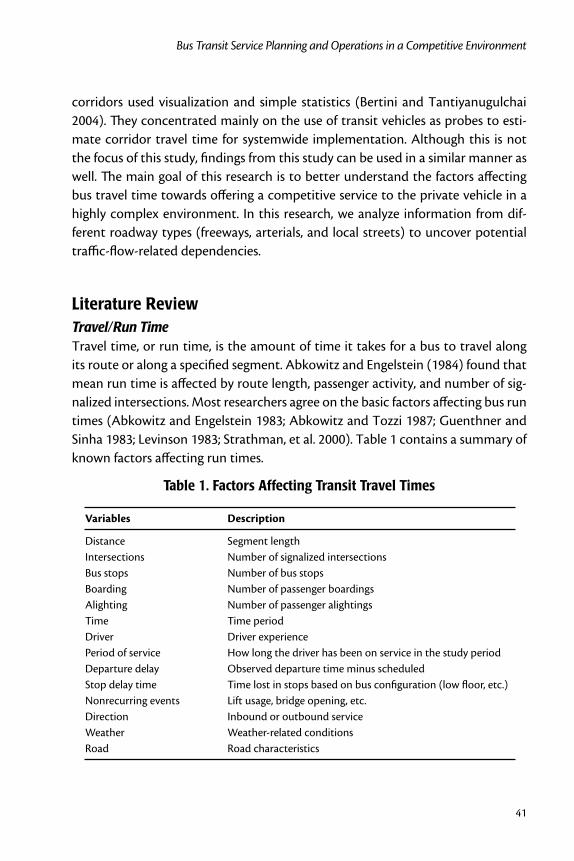

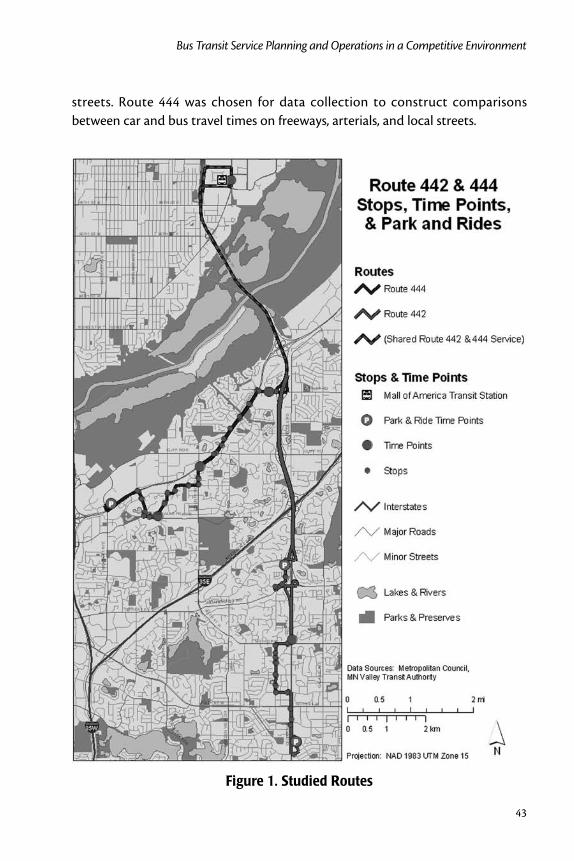
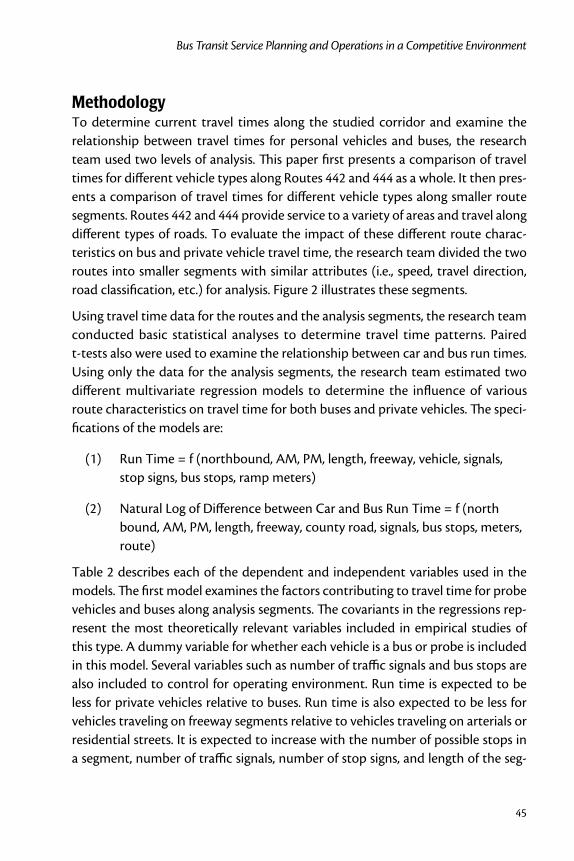

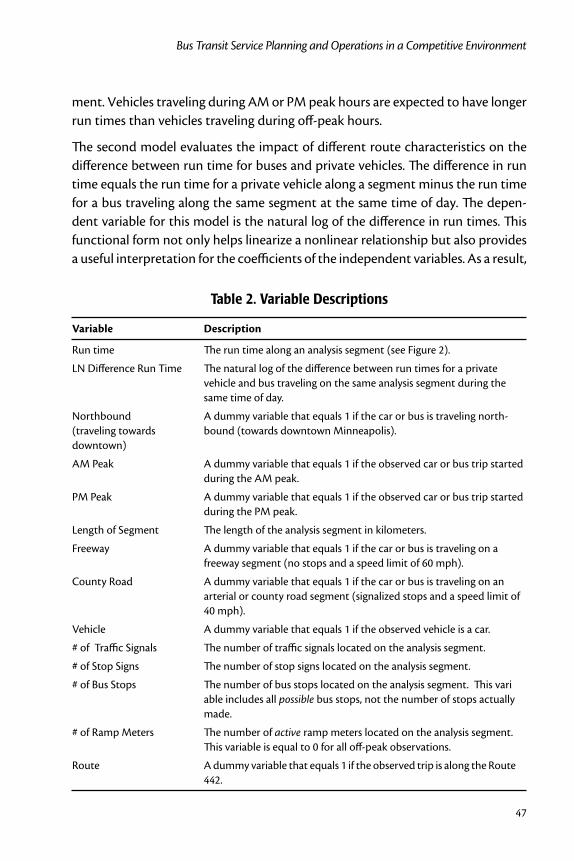

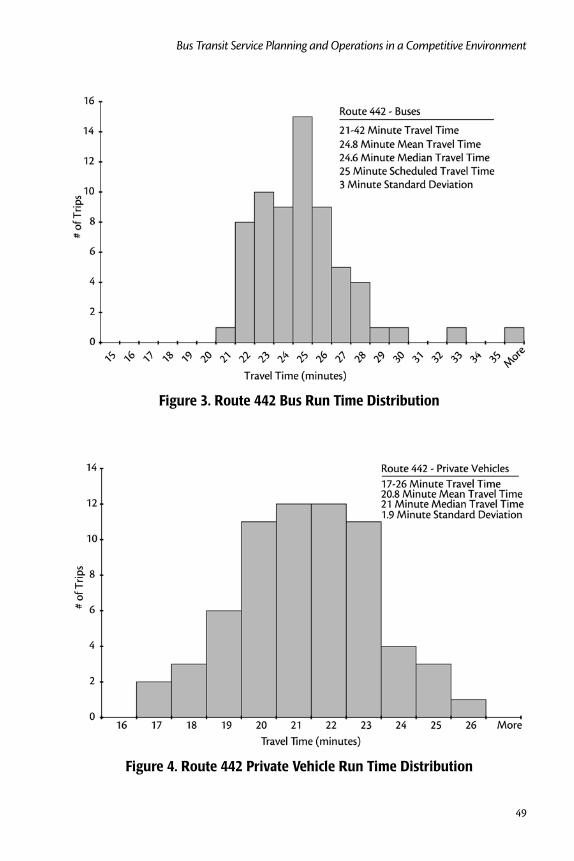

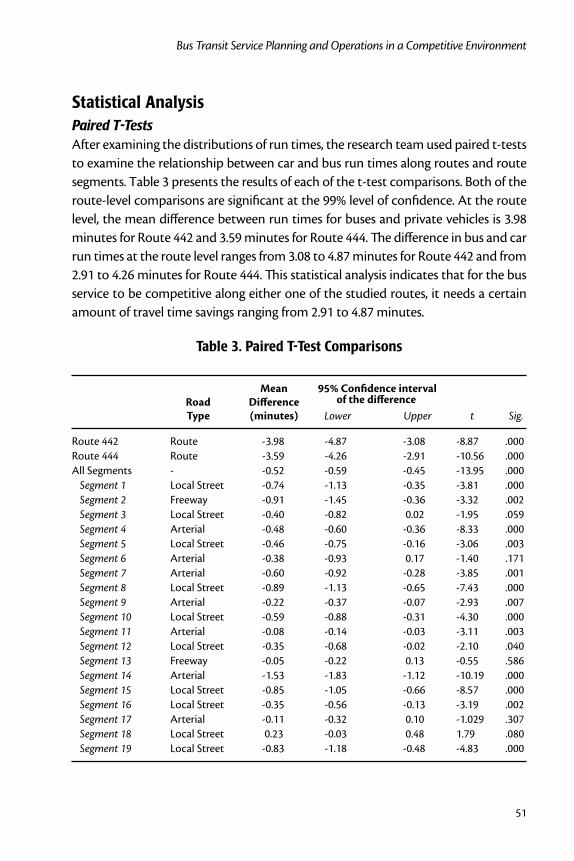
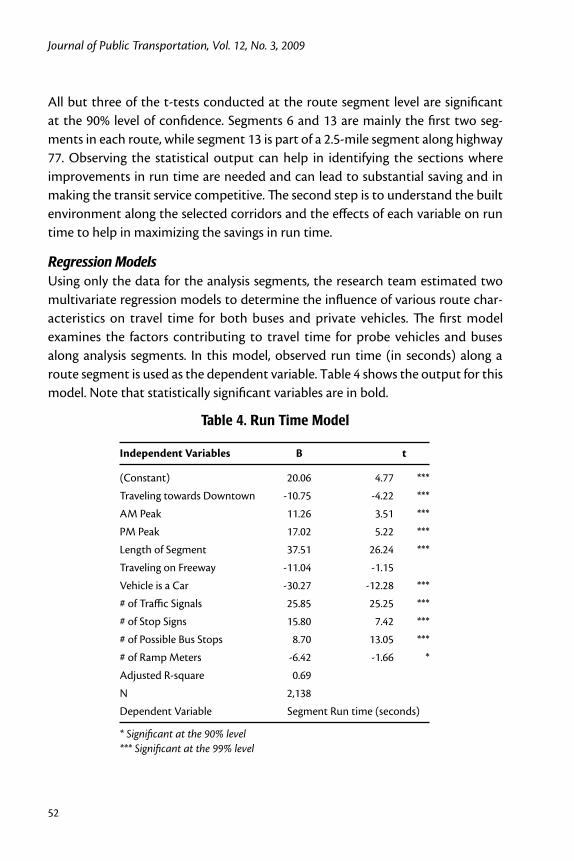
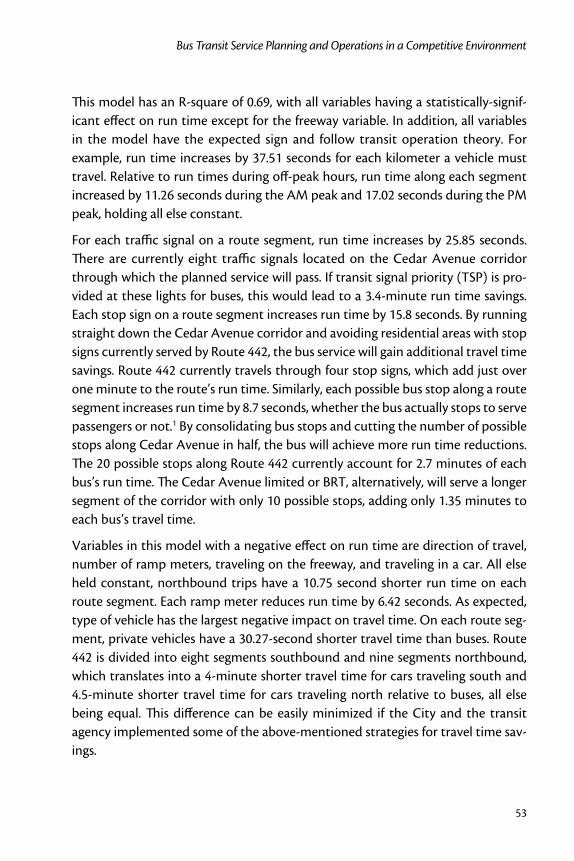
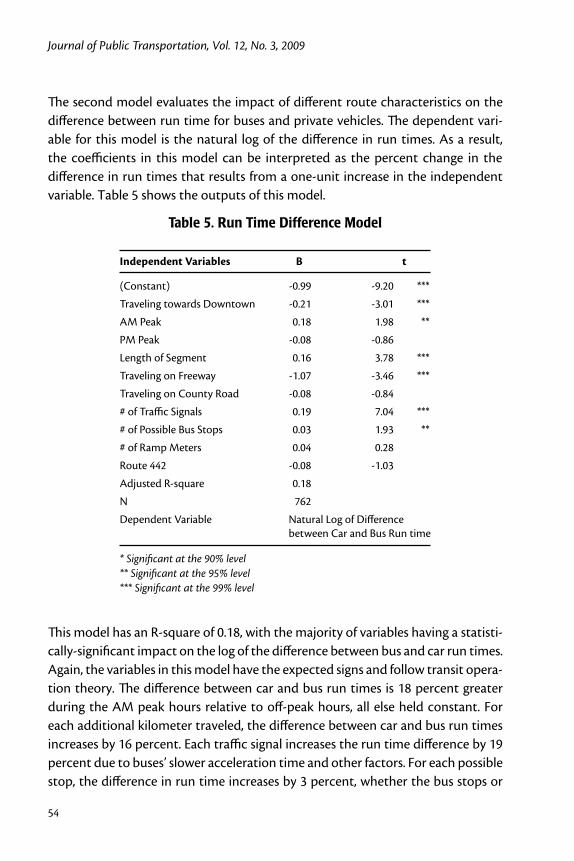


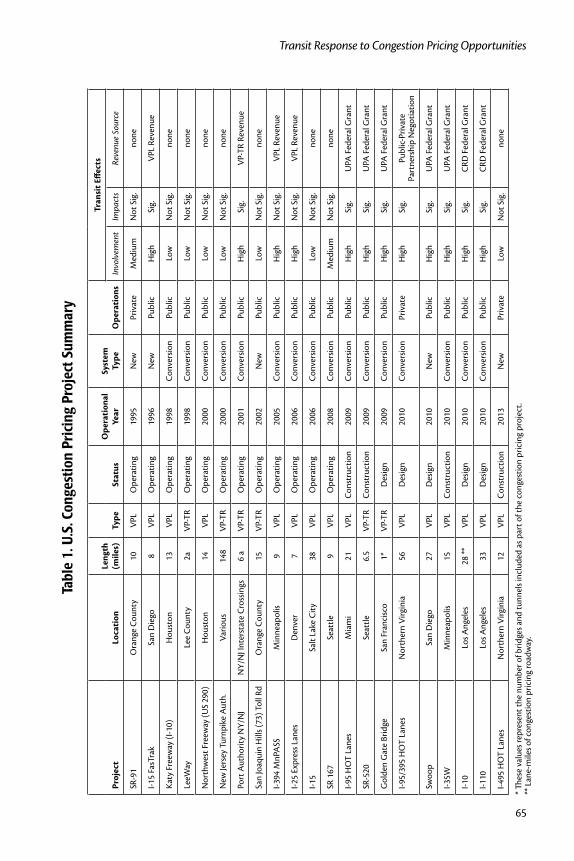


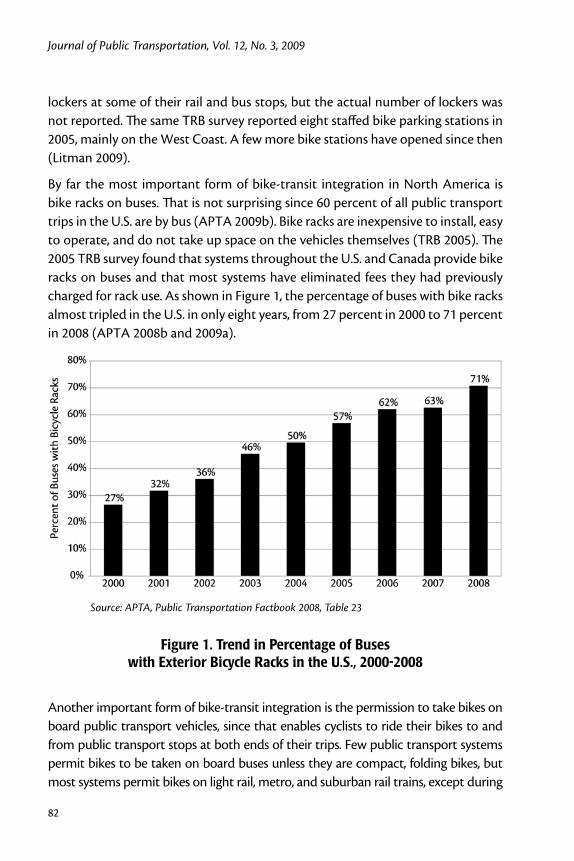
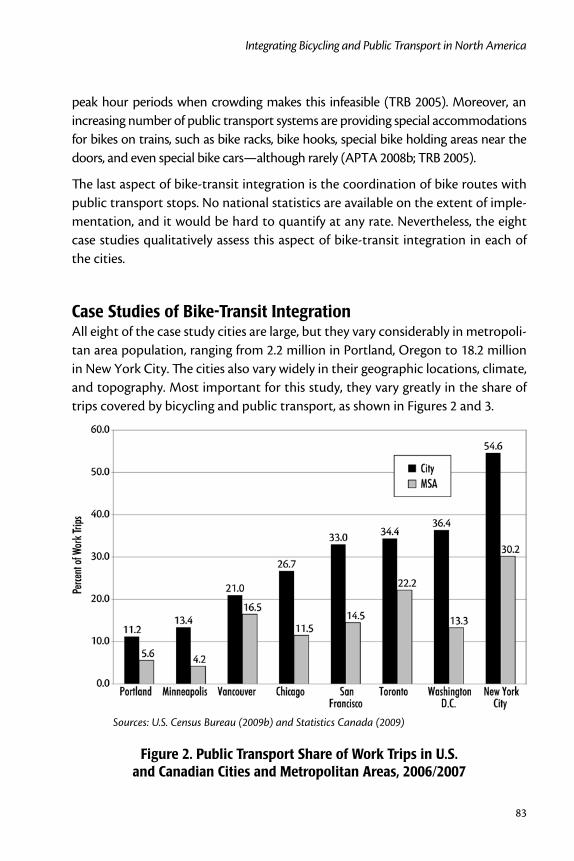


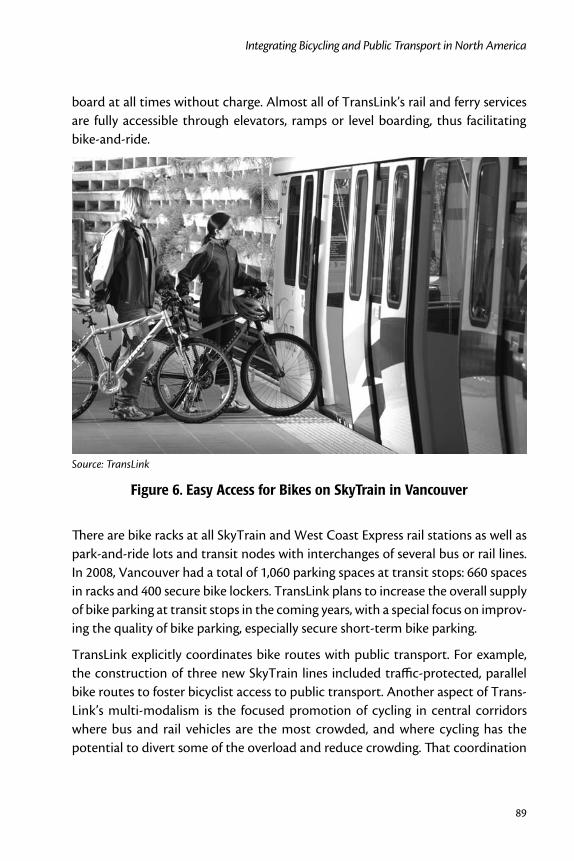
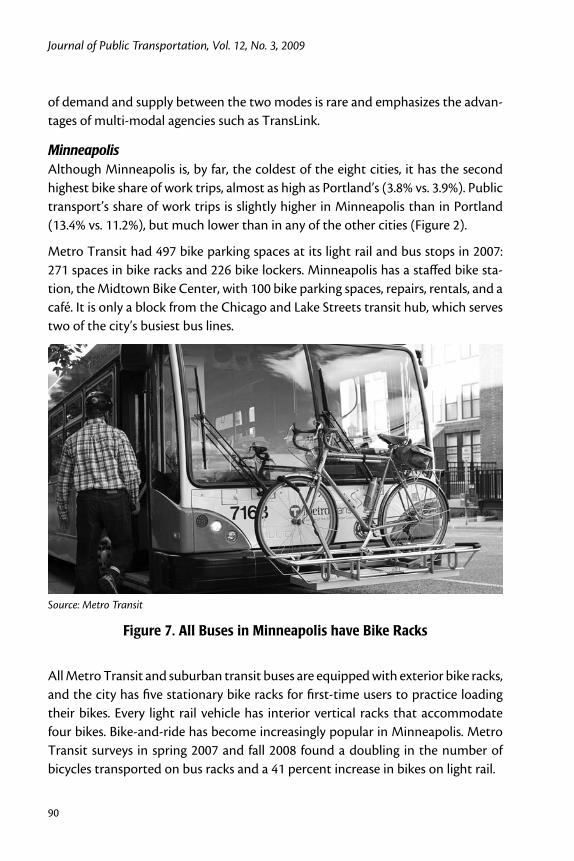


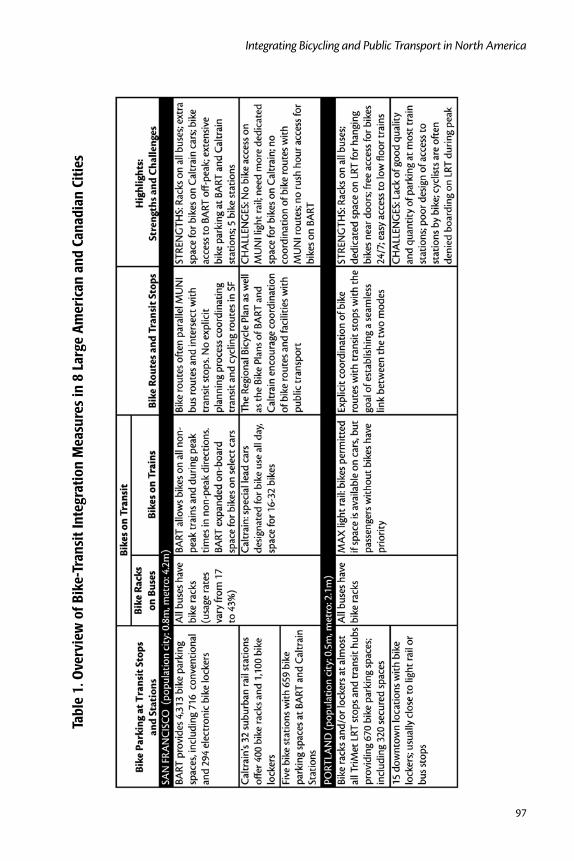

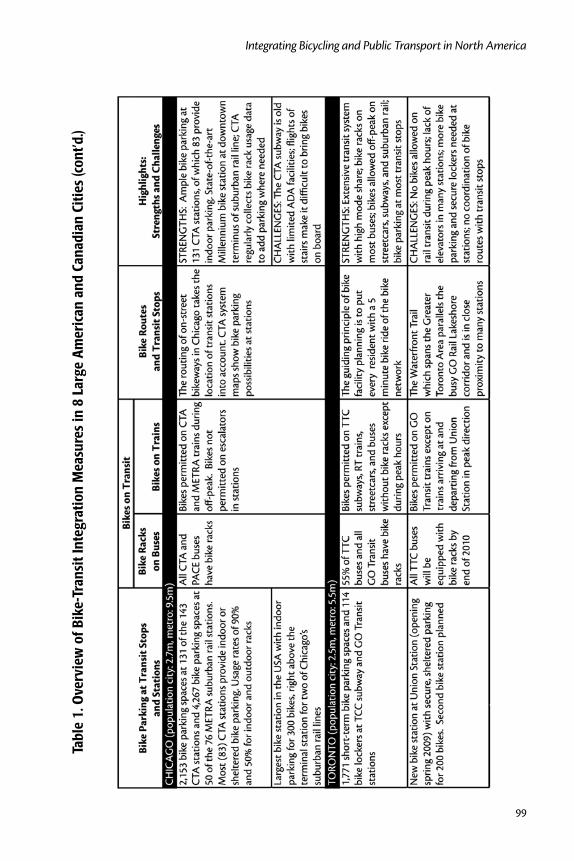
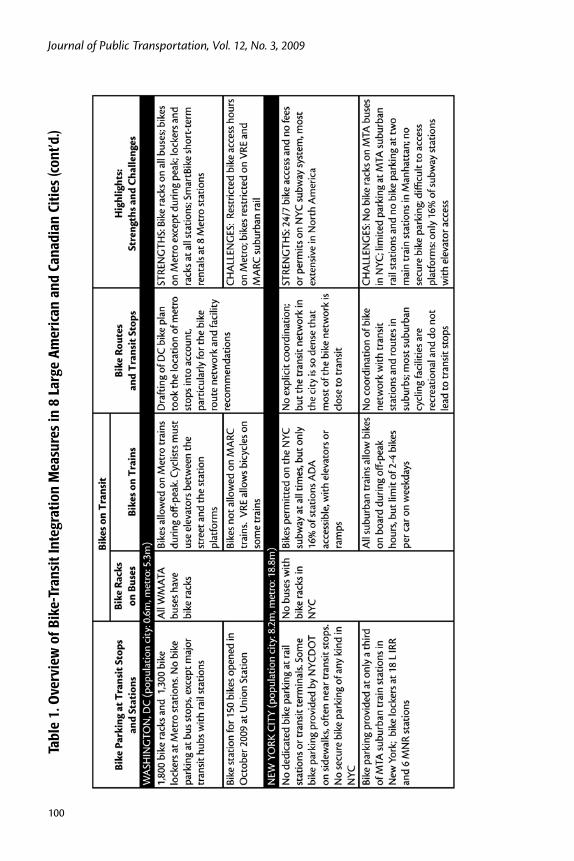

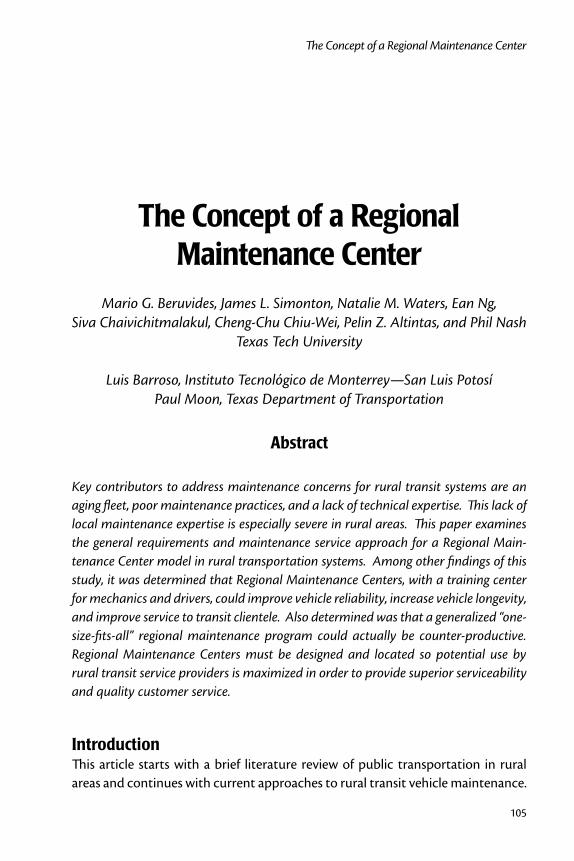

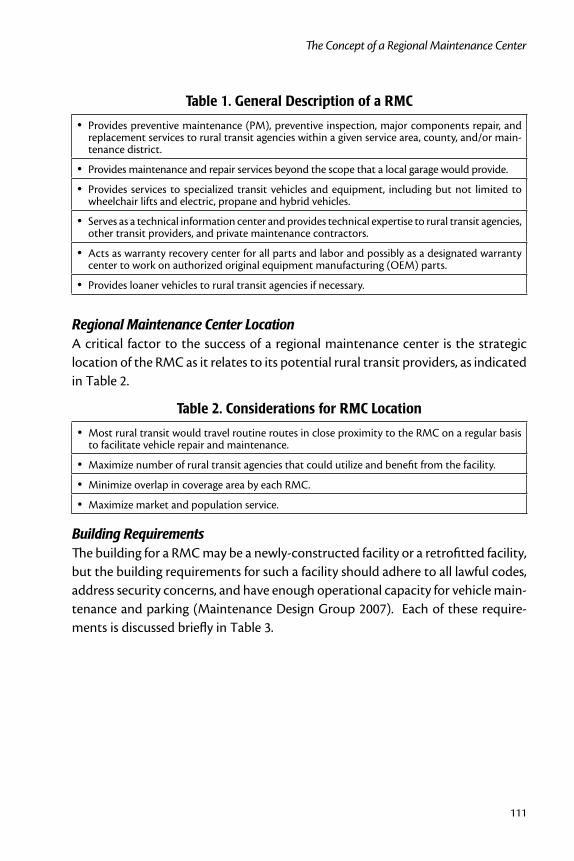
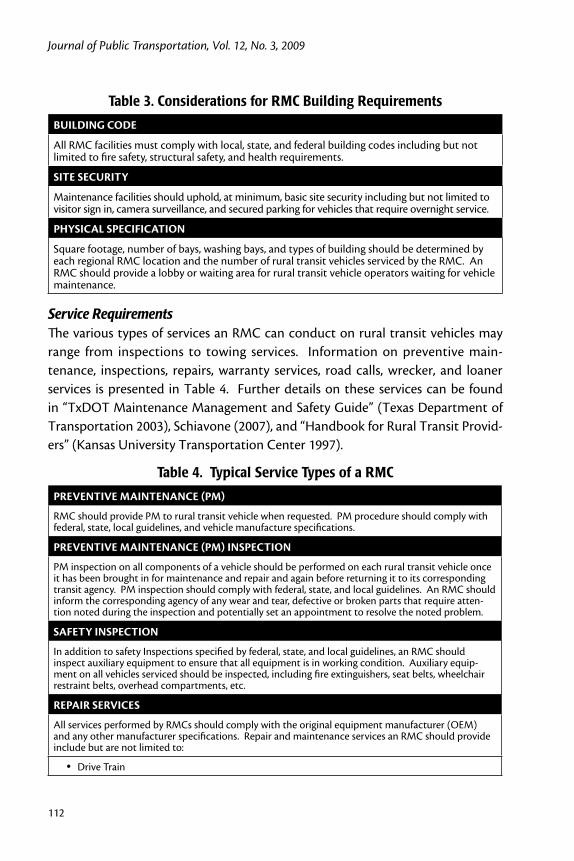
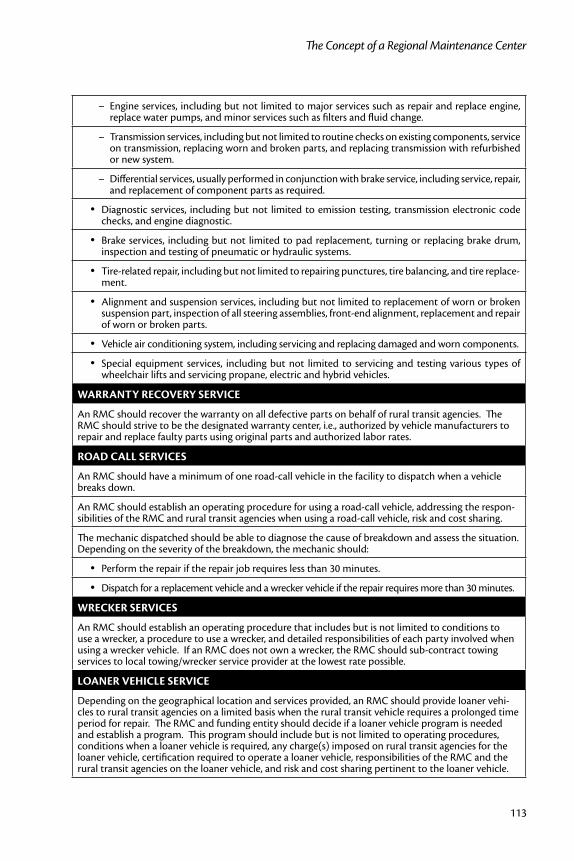
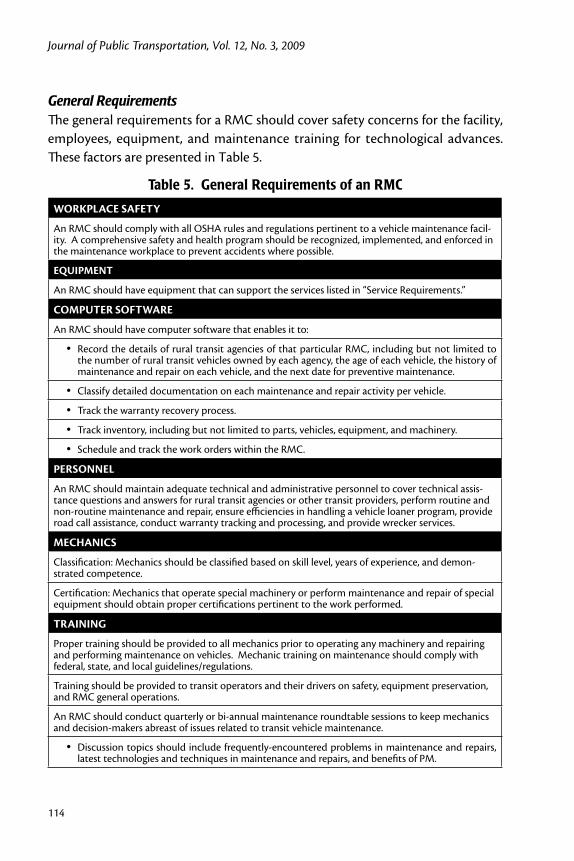


![DSENT A Tool Connecting Emerging Photonics with ... · • 3X power overestimate for 65 nm, 400 MHz [Jeong, Kahng, et al. 2010] • 7X power, 2X area overestimate for 45 nm, 1 GHz](https://static.documents.pub/doc/80x56/5f1d50726bec405a352d72c9/dsent-a-tool-connecting-emerging-photonics-with-a-3x-power-overestimate-for.jpg)


