Page 1
*Corresponding author, e-mail: [email protected]
Research Article GU J Sci 33(3): 592-611 (2020) DOI: 10.35378/gujs.654664
Gazi University
Journal of Science
http://dergipark.gov.tr/gujs
Optimizing Urban Texture and Building Typology for the Goal of Achieving
Near-Zero Mid-Rise Residential Building
Halit BEYAZTAS1,* , Gul Koclar ORAL2
1Istanbul Technical University, Graduate School of Science Engineering and Technology, 34496 Istanbul, Turkey
2Istanbul Technical University, Department of Architecture, 34437, Istanbul, Turkey
Highlights • Proposed optimized alternative achieves up to 69.1% of zero energy target.
• Urban texture has an effect up to 33.49% on building energy production performance.
• Urban texture has an effect up to 5.65% on building energy consumption performance.
Article Info
Abstract
Turkey is experiencing a massive urban renewal process to increase earthquake resistance of
building mass. As a participant of Paris Agreement, Turkey also uses this process as a tool to
improve energy saving performance of building mass with mandatory insulation requirements.
Envelope retrofits achieves energy savings; however, this massive urban renewal process offers
a greater potential since it allows a chance to optimize urban scale variables such as urban texture
and building type, as well. This paper focuses on investigating the influence of building typology
and urban texture on building energy performance. For this purpose, four different texture and
six different building type alternatives are defined in Istanbul. Energy performance simulation
analysis of 24 total alternatives are done with Existing envelope, TS-825 envelope, and proposed
Near-Zero envelopes. Results of 72 simulations show that both building type and urban texture
have important influence on building energy consumption and production performances for three
envelope alternatives. Selection of optimized building type and urban texture alternatives with
N-zero envelope maximizes building energy performance and achieve near-zero building
requirements. Another important result of the study was urban scale decisions reduces energy
consumption very significantly even before applying building design strategies. This is a very
important input for decision-makers because energy performance of a regular building can be
improved with retrofits in any time during lifetime. However, these retrofits may not be enough
to achieve full potential (net-zero in future time) of the building when urban texture and building
type is not optimized accurately.
Received: 10/12/2019
Accepted: 26/03/2020
Keywords
Urban texture
Building typology
Near-Zero energy Building energy
simulation
1. INTRODUCTION
Built environment in the world is changing slowly and securely toward sustainable form [1-3]. The speed
of change is very high in Turkey with a different motivation. Over 66% of Turkey’s population lives in
first and second-degree earthquake zones and the population increases every year [4]. Unfortunately,
existing building stock is very vulnerable to earthquake forces, which caused 597.865 heavy housing
damage and 86.802 death in Turkey since 1900 [5]. Estimations of three different institution shows that
economic cost of 1999 earthquake alone is between 12-19 billion dollars [6]. Earthquake simulation models
show that about 7.1%-8.2% of buildings would be damaged heavily in Istanbul [7]. These facts forced a
major urban renewal process and 480.000 residential unit is already renewed between 2012-2017. It is
targeted to renew total of 7.5 million residential unit in 15 years and 4 million of them is considered to be
renewed by 2023 due to risk factor [8]. In other words, this renewal process transformed and will be
transforming Turkish cities for a few decades.
Page 2
593 Halit BEYAZTAS, Gul Koclar ORAL / GU J Sci, 33(3): 592-611 (2020)
This costly but mandatory change offers Turkey great opportunities to convert its built environments and
cities to sustainable ones. There is a need for strong political will to change toward sustainable future. In
fact, Turkey is a net energy importer country and it imports over 75% of its energy [9]. Energy balance
shows that buildings consume 34.55 percent of energy in Turkey [10]. Therefore, every step toward
sustainability is very welcome by the government since it reduces energy cost. Besides, signing Paris
Climate Agreement indicates that there is also a political will to support this transformation. In fact, one
of the promises that Turkey made in the Paris Conference was to disseminate the idea of Zero-energy house
[11]. Necessary steps toward sustainability, including energy efficiency, renewable energy infrastructure,
and low carbon emission, take place in national development plans [12,13]. Simultaneously, required law
amendments is completed [14-16]. Literature evaluates the process and confirms existence of evidence
toward sustainable transformation of built environment in Turkey. In 2005, Kocabas describes this urban
renewal process as 5.period of urban regeneration in Istanbul and this period is expected to be a transient
period to sustainable urban regeneration along with disaster prevention aim [17]. By 2011, evaluation of
transition performance of Turkey to low carbon urbanization concludes that there is a positive initial steps
with supporting policies toward this goal, but it requires continues action [18]. Following up the process
to 2019, development plan of Turkey and fiscal report indicates that tax regulations on energy saving and
climate change will continue [19]. State development plan for 2019-23 highlights the importance of
sustainable urban development and lists the steps toward this goal including energy efficiency, renewable
energy production, and green building concepts [20].
Renewal process in Turkey takes place both on neighborhood and parcel scales. Literature mainly focuses
on neighborhood scale renewal, which is mainly done by TOKİ (Housing Development Administration of
Turkey). Improved living conditions of residents are considered positive outcome of the process [21,22].
Despite the disaster resistant new buildings, gentrification concerns and change of social life conditions are
considered negative consequences [23-25]. From energy standpoint, new buildings have to comply new
Turkish building insulation standard (TS-825), which is a mandatory regulation since 2008 [26]. As of
2017, 677.000 buildings complies with the energy performance requirements and 2.97% of this buildings
uses renewable energy resources [27]. In other words, reconstructed buildings are energy efficient
comparing to deconstructed ones. Besides, they generate their energy up to certain percent. Mangan and
Oral investigates energy performance of a new low income public mass housing neighborhood developed
by TOKI as a case study for different climates of Turkey. Comparing to reference building, their study of
life cycle assessment, life cycle cost, and life cycle CO2 assessment show that there are more space for cost
optimized improvements to make buildings more energy efficient [28]. A step further, Kalaycıoglu and
Yılmaz test energy performance potential of a virtual neighborhood district for nearly zero definition
against EPBD recast requirements. Simulation result of different design packages shows that almost 70%
of energy saving is possible in Eskişehir, Turkey [29]. So far, these are focused on neighborhood scale
energy performance analysis.
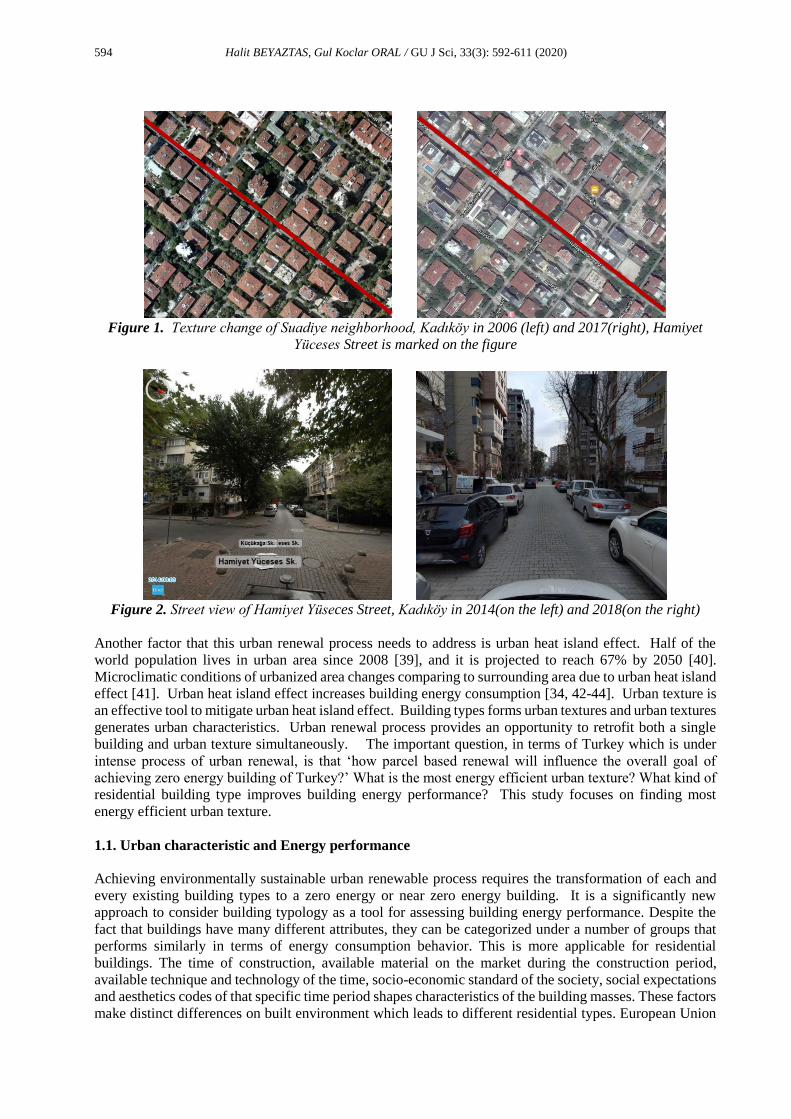
Second type renewal takes place on parcel scale, called on-site renewal (Figure 1). Local municipals are
given power to propose renewal areas to the ministry of Environment, in order to fasten renewal process.
Residents of a building in renewal areas can apply renewal process. In order to encourage urban renewal,
municipalities increase building height limits in renewal areas. As a result, old buildings are reconstructed
with add-on floors, mostly these floors finance reconstruction costs and profit of the builder. System is
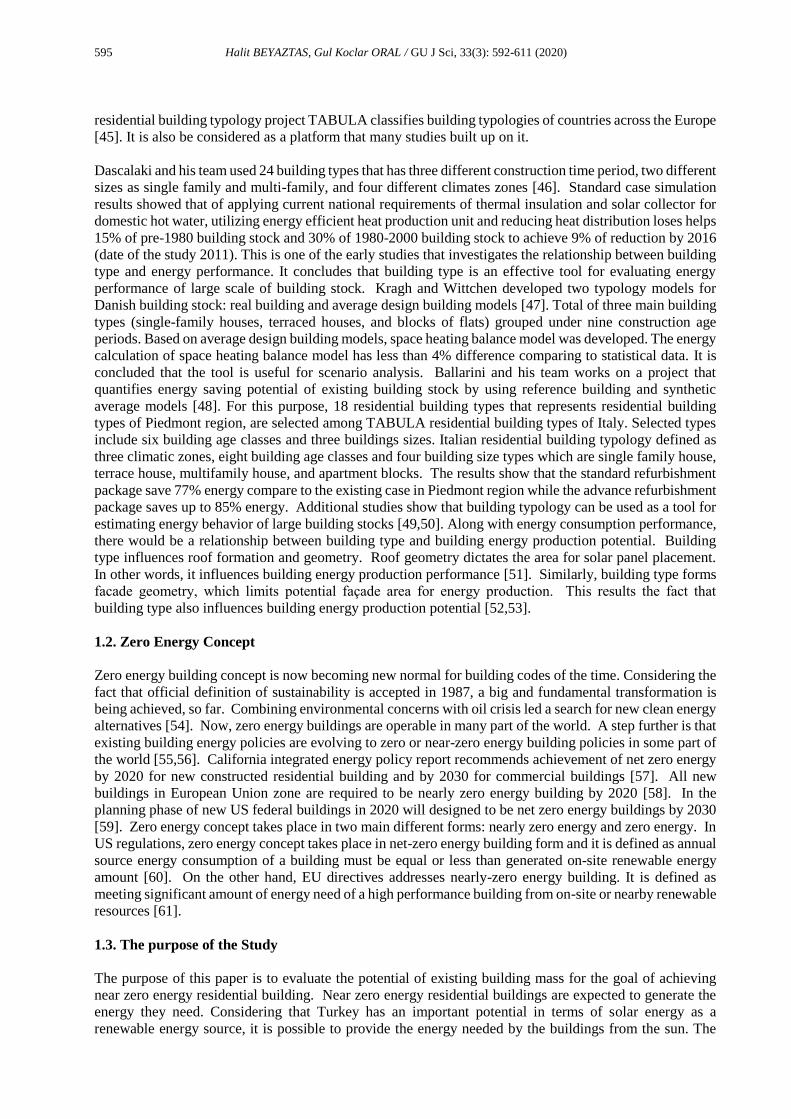
economically sustain itself. However, this changes the urban texture and identity of the area (Figure 2).
Existing apartment texture evolves to midrise buildings that forms urban canyons (Figure 2). Urban
canyons affect energy behavior of buildings. In high dense settlements, buildings may serve as obstacles
to solar radiation and daylight availability depending on the distances between them, their height and their
arrangement with respect to one another. In other words, density causes climate change in micro scale [30].
Such settlements lead to more energy consumption [31,32]. Additionally, urban density will reduce wind
circulation in the city, so buildings will be more dependent on artificial systems for air circulation and
cooling, especially the lower floors [33]. A study on 10 different canyons of Athen shows that air flow
rates may be reduced 10 times inside of an urban canyon [34]. Moreover, urban density will closely affect
renewable energy potentials of urban units [35]. Besides, it is closely related to outdoor thermal comfort
[36-38].
Page 3
594 Halit BEYAZTAS, Gul Koclar ORAL / GU J Sci, 33(3): 592-611 (2020)
Figure 1. Texture change of Suadiye neighborhood, Kadıköy in 2006 (left) and 2017(right), Hamiyet
Yüceses Street is marked on the figure
Figure 2. Street view of Hamiyet Yüseces Street, Kadıköy in 2014(on the left) and 2018(on the right)
Another factor that this urban renewal process needs to address is urban heat island effect. Half of the
world population lives in urban area since 2008 [39], and it is projected to reach 67% by 2050 [40].
Microclimatic conditions of urbanized area changes comparing to surrounding area due to urban heat island
effect [41]. Urban heat island effect increases building energy consumption [34, 42-44]. Urban texture is
an effective tool to mitigate urban heat island effect. Building types forms urban textures and urban textures
generates urban characteristics. Urban renewal process provides an opportunity to retrofit both a single
building and urban texture simultaneously. The important question, in terms of Turkey which is under
intense process of urban renewal, is that ‘how parcel based renewal will influence the overall goal of
achieving zero energy building of Turkey?’ What is the most energy efficient urban texture? What kind of
residential building type improves building energy performance? This study focuses on finding most
energy efficient urban texture.
1.1. Urban characteristic and Energy performance
Achieving environmentally sustainable urban renewable process requires the transformation of each and
every existing building types to a zero energy or near zero energy building. It is a significantly new
approach to consider building typology as a tool for assessing building energy performance. Despite the
fact that buildings have many different attributes, they can be categorized under a number of groups that
performs similarly in terms of energy consumption behavior. This is more applicable for residential
buildings. The time of construction, available material on the market during the construction period,
available technique and technology of the time, socio-economic standard of the society, social expectations
and aesthetics codes of that specific time period shapes characteristics of the building masses. These factors
make distinct differences on built environment which leads to different residential types. European Union
Page 4
595 Halit BEYAZTAS, Gul Koclar ORAL / GU J Sci, 33(3): 592-611 (2020)
residential building typology project TABULA classifies building typologies of countries across the Europe
[45]. It is also be considered as a platform that many studies built up on it.
Dascalaki and his team used 24 building types that has three different construction time period, two different
sizes as single family and multi-family, and four different climates zones [46]. Standard case simulation
results showed that of applying current national requirements of thermal insulation and solar collector for
domestic hot water, utilizing energy efficient heat production unit and reducing heat distribution loses helps
15% of pre-1980 building stock and 30% of 1980-2000 building stock to achieve 9% of reduction by 2016
(date of the study 2011). This is one of the early studies that investigates the relationship between building
type and energy performance. It concludes that building type is an effective tool for evaluating energy
performance of large scale of building stock. Kragh and Wittchen developed two typology models for
Danish building stock: real building and average design building models [47]. Total of three main building
types (single-family houses, terraced houses, and blocks of flats) grouped under nine construction age
periods. Based on average design building models, space heating balance model was developed. The energy
calculation of space heating balance model has less than 4% difference comparing to statistical data. It is
concluded that the tool is useful for scenario analysis. Ballarini and his team works on a project that
quantifies energy saving potential of existing building stock by using reference building and synthetic
average models [48]. For this purpose, 18 residential building types that represents residential building
types of Piedmont region, are selected among TABULA residential building types of Italy. Selected types
include six building age classes and three buildings sizes. Italian residential building typology defined as
three climatic zones, eight building age classes and four building size types which are single family house,
terrace house, multifamily house, and apartment blocks. The results show that the standard refurbishment
package save 77% energy compare to the existing case in Piedmont region while the advance refurbishment
package saves up to 85% energy. Additional studies show that building typology can be used as a tool for
estimating energy behavior of large building stocks [49,50]. Along with energy consumption performance,
there would be a relationship between building type and building energy production potential. Building
type influences roof formation and geometry. Roof geometry dictates the area for solar panel placement.
In other words, it influences building energy production performance [51]. Similarly, building type forms
facade geometry, which limits potential façade area for energy production. This results the fact that
building type also influences building energy production potential [52,53].
1.2. Zero Energy Concept
Zero energy building concept is now becoming new normal for building codes of the time. Considering the
fact that official definition of sustainability is accepted in 1987, a big and fundamental transformation is
being achieved, so far. Combining environmental concerns with oil crisis led a search for new clean energy
alternatives [54]. Now, zero energy buildings are operable in many part of the world. A step further is that
existing building energy policies are evolving to zero or near-zero energy building policies in some part of
the world [55,56]. California integrated energy policy report recommends achievement of net zero energy
by 2020 for new constructed residential building and by 2030 for commercial buildings [57]. All new
buildings in European Union zone are required to be nearly zero energy building by 2020 [58]. In the
planning phase of new US federal buildings in 2020 will designed to be net zero energy buildings by 2030
[59]. Zero energy concept takes place in two main different forms: nearly zero energy and zero energy. In
US regulations, zero energy concept takes place in net-zero energy building form and it is defined as annual
source energy consumption of a building must be equal or less than generated on-site renewable energy
amount [60]. On the other hand, EU directives addresses nearly-zero energy building. It is defined as
meeting significant amount of energy need of a high performance building from on-site or nearby renewable
resources [61].
1.3. The purpose of the Study
The purpose of this paper is to evaluate the potential of existing building mass for the goal of achieving
near zero energy residential building. Near zero energy residential buildings are expected to generate the
energy they need. Considering that Turkey has an important potential in terms of solar energy as a
renewable energy source, it is possible to provide the energy needed by the buildings from the sun. The
Page 5
596 Halit BEYAZTAS, Gul Koclar ORAL / GU J Sci, 33(3): 592-611 (2020)
achievement of this objective is seen as more accessible, especially in low-density rural areas and detached
houses. However, in big cities such as Istanbul in Turkey, urban textures generally consist of multi-storey
and high density structures. Considering the fact that solar panels in residential settlements are placed on
the roofs, solar energy per housing unit will decrease due to the increasing urban density, which will cause
a decrease in energy production per square meter. This increases the importance of facades for energy
production through solar panels. However, the increase in urban density and the shading of buildings will
affect building energy consumption. In addition to urban density, building typology can have an impact on
energy production and consumption potential. Therefore, an optimization study based on the energy
consumption and production performance of the existing building mass is an important need for energy
efficient and sustainable urban planning. Such studies become necessary for Turkey and especially in the
rapidly changing due to the large urban building stock renewal process that took place in Istanbul and
converted to a system of sustainable urban texture.
2. METHODOLOGY
This study aims to examine the relationship between urban texture and building energy
consumption/production performance in order to maximize near zero energy potential of buildings and
communities. Istanbul is selected as study area because of high number of building stock and rapid urban
transformation activities. Existing urban texture and existing residential multifamily building typologies
are investigated. Result of the investigation formed reference urban textures and reference residential
building types. Reference buildings and textures are modeled with Openstudio software and EnergyPlus
building energy simulation engine were used for energy calculations. Pilot studies showed that cost
optimized zero energy high-rise multifamily residential building target is not possible with current
technology; therefore, this study aims to focus on achievement target of cost optimized near zero
multifamily building by following Energy Performance of Building Directive (EPBD) protocol of European
Union [61]. Methodology section consists of four subsections: defining reference urban texture, defining
reference building, near zero energy envelope alternative, and energy production. The detailed steps of the
study are described below.
2.1. Defining Urban Texture
Defining current urban texture is one of the important parts of this study because there is not a detailed
study that identifies existing urban textures of Istanbul. Istanbul is a very historical, dense, and big city;
therefore, identifying existing urban textures of Istanbul is very difficult. Besides, the shanty settlement
problem as a result of inner migration formed an undefined texture throughout Istanbul. The planning
department of the city categories the existing urban texture under four main groups: historical texture,
planned/organized texture, unplanned/unorganized texture(shanty settlements), and mass housing [62]. In
this research, "planned/organized texture" is studied. The boundary of Kadıköy municipality includes good
examples of planned urban textures. Thirty different street samples were studied in order to identify
existing urban textures in Kadıköy. It is discovered that, depending on the building regulations of
construction time, there are differences in building heights and the distance between neighboring buildings.
However, a relationship is identified between the height and the distances to neighbor buildings. Despite
the fact that the number of floors are varying, there are a big number of high-rise buildings, most of them
are newer buildings with around 12-story building height. Therefore, 12-story (36.5 meters) was
determined as reference building height for simulation model. Distances are varying between neighbor
buildings, as well. The distance to neighbor building across the street (w1) is between 16m and 28.5 meters
while the distance to neighbor building across the back yard (w2) is between 16m and 55.5 meters. It is
identified that there are three kind of relationship between w1 and w2 values. The relationships are w1=w2
(which is named as small yard), 1.5w1=w2 (which is named as medium yard), and 2w1=w2 (which is
named as large yard). The small and large yards are presented in Table 1.
28.5m >= w1 >= 16m , (1)
55.5m >= w2 >= 16m , (2)
Page 6
597 Halit BEYAZTAS, Gul Koclar ORAL / GU J Sci, 33(3): 592-611 (2020)
Ratio = {h/w1|28.5m >= w1 >= 16m} , (3)
h/w1 = {1.3, 1.4, 1.5, . . . , and 2.3}. (4)
In Equation (1), w1 stands for measured distance to neighbor building across the street. In Equation (2), w2
stands for measured distance to neighbor building across the backyard. The minimum and maximum
distance of w1 and w2 is defined based on street data. In Equation (3), h refers to the building height, which
is 36.5 meters. In Equation (4), possible h/w1 ratios are defined.
Table 1. Identifying all possible w1 and w2 distances based on h/w1 ratios h/w1
1.3 1.4 1.5 1.6 1.7 1.8 1.9 2 2.1 2.2 2.3
w1 = w2
(Small Yard)
w1 28m 26 24 23 21 20 19 18 17 17 16m
w2 28m 26 24 23 21 20 19 18 17 17 16m
1.5 w1 = w2
(Mid. Yard)
w1 28 26 24 23 21 20 19 18 17 17 16
w2 42 39 37 34 32 30 29 27 26 25 24
2 w1 = w2
(Large Yard)
w1 28m 26 24 23 21 20 19 18 17 17 16m
w2 56m 52 49 46 43 41 38 37 35 33 32m
All possible distances between buildings calculated and 30 different w1 and w2 combinations presented in
Table 1. In this study, minimum (1.3) and maximum (2.3) h/w1 ratios for small and large yard alternatives
will be focused (marked on the table above). In order to simplify, each distance type named as A, B, C,
and D-distances and illustrated in Table 2.
Table 2. Texture Characteristics Type h/w1 Ratio w2/w1 Ratio
A-distance 2.3 (minimum) 1 (Small Yard)
B-distance 1.3 (maximum) 1 (Small Yard)
C-distance 2.3 (minimum) 2 (Large Yard)
D-distance 1.3 (maximum) 2 (Large Yard)
2.2. Defining Residential Building Types
Evaluation of residential building types results that four common building types exist in Istanbul. Identified
main building types could be defined as single standing (Single S.) apartment building which has an
apartment on each floor, twin apartment(Twin) building which has two apartments on each floor, quadruple
(Quad.) apartment building has four apartments on each floor, and row apartment (Row) buildings which
has an apartment on each floor (Figure 3).
Figure 3. Illustration of building types: Row apartment (A) Single Standing (B) Twin(C) and
Quadruple apartment buildings (D)
Buildings are oriented on cardinal directions; therefore, minimum a façade directed to the South. Each
apartment has windows on two facades at least. For Twin apartment buildings, three different window
orientation alternatives was developed: Twin-1: South and North, Twin-2: South, East, and West, Twin-3:
South, North, and East or West. Only Twin-3 apartment units have windows on three facades (Table 3).
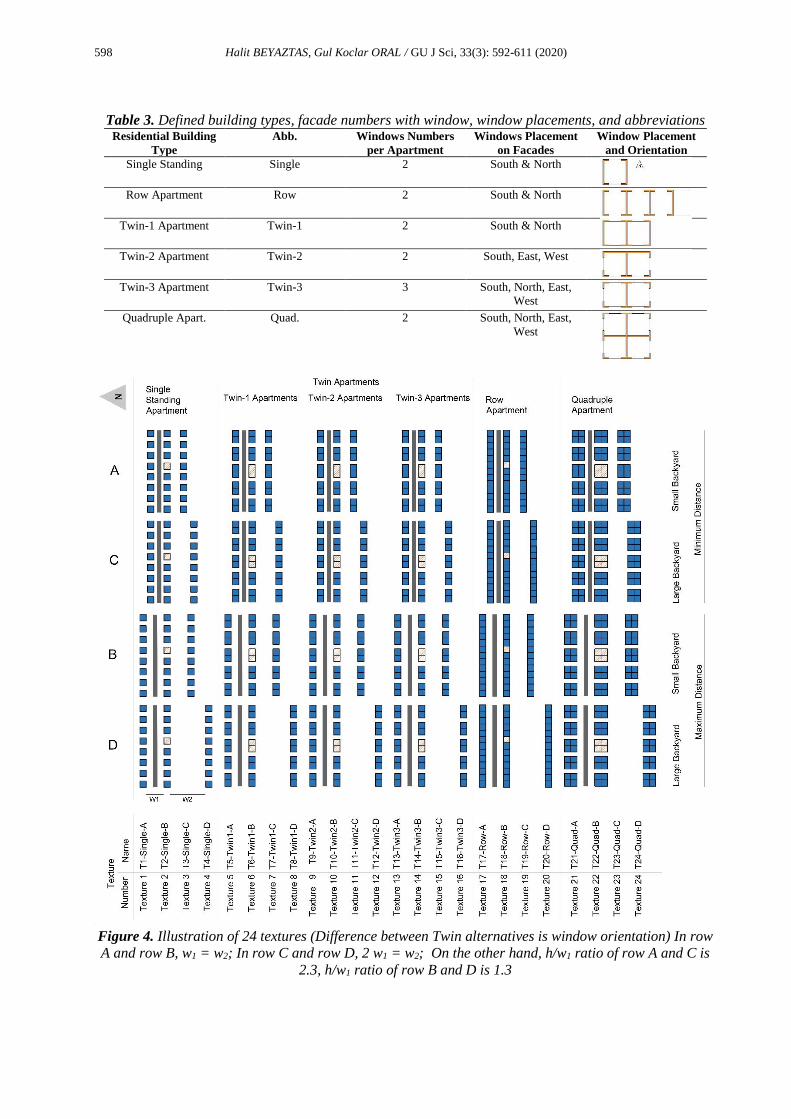
As a result, six different building types identified and there are four different distance combination
alternatives for each type. In total, 24 different urban textures identified. Each building type will be
simulated for four different distance combinations (Figure 4).
Page 7
598 Halit BEYAZTAS, Gul Koclar ORAL / GU J Sci, 33(3): 592-611 (2020)
Table 3. Defined building types, facade numbers with window, window placements, and abbreviations Residential Building
Type
Abb. Windows Numbers
per Apartment
Windows Placement
on Facades
Window Placement
and Orientation
Single Standing Single 2 South & North
Row Apartment Row 2 South & North
Twin-1 Apartment Twin-1 2 South & North
Twin-2 Apartment Twin-2 2 South, East, West
Twin-3 Apartment Twin-3 3 South, North, East,
West Quadruple Apart. Quad. 2 South, North, East,
West
Figure 4. Illustration of 24 textures (Difference between Twin alternatives is window orientation) In row
A and row B, w1 = w2; In row C and row D, 2 w1 = w2; On the other hand, h/w1 ratio of row A and C is
2.3, h/w1 ratio of row B and D is 1.3
Page 8
599 Halit BEYAZTAS, Gul Koclar ORAL / GU J Sci, 33(3): 592-611 (2020)
2.3. Defining Reference Building
Reference building is a sample building that represents a large number of buildings. Therefore, it is a very
useful tool to understand energy consumption behavior of large building stocks. Sufficiency of available
statistical data determines the type of reference building, which could be a virtual model or a sample
building. TABULA (Typology Approach for Building Stock Energy Assessment) project of European
Union generates building typologies for each EU country [63]. In other words, the system defines reference
buildings for each country. Unfortunately, Turkey is not a part of TABULA system but the existing
statistical data helps to build up a framework of a virtual reference building. Virtual models used in several
energy performance studies [29,64]. TABULA system and other studies in the literature mainly categorize
buildings as building age, construction type, heating system and building geometry (form, size, etc.) [65].
These four categories will be used to define a reference building in Istanbul. The order is building age,
construction type and material, building geometry definition, and HVAC system type definition.
Building age is the first parameter on defining reference building. Around 20% of Turkish residential units
are located in Istanbul. Construction age of building stock for Istanbul and Turkey is presented in Table 4.
Unknown category in the table would probably represent old village houses in rural areas, which is beyond
the scope of this study. However, according to statistical data, significant percent of buildings are
constructed since 1960s. Between 1961- 2011, 87.7% of building stock constructed in Istanbul and it is
84.6% for Turkey (Table 4). Moreover, important percent of this building stock is constructed after 1980s
In other words, Turkey has a significantly young building stock. Due to inner migration, majority of
building stock constructed lately in order to respond sheltering need quickly. Therefore, building age does
not reveal very significant difference since construction technique and building characteristics did not
changed very much in this period. However, it should be noted that building insulation regulation became
mandatory in 2008. The effect of this regulation is investigated below construction and material subsection.
Table 4. Construction age of building stock (%) [66] Unknown Before 1960 1961-70 1971-80 1981- 90 1991- 00 2001-11 1961- 2011
Turkey 11.3 4.2 5.9 13.4 18.9 24.6 21.8 84.6
Istanbul 10.2 2.1 5.1 14.5 21.1 29.1 17.9 87.7
Construction type and material is the second parameter on defining reference building. Construction type
of residential buildings in Istanbul and Turkey are presented below (Figure 5) [66]. Eight different types
are listed. Concrete frame structure with brick envelope is a very common construction type. 95.7% of
building stock of Istanbul and 79.4% of Turkish building stock have this type construction. Brick envelope
consists of brick exterior wall covered with interior and exterior cement plaster. Old windows used to be
wooden frame with single glass; however, these windows were replaced with PVC frame with double
glazed windows for energy efficiency since early 2000s.
Figure 5. Construction material distribution of building stock of Istanbul (up to 2000) [66]
Prior to 2000s, many buildings did not have any insulation layer. New buildings have to meet TS-825
(Building Insulation Regulation) requirement. TS-825 defines the limits of U-values for five climate zones
of Turkey [26]. Istanbul is located in Zone-2. In Zone-2, required maximum U-value for envelope wall is
0.57 (W/m²K), foundation u-value is 0.38 (W/m²K), roof U-value is 0.57 (W/m²K), and window U-value
0,0
20,0
40,0
60,0
80,0
100,0
120,0
Steel sheet Reinforcedconcrete…
Hollowconcrete…
Brick Wood Stone Sun driedbrick
Other Unknown
%
Material Type
Construction Material of Building Stock Istanbul Turkey
Page 9
600 Halit BEYAZTAS, Gul Koclar ORAL / GU J Sci, 33(3): 592-611 (2020)
is 1.8 (W/m²K). In other words, although construction type does not change significantly, there are two
different envelope characteristic in terms of energy performance: Existing envelope and TS-825 standard
compliance envelope. The only difference is that TS-825 envelope has additional envelope layer. To sum
up, current building stock has two different envelope types: a) Existing envelope which has no insulation
layer and b) TS-825 compliant envelope.
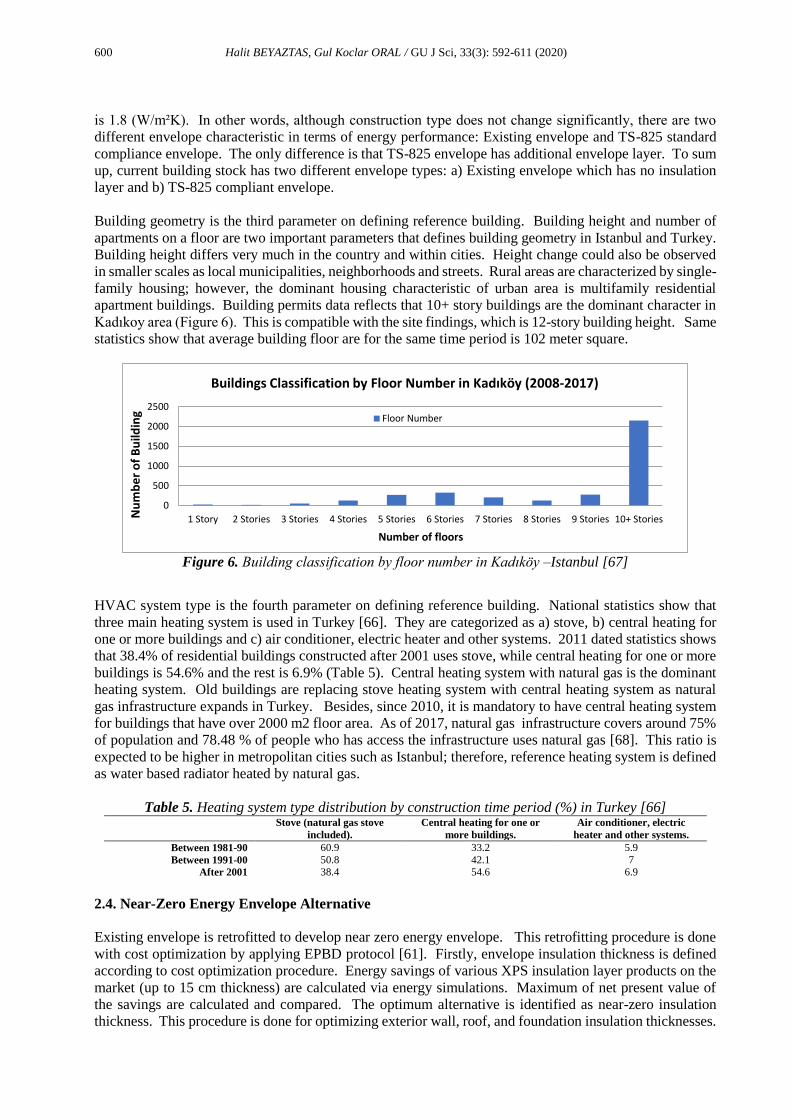
Building geometry is the third parameter on defining reference building. Building height and number of
apartments on a floor are two important parameters that defines building geometry in Istanbul and Turkey.
Building height differs very much in the country and within cities. Height change could also be observed
in smaller scales as local municipalities, neighborhoods and streets. Rural areas are characterized by single-
family housing; however, the dominant housing characteristic of urban area is multifamily residential
apartment buildings. Building permits data reflects that 10+ story buildings are the dominant character in
Kadıkoy area (Figure 6). This is compatible with the site findings, which is 12-story building height. Same
statistics show that average building floor are for the same time period is 102 meter square.
Figure 6. Building classification by floor number in Kadıköy –Istanbul [67]
HVAC system type is the fourth parameter on defining reference building. National statistics show that
three main heating system is used in Turkey [66]. They are categorized as a) stove, b) central heating for
one or more buildings and c) air conditioner, electric heater and other systems. 2011 dated statistics shows
that 38.4% of residential buildings constructed after 2001 uses stove, while central heating for one or more
buildings is 54.6% and the rest is 6.9% (Table 5). Central heating system with natural gas is the dominant
heating system. Old buildings are replacing stove heating system with central heating system as natural
gas infrastructure expands in Turkey. Besides, since 2010, it is mandatory to have central heating system
for buildings that have over 2000 m2 floor area. As of 2017, natural gas infrastructure covers around 75%
of population and 78.48 % of people who has access the infrastructure uses natural gas [68]. This ratio is
expected to be higher in metropolitan cities such as Istanbul; therefore, reference heating system is defined
as water based radiator heated by natural gas.
Table 5. Heating system type distribution by construction time period (%) in Turkey [66] Stove (natural gas stove
included).
Central heating for one or
more buildings.
Air conditioner, electric
heater and other systems.
Between 1981-90 60.9 33.2 5.9
Between 1991-00 50.8 42.1 7
After 2001 38.4 54.6 6.9
2.4. Near-Zero Energy Envelope Alternative
Existing envelope is retrofitted to develop near zero energy envelope. This retrofitting procedure is done
with cost optimization by applying EPBD protocol [61]. Firstly, envelope insulation thickness is defined
according to cost optimization procedure. Energy savings of various XPS insulation layer products on the
market (up to 15 cm thickness) are calculated via energy simulations. Maximum of net present value of
the savings are calculated and compared. The optimum alternative is identified as near-zero insulation
thickness. This procedure is done for optimizing exterior wall, roof, and foundation insulation thicknesses.
0
500
1000
1500
2000
2500
1 Story 2 Stories 3 Stories 4 Stories 5 Stories 6 Stories 7 Stories 8 Stories 9 Stories 10+ StoriesNu
mb
er
of
Bu
ildin
g
Number of floors
Buildings Classification by Floor Number in Kadıköy (2008-2017)
Floor Number
Page 10
601 Halit BEYAZTAS, Gul Koclar ORAL / GU J Sci, 33(3): 592-611 (2020)
Secondly, same procedure used for defining optimum glazing alternative. Five different glazing
alternatives are used: double glazed with air, double glazed with argon, triple glazed with air, triple glazed
with argon (in single gap), and triple glazed with argon (in two gaps). The optimum alternative is defined
as triple glazed with argon (in two gaps). Lighting system is retrofitted with LED lighting system. Heating
system is not changed because existing heating system in the country significantly new and average system
on the market is used. Heating system is water-based radiator with natural gas heated. System performance
of defined HVAC system is retrofitted to 4.5 COP. Lastly, exterior venation window blind is includes in
south façade of near-zero building alternative. All envelope characteristics, including near-zero one, are
documented in Table 6.
Table 6. Summary table of three different envelope characteristics and retrofits (Near-0 envelope is
developed according to EPBD protocol [61])
Existing Envelope TS-825 Envelope Near-0 Envelope
Envelope Insulation Thickness
and U-values Uwall: 1.30; No Insulation Uwall: 0.57; 3 cm XPS (0.03 w/m-
K) Uwall: 0.244; 10 cm XPS (0.03 w/m-K)
Uroof: 2.1; No Insulation Uroof: 0.38; 10 cm Rockwool
(0.04 w/m-K)
Uroof: 0.277; 14 cm Rockwool
(0.04 w/m-K)
Ufoundation: 1.70; No Insulation Ufound.: 0.57; 4cm XPS (0.04
w/m-K)
Ufoundation: 0.57; 4 cm XPS
(0.04 w/m-K)
Glass Type
U: 1.8 w/m2K; 0.598 SHGC; 0.769 Tvis
U: 1.8 w/m2K; 0.598 SHGC; 0.769 Tvis
U: 0.799 w/m2K; 0.474 SHGC; 0.661 Tvis
Lighting Level Fluorescent: 10.76 w/m2 Fluorescent. 10.76 w/m2 LED: 4.39 w/m2
Heating Type Gas Heated Water Based Rad. Gas Heated Water Based Radiator Gas Heated Water Based Radiator
Cooling Type HVAC Air Conditioner HVAC Air Conditioner HVAC Air Conditioner (4.5 COP)
Orientation South South South
Glazing Ratio 30% 30% 30%
- - Exterior Venetian Blind Shading
2.5. Energy Production
Turkey has important potential of solar energy, solar energy is the most convenient way to generate energy
in a high dense urban environment. Therefore, solar panels are used for energy production. Each panel
has 17.3% module efficiency, which is highest performing one on the local market by the time. PV panels
places on the south facing side of the roof and direct sun exposed part of the South, East and West facades
on the date of June 21. By following described methodology and using listed inputs above, amount of site
energy consumption and productions are calculated and compared. Since the source energy conversion
factor various in each county, first site energy consumption and production is calculated and analyzed.
Then, site energy consumptions of the least and highest performing alternatives are converted to source
energy consumptions. Source energy conversation factor for natural gas is 1 and for electricity 2.36 in
Turkey [69]. Results and analysis are presented in detail below.
3. RESULTS and ANALYSIS
This part presents the results of simulations and analysis of the findings. The simulation was performed via
EnergyPlus simulation software. Energy consumption and production results are provided below.
Energy consumption results of all 24 urban textures which are made of six different building types are
presented in Figure 7. Building types are simulated under small and large yard (w2=2w1) alternatives. For
each yard alternative, minimum (1.3) and maximum (2.3) h/w1 ratios simulated. In order to simplify, each
building type subcategorized as A, B,C, and D-distances. Each urban textures are simulated for three
different building envelopes: TS-825, Near-0, and Existing envelope.
Page 11
602 Halit BEYAZTAS, Gul Koclar ORAL / GU J Sci, 33(3): 592-611 (2020)
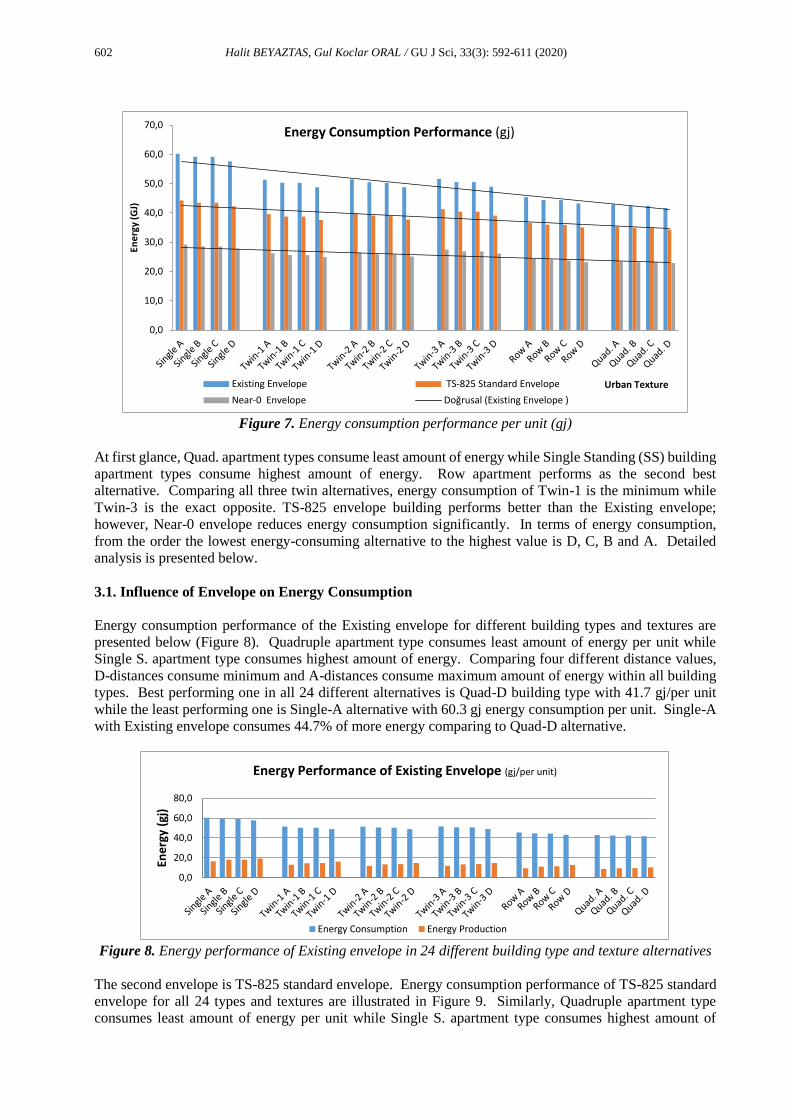
Figure 7. Energy consumption performance per unit (gj)
At first glance, Quad. apartment types consume least amount of energy while Single Standing (SS) building
apartment types consume highest amount of energy. Row apartment performs as the second best
alternative. Comparing all three twin alternatives, energy consumption of Twin-1 is the minimum while
Twin-3 is the exact opposite. TS-825 envelope building performs better than the Existing envelope;
however, Near-0 envelope reduces energy consumption significantly. In terms of energy consumption,
from the order the lowest energy-consuming alternative to the highest value is D, C, B and A. Detailed
analysis is presented below.
3.1. Influence of Envelope on Energy Consumption
Energy consumption performance of the Existing envelope for different building types and textures are
presented below (Figure 8). Quadruple apartment type consumes least amount of energy per unit while
Single S. apartment type consumes highest amount of energy. Comparing four different distance values,
D-distances consume minimum and A-distances consume maximum amount of energy within all building
types. Best performing one in all 24 different alternatives is Quad-D building type with 41.7 gj/per unit
while the least performing one is Single-A alternative with 60.3 gj energy consumption per unit. Single-A
with Existing envelope consumes 44.7% of more energy comparing to Quad-D alternative.
Figure 8. Energy performance of Existing envelope in 24 different building type and texture alternatives
The second envelope is TS-825 standard envelope. Energy consumption performance of TS-825 standard
envelope for all 24 types and textures are illustrated in Figure 9. Similarly, Quadruple apartment type
consumes least amount of energy per unit while Single S. apartment type consumes highest amount of
0,0
10,0
20,0
30,0
40,0
50,0
60,0
70,0En
erg
y (G
J)
Urban Texture
Energy Consumption Performance (gj)
Existing Envelope TS-825 Standard Envelope
Near-0 Envelope Doğrusal (Existing Envelope )
0,0
20,0
40,0
60,0
80,0
Ene
rgy
(gj)
Energy Performance of Existing Envelope (gj/per unit)
Energy Consumption Energy Production
Page 12
603 Halit BEYAZTAS, Gul Koclar ORAL / GU J Sci, 33(3): 592-611 (2020)
energy. Comparing four different distance values presented similar results with Existing envelope. The
best performing one in all 24 different alternatives is Quad-D building type with 44.3 gj/per unit, compare
to Existing envelope performance of 60.3 gj energy consumption per unit. The least performing TS-825
envelope one is Single-A alternative with 34.4 gj energy consumption per unit, compare to Existing
envelope performance of 41.7 gj energy consumption per unit. In TS-825 envelopes, Single-A consumes
28.9% of more energy comparing to Quad-D alternative.
Figure 9. Energy performance of TS-825 envelope in 24 different building type and texture alternatives
The last one is Near-0 envelope. Energy consumption performance of Near-0 envelope for all alternatives
are presented in Figure 10. The order of energy consumption for building types and distances resulted very
similar to Existing envelope and TS-825 envelopes. Quadruple apartment type consumes least amount of
energy per unit while Single S. apartment type consumes highest amount of energy. Comparing four
different distance values, D-distance consumes minimum and A-distance consumes maximum amount of
energy within all building types. Best performing Near-0 one in all 24 different alternatives is Quad-D
building type with 22.9 gj/per unit, compare to TS-825 envelope performance of 44.3 gj/per unit energy.
The least performing one is Single-A alternative with 29.2 gj energy consumption per unit, compare to TS-
825 envelope performance of 34.3 gj/per unit energy. Single-A texture with Near-0 envelope consumes
27.3% of more energy comparing to Quad-D alternative.
Figure 10. Energy performance of Near-Zero envelope in 24 different building type and texture
alternatives
Detailed results of retrofitting Existing envelope to TS-825 and Near-0 envelopes summarized in Figure
11. The presented results for building types are the average value of four different distance alternatives (A,
B, C, & D). Near-0 envelope Quadruple apartment consumes 23.18 gj/per unit energy which is the most
conservative alternative while Near-0 envelope Single standing apartment consumes 28.51 gj/per unit.
The performance of retrofitted envelopes is compared with Existing envelopes. It is found that retrofits can
save up to 51.7% energy. Although retrofits saved energy in all types of buildings, the saving rates within
Single Standing apartment type is the highest. In this type, retrofitting Existing envelope to Near-0 saved
51.7% of energy while retrofitting it to TS-825 envelope saved to 26.6% of energy. However, retrofitting
0,0
10,0
20,0
30,0
40,0
50,0
Ene
rgy
(gj)
Energy Performance of TS-825 Standard Envelope (gj/per unit)
Energy Consumption Energy Production
0,0
10,0
20,0
30,0
40,0
Energy Performance of Near-Zero Envelope (gj/per unit)
Energy Consumption Energy Production
Page 13
604 Halit BEYAZTAS, Gul Koclar ORAL / GU J Sci, 33(3): 592-611 (2020)
Existing envelope of Quad. apartment to Near-0 saved 45.2% of energy while retrofitting it to TS-825
envelope saved to 17.7% of energy.
Figure 11. Average energy consumption of different building types and urban textures (Quadruple
indicates the average energy consumption of Quadruple-A, B, C, & D for three different envelopes)
3.2. Influence of Urban Texture on Energy Consumption
In order to better understanding about the influence of urban texture on building energy consumption,
energy consumption difference in all building types examined for each envelope types. Comparing best
and worst performing of all 24 texture alternatives regardless of building type, a residential unit of Single-
A consumes 60.25 gj and a residential unit of Quad-D consumes 41.65 gj/per unit. In other words, Single-
A alternative consumes 44.66% more energy comparing to Quad-D with Existing envelope. Retrofitting
Existing envelope to TS-825 standard results a change in the influence of urban texture on energy
consumption performance. With TS-825 envelope, a unit of Single-A consumes 44.7 gj while a Quad-D
residential unit consumes 34.35 gj/per unit. This means, a Single-A residential alternative consumes 28.9%
more energy comparing to Quad-D. Retrofitting TS-825 standard envelope to Near-0 proposal results also
significant amount of reduction in energy consumption. A unit of Single-A consumes 29.16 gj/per unit
while a Single-D residential unit consumes 22.9 gj/per unit energy. In here, Single-A consumes 27.34%
more than Quad-D. These results clearly show that urban texture has a significant influence on energy
consumption performance in all envelope alternatives.
In other words, retrofitting Existing envelope to TS-825 standard resulted a reduction from 44.6% to 28.9%
in the difference while the retrofitting TS-825 standard to Near-0 proposal resulted also a reduction from
28.9% to 27.34%. Although the influence of urban texture on building energy consumption decreased with
the envelope retrofits, it still generates 27.3% difference in energy consumption which is a significant
number. The comparison until this point includes each and every building types and different w1/w2 and
h/w1 ratios. The results show that Quadruple apartment building type with large yard (w2/w1=2) and
h/w1=2.3 performs best in terms energy consumption, while Single standing apartment building type with
small yard (w1/w2=1) and h/w1=1.3 performs worst in all three envelope alternatives. Despite the fact that
Quadruple apartment consumes minimum amount of energy, it is not wise to expect future cities or future
of Istanbul consist of a certain residential type in a single urban texture.
Energy performance is not the only determent on housing choice. People always wants alternatives that
reflects themselves. Some people may not want to live in a crowded apartment building or other may prefer
to live in only south facing apartments. Therefore, it is important to understand each and every building
types and their performance in different textures (w1/w2) and (h/w1). Changing envelope also changes the
energy consumption difference in each building types. Besides, change of texture also changes, the energy
performance in each building types. It is obvious that energy consumption difference is minimum in Quad.
apartment types with 2.46% in Near-0 alternative. The maximum energy consumption difference is Twin-
3 apartment alternative with 5.65 percent. The detailed difference showed in Figure 12.
0,0
20,0
40,0
60,0
80,0
Single Standing Twin-1 Twin-2 Twin-3 Row Apartment Quadruple
Average Energy Consumption (gj/per unit)
Existing TS-825 Near-0
Page 14
605 Halit BEYAZTAS, Gul Koclar ORAL / GU J Sci, 33(3): 592-611 (2020)
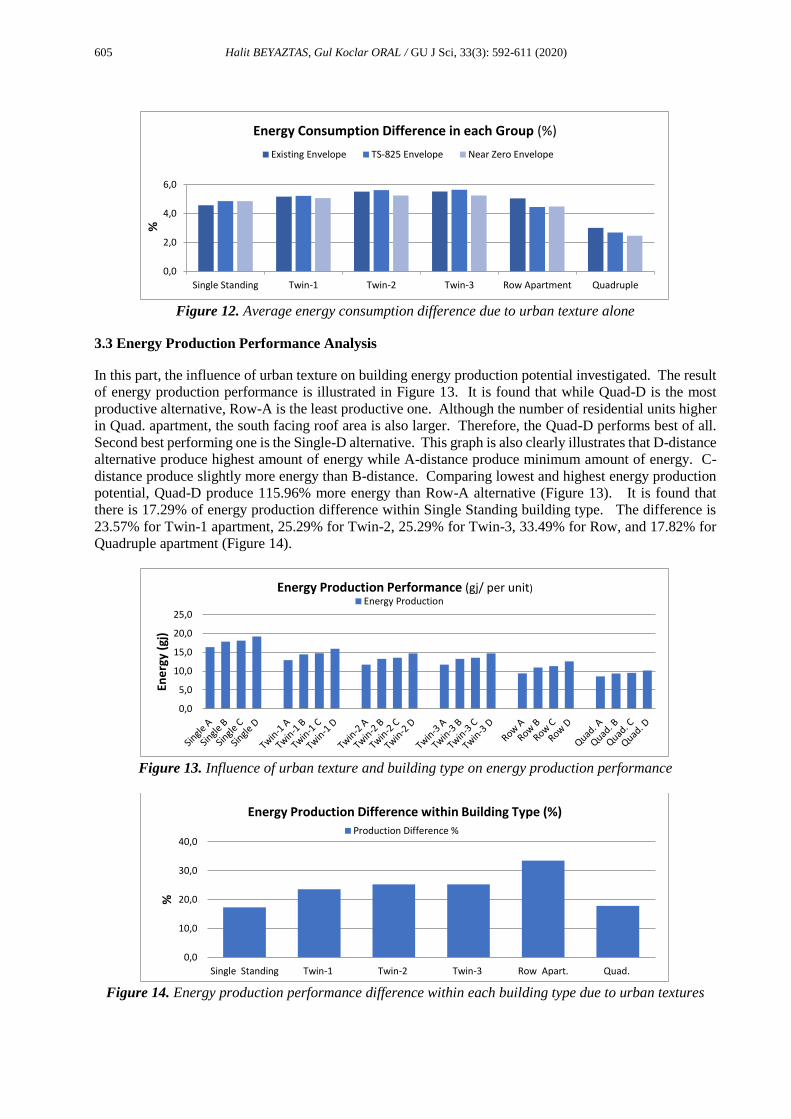
Figure 12. Average energy consumption difference due to urban texture alone
3.3 Energy Production Performance Analysis
In this part, the influence of urban texture on building energy production potential investigated. The result
of energy production performance is illustrated in Figure 13. It is found that while Quad-D is the most
productive alternative, Row-A is the least productive one. Although the number of residential units higher
in Quad. apartment, the south facing roof area is also larger. Therefore, the Quad-D performs best of all.
Second best performing one is the Single-D alternative. This graph is also clearly illustrates that D-distance
alternative produce highest amount of energy while A-distance produce minimum amount of energy. C-
distance produce slightly more energy than B-distance. Comparing lowest and highest energy production
potential, Quad-D produce 115.96% more energy than Row-A alternative (Figure 13). It is found that
there is 17.29% of energy production difference within Single Standing building type. The difference is
23.57% for Twin-1 apartment, 25.29% for Twin-2, 25.29% for Twin-3, 33.49% for Row, and 17.82% for
Quadruple apartment (Figure 14).
Figure 13. Influence of urban texture and building type on energy production performance
Figure 14. Energy production performance difference within each building type due to urban textures
0,0
2,0
4,0
6,0
Single Standing Twin-1 Twin-2 Twin-3 Row Apartment Quadruple
%
Energy Consumption Difference in each Group (%)
Existing Envelope TS-825 Envelope Near Zero Envelope
0,0
5,0
10,0
15,0
20,0
25,0
Ene
rgy
(gj)
Energy Production Performance (gj/ per unit)Energy Production
0,0
10,0
20,0
30,0
40,0
Single Standing Twin-1 Twin-2 Twin-3 Row Apart. Quad.
%
Energy Production Difference within Building Type (%)
Production Difference %
Page 15
606 Halit BEYAZTAS, Gul Koclar ORAL / GU J Sci, 33(3): 592-611 (2020)
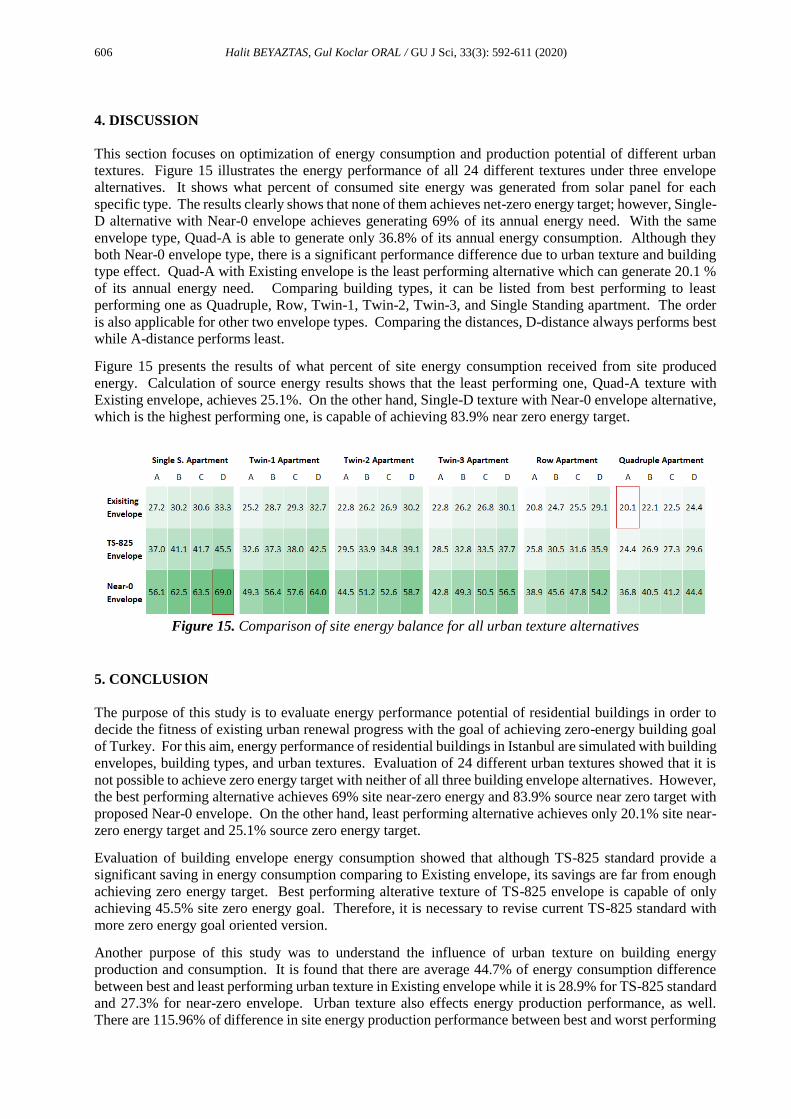
4. DISCUSSION
This section focuses on optimization of energy consumption and production potential of different urban
textures. Figure 15 illustrates the energy performance of all 24 different textures under three envelope
alternatives. It shows what percent of consumed site energy was generated from solar panel for each
specific type. The results clearly shows that none of them achieves net-zero energy target; however, Single-
D alternative with Near-0 envelope achieves generating 69% of its annual energy need. With the same
envelope type, Quad-A is able to generate only 36.8% of its annual energy consumption. Although they
both Near-0 envelope type, there is a significant performance difference due to urban texture and building
type effect. Quad-A with Existing envelope is the least performing alternative which can generate 20.1 %
of its annual energy need. Comparing building types, it can be listed from best performing to least
performing one as Quadruple, Row, Twin-1, Twin-2, Twin-3, and Single Standing apartment. The order
is also applicable for other two envelope types. Comparing the distances, D-distance always performs best
while A-distance performs least.
Figure 15 presents the results of what percent of site energy consumption received from site produced
energy. Calculation of source energy results shows that the least performing one, Quad-A texture with
Existing envelope, achieves 25.1%. On the other hand, Single-D texture with Near-0 envelope alternative,
which is the highest performing one, is capable of achieving 83.9% near zero energy target.
Figure 15. Comparison of site energy balance for all urban texture alternatives
5. CONCLUSION
The purpose of this study is to evaluate energy performance potential of residential buildings in order to
decide the fitness of existing urban renewal progress with the goal of achieving zero-energy building goal
of Turkey. For this aim, energy performance of residential buildings in Istanbul are simulated with building
envelopes, building types, and urban textures. Evaluation of 24 different urban textures showed that it is
not possible to achieve zero energy target with neither of all three building envelope alternatives. However,
the best performing alternative achieves 69% site near-zero energy and 83.9% source near zero target with
proposed Near-0 envelope. On the other hand, least performing alternative achieves only 20.1% site near-
zero energy target and 25.1% source zero energy target.
Evaluation of building envelope energy consumption showed that although TS-825 standard provide a
significant saving in energy consumption comparing to Existing envelope, its savings are far from enough
achieving zero energy target. Best performing alterative texture of TS-825 envelope is capable of only
achieving 45.5% site zero energy goal. Therefore, it is necessary to revise current TS-825 standard with
more zero energy goal oriented version.
Another purpose of this study was to understand the influence of urban texture on building energy
production and consumption. It is found that there are average 44.7% of energy consumption difference
between best and least performing urban texture in Existing envelope while it is 28.9% for TS-825 standard
and 27.3% for near-zero envelope. Urban texture also effects energy production performance, as well.
There are 115.96% of difference in site energy production performance between best and worst performing
Page 16
607 Halit BEYAZTAS, Gul Koclar ORAL / GU J Sci, 33(3): 592-611 (2020)
one. This study clearly shows that urban texture has very significant influence on not only building energy
consumption but also production performance in all building envelope types. Since Turkey is in the middle
of a massive urban renewal process, along with building envelope, optimization of urban texture is also a
very high potential for both energy savings and energy production point of views.
This study focuses on energy reduction and production with urban texture, energy production, building
envelope, and lighting retrofits because they are mainly focus area of building design. Although these
retrofits are not enough to achieve net-zero energy building target, it is proven a building can get 69.1%
percent closer to site near-zero energy goal and 83.9% source near zero energy. There are also other ways
to reduce energy consumption such as utilizing district heating systems. Additionally, potentials of wind
and geothermal energy would extent achievement of zero energy target.
It should be noted that modifying urban texture comes with possible outcomes from urban transportation
energy perspective. For a healthy conclusion when deciding energy efficient urban texture in Istanbul,
building energy and transportation energy performances must optimized together. This study focused on
building energy performance part, there is a potential for following studies to work on the relationship
between urban texture and urban transportation performance.
CONFLICTS OF INTEREST
No conflict of interest was declared by the authors.
REFERENCES
[1] Becchio, C., Corgnati, S. P., Delmastro, C., Fabi, V., Lombardi, P., “The role of nearly-zero energy
buildings in the transition towards Post-Carbon Cities”, Sustain. Cities Soc., 27:324–337, (2016).
[2] https://www.iea-shc.org/data/sites/1/publications/t40a52-dc-tr1-30-net-zebs.pdf. Access date:
10.12.2018.
[3] Belussi, L., Barozzi, B., Bellazzi, A., Danza, L., Devitofrancesco, A., Fanciulli, C., Ghellere, M.,
Guazzi, G., Meroni, I., Salamone, F., Scamoni, F., Scrosati, C., “A review of performance of zero
energy buildings and energy efficiency solutions”, J. Build. Eng., 25: 100772, (2019).
[4] Birinci, F., “Regulations and Fiscal Policy Factors (in term of Earthquake and Building Stock)
Complicate Urban Renewal in Turkey (in Turkish)”, Proceedings of the II.Turkey Earthquake and
Seismology Conference, Hatay, Turkey, 2:3–13, (2013)
[5] AFAD, “Disaster Management and Natural Disaster Statistics in Turkey”, Turkey Disaster and
Emergency Management Authority, Ankara, 46-47, (2018).
[6] Bibbee, A., Gönenç, R., Jacobs, S., Konvitz, J., Price, R, “Economic Effects of the 1999 Turkish
Earthquakes: An Interim Report”, Organisation for Economic Co-operation and Development,
(2000).
[7] Pacific Consultants International / OYO Corporation, “The Study on A Disaster Prevention /
Mitigation Basic Plan In Istanbul Including Microzonation In The Republic of Turkey”, Istanbul,
(2002).
[8] The Ministry of Environment and Urbanization, “2018-2022 Stratejik Plan”, Ankara, (2017).
[9] http://www.iea.org/statistics/statisticssearch/report/?year=2015&country=TURKEY&product=
Indicators. Access date: 24.7.2018.
Page 17
608 Halit BEYAZTAS, Gul Koclar ORAL / GU J Sci, 33(3): 592-611 (2020)
[10] http://www.iea.org/statistics/statisticssearch/report/?year=2015&country=TURKEY&product=
Balances. Access date: 27.7.2018.
[11] UNFCCC, “Republic of Turkey - Intended Nationally Determined Contribution”, United Nations,
(2015).
[12] The Ministry of Development of the Republic of Turkey, “Report on Turkey’s Initial Steps
towards the Implementation of the 2030 Agenda for Sustainable Development”, Ankara, (2016).
[13] The Ministry of Environment and Urbanization of Turkey, “National Climate Change Action
Plan”, Ankara, (2011).
[14] Official Gazette, “Building Energy Performance Regulation”, Sayı: 27075, Ankara, (2008).
[15] Official Gazette, “Renewable Energy Resource Area Regulation”, Sayı: 29852, Ankara, (2016).
[16] Official Gazette, “Regulation on Searching for Improvements on Energy Resources and Efficiency
Energy Usage”, Sayı: 28097, (2011).
[17] Kocabas, A., “The Emergence of Istanbul’s Fifth Urban Planning Period: A Transition to Planning
for Sustainable Regeneration?”, J. Urban Technol., 12(2): 27–48, (2005).
[18] Kocabas, A., “The transition to low carbon urbanization in Turkey: Emerging policies and initial
action”, Habitat Int., 37:80–87, (2013).
[19] Directory of Butget and Fiscal Control, “Mid-Term Fiscal Report of 2019-2021”, Republic of
Turkey Ministry of Treasury and Finance, Ankara, (2018).
[20] Presidency of Strategy and Budget, “11.Development Plan of Turkey for 2019-2023”, Ankara,
(2019).
[21] Uzun, B., Simsek, N. C., “Upgrading of illegal settlements in Turkey; the case of North Ankara
Entrance Urban Regeneration Project”, Habitat Int., 49:157–164, (2015).
[22] Uzun, B., Çete, M., Palancıoğlu, H. M., “Legalizing and upgrading illegal settlements in Turkey”,
Habitat Int., 34(2):204–209, (2010).
[23] Güzey, Ö., “Urban regeneration and increased competitive power: Ankara in an era of
globalization”, Cities, 26(1):27–37, (2009).
[24] Demirli, M. E., Ultav, Z. T., Demirtaş-Milz, N., “A socio-spatial analysis of urban transformation
at a neighborhood scale: The case of the relocation of Kadifekale inhabitants to TOKİ Uzundere
in İzmir”, Cities, 48:140–159, (2015).
[25] Güzey, Ö., “The last round in restructuring the city: Urban regeneration becomes a state policy of
disaster prevention in Turkey”, Cities, 50:40–53, (2016).
[26] TS825, “Thermal insulation requirements for buildings”, Turkish Standats Institution, Ankara,
(2013).
[27] Turkey Ministry of Environment and Urbanization, “2017 Annual Report”, Ankara, (2018).
Page 18
609 Halit BEYAZTAS, Gul Koclar ORAL / GU J Sci, 33(3): 592-611 (2020)
[28] Mangan, S. D., Oral, G. K., “Assessment of residential building performances for the different
climate zones of Turkey in terms of life cycle energy and cost efficiency”, Energy Build., 110:362–
376, (2016).
[29] Kalaycıoğlu, E., Yılmaz, A. Z., “A new approach for the application of nearly zero energy concept
at district level to reach EPBD recast requirements through a case study in Turkey”, Energy Build.,
152:680–700 (2017).
[30] Coutts, A. M., Beringer, J., Tapper, N. J., “Impact of Increasing Urban Density on Local Climate:
Spatial and Temporal Variations in the Surface Energy Balance in Melbourne, Australia”, J. Appl.
Meteorol. Climatol., 46(4):477–493, (2007).
[31] Strømann-Andersen, J., Sattrup, P.A., “The urban canyon and building energy use: Urban density
versus daylight and passive solar gains”, Energy Build., 43(8): 2011-2020, 2011.
[32] Tereci, A., Kesten, D., Eicker, U., “The Impact of the Urban Form on Heating, Cooling and
Lighting Demand of Cities”, Proceedings of the 1. International Conference on Sustainable
Urbanization, Hong Kong, China, 2010.
[33] Niachou, K., Livada, I., Santamouris, M., “Experimental study of temperature and airflow
distribution inside an urban street canyon during hot summer weather conditions. Part II: Airflow
analysis”, Build. Environ., 43(8):1393–1403, (2008).
[34] Santamouris, M., Papanikolaou, N., Livada, I., Koronakis I., Georgakis, C., Argiriou, A.,
Assimakopoulos, D. N., “On the impact of urban climate on the energy consumption of buildings”,
Sol. Energy, 70(3):201–216, (2001).
[35] Grosso, M., “Urban form and renewable energy potential”, Renew. Energy, 15(1–4):331–336,
(1998).
[36] Ali-Toudert, F., Mayer, H., “Numerical study on the effects of aspect ratio and orientation of an
urban street canyon on outdoor thermal comfort in hot and dry climate”, Build. Environ.,
41(2):94–108, (2006).
[37] Johansson, E., “Influence of urban geometry on outdoor thermal comfort in a hot dry climate: A
study in Fez, Morocco”, Build. Environ., 41(10):1326–1338, (2006).
[38] Oke, T. R., “Street design and urban canopy layer climate”, Energy Build., 11(1–3):103–113,
(1988).
[39] Laski. L., Schellekens. S., “The State of World Population 2007 Youth Suplement”, United
Nations, (2007).
[40] UN Department of Economic and Social Affairs, “World Urbanization Prospects The 2011
Revision”, United Nations, New York, (2012).
[41] Oke T. R., “The energetic basis of the Urban Heat Island”, Q. J. R. Meteorol. Soc., 108(455):1–
24, (1982).
[42] Hassid, S., Santamouris, M., Papanikolaou, N., Linardi, A., Klitsikas, N., Georgakis, C.,
Assimakopoulos, D. N., “The effect of the Athens heat island on air conditioning load”, Energy
Build., 32(2): 131–141, (2000).
Page 19
610 Halit BEYAZTAS, Gul Koclar ORAL / GU J Sci, 33(3): 592-611 (2020)
[43] Taha, H., Akbari, H., Rosenfeld, A., Huang, J., “Residential cooling loads and the urban heat
island—the effects of albedo”, Build. Environ., 23(4):271–283, (1988).
[44] Fung, W. Y., Lam, K. S., Hung, W. T., Pang, S. W., Lee, Y. L., “Impact of urban temperature on
energy consumption of Hong Kong”, Energy, vol. 31(14):2623–2637, (2006).
[45] Loga, T., Stein, B., Diefenbach, N., “TABULA building typologies in 20 European countries—
Making energy-related features of residential building stocks comparable”, Energy Build., 132:4–
12, (2016).
[46] Dascalaki, E. G., Droutsa, K. G., Balaras, C. A., Kontoyiannidis, S., “Building typologies as a tool
for assessing the energy performance of residential buildings – A case study for the Hellenic
building stock”, Energy Build., 43(12):3400–3409, (2011).
[47] Kragh, J., Wittchen, K. B., “Development of two Danish building typologies for residential
buildings”, Energy Build., 68:79–86, (2014).
[48] Ballarini, I., Corgnati, S. P., Corrado, V., “Use of reference buildings to assess the energy saving
potentials of the residential building stock: The experience of TABULA project”, Energy Policy,
68:273–284, (2014).
[49] Ballarini, I., Corrado, V., Madonna, F., Paduos, S., Ravasio, F., “Energy refurbishment of the
Italian residential building stock: energy and cost analysis through the application of the building
typology”, Energy Policy, 105: 148–160, (2017).
[50] Filogamo, L., Peri, G., Rizzo, G., Giaccone, A., “On the classification of large residential buildings
stocks by sample typologies for energy planning purposes”, Appl. Energy, 135:825–835, (2014).
[51] Horváth, M., Kassai-Szoó, D., Csoknyai, T., “Solar energy potential of roofs on urban level based
on building typology”, Energy Build., 111:278–289, (2016).
[52] Beyaztas, H., Oral, G. K., “Evaluating Energy Performance of Facades Related to Urban Texture”,
in International Conferance on Building Envelope Systems and Technologies, Istanbul, 36–44
(2017).
[53] Beyaztas, H., Oral, G. K., “Investigating the Influence of Urban Texture and Building Typology
on Rooftop and Facades Energy Production (in Turkish)”, Proceedings of 3. National Building
Physics and Environmental Control Congress , Istanbul, 287–296 (2018).
[54] Daniels, K., Hammann, R. E., “Energy Design for Tomorrow / Energy Design für morgen”, Axel
Menges, Stuttgart, (2009)
[55] Kapsalaki, M., Leal, V., “Recent progress on net zero energy buildings”, Adv. Build. Energy Res.,
5(1):129–162, (2011).
[56] Lovell, H., “The role of individuals in policy change: the case of UK low-energy housing”,
Environ. Plan. C Polit. Sp., 27(3):491–511, (2009).
[57] California Energy Commission, “Integrated Energy Policy Report (Summary)”, 27-28, California,
United States, (2007).
[58] European Commission, “Directive 2010/31/EU OF the European Parliment and of the Council of
19 May 2010 on the energy performance of buildings (recast)”, Off. J. Eur. Union, (2010).
Page 20
611 Halit BEYAZTAS, Gul Koclar ORAL / GU J Sci, 33(3): 592-611 (2020)
[59] Executive Order, “Federal Leadership in Environmental, Energy, and Economic Performance”,
Order no: 13514, United States, (2009).
[60] National Institute of Building Sciences, “A Common Definition for Zero Energy Buildings”,
Department of Energy, United States, (2015).
[61] European Commission, “Directive 2010/31/EU of the Europan Parliament and of the Council of
19 May 2010 on the energy performance of buildings (recast),” Off. J. Eur. Union, L 153/13,
(2010).
[62] City Planning Department of Istanbul, “1/100.000 Scale Istanbul Environmental Plannig Report”,
Istanbul, (2009).
[63] http://episcope.eu/index.php?id=169. Access date: 15.10.2019.
[64] Ganiç, N., Yılmaz, A. Z., “Adaptation of the cost optimal level calculation method of Directive
2010/31/EU considering the influence of Turkish national factors”, Appl. Energy, 123:94–107,
(2014).
[65] http://webtool.building-typology.eu/#bm. Access date: 15.10.2019.
[66] TUIK, “Population and Housing Census”, Turkish Statistical Institute, Ankara, (2011).
[67] https://biruni.tuik.gov.tr/yapiizin/giris.zul. Access date: 16.5.2018.
[68] http://www.gazbir.org.tr/uploads/page/2017-Yili-Dogal-Gaz-Dagitim-Sektoru-Raporu.pdf.
Access date: 22.5.2018.
[69] Official Gazette, “Declaration of National Building Energy Performance Calculation
Methodology”, Ankara, (2010).