International Journal of Science and Technology Volume 2 No. 9, September, 2013
IJST © 2013– IJST Publications UK. All rights reserved. 648
Seismic Interpretation of Tomboy Field, Offshore Western Niger Delta,
Nigeria
S. O. Obaje Nigerian Geological Survey Agency, Kwara State Office, Federal Secretariat, Ilorin, Nigeria
ABSTRACT
The focal aim of the study is to map the structures in the study area using seismic interpretation methodology. Key stratal
terminations such as onlaps, toplaps and erosional unconformities (or truncations) were recognised. Nine surface
boundaries, namely: four maximum flooding surfaces and five sequence boundaries were detected as peaks and troughs of
the seismic onsets, respectively. The maximum flooding surfaces and the sequence boundaries depths were converted to
time in milliseconds using check shot data. The converted time represents two-way travel time. Accordingly, the wireline
logs were effectively tied to the seismic lines for better stratigraphic interpretation. Biostratigraphic data were used to date
the defined surface boundaries and their paleoenvironments of deposition. The structural style of the field is characterised
by two systems of antithetic and growth faults. On the seismic lines, shale structures were recognised as zones of chaotic or
transparent seismic reflections. The overall geometry of the reflectors is parallel or sub-parallel. On the seismic lines,
chaotic reflectors were identified to be associated with small-scale gravity faulting resulting in debris flow. The sandstone-
prone facies have greater seismic amplitude values than the shale-dominated units. The seismic expression of such
lithology change may have resulted from the juxtaposition of low amplitude and moderately continuous seismic facies
(shale-prone) on high-amplitude and variable continuity seismic facies (sand-prone). The identified structural and
stratigraphic traps, the reservoir blocks and the depositional environments are useful input to the petroleum system of the
area.
Keywords: Seismic Interpretation, Seismic Stratigraphy, Tomboy Field, Surface Boundary
1. INTRODUCTION
The area of study is located in the Tomboy field of the
offshore western Niger Delta area of Nigeria (Figs. 1 and
2). The Niger Delta is situated in the Gulf of Guinea on
the west coast of Central Africa. Niger Delta lies
between latitudes 4° and 6° N and longitudes 3° and 9° E
in the south-south geo-political region of Nigeria [16].
The Cenozoic Niger Delta is situated at the intersection
of the Benue Trough and the South Atlantic Ocean
where a triple junction developed during the separation
of South America and Africa in the Late Jurassic [27].
The main aim of this study is to map the structures in the
study area using seismic interpretation methodology.
Key stratal terminations such as onlaps, toplaps and
erosional unconformities (or truncations) were mapped
and integrated with log and biostratigraphic data to
establish the candidate surface boundaries in the study
area.
1.1 What is Seismic Stratigraphy?
Reflection seismology is compartmentalized into
acquisition, processing and interpretation. Seismic
stratigraphy deals with interpretation [2]. According to
McGraw-Hill Science and Technology Encyclopedia
[12], seismic stratigraphy is pronounced (′sīz·mik
strə′tig·rə·fē) and defined as a branch of stratigraphy in
which sediments and sedimentary rocks are interpreted
in a geometrical context from seismic reflectors. On the
other hand, it is defined as a technique used to determine
the nature of sedimentary rocks or their stratigraphic
interpretation by the analysis of seismic data [28], [24].
Primary seismic reflections are generated by physical
surfaces in the rocks, consisting mainly of stratal
surfaces and unconformities with velocities-density
contrasts of the bedding planes rather than
lithostratigraphic boundaries [24], [18], [10]. Andrew [2]
classified seismic stratigraphy into three principal
categories, namely: (i) seismic-sequence analysis, (ii)
seismic-facies analysis and (iii) reflection-character
analysis. Firstly, in seismic-sequence analysis, there is
need to separate out the time-depositional units based on
detecting the unconformities or changes in seismic
patterns as they are shown by angularity [12], [2].
Angularity below an unconformity may be produced by
erosion at an angle across the former bedding surfaces or
by toplap (offlap) and angularity above an unconformity
may be produced by onlap or downlap, the latter
distinction being based on geometry. The unconformities
are then followed along reflections from the points
where they cannot be so identified, advantage being
taken of the fact that the unconformity reflection is often
relatively strong. The procedure often followed is to
mark angularities in reflections by small arrows before
drawing in the boundaries. Secondly, Seismic-facies
units are three-dimensional and many of the conclusions
from them are based on their three-dimensional shape.
The appearance on seismic lines in the dip and strike
directions is often very different. For example, a fan-
shaped unit might show a progradational pattern in the
dip direction and discontinuous, overlapping arcuate
International Journal of Science and Technology (IJST) – Volume 2 No. 9, September, 2013
IJST © 2013– IJST Publications UK. All rights reserved. 649
reflections in the strike direction. Thirdly, Reflection-
character analysis may be based on information from
boreholes which suggests that a particular interval may
change nearby in a manner which increases its likelihood
to contain hydrocarbon accumulations. Lateral changes
in the wave shape of individual reflection events may
suggest where the stratigraphic changes or hydrocarbon
accumulations may be located [12]. Finally, according
to Okosun [17], stratigraphy is the description and
classification of all rock bodies forming the earth’s crust
into distinctive and mappable units on the basis of their
inherent properties or attributes, distributions,
relationship and succession in space and time.
2. GEOLOGICAL SETTING
Three main formations have been recognised in the
subsurface of the Niger Delta [7], [21], [26], [4], [11],
[23]. These are the Akata, Agbada, and Benin
Formations. These formations were deposited in marine,
transitional and continental environments, respectively;
together they form a thick, overall progradational
passive-margin wedge [7].
The Akata Formation is Paleocene to Pliocene in age and
it is the basal unit composed mainly of marine shales
believed to be the main source rock within the basin. The
Agbada Formation is made up of alternating sandstone,
siltstone and shale sequences that constitute the
petroleum reservoirs of the basin. Agbada Formation is
Eocene to Quaternary in age (Figs. 3 and 4). On the
other hand, the Benin Formation is Oligocene to Recent
in age and it is mainly made up of non-marine fine to
coarse-grained sands with a few mudstone and shaly
intercalations [7].
Fig. 2. Seismic Survey Base Map of Study Area showing Locations of Five Wells
and the Seismic In-line and Cross-line Sections
Fig. 1. Location Map of the Study Area (Source: Tutle et al.[23])
STUDY AREA
International Journal of Science and Technology (IJST) – Volume 2 No. 9, September, 2013
IJST © 2013– IJST Publications UK. All rights reserved. 650
Fig. 4. Southwest-northeast (B-B’) cross-section through the Niger Delta (modified from
Whiteman [27])
Fig. 3. Stratigraphic column showing the three formations of the Niger Delta (after Tuttle et al.[23];
modified from Doust and Omatsola [8])
International Journal of Science and Technology (IJST) – Volume 2 No. 9, September, 2013
IJST © 2013– IJST Publications UK. All rights reserved. 651
3. MATERIALS AND METHODS
The materials for the study are seismic section, well
logs, base map and check shot data for five wells in the
study area. The five wells are named TMB-1, TMB-2,
TMB-4, TMB-5 and TMB-6 where TMB is an
abbreviation for Tomboy. The wells are drilled to the
depths of 3,782.57 m (TMB-1), 3,791.71 m (TMB-2),
3,489.96 m (TMB-4), 3,535.68 m (TMB-5) and 3,962.40
m (TMB-6). All the data were loaded on Landmark
Workstation. The database was created on the
Geographix Discovery R2007.1 platform (Windows)
version. The study was performed using SeisVision
3Dimensional (3D) seismic interpretation modules. The
parameters of the projection system used on the
Geographix Discovery are Coordinate System Type of
Transverse Mercator, Geographical Coordinate System
using Nigeria Minna (DMA REG MOL); Greenwich
Datum Prime Meridian and Minna Spheroid after Clarke
1880 Zone. The cross-line (strike) and the in-line (dip)
and the above mentioned data set were provided by
ChevronTexaco Nigeria Limited. The in-line (dip)
ranged from 5,800 to 6,200 and the cross-line (strike)
ranged from 1,480 to 1,700 covering a total area of 71.33
km2
and the line space of 2.51 km (Fig. 2). The 3D
seismic volume data were supplied in SEG-Y format,
while the well log data were given in LAS format.
Seismic and structural interpretation along the dip and
strike sections of the Tomboy field was undertaken in
this study with a view to identify and correlate the
surface boundaries along the seismic transect from one
well to another. The following method and workflow
plan was adopted: loading of seismic and well data,
review of seismic and log data after loading, integration
of biostratigraphic data and their calibration with seismic
data, identification of candidate sequence boundaries,
and the posting of the dominant faults on the transect.
The time-depth relationship was determined using the
check shot data available for TMB-1 well (Fig. 5). The
two-way time (TWT) is given in milliseconds (msec.) on
the x-axis, while the true vertical well depth is given on
the y-axis in feet (and the conversion value is 1 foot
equals 0.304804 metre). The depositional environments
were interpreted using the characteristic patterns and
curves of the gamma ray and resistivity logs in line with
the published charts of Busch [5] and Schlumberger [19]
(Figs. 6 and 7).
4. RESULTS AND DISCUSSION
4.1 Seismic to Well Calibration
The condensed sections are generally the most easily
recognised and dated regional correlatable surfaces. The
maximum flooding surface (MFS) is a clay-rich major
condensed interval formed by slow deposition of
sediments. This condensed section represents the deepest
water facies with a significant increase in fossils
diversity/abundance and abundance of authigenic
minerals (glauconite and phosphates) [25], [1]. The
gamma ray log provides a measure of sediment type, with
curve deflection to the right indicating increase in clay
content [3]. MFS’s can be interpreted from gamma-ray
log as “spikes” associated with uranium concentrations in
condensed sections.
Using biostratigraphic data, concentration and dilution
cycles are very important. In general terms, concentration
cycles represent zones where large numbers of
microfauna and flora are condensed over short intervals,
and they are often associated with maximum flooding
Fig. 5. The Plot of Check Shot Chart for TMB-1 Well (Conversion: 1 foot = 0.3048 metre)
International Journal of Science and Technology (IJST) – Volume 2 No. 9, September, 2013
IJST © 2013– IJST Publications UK. All rights reserved. 652
surfaces (MFS’s). On the other hand, dilution cycles are
often associated with sequence boundaries [22].
The high resolution chronostratigraphic framework used
in the seismic interpretation is mostly MFS’s and SB’s
that have been assigned their absolute ages. Stacking
patterns seen on logs (and outcrops sections) are often
indicative of key stratigraphic surfaces. For example, the
change from retrogradational to progradational stacking
often is associated with a maximum flooding surface,
which can be checked in both seismic and
biostratigraphic data. Log motif interpretation of systems
tracts is particularly well defined [13]. Stacking patterns,
log curve shape, vertical trends in sand content, and
relationship to over- and underlying surfaces are keys to
identifying the systems tracts. However, integration with
seismic and other data is critical to validating these
interpretations [22]. Nine surface boundaries, namely:
four maximum flooding surfaces and five sequence
boundaries were defined as peaks and troughs of seismic
onsets, respectively (Table 1).
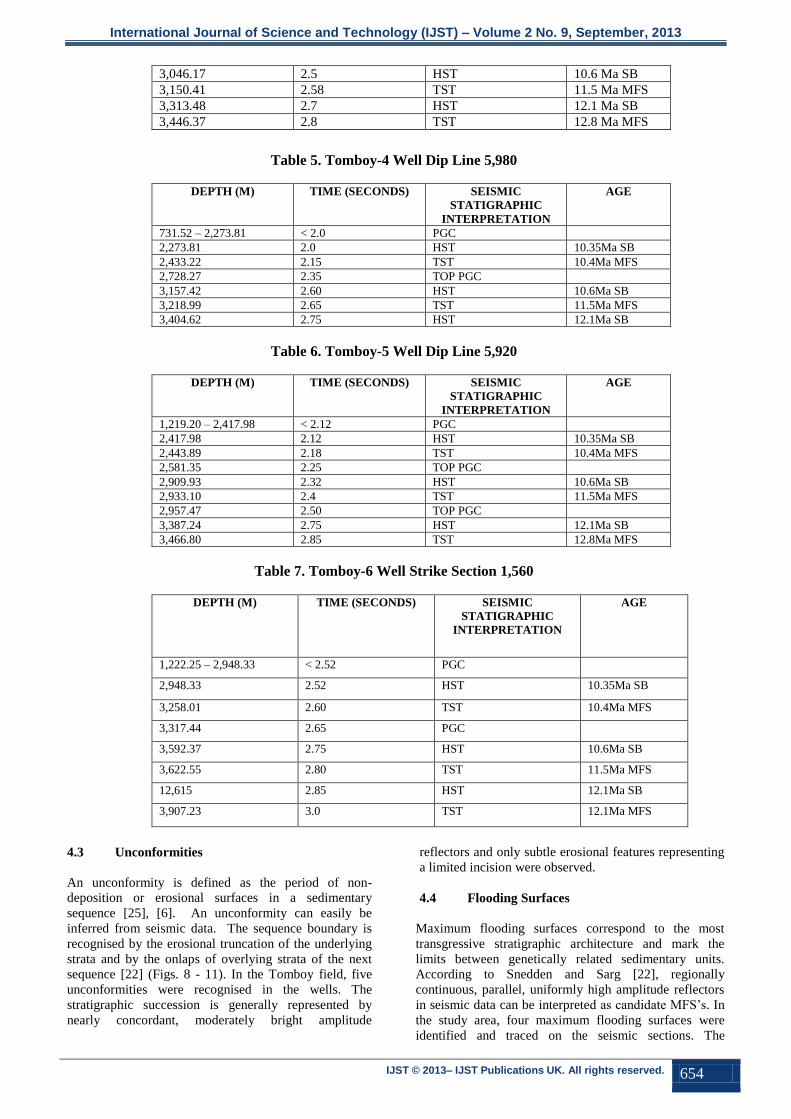
The maximum flooding surfaces (MFS’s) and the
sequence boundaries (SB’s) depths were converted to
time in milliseconds using the check shot data provided
by ChevronTexaco Nigeria Limited (Fig. 5).
Consequently, the wireline logs were effectively tied to
the seismic lines for better seismic stratigraphic
interpretation. The converted time representing the two
way travel time in relationship to the seismic stratigraphic
interpretation are given in Tables 3-7. Careful assessment
of the events recognised using the biostratigraphic age
dates of samples from the wells constrained by seismic
and wireline logs data indicated that 9.5 Ma, 10.4 Ma,
11.5 Ma and 12.8 Ma MFS’s constituted reliable
chronostratigraphic surfaces for the correlation of the
sequences within the wells in the study area. Key stratal
terminations such as onlaps, toplaps and erosional
unconformities (or truncations) were recognised. The
maximum flooding surfaces (MFS’s) coincided with the
seismic peaks, while the sequence boundaries (SB’s)
tallied with the seismic troughs (Table 1).
Table 1. Surface Boundaries (MFS’S & SB’S)
MFS (Ma) SB (Ma) NO. OF
WELLS
SEISMIC
ONSET
8.5 2 Trough
9.5 2 Peak
10.35 5 Trough
10.4 5 peak
10.6 5 Trough
11.5 5 Peak
12.1 5 trough
12.8 4 Peak
13.1 1 trough
4.2 Structural Interpretation
Structural interpretation was done on the Tomboy field
wells to map the structures, principally the fault patterns.
A geologic section based on the line drawn on the
seismic interpretation illustrates the structural style
observed in the study area (Figs. 8 - 11). Time horizons
constrained by well data and absolute ages indicated
Fig. 6. Gamma Ray and Resistivity Log Patterns
Indicative of Depositional Environments (Source:
Busch [5])
Fig. 7. Gamma Ray Log Stacking Patterns
Defining Deltaic Depositional Environments
(Source: Schlumberger [19])
International Journal of Science and Technology (IJST) – Volume 2 No. 9, September, 2013
IJST © 2013– IJST Publications UK. All rights reserved. 653
Middle and Late Miocene. The structural style of the
field is characterised by two systems of antithetic and
growth faults. On the seismic lines, shale structures were
recognised as zones of chaotic or transparent seismic
reflections areas. The 3D seismic volume data is of good
quality, but below 3.5 seconds TWT the seismic lines are
very chaotic and of very poor quality and therefore, the
interpretation of such deeper horizons are uncertain.
The relative distance between the up-thrown sector and
the down-thrown sector of a fault is referred to as its
throw. The direction of throw is dominantly westward.
The faults (F1, F2, F3, F4 and F5) indicated that the faults
are down-thrown. The Faults (F6 and F7) basically are the
up-thrown faults. TMB-1, TMB-4 and TMB-6 wells are
situated in the down-thrown arms, having been affected
by F6 and F7 faults thus leading to the loss of some
horizon blocks from them. The F1 is observed to be
southwest trending fault, while F2 and F3 have western
trending pattern; F4 trends west to east direction, F5 has
nortwestern trend and F6 and F7 trend in northeastern
direction (Table 2). TMB-2 and TMB-5 wells are situated
in the up-thrown sector in relationship to fault (F2), while
TMB-6 well is located on the fault (F6). The wells were
correlated based on the relationships in the MFS’s and
the SB’s. Because some of the horizon blocks were
interpreted to have been faulted out, it may be inferred
that growth faults principally controlled the sequence
architecture of the study area (Figs. 8 - 11).
Table 2. Directions of Fault Patterns in the Tomboy Field
Table 3. Tomboy-1 Well Strike Section 1,620
DEPTH (M) TIME (SECONDS) SEISMIC
STATIGRAPHIC
INTERPRETATION
AGE
1,527.05 – 2,420.11 < 2.10 PGC
2,420.11 2.10 HST 8.5Ma SB
2,431.39 2.14 TST 9.5Ma MFS
2,471.32 2.20 TOP PGC
2,855.06 2.35 HST
2,882.80 2.40 TST 10.35Ma SB
2,908.71 2.45 TOP PGC 10.4Ma MFS
3,157.12 2.60 HST 10.6Ma SB
3,218.08 2.65 TST 11.5Ma MFS
3,386.94 2.72 HST 12.1Ma SB
3,404.92 2.74 TST 12.8Ma MFS
3,441.80 2.85 HST 13.1Ma SB
*PGC: Prograding Complex; TST: Transgressive System Tract; HST: High stand System Tract
Table 4. Tomboy-2 Well Strike Section 1,600
DEPTH (M) TIME (SECONDS) SEISMIC
STATIGRAPHIC
INTERPRETATION
AGE
1,527.05 – 2,268.93 < 2.0 *PGC
2,268.93 2.0 HST 8.5 Ma SB
2,431.39 2.1 TST 9.5 Ma MFS
2,639.57 2.25 HST 10.35 Ma SB
2,731.62 2.3 TST 10.4 Ma MFS
NAME OF FAULTS DIRECTION OF FAULT PATTERN
F1 Southwest trend
F2 and F3 Western trend
F4 West to East
F5 Northwest
F6 and F7 Northeast
International Journal of Science and Technology (IJST) – Volume 2 No. 9, September, 2013
IJST © 2013– IJST Publications UK. All rights reserved. 654
3,046.17 2.5 HST 10.6 Ma SB
3,150.41 2.58 TST 11.5 Ma MFS
3,313.48 2.7 HST 12.1 Ma SB
3,446.37 2.8 TST 12.8 Ma MFS
Table 5. Tomboy-4 Well Dip Line 5,980
DEPTH (M) TIME (SECONDS) SEISMIC
STATIGRAPHIC
INTERPRETATION
AGE
731.52 – 2,273.81 < 2.0 PGC
2,273.81 2.0 HST 10.35Ma SB
2,433.22 2.15 TST 10.4Ma MFS
2,728.27 2.35 TOP PGC
3,157.42 2.60 HST 10.6Ma SB
3,218.99 2.65 TST 11.5Ma MFS
3,404.62 2.75 HST 12.1Ma SB
Table 6. Tomboy-5 Well Dip Line 5,920
DEPTH (M) TIME (SECONDS) SEISMIC
STATIGRAPHIC
INTERPRETATION
AGE
1,219.20 – 2,417.98 < 2.12 PGC
2,417.98 2.12 HST 10.35Ma SB
2,443.89 2.18 TST 10.4Ma MFS
2,581.35 2.25 TOP PGC
2,909.93 2.32 HST 10.6Ma SB
2,933.10 2.4 TST 11.5Ma MFS
2,957.47 2.50 TOP PGC
3,387.24 2.75 HST 12.1Ma SB
3,466.80 2.85 TST 12.8Ma MFS
Table 7. Tomboy-6 Well Strike Section 1,560
DEPTH (M) TIME (SECONDS) SEISMIC
STATIGRAPHIC
INTERPRETATION
AGE
1,222.25 – 2,948.33 < 2.52 PGC
2,948.33 2.52 HST 10.35Ma SB
3,258.01 2.60 TST 10.4Ma MFS
3,317.44 2.65 PGC
3,592.37 2.75 HST 10.6Ma SB
3,622.55 2.80 TST 11.5Ma MFS
12,615 2.85 HST 12.1Ma SB
3,907.23 3.0 TST 12.1Ma MFS
4.3 Unconformities
An unconformity is defined as the period of non-
deposition or erosional surfaces in a sedimentary
sequence [25], [6]. An unconformity can easily be
inferred from seismic data. The sequence boundary is
recognised by the erosional truncation of the underlying
strata and by the onlaps of overlying strata of the next
sequence [22] (Figs. 8 - 11). In the Tomboy field, five
unconformities were recognised in the wells. The
stratigraphic succession is generally represented by
nearly concordant, moderately bright amplitude
reflectors and only subtle erosional features representing
a limited incision were observed.
4.4 Flooding Surfaces
Maximum flooding surfaces correspond to the most
transgressive stratigraphic architecture and mark the
limits between genetically related sedimentary units.
According to Snedden and Sarg [22], regionally
continuous, parallel, uniformly high amplitude reflectors
in seismic data can be interpreted as candidate MFS’s. In
the study area, four maximum flooding surfaces were
identified and traced on the seismic sections. The
International Journal of Science and Technology (IJST) – Volume 2 No. 9, September, 2013
IJST © 2013– IJST Publications UK. All rights reserved. 655
downlap surfaces were recognised to mark the maximum
flooding surfaces that change from retrogradational to
progradational parasequence sets [22].
4.4 Seismic Facies
Seismic facies are packages of reflectors with a set of
seismic characteristics differing from adjacent units (in
similarity to the definition of a formation), seismic facies
must be distinguishable from adjacent units and
mappable on earth's surface) [22]. Conventional and
qualitative seismic facies interpretation of stratigraphic
features such as turbiditic facies (downlap, mounds) and
lithology or fluid content were tentatively carried out. In
this study, the overall geometry of the reflectors is
parallel or sub-parallel. On the seismic lines, chaotic
reflectors were identified to be associated with small-
scale gravity faulting resulting in debris flow. The
sandstone-prone facies have greater seismic amplitude
values than the shale-dominated packages. The seismic
expression of such lithology change may have resulted
from the juxtaposition of low amplitude and moderately
continuous seismic facies (shale prone) on high-
amplitude and variable continuity seismic facies (sand-
prone).
Fig. 8. Interpreted seismic section showing transect
along in-line (dip) 5,980 section
Scale: vertical: 100 msec.; horizontal: 10 dip lines
Fig. 9. Collapsed crest structures and fault styles and
throw along in-line (dip) 5,980 section
Scale: vertical: 100 msec.; horizontal: 10 strike lines
Fig. 10. Interpreted seismic section showing cross-line
(strike) 1,600
Scale: vertical: 100 msec.; horizontal: 10 strike lines
International Journal of Science and Technology (IJST) – Volume 2 No. 9, September, 2013
IJST © 2013– IJST Publications UK. All rights reserved. 656
Fig. 11. Structures with growth faults along cross-line
(strike) 1,600
Scale: vertical: 100 msec.; horizontal: 10 strike lines
4.6 Depositional System
From the seismic interpretation, it was detected that the
sequence architecture was strongly controlled by
extensional gravity-induced growth faulting. Though the
influence of the Niger Delta regional tectonism on the
local structural control was not differentiated; however,
it may be inferred that the following two factors may
have affected the depositional sequences: differential
subsidence, which in turn provided the variation in
accommodation and shales with local withdrawal which
may have provided areas of high subsidence.
The main traps are both structural and stratigraphic.
Structural traps include rollover folds, tilted fault blocks,
fault closure and horsts. Stratigraphic traps include pinch
outs, sand deposit in the down-thrown blocks and up-
thrown blocks, in-filled channels and debris flow
deposits. Stratigraphic facies changes and pinch-outs in
growth structure provide hydrocarbon traps; and may,
therefore, provide exploration and development
opportunities [20]. Biostratigraphic data [14] integrated
with gamma ray and resistivity log characteristic curves
were used to interpret the paleo-depositional
environments of the study area. The defined depositional
environments in stratigraphically ascending order are
Prodelta shales, channel sands, tidal/distributary channel
sands, barrier bar sands and upper shoreface deposits.
The sands are mostly interbeded by shales/mudstones
(Tables 8 - 12).
Table 8. The Environment of Deposition of Tomboy-1 Well interpreted using the Well Log Signatures
DEPTH (M) DEPOSITIONAL ENVIRONMENT
1,527.05 – 2,268.93 Upper shoreface
2,268.93 – 2,404.57 Inter-distributary channel overlain by shallow marine shales
2,404.57 – 2,868.47 Distributary channel sands overlain by shallow marine shales
2,868.47 – 3,150.41 Barrier bar sand deposits overlain by marginal marine shales
3,150.41 – 3,313.48 Inter-distributary channel overlain by shallow marine shales
3,313.48 – 3,446.68 Channel sands with occasional shallow marine shales
3,446.68 – 3,779.52 Pro-delta shales
Table 9. The Environment of Deposition of Tomboy-2 Well interpreted using the Well Log Signatures
DEPTH (M) DEPOSITIONAL ENVIRONMENT
1,828.80 – 2,268.93 Upper shoreface
2,268.93 – 2,404.57 Inter-distributary channel overlain by shallow marine shales
2,404.57 – 2,868.47 Distributary channel sands overlain by shallow marine shales
2,868.47 – 3,151.33 Barrier bar sand deposits overlain by marginal marine shales
3,151.33 – 3,313.48 Inter-distributary channel sand overlain by shallow marine shales
3,313.48 – 3,446.68 Channel sands with occasional shallow marine shales
3,446.68 – 3,791.71 Pro-delta shales
Table 10. The Environment of Deposition of Tomboy-4 Well interpreted using the Well Log Signatures
DEPTH (M) DEPOSITIONAL ENVIRONMENT
731.52 – 2,274.42 Upper shoreface
2,274.42 – 2,417.98 Lower shoreface
2,417.98 – 2,552.40 Tidal channel sands overlain by shallow marine shales
2,552.40 – 2,728.57 Inter-distributary channel sands
2,728.57 – 3,065.37 Distributary channel sands
3,065.37 – 3,270.20 Channel sands overlain by shallow marine shales
3,270.20 – 3,493.01 Pro-delta shales overlain by lower shoreface sands
International Journal of Science and Technology (IJST) – Volume 2 No. 9, September, 2013
IJST © 2013– IJST Publications UK. All rights reserved. 657
Table 10. The Environment of Deposition of Tomboy- 5 Well interpreted using the Well Log Signatures
DEPTH (M) DEPOSITIONAL ENVIRONMENT
1,219.20 – 2,274.42 Upper shoreface
2,274.42 – 2,417.98 Lower shoreface
2,417.98 – 2,581.35 Tidal channel overlain by shallow marine shales
2,581.35 – 2,909.93 Distributary channel sands with shale/mudstone interbeds
2,909.93 – 3,270.20 Channel sands overlain by shallow marine shales
3,270.20 – 3,535.68 Marine shales overlain by tidal channel sands.
Table 12. The Environment of Deposition of Tomboy- 6 Well interpreted using the Well Log Signature
DEPTH (M) DEPOSITIONAL ENVIRONMENT
2,133.60 – 2,656.94 Upper shoreface
2,656.94 – 2,947.72 Channel sands overlain by shallow marine shales/siltstones
2,947.72 – 3,134.26 Tidal channel sands with occasional shales interbeds
3,134.26 – 3,317.44 Distributary channel sands with shale/mudstone interbeds
3,317.44 – 3,592.68 Distributary channel sands
3,592.68 – 3,962.40 Lower shoreface overlain by prodelta muds/shales
4.7 Lithostratigraphy
The logs analytical data indicated the presence of two
lithostratigraphic units in the Tomboy field, viz: the
paralic Agbada and the continental Benin Formations,
respectively, that are recognised in the Niger Delta area
[21], [27]. The Agbada Formation, as shown in the wells,
is typically a sequence of sandstones alternating with
shales/mudstones, with sands predominating up-section.
On the other hand, the Benin Formation is dominantly
made up of non-marine (fluviatile) fine to coarse-grained
sands with a few mudstone and shaly intercalations [7].
The thickness of the Agbada and Benin Formations
varied widely in the five wells studied. The Agbada
Formation is predominantly shale/mudstone sequence
alternating with variably, thickly bedded channel
sandstones with coarsening upward and occasionally
finning upward log signatures. The two recognised
lithostratigraphic units and their thicknesses in the study
area are shown in Table 13.
4.8 Chronostratigraphy
The ages of the five wells in the XY-1 Field range
between Middle and Late Miocene based on the high
resolution biostratigraphic data [14]. All the MFS’s and
SB’s fell within the Middle and Late Miocene interval
and the five wells were adequately correlated (Table 14;
Fig. 12).
Table 13. Lithostratigraphic Data of Tomboy Field (Source: Obaje and Okosun [15])
FORMATION TMB-1 DEPTH (M) TMB-2 DEPTH (M) TMB-4 DEPTH (M) TMB-5 DEPTH (M) TMB-6 DEPTH (M)
BENIN 1,527.05-2,268.93 1,527.05-2,282.95 731.52-2,273.81 1,219.20-2,417.98 1,222.25-2,948.33
AGBADA 2,268.93-3,779.52 2,282.95-3,791.71 2,273.81-3,489.96 2,417.98-3,535.68 2,948.33-3,962.40
Table 14. Chronostratigraphic Data of Tomboy Field S/N WELL NAME DEPTH (M) AGE
1. TMB-1 1,527.05-2,721.86 Late Miocene
2,721.86-3,791.71 Middle Miocene
2. TMB-2 1,527.05-3,142.49 Late Miocene
3,142.49-3,791.71 Middle Miocene
3. TMB-4 731.52-2,433.52 Late Miocene
2,433.52-3,489.96 Middle Miocene
4. TMB-5 1,219.20-2,933.10 Late Miocene
2,933.10-3,535.68 Middle Miocene
5. TMB-6 1,222.25-3,258.01 Late Miocene
3,258.01-3,962.40 Middle Miocene
Table 15. Chronostratigraphic Horizons of Tomboy Field
MFS
(Ma)
SB
(Ma)
WELL NAME AND DEPTHS (M)
TMB-1 TMB-2 TMB-4 TMB- 5 TMB- 6
8.5 2,268.93 2,420.11 - - -
9.5 2,431.39 2,431.39 - - -
10.35 2,639.57 2,855.06 2,273.81 2,417.98 2,948.33
10.4 2,731.31 2,882.80 2,433.22 2,443.89 3,258.01
10.6 3,046.17 3,157.12 3,157.42 2,909.93 3,592.37
11.5 3,150.41 3,218.08 3,218.99 2,933.09 3,622.55
12.1 3,313.48 3,386.94 3,404.62 3,387.24 3,845.05
12.8 3,446.37 3,404.92 - 3,466.80 3,907.23
13.1 - 3,441.80 - - -
International Journal of Science and Technology (IJST) – Volume 2 No. 9, September, 2013
IJST © 2013– IJST Publications UK. All rights reserved. 658
5. CONCLUSION AND RECOMMENDATION
The direction of throw of the faults is dominantly
westward. The faults (F1, F2, F3, F4 and F5) indicated that
the faults are down-thrown. The Faults (F6 and F7)
basically are the up-thrown faults. TMB-1, TMB-4 and
TMB-6 wells are situated in the down-thrown arms,
having been affected by F6 and F7 faults thus leading to
the loss of some horizon blocks from them. The F1 is
observed to be southwest trending fault, while F2 and F3
have western trending pattern; F4 trends in west to east
direction; F5 has nortwestern trend, while F6 and F7 trend
in northeastern direction. TMB-2 and TMB-5 wells are
situated in the up-thrown sector in relationship to fault
(F2), while TMB-6 well is located on the fault (F6). The
wells were correlated based on the relationships in the
MFS’s and the SB’s. Because some of the horizon blocks
were interpreted to have been faulted out; it may be
inferred that growth faults principally controlled the
sequence architecture in the study area. The main traps
are both structural and stratigraphic. Structural traps
include rollover folds, tilted fault blocks, fault closure
and horsts. Stratigraphic traps include pinch outs, sand
deposit in the fault down-thrown blocks and up-thrown
blocks, in-filled channels, debris flow deposits and
shale/clays infilling and sealing of the fault planes.
Stratigraphic facies changes and pinch-outs in growth
structure provide hydrocarbon traps; and may, therefore,
provide exploration and development opportunities in the
Tomboy field and other areas of the Niger Delta. In this
study, the overall geometry of the reflectors is parallel or
sub-parallel. On the seismic lines, chaotic reflectors were
identified to be associated with small-scale gravity
faulting resulting in debris flow. The sandstone-prone
facies have greater seismic amplitude values than the
shale-dominated packages. The seismic expression of
such lithology change may have resulted from the
juxtaposition of low amplitude and moderately
continuous seismic facies (shale prone) on high-
amplitude and variable continuity seismic facies (sand-
prone). Five unconformities were recognised in the wells
of the study area. The stratigraphic succession is
generally represented by nearly concordant, moderately
bright amplitude reflectors and only subtle erosional
features representing a limited incision were observed.
On the other hand, downlap surfaces were traced on the
seismic sections to mark four recognised candidate
maximum flooding surfaces which were established using
wireline logs and biostratigraphic data. Using integrated
data set from wireline logs and biostratigraphy, five
depositional environments recognised in stratigraphically
ascending order are prodelta shales, channel sands, tidal
and distributary channels sands, barrier sands and
shoreface deposits.
It is recommended that structural map of the sub-surface
horizons should be produced for further study of the
area.
Depth
5250'
5500'
5750'
6000'
6250'
6500'
6750'
7000'
7250'
7500'
7750'
8000'
8250'
8500'
8750'
9000'
9250'
9500'
9750'
10000'
10250'
10500'
10750'
11000'
11250'
11500'
11750'
12000'
12250'
Gamma Log(API)0 150
Lit
ho
log
y
Deep Laterolog(ohm m/m)0.2 2000
Lit
ho
stratig
rap
hy
5010
Be
nin
Fo
rma
tio
n
7444
12440
Ag
ba
da
Fo
rma
tio
nF
orm
atio
n
Seq
uen
ce
5010
PG
C
7444
HS
T
7978
TS
T
8661
HS
T
8962
TS
T
9994
HS
T
10336
TS
T
10871
HS
T
11308
12440
TS
T
Div
ersity: M
icro
pa
lae
on
tolo
gy
60
In-S
itu occurrences
5
6
4
12
16
5
9
7
7
6
10
8
12
7
15
9
5
8
13
3
4
7
4
4
15
5
8
8
26
7
2
2
1
1
1
4
252
4
1
11
5
6
7
3
4
201
2
4
3
5
28
2525
32
29
3
9
2
32
3
1
8
1
10
5
9
16
13
5
8
3
2
10
514
10
10
5
1
2
249
1
2
1
4
4
4
3
3
186
7
10
16
6
9
10
3
26
8
8
13
19
18
11
10
9
11
97
423
12
8
2
1
8
5
4
4
2
Micro.
To
tal co
un
t: M
icro
pa
lae
on
tolo
gy
80
In-S
itu occurrences
8
6
5
21
41
5
12
10
18
13
17
17
44
12
46
17
7
23
27
7
5
12
5
4
35
5
28
16
130
14
3
3
1
1
2
4
1012
12
3
30
13
11
7
3
5
1221
3
8
3
7
64
150105
117
116
3
13
2
137
4
1
11
1
18
7
19
32
28
7
13
3
8
13
524
12
32
5
1
2
14112
1
3
2
7
4
4
6
6
458
18
13
24
9
15
16
3
168
11
9
25
56
43
21
14
11
18
23104
6121
16
2
1
15
10
4
4
2
Micro. *1
*2
No
n M
arin
e
Div
ersity: N
an
no
pa
lae
on
tolo
gy
15
In-S
itu occurrences
3
21
111
4
54
86
61
82
1
3
1
2
1
11
9
1
25
1
8
1
1
1
2
22
41
1
1
5
1
3
4
1
Nanno.
To
tal co
un
t: N
an
no
pa
lae
on
tolo
gy
10
In-S
itu occurrences
5
21
111
5
65
98
61
112
1
4
1
2
1
11
24
1
27
1
11
1
3
1
2
22
91
1
1
7
1
3
9
1
Nanno.
Events
7444' 8.5Ma SB
7977' 9.5Ma MFS
8660' 10.35Ma SB
8961' 10.4Ma MFS
9994' 10.6Ma SB
10336' 11.5Ma MFS
10871' 12.1Ma SB
11307' 12.8Ma MFS
Depth
5250'
5500'
5750'
6000'
6250'
6500'
6750'
7000'
7250'
7500'
7750'
8000'
8250'
8500'
8750'
9000'
9250'
9500'
9750'
10000'
10250'
10500'
10750'
11000'
11250'
11500'
11750'
12000'
12250'
Gamma Log(API)0 150
Lit
ho
log
y
Deep Induction(ohm m/m)0.2 2000
Lit
ho
stratig
rap
hy
5010
Be
nin
Fo
rma
tio
n
7940
12440
Ag
ba
da
Fo
rma
tio
nF
orm
atio
n
Seq
uen
ce
5010
PG
C
HST7978
TS
T
8108
PG
C
HST
TST9543
PG
C
10358
HS
T
10559
TS
T
HST11171
TS
T
11293
12440
HS
T
Div
ersity: M
icro
pa
lae
on
tolo
gy
20
In-S
itu occurrences
4
5
6
4
12
16
5
9
7
7
6
10
8
12
7
15
9
5
8
13
3
4
7
4
4
15
5
8
8
26
7
2
2
1
1
1
4
2
4
1
11
5
6
7
3
2912
1
2
4
3
5
14
6
6
11
3
9
2
3
1
8
1
2510
526
9
16
13
5
8
3
2
10
5
10
10
5
1
2
914
1
2
1
164
4
4
3
3
6
7
10
1614
626
9
10
253
8
8
13
19
18
11
10
9
11
9
8
11
6
6
6
3
6
5
Micro.
To
tal co
un
t: M
icro
pa
lae
on
tolo
gy
40
In-S
itu occurrences
4
8
6
5
21
23
5
12
10
18
13
17
17
21
12
27
17
7
23
27
7
5
12
5
4
24
5
28
16
37
14
3
3
1
1
2
4
2
12
3
30
13
11
7
3
7344
1
3
8
3
7
21
16
16
39
3
13
2
4
1
11
1
6518
7130
19
32
28
7
13
3
8
13
5
12
32
5
1
2
1224
1
3
2
327
4
4
6
6
8
18
13
2417
997
15
16
563
11
9
25
56
43
21
14
11
18
23
8
17
7
11
11
5
10
9
Micro. Palaeoenvironment
Default
No
n M
arin
e
Tra
ns
itio
na
l
Inn
er
Ne
riti
c
Mid
dle
Ne
ritic
Div
ersity: N
an
no
pa
lae
on
tolo
gy
8
In-S
itu occurrences
3
21
111
4
74
89
61
82
1
3
12
1
11
9
1
25
1
1
1
1
2
8
22
41
1
1
1
5
3
4
1
Nanno.
To
tal co
un
t: N
an
no
pa
lae
on
tolo
gy
15
In-S
itu occurrences
5
21
111
10
127
1924
91
112
1
4
12
1
11
43
1
27
1
1
3
1
2
21
22
91
1
1
1
7
3
18
1
Nanno.
Events
7940' 8.5Ma SB7977' 9.5Ma MFS
9367' 10.35Ma SB
9458' 10.4Ma MFS
10358' 10.6Ma SB
10558' 11.5Ma MFS
11112' 12.1Ma SB
11171' 12.8Ma MFS
11292' 13.1Ma SB
Depth
2500'
2750'
3000'
3250'
3500'
3750'
4000'
4250'
4500'
4750'
5000'
5250'
5500'
5750'
6000'
6250'
6500'
6750'
7000'
7250'
7500'
7750'
8000'
8250'
8500'
8750'
9000'
9250'
9500'
9750'
10000'
10250'
10500'
10750'
11000'
11250'
Gamma Log(API)0 150
Lit
ho
log
y
Deep Laterolog(ohm m/m)0.2 2000
Lit
ho
stratig
rap
hy
2400
Be
nin
Fo
rma
tio
n
7461
11460
Ag
ba
da
Fo
rma
tio
nF
orm
atio
n
Seq
uen
ce
2400
LO
WS
TA
ND
PR
OG
RA
DIN
G C
OM
PL
EX
7461
HS
T
7984
TS
T
8951
LO
WS
TA
ND
PR
OG
RA
DIN
G C
OM
PL
EX
10359
HS
T
10562
TS
T
HST11170
11460
TS
T
Div
ersity: M
icro
pa
lae
on
tolo
gy
25
In-S
itu occurrences
12
8
10
5
7
4
10
8
9
9
7
5
7
4
5
6
4
5
12
11
8
9
7
5
9
9
4
14
16
13
8
7
3
3
2
5
3
1
9
10
13
10
2
5
6
4
12
16
5
9
7
7
6
10
8
12
7
15
9
5
8
13
3
4
7
4
4
15
5
8
8
26
7
2
2
1
1
1
425
17
4
1
11
5
6
7
3
420
121
2
4
3
5
28
2525
32
29
3
9
232
3
1
8
1
10
5
9
16
13
5
8
3
2
10
514
10
10
5
1
224
925
1
2
1
264
4
4
3
318
6
7
10
16
614
9
10
326
8
8
Micro.
To
tal co
un
t: M
icro
pa
lae
on
tolo
gy
20
In-S
itu occurrences
21
16
18
6
15
5
18
16
17
17
15
6
10
8
9
11
4
9
21
19
16
13
15
9
17
17
4
24
33
36
8
10
3
4
2
6
3
1
14
19
24
17
3
8
6
5
21
41
5
12
10
18
13
17
17
44
12
46
17
7
23
27
7
5
12
5
4
35
5
28
16
130
14
3
3
1
1
2
410135
12
3
30
13
11
7
3
512244
1
3
8
3
7
64
150105
117
116
3
13
2137
4
1
11
1
18
7
19
32
28
7
13
3
8
13
524
12
32
5
1
2141
1265
1
3
2130
7
4
4
6
645
8
18
13
24
924
15
16
3168
11
9
Micro. Palaeoenvironment
Default
No
n M
arin
e
Tra
ns
itio
na
l
Inn
er
Ne
riti
c
Mid
dle
Ne
ritic
Div
ersity: N
an
no
pa
lae
on
tolo
gy
15
In-S
itu occurrences
1
1
3
21
111
4
54
86
61
82
1
3
1
2
1
11
99
1
25
1
8
1
1
1
2
22
41
1
1
5
1
8
3
4
Nanno.
To
tal co
un
t: N
an
no
pa
lae
on
tolo
gy
20
In-S
itu occurrences
3
1
5
21
1
1
1
5
65
98
61
1121
4
1
2
1
1
1
2438
1
27
1
11
1
3
1
2
22
91
1
1
7
1
11
3
9
Nanno.
Events
7460' 10.35Ma SB
7983' 10.4Ma MFS
10359' 10.6Ma SB
10561' 11.5Ma MFS
11170' 12.1Ma SB
Depth
4000'
4250'
4500'
4750'
5000'
5250'
5500'
5750'
6000'
6250'
6500'
6750'
7000'
7250'
7500'
7750'
8000'
8250'
8500'
8750'
9000'
9250'
9500'
9750'
10000'
10250'
10500'
10750'
11000'
11250'
11500'
Gamma Log(API)0 150
Lit
ho
log
y
Deep Laterolog(ohm m/m)0.2 2000
Lit
ho
stratig
rap
hy
4000
BE
NIN
FO
RM
AT
ION
7462
11600
AG
BA
DA
FO
RM
AT
ION
Fo
rm
atio
n
Seq
uen
ce
4000
LO
WS
TA
ND
PR
OG
RA
DIN
G C
OM
PL
EX
HST8018
TS
T
8469
LO
WS
TA
ND
PR
OG
RA
DIN
G C
OM
PL
EX
HST
TST9703
LO
WS
TA
ND
PR
OG
RA
DIN
G C
OM
PL
EX
11114
HS
T
11375
11600
TS
T
To
tal co
un
t: M
icro
pa
lae
on
tolo
gy
40
In-S
itu occurrences
24
33
36
8
10
3
4
2
6
3
1
14
19
24
17
3
8
6
5
21
41
5
12
10
18
13
17
17
44
12
46
17
7
23
27
7
5
12
5
4
35
5
28
16
130
14
3
3
1
1
2
4101
2
12
3
30
13
11
7
310
5122
1
44
3
8
3
7
64
150105
117
116
3
13
2
137
4
1
11
1
18
7
1922
3228
327
13
3
8
13
524
12
32
5
1
2
14112
1
3
2
7
4
4
6
645
8
18
13
24
159
15
16
3168
1117
9
25
56
43
Micro.
Div
ersity: M
icro
pa
lae
on
tolo
gy
15
In-S
itu occurrences
14
16
13
8
7
3
3
2
5
3
1
9
10
13
10
2
5
6
4
12
16
5
9
7
7
6
10
8
12
7
15
9
5
8
13
3
4
7
4
4
15
5
8
8
26
7
2
2
1
1
1
425
2
4
1
11
5
6
7
39
420
112
2
4
3
5
28
2525
32
29
3
9
232
3
1
8
1
10
5
913
1613
165
8
3
2
10
514
10
10
5
1
2
249
1
2
1
4
4
4
3
318
6
7
10
16
136
9
10
326
814
8
13
19
18
Micro. Palaeoenvironment
Default
No
n M
arin
e
Tra
ns
itio
na
l
Inn
er
Ne
riti
c
Mid
dle
Ne
ritic
Div
ersity: N
an
no
pa
lae
on
tolo
gy
20
In-S
itu occurrences
1
1
3
21
1
1
1
4
54
86
61
821
3
1
2
1
1
1
9
9
1
25
1
8
1
1
1
2
22
41
81
1
5
1
3
4
5
Nanno.
To
tal co
un
t: N
an
no
pa
lae
on
tolo
gy
25
In-S
itu occurrences
3
1
5
21
1
1
1
5
65
98
61
1121
4
1
2
1
1
1
24
50
1
27
1
11
1
3
1
2
22
91
321
1
7
1
3
9
7
Nanno.
Events
7933' 10.35 Ma SB
8018' 10.4 Ma MFS
9547' 10.6Ma SB
9623' 11.5Ma MFS
11113' 12.1Ma SB
11374' 12.8Ma MFS
Depth
4000'
4250'
4500'
4750'
5000'
5250'
5500'
5750'
6000'
6250'
6500'
6750'
7000'
7250'
7500'
7750'
8000'
8250'
8500'
8750'
9000'
9250'
9500'
9750'
10000'
10250'
10500'
10750'
11000'
11250'
11500'
11750'
12000'
12250'
12500'
12750'
13000'
Gamma Log(API)0 150
Lit
ho
log
y
Deep Induction(ohm m/m)0.2 2000
Lit
ho
stratig
rap
hy
4000
Be
nin
Fo
rma
tio
n
7560
13000
Ag
ba
da
Fo
rma
tio
nF
orm
atio
n
Seq
uen
ce
4000
Lo
wsta
nd
Pro
gra
din
g C
om
ple
x
8717
HS
T
10689
TS
T
10884
Lo
wsta
nd
Pro
gra
din
g C
om
ple
x
HST11885
TS
T
12615
HS
T
12819
13000
TS
T
Samples
Barren
4040
4100
4160
4220
4280
4340
4400
4460
4520
4580
4640
4700
4760
4820
4880
4940
500050105060
5120
5180
5240
5300
5360
5420
5480
5540
5600
5660
5720
5780
5840
5900
5960
6020
6080
6140
6200
6260
6320
6380
6440
6500
6560
6680
6740
6800
6860
6920
6980
7040
7100
7160
7220
7280
7340
740074447460
7520
7580
7640
7700
7760
7820
7880
794079788000
8060
8120
8180
8240
8420
8480
8540
8600
86608661
8720
8780
8840
8900
89608962
9020
9080
9140
9260
9320
9380
9440
9500
9560
9620
96739680
9740
9800
9860
9920
9980999410040
10100
10160
10220
10280
1033610340
10400
10460
10520
10580
106401068910700
10760
108201087110880
10940
11000
11060
11120
11180
11240
113001130811360
11420
11480
11540
11600
11660
11720
1178011787118401188511900
11960
12020
12080
12140
12200
12260
12320
12380
12440
12500
12560
1261512620
12680
12740
128001281912860
12920
Div
ersity: M
icro
pa
lae
on
tolo
gy
20
In-S
itu occurrences
14
16
13
8
7
3
3
2
5
3
1
9
10
13
10
2
5
6
4
12
16
5
9
7
7
6
10
8
12
7
15
9
5
8
13
3
4
7
4
4
15
5
8
8
26
7
2
2
1
1
1
425
2
4
1
11
5
6
7
3
420
1
2
4
3
5
28
2525
32
29
3
9
232
3
1
8
1
10
5
9
16
13
255
8
3
2
10
514
10
10
5
1
2
249
1
2
1
4
412
4
3
318
6
7
10
16
6
9
10
326
8
8
13
19
18
11
10
920
1126
9
23
7
8
7
2
3
8
6
6
7
2
57
8
6
316
4
8
Micro.T
ota
l co
un
t: M
icro
pa
lae
on
tolo
gy
50
In-S
itu occurrences
24
33
36
8
10
3
4
2
6
3
1
14
19
24
17
3
8
6
5
21
41
5
12
10
18
13
17
17
44
12
46
17
7
23
27
7
5
12
5
4
35
5
28
16
130
14
3
3
1
1
2
4101
2
12
3
30
13
11
7
3
5122
1
3
8
3
7
64
150105
117
116
3
13
2
137
4
1
11
1
18
7
19
32
28
687
13
3
8
13
524
12
32
5
1
2
14112
1
3
2
7
444
4
6
645
8
18
13
24
9
15
16
3168
11
9
25
56
43
21
14
1140
1898
23
61
15
16
15
2
3
16
13
7
8
2
815
16
11
332
4
16
Micro. Palaeoenvironment
Default
No
n M
arin
e
Tra
ns
itio
na
l
Inn
er
Ne
riti
c
Mid
dle
Ne
ritic
Samples
Barren
40104040407041004130416041904220425042804310434043704400443044604490452045504580461046404670470047304760479048204850488049104940497050005030506050905120515051805210524052705300533053605390542054505480551055405570560056305660569057205750578058105840587059005930596059906020605060806110614061706200623062606320635063806410644064706500653065606590662066506680671067406770680068306860689069206950698070407100713071607190722072507310734073707400743074447490752075507580761076407670770077307760779078207850788079107940797079788000803080608090812081508180821082408270830083308360839084208450848085108540857086308660866186908720875087808810884088708900893089608962899090209050908091109140917092009230926092909320938094109440947095009530956095909620965096809710974097709800983098609890992099509980100101004010070101001013010160101901022010250102801031010336103401037010400104301046010490105201055010580106101064010670106891070010730107601082010850108801091010940109701100011030110601109011120111501118011210112401127011300113081133011360113901142011450114801151011540115701160011630116601169011720117501178011810118401187011885119001193011960
12819
Div
ersity: N
an
no
pa
lae
on
tolo
gy
10
In-S
itu occurrences
1
1
3
21
111
4
54
86
61
82
1
3
1
2
1
11
9
1
25
1
8
1
1
1
2
22
41
1
1
5
1
9
3
4
1
8
5
Nanno.
To
tal co
un
t: N
an
no
pa
lae
on
tolo
gy
12
In-S
itu occurrences
3
1
5
21
111
5
65
98
61
112
1
4
1
2
1
11
24
1
27
1
11
1
3
1
2
22
91
1
1
7
1
34
3
9
1
11
18
Nanno.
Events
9673' 10.35 Ma SB
10689' 10.4 Ma MFS
11786' 10.6Ma SB
11885' 11.5Ma MFS
12615' 12.1Ma SB
12819' 12.8Ma MFS
Depth
4000'
4250'
4500'
4750'
5000'
5250'
5500'
5750'
6000'
6250'
6500'
6750'
7000'
7250'
7500'
7750'
8000'
8250'
8500'
8750'
9000'
9250'
9500'
9750'
10000'
10250'
10500'
10750'
11000'
11250'
11500'
11750'
12000'
12250'
12500'
12750'
13000'
Well Name : TOMBOY-1Operator : TOMBOY
Well Code: TOMBOY-1
Lat/Long : 52°31' 25.01"N 2° 2' 3.00"E
Interval Various
Scale Various
Chart date: 28 January 2003 Project
Chart
: BIOSTRAT
: TOMBOY-CORRELATION
TOMBOY-1 TOMBOY-2 TOMBOY-4 TOMBOY-5 TOMBOY-6
Base Lithology
clay
shale/mudstone
silty mudstone
sandy mudstone
siltstone
argillaceous siltstone
sandy siltstone
sandstone (fine - medium)
sandstone (coarse)
argillaceous sandstone
mixed sandstone (70% coarse)
Text Keys*1 Palaeoenvironment
*2 Default
Tomboy-1 Tomboy-2 Tomboy-4 Tomboy-5 Tomboy-6
Fig. 12. Correlation Chart of Five Wells in Tomboy Field (Source: Obaje [14])
International Journal of Science and Technology (IJST) – Volume 2 No. 9, September, 2013
IJST © 2013– IJST Publications UK. All rights reserved. 659
REFERENCES
[1] Adegoke, O.S. (2002): High resolution
biostratigraphy, sequence stratigraphy, 3-D
modeling: indispensable tools for E & P
activities in the new millennium. NAPE
Bulletin vol. 16, no. 1, pp. 46 – 65.
[2] Andrew, T., 2013. Seismic stratigraphy,
Published Lecture Notes, Department of Earth
Sciences, National Central Univ., Taiwan, 48
pp. Available at
http://140.115.21.141/download/courses/sequen
ce_strat/10_seismic_stratigraphy.pdf
[3] Asquith, G. B. and Gibson, C. R. (1999): Basic
well log analysis for geologists. AAPG Methods
in Exploration Series no. 3, 218 pp.
[4] Avbovbo, A.A., 1978. Tertiary lithostratigraphy
of Niger Delta, AAPG Geol. Notes, pp. 296-
300.
[5] Busch, D.A., 1975. Influence of growth faulting
on sedimentation and prospect evaluation. Am.
Assoc. Petrol. Geol. Bulletin, v. 59, No. 3, p.
414–419.
[6] Emery, D. and Myers, K. (1997):
Sequence stratigraphy. Blackwell
Science, Australia, 297 pp.
[7] Esan, A.O., 2002. High resolution sequence
stratigraphic and reservoir characterization
studies of D-07, D-08 and E-01 sands, Block 2
Meren Field, Offshore, Niger Delta,’’ Publ.
M.S. Geology Thesis, Texas A & M University,
Texas, USA, 115 pp.
[8] Doust, H. and Omatsola, E., 1990. Niger Delta.
In Edwards, J.D. and Santogrossi, P.A. (Eds.),
Divergent/Passive Margin Basins, American
Association of Petroleum Geologists Memoir
48, pp. 201-239.
[9] Frankl, E.J. and Cordy, E.A., 1967. The Niger
Delta Oil Province Recent Development
Onshore and Offshore, 7th
World Petroleum
Congress Proceedings, Mexico City, IB, pp.
195-209.
[10] Juhlin C., 2008. Seismic Stratigraphy
Interpretation Applied to Sequence
Stratigraphy. Published Lecture Notes of
Department of Earth Sciences, Uppsala
University, Sweden, 40 pp. Available at
http://www.geofys.uu.se/cj/seis_strat/notes/seis
_strat_interp_notes_web.pdf
[11] Knox, G.J. and Omatsola, E.M., 1989.
Development of the Cenozoic Niger delta in
Terms of the “Escalator Regression” Model and
Impact on Hydrocarbon Distribution. In. van
der Linden, W.J.M. et al. (Eds.), Proceedings,
KNGMG Symposium on Coastal Lowlands,
Geology, Geotechnology, Dordrecht, Kluwer
Academic Publishers, pp. 181-202.
[12] McGraw-Hill Science and Technology
Encyclopedia (2013): Seismic stratigraphy,
AnswersCorporation. Available at
http://www.answers.com/topic/seismic-
stratigraphy
[13] Mitchum, R. M., Jr., Sangree, J. B., Vail, P. R.
and Wornardt, W. W. (1993): Recognizing
sequences and systems tracts from well logs,
seismic data, and biostratigraphy: examples
from the Late Cenozoic of the Gulf of Mexico,
in: Weimer, P. and Posamentier, H. (eds.),
Siliciclastic sequence stratigraphy, AAPG
Memoir no. 58, Tulsa, USA, pp. 163–197.
[14] Obaje, S.O., 2011. Sequence Stratigraphy and
Biostratigraphy of XY-1 (Tomboy) Field,
Offshore Western Niger Delta, Nigeria.
Unpublished PhD Geology dissertation, Federal
University of Technology, Minna, Nigeria,
254pp.
[15] Obaje, S.O. and Okosun, E.A., 2013. Planktic
Foraminiferal Biozonation and Correlation of
XY-1 Field, Offshore Western Niger Delta,
Nigeria. Int. J. Sci. Techn., v. 3 no. 3, pp. 160-
167.
[16] Ojo, E.A., Fadiya, L.S. and Ehinola, O.A.,
2009. Biozonation and correlation of BDX-1
and BDX-2 wells of deep offshore Niger Delta
using calcareous nannofossils, Search and
Discovery Article (AAPG) no. 50194, 8 pp.
[17] Okosun, E.A., 2013. The Traverses of a
stratigrapher in Nigerian sedimentary basins.
Published Inaugural Lecture Series 26, Federal
University of Technology, Minna, Nigeria, 64
pp.
[18] Ramsayer, G.R., 1979, Seismic Stratigraphy, A
Fundamental Exploration Tool, Publisher
Offshore Technology Conference, USA, 10 pp.
Available at
http://www.onepetro.org/mslib/servlet/onepetro
preview?id=OTC-3568-MS
[19] Schlumberger, 1985. Log Interpretation
Principle and Applications, Schlumberger
Educational Services, order no. SMP-7017,
Houston, USA.
[20] Shaw, J.H., Nova, E. and Connors, C.D., 2004.
Structural controls on growth stratigraphy in
contractional fault-related folds, in: McClay,
K.R. (ed.), Thrust tectonics and hydrocarbon
systems. AAPG Memoir 82, pp. 400– 412.
International Journal of Science and Technology (IJST) – Volume 2 No. 9, September, 2013
IJST © 2013– IJST Publications UK. All rights reserved. 660
[21] Short, K.C. and Stäuble, A.J., 1967. Outline of
Geology of Niger Delta,’’ American
Association of Petroleum Geologists Bulletin 5,
vol. 51, pp. 761-779.
[22] Snedden, J. W. and Sarg, J. F.N. (2008):
Seismic stratigraphy: A primer on methodology,
Search and Discovey Article no. 40270, 29 pp.
Available at
http://www.searchanddiscovery.net/documents/
2008/08004snedden/index.htm
[23] Tuttle, L.W.M., Charpentier, R.R. and
Brownfield, E.M., 1999. The Niger Delta
Petroleum System: Niger Delta Province,
Nigeria Cameroon, and Equatorial Guinea,
Africa, U.S. Geological Survey Open-File
Report 99-50-H, Denver, Colorado, 70 pp.
[24] Vail, S.S., 2013. Seismic stratigraphy.
Published Lecture Note, Department of
Geology, University of Puerto Rico, Mayaguez
(UPRM). Available at
http://geology.uprm.edu/Classes/GEOL6992/SS
VailRevol.pdf
[25] Van Wagoner, J.C., Mitchum, R.M., Campion,
K.M. and Rahmanian, V.D., 1990. Siliciclastic
sequence stratigraphy in well logs, cores and
outcrops: concepts of high-resolution
correlation of of time and facies: Am. Assoc.
Petrol. Geol., Methods in Exploration no. 7,
pp. 1–55.
[26] Weber, K.J. and Daukoru, E., 1975. Petroleum
Geology of the Niger Delta, Proceedings of the
9th
World Petroleum Congress, Tokyo, vol.2,
pp. 202-22.
[27] Whiteman, A., 1982. Nigeria- Its Petroleum
Geology, Resources and Potential, London,
Graham and Trotman, p. 394.
[28] Wiktionary, 2013. Available at
http://en.wiktionary.org/wiki/seismic_stratigrap
hy