Fokker–Planck equation analysis of randomly excited nonlinear energy harvester P. Kumar a , S. Narayanan a , S. Adhikari b,n , M.I. Friswell b a Machine Design Section, Department of Mechanical Engineering, Indian Institute of Technology Madras, Chennai 600036, India b College of Engineering, Swansea University, Singleton Park, Swansea SA2 8PP, UK article info Article history: Received 15 November 2012 Received in revised form 6 November 2013 Accepted 6 November 2013 Handling Editor: W. Lacarbonara Available online 18 December 2013 abstract The probability structure of the response and energy harvested from a nonlinear oscillator subjected to white noise excitation is investigated by solution of the corresponding Fokker–Planck (FP) equation. The nonlinear oscillator is the classical double well potential Duffing oscillator corresponding to the first mode vibration of a cantilever beam suspended between permanent magnets and with bonded piezoelectric patches for purposes of energy harvesting. The FP equation of the coupled electromechanical system of equations is derived. The finite element method is used to solve the FP equation giving the joint probability density functions of the response as well as the voltage generated from the piezoelectric patches. The FE method is also applied to the nonlinear inductive energy harvester of Daqaq and the results are compared. The mean square response and voltage are obtained for different white noise intensities. The effects of the system parameters on the mean square voltage are studied. It is observed that the energy harvested can be enhanced by suitable choice of the excitation intensity and the parameters. The results of the FP approach agree very well with Monte Carlo Simulation (MCS) results. & 2013 Elsevier Ltd. All rights reserved. 1. Introduction Vibration based energy harvesting systems using piezoelectric, electromagnetic and electrostatic devices have been the subject of intense research in the last decade leading to efficient capturing of small amounts of energy from vibrating structures which when converted into electrical energy can be used to power micro and nano-electronic devices, sensors and recharge batteries. Significant research contribution in this area of vibration energy harvesting can be found in Refs. [1–7]. Several authors [8–10] considered the problem of determining optimal system parameters for maximizing the harvested energy. Most of the early works in this area focused on systems subjected to deterministic excitation, typically to harmonic excitation. An important factor to be considered in these cases is to rely on the system performance near resonance requiring the frequency of excitation to be close to system natural frequency. Even slight deviation of the applied ambient excitation from the resonant condition resulted in significant reduction in the harvested energy. This led to the consideration of energy harvesters which are effective over a wide range of frequencies and to the study of their performance subjected to broad band random excitation. The consideration of random excitation has also to do with the fact that in many practical situations the ambient excitation could per se be stochastic. Lefeuvre et al. [10] were one of the first to Contents lists available at ScienceDirect journal homepage: www.elsevier.com/locate/jsvi Journal of Sound and Vibration 0022-460X/$ - see front matter & 2013 Elsevier Ltd. All rights reserved. http://dx.doi.org/10.1016/j.jsv.2013.11.011 n Corresponding author. Tel: þ44 1792 602088; fax: þ44 1792 295676. E-mail addresses: [email protected] (P. Kumar), [email protected] (S. Narayanan), [email protected] (S. Adhikari), [email protected] (M.I. Friswell). Journal of Sound and Vibration 333 (2014) 2040–2053
Transcript
Contents lists available at ScienceDirect
Journal of Sound and Vibration
Journal of Sound and Vibration 333 (2014) 2040–2053
0022-46http://d
n CorrE-m
M.I.Frisw
journal homepage: www.elsevier.com/locate/jsvi
Fokker–Planck equation analysis of randomly excitednonlinear energy harvester
P. Kumar a, S. Narayanan a, S. Adhikari b,n, M.I. Friswell b
a Machine Design Section, Department of Mechanical Engineering, Indian Institute of Technology Madras, Chennai 600036, Indiab College of Engineering, Swansea University, Singleton Park, Swansea SA2 8PP, UK
a r t i c l e i n f o
Article history:Received 15 November 2012Received in revised form6 November 2013Accepted 6 November 2013
Handling Editor: W. Lacarbonara
between permanent magnets and with bonded piezoelectric patches for purposes of energy
Available online 18 December 2013
0X/$ - see front matter & 2013 Elsevier Ltd.x.doi.org/10.1016/j.jsv.2013.11.011
The probability structure of the response and energy harvested from a nonlinear oscillatorsubjected to white noise excitation is investigated by solution of the correspondingFokker–Planck (FP) equation. The nonlinear oscillator is the classical double well potentialDuffing oscillator corresponding to the first mode vibration of a cantilever beam suspended
harvesting. The FP equation of the coupled electromechanical system of equations isderived. The finite element method is used to solve the FP equation giving the jointprobability density functions of the response as well as the voltage generated from thepiezoelectric patches. The FE method is also applied to the nonlinear inductive energyharvester of Daqaq and the results are compared. The mean square response and voltage areobtained for different white noise intensities. The effects of the system parameters on themean square voltage are studied. It is observed that the energy harvested can be enhancedby suitable choice of the excitation intensity and the parameters. The results of the FPapproach agree very well with Monte Carlo Simulation (MCS) results.
& 2013 Elsevier Ltd. All rights reserved.
1. Introduction
Vibration based energy harvesting systems using piezoelectric, electromagnetic and electrostatic devices have been thesubject of intense research in the last decade leading to efficient capturing of small amounts of energy from vibrating structureswhich when converted into electrical energy can be used to power micro and nano-electronic devices, sensors and rechargebatteries. Significant research contribution in this area of vibration energy harvesting can be found in Refs. [1–7]. Several authors[8–10] considered the problem of determining optimal system parameters for maximizing the harvested energy.
Most of the early works in this area focused on systems subjected to deterministic excitation, typically to harmonicexcitation. An important factor to be considered in these cases is to rely on the system performance near resonancerequiring the frequency of excitation to be close to system natural frequency. Even slight deviation of the applied ambientexcitation from the resonant condition resulted in significant reduction in the harvested energy. This led to theconsideration of energy harvesters which are effective over a wide range of frequencies and to the study of theirperformance subjected to broad band random excitation. The consideration of random excitation has also to do with the factthat in many practical situations the ambient excitation could per se be stochastic. Lefeuvre et al. [10] were one of the first to
P. Kumar et al. / Journal of Sound and Vibration 333 (2014) 2040–2053 2041
investigate energy harvesting under random excitation. Soliman et al. [11] and Halvorsen [12] also investigated theperformance of a vibration energy harvester under wide band random excitation. Adhikari et al. [13] using random vibrationtheory derived closed form expressions for the mean power harvested by a piezoelectric based energy harvester attached toa vibrating structure subjected to base Gaussian white noise random excitation. The systems considered in the above studieswere linear systems.
It has been observed that nonlinear vibrating systems can be used as energy harvesters with bonded piezoelectricmaterial for improved performance and effective operation over a range of frequencies. Erturk et al. [14], Stanton et al. [15]and Gammaitoni et al. [16] were a few of the researchers who investigated energy harvesting from nonlinear oscillators.They considered the excitation to be harmonic in their studies. Arrieta et al. [17] experimentally investigated energyharvesting from a bistable composite plate with bonded piezoelectric layers subjected to harmonic excitation. Theyexploited the rich nonlinear behaviour of the plate such as chaos and subharmonic motions and showed that sufficientenergy can be extracted from the piezo-composite plate over a wide frequency range due to large amplitude vibrations. Inthese studies the excitation was assumed to be harmonic.
Recently, energy harvesting from nonlinear oscillators subjected to broad band random excitation has been the subject ofinvestigation by a number of researchers. Litak et al. [18] investigated a nonlinear magneto piezoelectric energy harvestingsystem subjected to Gaussian band limited white noise excitation essentially by numerical simulation. The systemconsidered by them was the classical double-well potential Duffing oscillator first studied by Moon and Holmes [19] toexperimentally demonstrate chaos. The model considered by Litak et al. [18] consists of a cantilever beam suspendedbetween permanent magnets at its free end to simulate the double well potential condition as in the Moon's experimentand subjected to base random excitation. The random excitation was assumed to be band limited Gaussian white noise. Inthe model, piezoelectric patches are bonded near the fixed end to make it as an energy harvester. Their study indicated thatthe nonlinear piezomagnetoelastic oscillator was most efficient as an energy harvesting device in specific ranges of theexcitation intensity. Ali et al. [20] used the equivalent linearization method to analyze the above system and derived closedform approximate expressions for the response statistics and the mean square harvested energy. It was also shown by themthat there exists an optimal value of the intensity of the excitation maximizing the mean harvested power.
The response of a dynamical system to white noise or delta correlated random excitation constitutes a Markov vectorprocess whose transition joint probability density function (PDF) is governed by the Fokker–Planck (FP) equation. Exactsolutions for the FP equation are available in the literature only for a few simple low dimensional nonlinear oscillators.In recent years, a number of efficient numerical methods for the solution of the FP equation of nonlinear systems subjectedto random excitation have been developed such as the path integral (PI) method [21,22], the finite element (FE) method[23,24], and the finite difference method (FD) [24,25]. The advantage of the solution of the FP equation lies in the fact thatthe joint PDF of the response of the nonlinear system can be directly obtained. The response statistics and reliabilityestimates such as the first passage time and level crossing statistics can be obtained from the joint PDF.
In the context of the energy harvesting problem from randomly excited nonlinear systems, the solution of thecorresponding Fokker–Planck–Kolmogorov (FPK) equation has been considered only by a few authors. Daqaq [26] obtainedclosed form solution of the FPK equation of an energy harvesting system of a bi-stable Duffing oscillator with double wellpotential connected to an inductive power generator. The inductive power generating mechanism results in a linearalgebraic relation between the relative velocity of the nonlinear oscillator and the support and the voltage generated acrossthe load resistance in terms of an electro-mechanical coupling coefficient. Using this relation in the oscillator equation ofmotion results in a second-order nonlinear system with an effective damping coefficient essentially retaining the originalform of the Duffing oscillator. This enables obtaining a closed form solution of the corresponding stationary FPK equation asthe product of two separable probability densities in terms of the displacement and velocity of the oscillator whenthe oscillator is subjected to support white noise excitation. The probability density function of the voltage will also be ofthe same form as the velocity as they are linearly related. They also considered the support excitation as belonging to theOrnstein–Uhlenbeck type with exponentially decaying auto-correlation function and obtained approximate solution of theFPK equation and the response statistics by an iterative process. This excitation was considered as the output of a first-orderlinear filter to white noise. They concluded that the expected value of the generated power is independent of the doublewell potential shape in the case of white noise excitation, while in the case the coloured noise excitation an optimum shapeof the double well potential existed for maximum generated power.
In a recent paper, Green et al. [27] considered energy harvesting from a Duffing oscillator with viscous and coulombdamping subjected to support Gaussian white noise excitation. In this case, the oscillator is of the conventional single wellpotential of the hardening type and the energy harvesting mechanism is through an electro-magnetic device consisting ofan electrical circuit with an inductive coil and resistance. The coil inductance and resistance as well as the load resistancewere taken into account in the consideration of the harvested power through Faraday's law. The stationary joint probabilitydensity function of the relative displacement and velocity is obtained in separable form by the solution of the correspondingFPK equation as in Daqaq [26]. The equivalent linearization technique is used to verify the statistics obtained from the FPKequation approach.
The present paper further investigates the problem of energy harvesting from the piezomagnetoelastic nonlinearoscillator of the cantilever beam considered by Litak et al. [18] and Ali et al. [20] subjected to Gaussian white noise excitationby solution of the corresponding FP equation. In this way the probability structure of the response and the generated voltagein the piezoelectric layers are directly obtained. The FP equation is derived for the electro-mechanical system consisting of
P. Kumar et al. / Journal of Sound and Vibration 333 (2014) 2040–20532042
the coupled system of nonlinear equations representing the vibration of the cantilever beam in its first mode and thevoltage generated in the piezoelectric patches. The energy harvesting mechanism in this case is very different from thatconsidered by Daqaq [26] and Green et al. [27]. The energy harvesting mechanism is through the voltage generated from thepiezoelectric patches attached to the root of the cantilever beam [18,20]. The electro-mechanical coupling arises from themechanical force assumed proportional to the voltage across the piezo-electric material. The voltage across the loadresistance arises from the mechanical strain through electro-mechanical coupling and the capacitance of the piezo-electricpatches. This results in an additional first-order differential equation in terms of the time derivative of the voltage, voltageand velocity of the oscillator making the entire energy harvesting system a third-order coupled system. The correspondingFPK equation does not admit a closed form solution. The FE method developed in Pankaj and Narayanan [24] is used to solvethe FP equation and the joint and marginal PDFs of the response of the beam and the voltage are obtained. The mean squarevalues of these are also obtained from the corresponding PDFs.
The FE method is first applied to the solution of the FP equation of the energy harvesting problem of the nonlinearoscillator with an inductive power generator considered by Daqaq [26] for the two cases of white noise and coloured noiseexcitations. The FE results compare very well with Daqaq's results.
In the case of the piezomagnetoelastic energy harvester considered in this paper the results of the FE method comparevery well with Monte Carlo simulation (MCS) results. The results show that higher intensities of the white noise excitationabove a threshold result in better energy harvesting which is attributed to the jumps in the response from one potential wellto the other. The effect of changing the system parameters on the mean square voltage is also investigated. It is observedthat the electromechanical coupling coefficient has a significant effect on the mean square voltage, larger the couplingcoefficient greater is the mean square voltage. The mean square voltage is observed to attain a maximumwith respect to thecubic and linear stiffness parameters.
The paper is organized as follows. A brief introduction to the FP equation of nonlinear stochastic system and themagnetopiezoelastic nonlinear oscillator subjected to Gaussian white noise excitation is presented in Section 2 and thecorresponding FP equation derived. The FE method of solving the FP equation is described in Section 3. A brief description ofthe MCS method adopted to verify the FE results is given in Section 4. The results of the solution of the FP equation by the FEmethod are presented and discussed in Section 5. Important conclusions of the paper are given in Section 6.
2. Fokker–Planck equation of nonlinear energy harvester
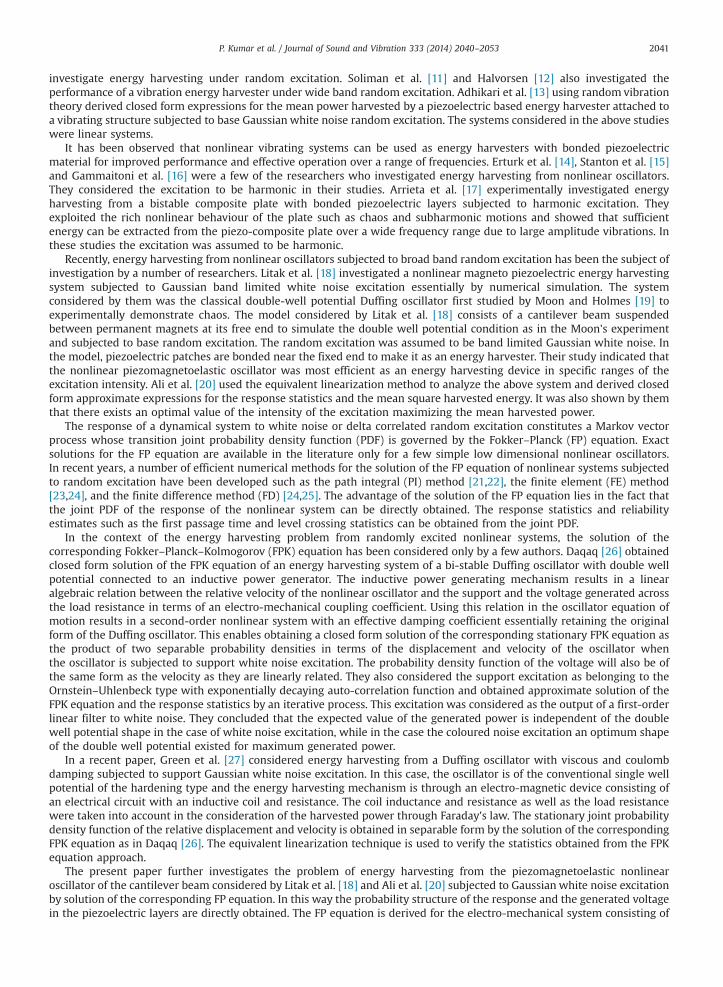
Consider the ferromagnetic cantilever beam [14] shown in Fig. 1 supported between two symmetric permanent magnetsnear the free end and subjected to support random Gaussian white noise excitation. Piezoelectric layers are bonded to thecantilever beam near the root and connected to an electrical load. The voltage generated from the piezoelectric layers acrossthe load due to the random excitation contributes to the energy harvesting. The placement of the symmetric magnets ischosen so that the beam has two stable equilibrium positions and one unstable equilibrium position simulating the classicalDuffing oscillator with double well potential.
The equations of motion of the beam corresponding to its first natural mode and the voltage generated in thepiezoelectric layers can be expressed in nondimensional form by the following coupled nonlinear electro-mechanicalequations [18]:
€Xþc _Xþkð�XþαX3Þ�χV ¼ sWðtÞ; (1)
_V þλVþβ _X ¼ 0; (2)
where X is the dimensionless transverse displacement of the beam tip, V is the dimensionless voltage across the loadresistance, χ and β are the dimensionless piezoelectric coupling coefficients 'in the two equations, c is an assumed dampingcoefficient of the viscous type, λ¼ 1=RlCp is the reciprocal of the dimensionless time constant of the electrical circuit, Rl isthe load resistance, Cp is the capacitance of the piezoelectric material, α is a nonnegative constant. W(t) is a stationary, zero
Fig. 1. Piezomagnetoelastic cantilever beam subjected to random excitation.
P. Kumar et al. / Journal of Sound and Vibration 333 (2014) 2040–2053 2043
mean unit Gaussian white noise process with E½WðtÞWðtþτÞ� ¼ δðτÞ, s is the intensity of excitation. The two sided powerspectral density of the white noise excitation on the RHS of Eq. (1) corresponding to this intensity is s2=2π.
Eqs. (1) and (2) can be expressed in state space form by introducing the variables X1 ¼ X, X2 ¼ _X and X3 ¼ V , as
dX1ðtÞdX2ðtÞdX3ðtÞ
8><>:
9>=>;¼
X2
kðX1�αX31Þ�cX2þχX3
�βX2�λX3
8><>:
9>=>;dtþ
0s
0
8><>:
9>=>;dBðtÞ; (3)
where B(t) is the unit Wiener process.The probabilistic response of multidimensional vibrational systems under Gaussian white noise random excitations in
general can be considered to be governed by the following set of first-order stochastic differential equations (SDEs):
_XðtÞ ¼m½X; t� dtþG½X; t�WðtÞ; (4)
where XðtÞ is the random response vector process, vector m½X; t� is related to the drift vector and matrix G½X; t� is related tothe diffusion matrix and WðtÞ is the Gaussian white noise random vector process with appropriate dimensions [24]. Theresponse X forms a Markov vector process whose transition PDF pðX; tjX0; t0Þ is governed by an appropriate Fokker–Planck(FP) equation. The FP equation associated with Eq. (4) can be derived from the Itô SDE of the form [28]:
dXðtÞ ¼m½X; t� dtþh½X; t� dB; (5)
where B(t) is the normalized Wiener process [29] and the corresponding FP equation of XðtÞ is given by [30]
∂pðX; tjX0; t0Þ∂t
¼ � ∑N
i ¼ 1
∂½miðX; tÞ�∂Xi
þ 12
∑N
i ¼ 1∑N
j ¼ 1
∂2½hijðX; tÞ�∂Xi∂Xj
" #pðX; tjX0; t0Þ; (6)
where pðX; tÞ is the joint PDF of the N-dimensional system state X at time t,mi is the i-th element of the drift vector and hij isthe ij-th element of the diffusion matrix h. mi½X; t� may include Wong and Zakai correction terms if there is couplingbetween some of the response variables and excitation components as in the case of parametric excitation [29].
The transition PDF pðX; tjX0; t0Þ should satisfy the normalization condition, initial condition and the boundary conditionsat infinity, given respectively by the following equations:Z 1
�1pðX; tjX0; t0Þ dX¼ 1; (7)
limt-0
pðX; tjX0; t0Þ ¼ δðX�X0Þ; (8)
pðX; tjX0; t0ÞjXi-71 ¼ 0 ði¼ 1;…;nÞ: (9)
The stationary solution of the FP equation is obtained by letting ∂pðX; tjX0; t0Þ=∂t ¼ 0.Eqs. (3) of the energy harvesting system are of the form of the SDE (5) and the corresponding FP equation can be
expressed as per Eq. (6) as
∂p∂t
¼ �X2∂p∂X1
þ cX2�k X1�αX31
� ��χX3
� � ∂p∂X2
þ
βX2þλX3ð Þ ∂p∂X3
þ s2
2∂2p∂X2
2
þ cþλð Þp (10)
where p¼ pðX; tjX0; t0Þ the joint transition PDF of the state variables is used for notational convenience satisfying theconditions given by Eqs. (7)–(9).
In the next section the finite element (FE) method of solution of the FP equation is briefly presented.
3. Finite element method
The finite element equations are derived using the Galerkin projection of the FP equation. The solution domain, Ω, of thephase space consisting of the space variables is discretized into a collection of NE elements, each element hosting ninterpolating nodes and spanning the domain Ωe. Let fψ1ðXÞ;…;ψnðXÞg represent a set of global cardinal interpolationfunctions defined on the solution domain. Using the Galerkin method, time varying solution pðX; tÞ of the FP equation canbe written as a linear combination in terms of the prior unknown values pr of the probability densities at the globalinterpolation nodes, and the associated global cardinal basis functions fψ rðXÞgnr ¼ 1 [24]
pðX; tÞ � ∑NG
r ¼ 1prðtÞψ rðXÞ; (11)
P. Kumar et al. / Journal of Sound and Vibration 333 (2014) 2040–20532044
where NG is the number of unique global nodes. Substitution of Eq. (11) into Eq. (10) leads to the following expression for theresidual error:
R X; tð Þ ¼ ∑NG
r ¼ 1
∂prðtÞψ rðXÞ∂t
�LFP pr tð Þψ r Xð Þ� �� �(12)
where LFP ½�� is a partial differential FP operator corresponding to Eq. (6). Requiring the error term due to the FEapproximation to be orthogonal to the basis functions, the equation error RðX; tÞ is projected onto a set of independentweighting functions for the PDF. Taking the inner product of residual error on L2ðΩÞ, the space of Lebesgue integral functions,we get
⟨RðX; tÞ;ψ sðXÞ⟩¼ 0; (13)
where ⟨ � ⟩ is the L2 inner product. The weight function fψ sðXÞg represents the space over which the projection of theequation error is minimized. Hence, Eq. (13) represents a finite set of differential equations in the following form:
∑NG
r ¼ s_ptðtÞ⟨ψ rðXÞ;ψ sðXÞ⟩� ∑
NG
r ¼ sprðtÞ⟨LFPfψ rðXÞg;ψ sðXÞ⟩¼ 0: (14)
Since the FP equation is of second order, it is required that the interpolation functions be twice differentiable. Thisrequirement is weakened by using integration by parts and distributing the second derivative equally between the weightfunction and the interpolation function. Taking the inner product of the weighting function fψ iðXÞg, with the FP equation andapplying the divergence theorem, leads to the weak form of the FP equation
M _pþKp¼ 0; (15)
subject to the initial condition pð0Þ ¼ p, where, p is a vector of the joint PDF at the nodal points, where
M¼ f⟨ψ r ;ψ s⟩gΩ; (16)
K¼ZΩ
∑N
i ¼ 1ψ r Xð Þ ∂½miðXÞψ sðXÞ�
∂Xi
" #dXþ
ZΩ
∑N
i ¼ 1∑N
j ¼ 1
∂½ψ rðXÞ�∂Xi
∂½hijψ sðXÞ�∂Xj
dX
" #: (17)
A solution of Eq. (15) is obtained using the Crank–Nicholson method, which is an implicit time integration scheme withsecond-order accuracy and unconditional stability and allows large time steps to be used. The time discretized equationtakes the form:
½M�Δtð1�θÞK�pðtþΔtÞ ¼ ½MþΔtθK�pðtÞ; (18)
where the parameter θ¼0.5 and Δt is the time step.The three dimensional twenty noded isoparametric solid element as shown in Fig. 2 is chosen for the FE discretization. In
terms of the normalized coordinates ξ; η; τ. The shape functions for the corner nodes are of the form:
ψ i ¼ 18 1þξξið Þ 1þηηi
� ξξiþηηiþττi�2�
; (19)
while for a typical mid-side node with ξi ¼ 0, ηi ¼ 71, τi ¼ 71 they are given by
ψ i ¼ 18 1�ξ2�
1þηηi�
1þττið Þ; (20)
where ξi; ηi; τi are the normalized coordinates at node i. A reduced 14 points integration rule [31] is used for evaluating thestiffness like matrix K in Eq. (17) for the integration which gives a good accuracy with less computational effort of almostsimilar order as using 3�3�3 integration scheme which involves greater computational effort. Of these 14 points, sixcorrespond to three pairs of points situated symmetrically along each axis of symmetry and remaining eight correspond to
Fig. 2. Quadratic element with 20 nodes.
P. Kumar et al. / Journal of Sound and Vibration 333 (2014) 2040–2053 2045
those situated symmetrically about each plane of symmetry just similar to 2�2�2 Gauss rule in the case of 8 noded solidelements.
4. Monte Carlo simulation
In order to check the accuracy of the solution of the FP equation obtained by the FE method Monte Carlo Simulation(MCS) is used for the system of Eqs. (3). The MCS is a direct numerical method which involves the sampling of theunderlying probability space to generate a family of sample functions of the excitation and generating a correspondingfamily of sample functions of the response by numerical integration of the nonlinear set of equations to each individualexcitation from which the probability structure and statistics of the response can be obtained.
The idea of MCS is to generate samples of the random force compatible with its power spectral density and to solveEq. (3) numerically for the response for every realization of the random force. For each given sample path (realization) of theBrownian motion, Eq. (3) becomes deterministic. Due to the unique differential rules (Itô formula) of stochastic integrals, thenumerical schemes for discretizing Eq. (3) are quite different from the ones for smooth deterministic differential equations.The Euler–Maruyama (EM) discretization of Eq. (3) gives [32]
Xknþ1 ¼ Xk
nþmðXkn; tnÞΔtþgðXk
n; tnÞΔBkn (21)
The noise increments ΔBkn are Nð0;ΔtnÞ distributed independent normal random variables which can be generated
numerically by pseudo-random number generators. An efficient way to evaluate the increments of the Wiener processΔBn is to consider
Discretized Brownian paths are generated to compute the increments Bkðtnþ1Þ�BkðtnÞ in Eq. (22) using Matlab functionrandn to generate unit normal variates which are scaled by the factor
is important that the trajectories of the approximation be close to those of the Itô process and this leads to the concept ofstrong solution of the stochastic differential equation. The integration is performed using the forward EM numericalintegration of Eq. (3), until the steady state is obtained for both the statistical properties and the PDF of the system response.On an average, the transition PDF is generated from a simulation of 2.5�105 realizations with a time step of 0.0005.
5. Results and discussion
5.1. FE method applied to the inductive type energy harvester
The finite element method presented in this paper is first applied to the energy harvesting problem considered by Daqaq[26] in which the following form of the Duffing oscillator is considered:
€X�aXþbX3þc _X ¼ ξðtÞ; (23)
In Eq. (23) the damping coefficient c is an effective damping coefficient including electro-mechanical coupling effect of theinductive voltage generator and ξðtÞ is the Gaussian white noise with mean zero and EðξðtÞξðt0ÞÞ ¼ 2Dδðt�t0Þ. The Fokker–Planck equation corresponding to Eq. (23) is
∂p∂t
¼ �X2∂p∂X1
þ ∂ðaX1�cX2�bX31Þp
∂X2þD
∂2p∂X2
2
: (24)
For the stationary case, this admits a closed form solution for the joint PDF in separable form as [26]
p X1;X2ð Þ ¼ p X1ð Þ � p X2ð Þ ¼ A1 exp � cD
� 12aX2
1þ14bX4
2
� �� �� A2 exp � c
2DX22
� �(25)
where A1 and A2 are the normalization constants given by [26]
A�11 ¼
Z 1
1exp � c
D� 1
2aX2
1þ14bX4
2
� �� �dX1; A�1
2 ¼Z 1
1exp � c
2DX22
� �dX2 (26)
These constants are derived as
A�11 ¼ 2D
bc
� �0:25
Γ12
� �exp
a2c8Db
� �Θ�0:5 �
ffiffiffiffiffiffiffiffiffia2c2Db
r !; A�1
2 ¼ πDc
� �0:5
(27)
where Θ�0:5 is the Weber function. The joint PDF of displacement and velocity using the closed form solution of Eq. (25) andthat obtained by the FE method for the parameters c¼0.05, D¼0.05, a¼1.5 and b¼0.1 are shown in Fig. 3. From the figure itis clear that they are in very good agreement. The contour plots of the joint PDFs by both the methods are shown in Fig. 4again showing the close agreement between the two. In fact the results obtained by the FEM overlap on the results obtainedby closed form solution. Marginal PDF of displacement for a specific velocity and marginal PDF of velocity for a specific
−10−5
05
10
−10−5
05
100
0.02
0.04
0.06
0.08
0.1
0.12
DisplacementVelocity
Join
t PD
F
MS of X=14.1759MS of X−dot=0.9996
Fig. 3. Joint PDF of displacement and velocity of inductive energy generator (a) FEM and (b) Daqaq [26].
0.04
0.04
0.08
0.08
Displacement
Vel
ocity
−6 −4 −2 0 2 4 6−6
−4
−2
0
2
4
6FEMTrue
Fig. 4. Contour plot of joint PDF for inductive energy generator FEM and Daqaq [26].
P. Kumar et al. / Journal of Sound and Vibration 333 (2014) 2040–20532046
displacement obtained by the closed form solution and the FE methods are shown in Fig. 5, once again showing the closeagreement between the two.
The FE method is also applied to the other problem considered by Daqaq [26] in which the excitation ξðtÞ in Eq. (23) is ofthe Ornstein–Uhlenbeck process type having the exponential correlation function EðξðtÞξðt0ÞÞ ¼ 2Dγexp�jt� t0j.
ξðtÞ can be considered as the output of a linear first-order filter to white noise excitation given by
_ξþγξ¼ ηðtÞ: (28)
The corresponding joint PDF associated with Eqs. (23) and (28) is governed by the following FP equation:
∂p∂t
¼ �X2∂p∂X1
þ ∂ðaX1�cX2�bX31þX3Þp
∂X2�γ
∂ðX3Þp∂X3
þDγ∂2p∂X2
2
(29)
where pðx; _x; ξ; tÞ is the joint PDF of x; _x and ξ. Daqaq [26] obtained an approximate closed form solution for the joint PDF of xand _x, pðx; _xÞ for small noise intensity ξðtÞ, neglecting the third variable ξ, by an iterative process of first obtaining the meansquare value of displacement and using the same in the expression for mean square velocity and substituting in theseparable form of the joint PDF. The FE method presented in this paper is also applied to this problem in which the joint PDFof x; _x and ξ has been obtained. The mean square value of velocity for the parameters c¼D¼0.05, γ¼1 for three differentvalues of b, b¼0.5, 1 and 5 and the FE method are shown in Fig. 6. The mean square velocity obtained by the MCS methodand by the approximate solution of Daqaq is also shown in the figure. It is observed that the results obtained by the FEmethod are closer to the MCS results than the approximate results of Daqaq.
5.2. FE method applied to the piezomagnetoelastic type energy harvester
In this section the FE method is applied to the problem under consideration in this paper namely the piezomagnetoelasticnonlinear energy harvester given by Eqs. (1) and (2). The FP equation corresponding to the piezomagnetoelastic nonlinearoscillator Eq. (10) is solved by the FE method. The following parameters are adopted for the oscillator k¼0.5, α¼1, β¼0.5 andχ¼0.05. The parameter λ is varied from 0.01 to 0.05 and the damping coefficient c is varied from 0.02 to 0.05. The intensity ofthe Gaussian white noise excitation is varied in the range 0.04–0.2. The space domain is chosen as ½�4;4� � ½�4;4� � ½�4;4�which is discretized into a mesh of 50�50�50 isoparametric elements. A typical solution run, required approximately 90 minon VEGA Super cluster having Dual Processor, Quad-core, Intel E5472 processor, at IIT Madras.
0 0.5 1 1.5 2 2.5 30.1
0.15
0.2
0.25
0.3
0.35
0.4
0.45
0.5
0.55
0.6
Fig. 6. Mean square velocity vs a: FP solution (____); MCS (○); approximate solution (Daqaq) (n).
−4−2
02
4
−4−2
02
40
0.5
1
1.5
DisplacementVelocity
Join
t PD
F
0.4
0.4
0.8
0.8
1.2
1.2
Displacement
Vel
ocity
−1.5 −1 −0.5 0 0.5 1 1.5
−1
−0.5
0
0.5
1 FEMMCS
Fig. 7. (a) Joint PDF and (b) contour plot of piezomagnetoelastic energy harvester (c¼0.02, λ¼0.01, s¼0.04).
−10 −5 0 5 100
0.05
0.1
0.15
0.2
0.25
0.3
0.35
Displacement
PD
F
FEMTrue
−10 −5 0 5 100
0.05
0.1
0.15
0.2
0.25
0.3
0.35
0.4
Velocity
PD
F
FEMTrue
Fig. 5. Marginal PDF of displacement and velocity for inductive energy generator of Eq. (23), ____: FEM; ○: Daqaq [26].
P. Kumar et al. / Journal of Sound and Vibration 333 (2014) 2040–2053 2047
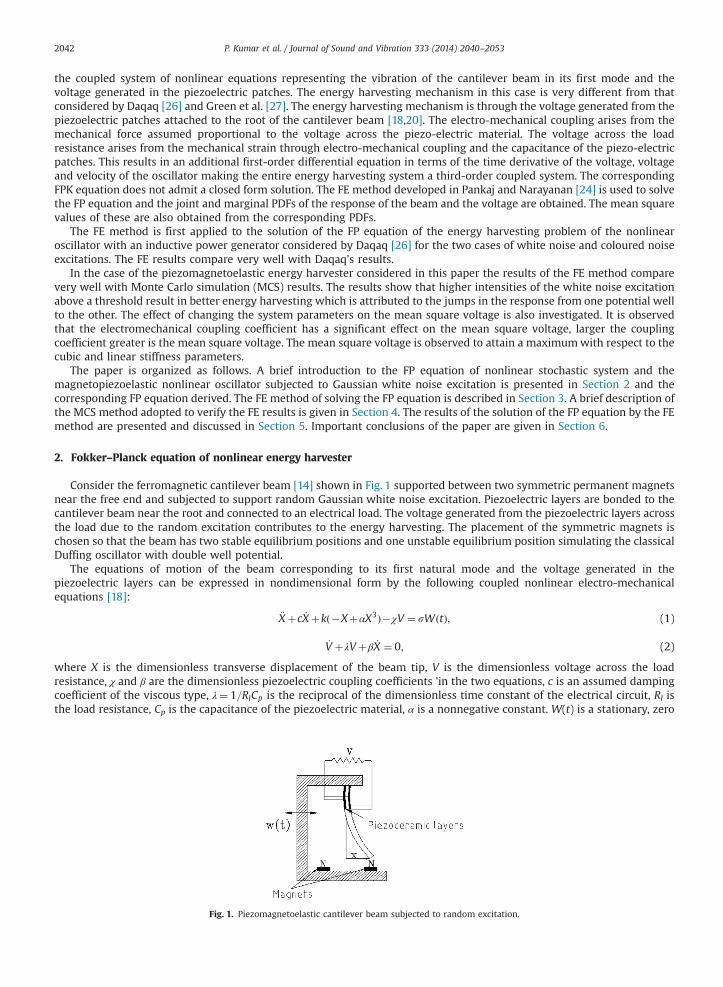
5.2.1. Joint PDFs and marginal PDFsThe joint PDF of the displacement and velocity for c¼0.02, λ¼0.01 and for different values of noise intensity
s ðs¼ 0:04;0:1;0:12Þ and the corresponding contour plots are shown respectively in Figs. 7–9. At low levels of the noiseintensity s¼ 0:04 the joint PDF shows sharp bimodal characteristics (Fig. 7) around the two equilibrium points of thedeterministic nonlinear oscillator displaying some nonlinear interaction of the oscillator responding to the external randomexcitation. Looking at the corresponding contour plots of the joint PDFs it is observed that they resemble very much
−4−2
02
4
−4−2
02
40
0.05
0.1
0.15
0.2
DisplacementVelocity
Join
t PD
F
0.04 0.04
0.04
0.04
0.08 0.08
0.08
0.12
0.12
0.12
0.16
0.160.160.2
0.2
Displacement
Vel
ocity
−3 −2 −1 0 1 2 3−3
−2
−1
0
1
2
3FEMMCS
Fig. 9. (a) Joint PDF and (b) contour plot of piezomagnetoelastic energy harvester (c¼0.02, λ¼0.01, s¼0.12).
−4−2
02
4
−4−2
02
40
0.2
0.4
0.6
DisplacementVelocity
Join
t PD
F
0.2
0.20.2
0.4
0.4
0.6 0.6
Displacement
Vel
ocity
−2 −1.5 −1 −0.5 0 0.5 1 1.5 2−2
−1.5
−1
−0.5
0
0.5
1
1.5
2FEMMCS
Fig. 10. (a) Joint PDF and (b) contour plot of piezomagnetoelastic energy harvester (c¼0.05, λ¼0.01, s¼0.1).
−4−2
02
4
−4−2
02
40
0.1
0.2
0.3
0.4
DisplacementVelocity
Join
t PD
F 0.1
0.1
0.1
0.2
0.2
0.2 0.3
0.3
0.4
0.4
Displacement
Vel
ocity
−2 −1.5 −1 −0.5 0 0.5 1 1.5 2
−2
−1.5
−1
−0.5
0
0.5
1
1.5
2FEMMCS
Fig. 8. (a) Joint PDF and (b) contour plot of piezomagnetoelastic energy harvester (c¼0.02, λ¼0.01, s¼0.1).
P. Kumar et al. / Journal of Sound and Vibration 333 (2014) 2040–20532048
the phase portraits of the deterministic oscillator with the system states having a strong tendency (larger probability) ofremaining near the two stable equilibrium points of the Duffing oscillator with the double well potential. The presence ofthe piezoelectric layer does not significantly alter the joint PDF of displacement and velocity. As the noise level is increasedsteeply to s¼0.1 and 0.12 (Figs. 8 and 9) the sharp bimodal peaks in the joint PDF tend to flatten and begin to merge
−4−2
02
4
−4−2
02
40
0.1
0.2
0.3
0.4
0.5
DisplacementVelocity
Join
t PD
F
0.1
0.1
0.1
0.2
0.2
0.2 0.3
0.3
0.4
0.40.5 0.
5
Displacement
Vel
ocity
−2 −1.5 −1 −0.5 0 0.5 1 1.5 2−2
−1.5
−1
−0.5
0
0.5
1
1.5
2FEMMCS
Fig. 11. (a) Joint PDF and (b) contour plot of piezomagnetoelastic energy harvester (c¼0.02, λ¼0.05, s¼0.1).
−4 −3 −2 −1 0 1 2 3 40
0.1
0.2
0.3
0.4
0.5
0.6
0.7
0.8
0.9
Displacement
PDF
−2.5 −2 −1.5 −1 −0.5 0 0.5 1 1.5 2 2.510−5
10−4
10−3
10−2
10−1
100
Displacement
PDF
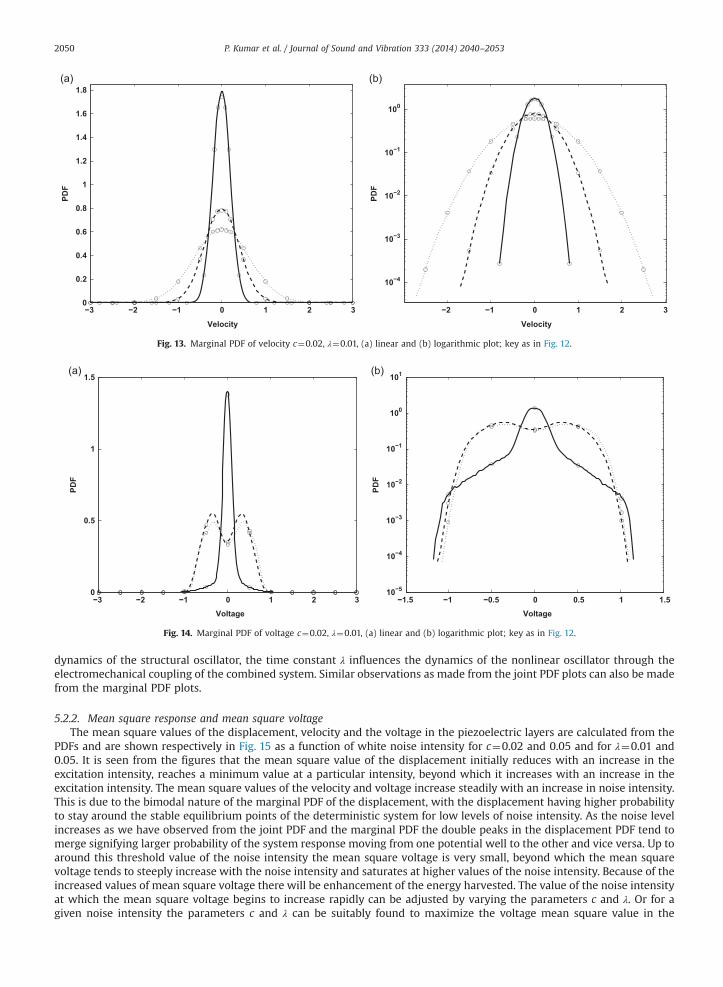
Fig. 12. Marginal PDF of displacement c¼0.02, λ¼0.01, (a) linear and (b) logarithmic plot; (s¼0.04 (____); s¼0.1 (- - - -); s¼0.12 (.....); MCS (○).
P. Kumar et al. / Journal of Sound and Vibration 333 (2014) 2040–2053 2049
showing the enhanced nonlinear interactions and showing that the system response has a propensity to jump from onepotential well to the other.
The joint PDF of the displacement and velocity and the corresponding contour plots for λ¼0.01, c¼0.05 and s¼0.1 areshown in Fig. 10 and for λ¼0.05, c¼0.02 and s¼0.1 are shown in Fig. 11. The marginal PDF of displacement, velocity and thevoltage corresponding to Figs. 7–9 are shown in Figs. 12–14 respectively both in linear as well as in logarithmic plots. TheMCS solutions are also shown in these figures by circles showing excellent agreement of the FP solution with the MCSresults validating the FE method of solution of the FP equation. Logarithmic plots show that proposed FE solution givesimpressively low order of error even at extremely small probability levels of the order of 10�4. In Table 1, the values of themarginal PDF obtained by the FE method and the MCS results for c¼0.02, λ¼0.01 and s¼0.1 are given at a few grid points. Itcan be seen from the table that the values obtained by the FE method are accurate even at very low probability levels.Maximum absolute errors in the marginal density functions in the tail region are also given in the table.
The increase in noise intensity has the effect of enhancing the harvested energy as will be seen from the steep increase inthe mean square voltage generated in the piezoelectric patches beyond a particular value of s (Fig. 15). If the noise level isstill further increased the two peaks tend to merge completely and the joint PDF diffuses around the phase space. Thecontour plots of the joint PDFs in these cases resemble the phase portraits of the Duffing oscillator corresponding to largeramplitudes of harmonic excitation the phase curves encircling both the equilibrium points. If the damping is increased toc¼0.05 even for higher levels of noise intensity s¼0.1 the sharp bimodal nature of the joint PDF is maintained (Fig. 10). Thisshows that the larger the damping in the system the intensity of the noise has to be higher for a stronger interaction of thenonlinear systemwith the random excitation. Also for a given value of the damping c¼0.02 if λ is increased to 0.05 the sharpbimodal character of the joint PDF of the response is preserved even for a larger intensity of noise s¼0.1 indicating that thetime constant parameter of the electrical circuit has a similar influence as the damping coefficient c, in that larger the valueof λ higher should be the noise intensity s for a stronger nonlinear interaction. While the damping c directly influences the
−3 −2 −1 0 1 2 30
0.5
1
1.5
Voltage
PDF
−1.5 −1 −0.5 0 0.5 1 1.510−5
10−4
10−3
10−2
10−1
100
101
Voltage
PDF
Fig. 14. Marginal PDF of voltage c¼0.02, λ¼0.01, (a) linear and (b) logarithmic plot; key as in Fig. 12.
−3 −2 −1 0 1 2 30
0.2
0.4
0.6
0.8
1
1.2
1.4
1.6
1.8
Velocity
PDF
−2 −1 0 1 2 3
10−4
10−3
10−2
10−1
100
Velocity
PDF
Fig. 13. Marginal PDF of velocity c¼0.02, λ¼0.01, (a) linear and (b) logarithmic plot; key as in Fig. 12.
P. Kumar et al. / Journal of Sound and Vibration 333 (2014) 2040–20532050
dynamics of the structural oscillator, the time constant λ influences the dynamics of the nonlinear oscillator through theelectromechanical coupling of the combined system. Similar observations as made from the joint PDF plots can also be madefrom the marginal PDF plots.
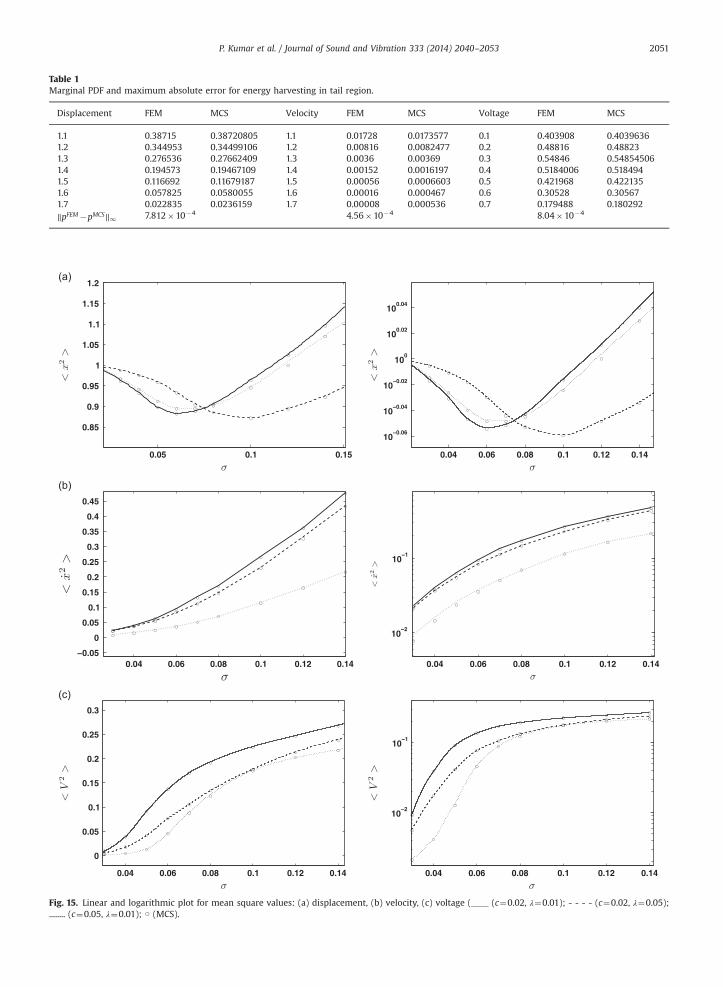
5.2.2. Mean square response and mean square voltageThe mean square values of the displacement, velocity and the voltage in the piezoelectric layers are calculated from the
PDFs and are shown respectively in Fig. 15 as a function of white noise intensity for c¼0.02 and 0.05 and for λ¼0.01 and0.05. It is seen from the figures that the mean square value of the displacement initially reduces with an increase in theexcitation intensity, reaches a minimum value at a particular intensity, beyond which it increases with an increase in theexcitation intensity. The mean square values of the velocity and voltage increase steadily with an increase in noise intensity.This is due to the bimodal nature of the marginal PDF of the displacement, with the displacement having higher probabilityto stay around the stable equilibrium points of the deterministic system for low levels of noise intensity. As the noise levelincreases as we have observed from the joint PDF and the marginal PDF the double peaks in the displacement PDF tend tomerge signifying larger probability of the system response moving from one potential well to the other and vice versa. Up toaround this threshold value of the noise intensity the mean square voltage is very small, beyond which the mean squarevoltage tends to steeply increase with the noise intensity and saturates at higher values of the noise intensity. Because of theincreased values of mean square voltage there will be enhancement of the energy harvested. The value of the noise intensityat which the mean square voltage begins to increase rapidly can be adjusted by varying the parameters c and λ. Or for agiven noise intensity the parameters c and λ can be suitably found to maximize the voltage mean square value in the
Fig. 15. Linear and logarithmic plot for mean square values: (a) displacement, (b) velocity, (c) voltage (____ (c¼0.02, λ¼0.01); - - - - (c¼0.02, λ¼0.05);........ (c¼0.05, λ¼0.01); ○ (MCS).
Table 1Marginal PDF and maximum absolute error for energy harvesting in tail region.
Displacement FEM MCS Velocity FEM MCS Voltage FEM MCS
P. Kumar et al. / Journal of Sound and Vibration 333 (2014) 2040–2053 2051
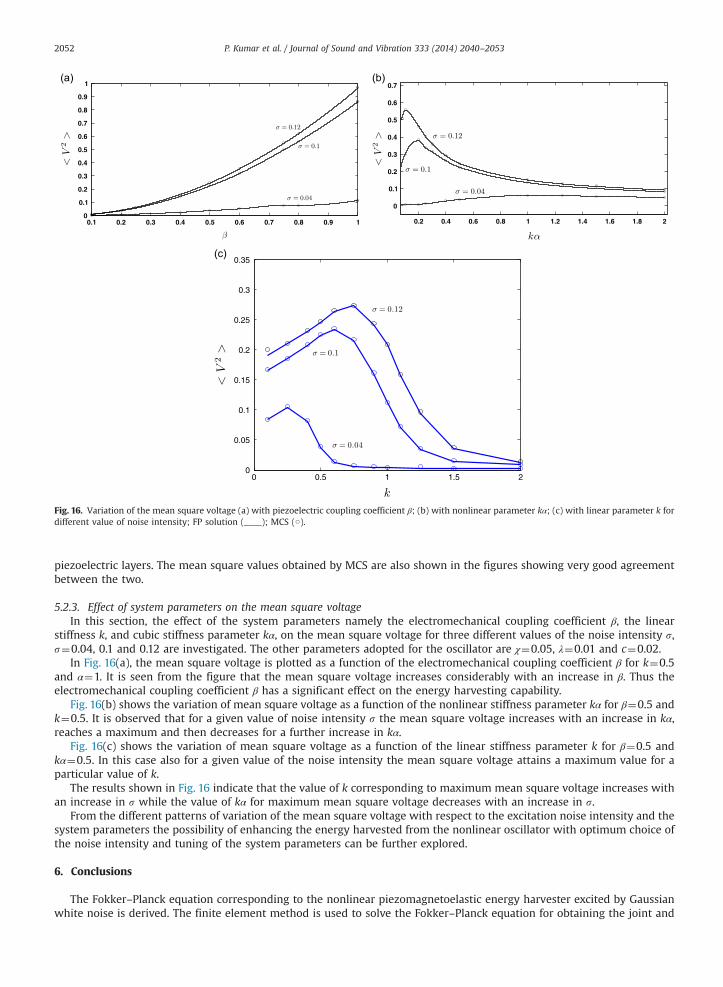
Fig. 16. Variation of the mean square voltage (a) with piezoelectric coupling coefficient β; (b) with nonlinear parameter kα; (c) with linear parameter k fordifferent value of noise intensity; FP solution (____); MCS (○).
P. Kumar et al. / Journal of Sound and Vibration 333 (2014) 2040–20532052
piezoelectric layers. The mean square values obtained by MCS are also shown in the figures showing very good agreementbetween the two.
5.2.3. Effect of system parameters on the mean square voltageIn this section, the effect of the system parameters namely the electromechanical coupling coefficient β, the linear
stiffness k, and cubic stiffness parameter kα, on the mean square voltage for three different values of the noise intensity s,s¼0.04, 0.1 and 0.12 are investigated. The other parameters adopted for the oscillator are χ¼0.05, λ¼0.01 and c¼0.02.
In Fig. 16(a), the mean square voltage is plotted as a function of the electromechanical coupling coefficient β for k¼0.5and α¼1. It is seen from the figure that the mean square voltage increases considerably with an increase in β. Thus theelectromechanical coupling coefficient β has a significant effect on the energy harvesting capability.
Fig. 16(b) shows the variation of mean square voltage as a function of the nonlinear stiffness parameter kα for β¼0.5 andk¼0.5. It is observed that for a given value of noise intensity s the mean square voltage increases with an increase in kα,reaches a maximum and then decreases for a further increase in kα.
Fig. 16(c) shows the variation of mean square voltage as a function of the linear stiffness parameter k for β¼0.5 andkα¼0.5. In this case also for a given value of the noise intensity the mean square voltage attains a maximum value for aparticular value of k.
The results shown in Fig. 16 indicate that the value of k corresponding to maximum mean square voltage increases withan increase in s while the value of kα for maximum mean square voltage decreases with an increase in s.
From the different patterns of variation of the mean square voltage with respect to the excitation noise intensity and thesystem parameters the possibility of enhancing the energy harvested from the nonlinear oscillator with optimum choice ofthe noise intensity and tuning of the system parameters can be further explored.
6. Conclusions
The Fokker–Planck equation corresponding to the nonlinear piezomagnetoelastic energy harvester excited by Gaussianwhite noise is derived. The finite element method is used to solve the Fokker–Planck equation for obtaining the joint and
P. Kumar et al. / Journal of Sound and Vibration 333 (2014) 2040–2053 2053
marginal PDFs fromwhich the statistics of the response of the oscillator and the mean square voltage are also obtained. TheFE method is first applied to the two problems of the nonlinear inductive energy harvester considered by Daqaq [26] withclose agreement between the two results. The results for the piezomagnetoelastic energy harvester obtained by the finiteelement method are validated by MCS. The effect of the intensity of the white noise excitation on the mean square voltagewhich is a measure of the energy harvested is investigated. As expected the mean square voltage increases with theexcitation intensity. This increase becomes sharper beyond a threshold level of noise intensity which from the joint PDFplots of the response corresponds to the merging of the potential wells signifying higher probabilities of the responsejumping from one potential well to the other. The effects of the system parameters on the mean square voltage are alsostudied. The mean square voltage increases with an increase in the electromechanical coupling coefficient while it has amaximum with respect to the linear stiffness parameter k and the nonlinear stiffness parameter kα. The values of theseparameters corresponding to the maximum vary with the noise intensity. Thus there is a good possibility of the choice of thenoise intensity and the system parameters for effective energy harvesting.
Acknowledgements
The paper is a part of the work carried out under the Royal Society International Joint Project "Energy Harvesting fromRandomly Excited Nonlinear Oscillators". The authors acknowledge the support of the Royal Society.
References
[1] H. Sodano, D. Inman, G. Park, A review of power harvesting from vibration using piezoelectric materials, Shock and Vibration Digest 36 (2004) 197–205.[2] S.P. Beeby, M.J. Tudor, N.M. White, Energy harvesting vibration sources for microsystems applications, Measurement Science and Technology 17 (2006)
175–195.[3] S.R. Anton, H.A. Sodano, A review of power harvesting using piezoelectric materials, Smart Materials and Structures 16 (2007) 1–22.[4] S. Roundy, P.K. Wright, J. Rabaey, A study of low level vibrations as a power source for wireless sensor nodes, Computer Communications 26 (2003)
1131–1144.[5] N.G. Stephen, On energy harvesting from ambient vibration, Journal of Sound and Vibration 293 (2006) 409–425.[6] H. Sodano, D. Inman, G. Park, Generation and storage of electricity from power harvesting devices, Journal of Intelligent Material Systems and Structures
16 (2005) 67–75.[7] S. Priya, Advances in energy harvesting using low profile piezoelectric transducers, Journal of Electroceramics 1 (2007) 165–167.[8] F. Peano, Tambosso Design and optimization of a MEMS electret based capacitive energy scavenger, Journal of Microelectromechanical Systems 14
(2005) 429–435.[9] J.M. Renno, M.F. Daqaq, D.J. Inman, On the optimal energy harvesting from a vibration source, Journal of Sound and Vibration 320 (2009) 386–405.[10] E. Lefeuvre, A. Badel, C. Richard, D. Guyomar, Energy harvesting using piezoelectric materials: case of random vibrations, Journal of Electroceramics 19
(2000) 221–231.[11] M.S.M. Soliman, E.M. Abdel-Rhhman, E.F. El-Saadany, R.R. Mansour, A wideband vibration based energy harvester, Journal of Micromechanics and
Microengineering 18 (2008) 15021.[12] E. Halvorsen, Energy harvesters driven by broadband random vibration, Journal of Microelectromechanical Systems 17 (2008) 1061–1071.[13] S. Adhikari, M.I. Friswell, D.J. Inman, Piezoelectric energy harvesting from broad band random excitations, Smart Materials and Structures 18 (2009)
115005.[14] A. Erturk, J. Hoffmann, D.J. Inman, A piezomagnetoelastic structure for broadband vibration energy harvesting, Applied Physics Letters 94 (2009)
254102.[15] S.C. Stanton, C.C. McGehee, B.P. Mann, Reversible hysteresis for broadband magnetopiezoelastic energy harvesting, Applied Physics Letters 95 (2009)
174103.[16] L. Gammaitoni, I. Neri, H. Vocca, Nonlinear oscillators for vibration energy harvesting, Applied Physics Letters 94 (2009) 164102.[17] A.F. Arrieta, P. Hagedorn, A. Erturk, D.J. Inman, A piezoelectric bistable plate for nonlinear broadband energy harvesting, Applied Physics Letters 97
(2010) 104102.[18] G. Litak, M.I. Friswell, S. Adhikari, Magnetopiezoelastic energy harvesting driven by random excitation, Applied Physics Letters 96 (2010) 214103.[19] F.C. Moon, P.J. Holmes, A magnetoelastic strange attractor, Journal of Sound and Vibration 96 (1997) 275–296.[20] S.F. Ali, S. Adhikari, M.I. Friswell, S. Narayanan, The analysis of piezomagnetoelastic energy harvesters under broadband random excitation, Journal of
Applied Physics 109 (2011) 074904.[21] A. Naess, V. Moe, Efficient path integration method for nonlinear dynamics system, Probabilistic Engineering Mechanics 15 (2000) 221–231.[22] P. Kumar, S. Narayanan, Numerical solution of Fokker–Planck equation of nonlinear systems subjected to random and harmonic excitations,
Probabilistic Engineering Mechanics 31 (2011) 455–473.[23] B.F. Spencer Jr., L.A. Bergman, On the numerical solution of the Fokker-equations for nonlinear stochastic systems, Nonlinear Dynamics 4 (1993)
357–372.[24] P. Kumar, S. Narayanan, Solution of Fokker–Planck equation by finite element and finite difference methods for nonlinear system, Sadhana 31 (4)
(2006) 455–473.[25] S.F. Wojtkiewicz, L.A. Bergman, B.F. Spencer Jr., High fidelity numerical solutions of the Fokker–Planck equation, in: ICOSSAR 97, The 7th International
Conference on Structural Safety and Reliability, Kyoto, Japan 1997, 24–28.[26] M.F. Daqaq, Transduction of a bistable inductive generator driven by white exponentially correlated Gaussian noise, Journal of Sound and Vibration 330
(2011) 2254–2664.[27] P.L. Green, K. Worden, K. Atallah, N.D. Sims, The benefits of Duffing-type nonlinearities and electrical optimisation of a mono-stable energy harvester
under white Gaussian excitations, Journal of Sound and Vibration 331 (2012) 4504–4517.[28] T. Soong, M. Grigoriu, Random Vibration of Mechanical and Structural Systems, Prentice Hall, Englewood Cliffs, NY, 1993.[29] E. Wong, M. Zakai, On the relation between ordinary and stochastic differential equation, International Journal of Engineering Science 3 (1965) 213–229.[30] H. Risken, The Fokker–Planck Equation: Methods of Solution and Applications, Springer-Verlag, New York, 1989.[31] T.K. Hellen, Effective quadrature rules for quadratic solid isoparametric finite element, International Journal of Numerical Methods in Engineering 4
(1972) 597–600.[32] P.E. Kloeden, E. Platen, Numerical solution of Stochastic Differential Equation, Springer-Verlag, Berlin, 1992.