Influence of structural position on fracture networks in the TorridonGroup, Achnashellach fold and thrust belt, NW Scotland
Hannah Watkins*, Robert W.H. Butler, Clare E. Bond, Dave HealyGeology & Petroleum Geology, School of Geosciences, University of Aberdeen, Kings College, Aberdeen, AB24 3UE, UK
a r t i c l e i n f o
Article history:Received 17 December 2014Received in revised form19 February 2015Accepted 1 March 2015Available online 10 March 2015
Keywords:FractureStrainStructural positionTight sandFold and thrust belt
In fold-and-thrust belts rocks undergo deformation as fold geometries evolve. Deformation may beaccommodated by brittle fracturing, which can vary depending on structural position. We use 2D for-ward modelling and 3D restorations to determine strain distributions throughout folds of the Achna-shellach Culmination, Moine Thrust Belt, NW Scotland. Fracture data is taken from the Torridon Group; athick, coarse grained fluviatile sandstone deposited during the Proterozoic. Modelling infers a correlationbetween strain and simple curvature; we use simple curvature to infer how structural position and straincontrol fracture attribute variations in a fold and thrust belt.
Fractures in fold and thrust belts are often thought to formsynchronously with folding and therefore fracture pattern varia-tions may be expected to relate to structural position on the fold.Understanding the mode of fold formation and strain history iscritical for prediction of fracture attribute variations, which can beused in a range of applications, including fractured reservoirexploration, carbon capture and storage, aquifer characterisationand civil and mining engineering. Many studies have been con-ducted to investigate how fracture attributes vary in carbonatethrust belts for hydrocarbon exploration, such as in the Zagros fold-and-thrust belt of Iran (McQuillan, 1973, 1974; Wennberg et al.,2006; Wennberg et al., 2007; Awdal et al., 2013), the ItalianApennines (Storti and Salvini, 2001), the Rocky Mountains of the
USA and Canada (Ghosh and Mitra, 2009; Barbier et al., 2012) andthe Northeastern Brooks Range, Alaska (Hanks et al., 1997). Studieson fracturing in sandstone thrust belts are much less well docu-mented; examples include Florez-Ni~no et al. (2005) and I~nigo et al.(2012) who use fractured outcrops as analogues to low porosity,low permeability (tight) sandstone hydrocarbon reservoirs in theSub-Andean thrust belt. Other examples include Hennings et al.(2000), Bergbauer and Pollard (2004) and Bellahsen et al. (2006),who investigate fracture distributions across sandstone anticlinesin Wyoming, USA, and Guiton et al. (2003) determine fold-fracturerelationships in folded Devonian sandstones, Morocco. This papercontributes to the limited studies on fracturing in sandstone thrustbelts, using the Torridon Group of the Moine Thrust Belt, NWScotland as an analogue for a tight fractured sandstone reservoir ina fold and thrust belt.
Fracture variations have been attributed to both structural andlithological controls (e.g. Nelson, 1985). It is widely acknowledgedthat fracture set orientationwithin a deformed region relates to theorientation of principle stresses during the formation of those
under the CC BY license (http://creativecommons.org/licenses/by/4.0/).
H. Watkins et al. / Journal of Structural Geology 74 (2015) 64e80 65
fractures. In a thrust related anticline we may expect to see up tofour fracture sets (Price, 1966); the first being a joint set strikingparallel to the fold hinge and dipping normal to bedding (J1, Fig. 1).This fracture set may be associatedwith outer-arc stretching duringfolding; regions of localised tensional stresses develop in the sameorientation as regional compression, leading to fracture opening. Asecond joint set strikes perpendicular to the fold hinge and dipsnormal to bedding (J2, Fig. 1). This fracture set may be associatedwith localised extension due to elevated curvature on a plunginganticline.
The remaining fractures associated with a thrust related anti-cline are two sets of conjugate shear fractures (S1 & S2, Fig. 1) withan acute bisector parallel to the thrust transport direction. Thesefractures may form due to regional compression or localised inner-arc compression associated with tangential longitudinal strainfolding (Ramsay, 1967). Often incomplete assemblages of thesefractures are seen at outcrop where not all of the four fracture setshave developed. Cooper (1992) describes well developed J1 and J2fractures parallel and perpendicular to the fold hinge and normal tobedding in the Upper Triassic Pardonet dolomites in the regions ofthe Sukunka and Bullmoose gas fields in NE British Columbia.Bedding-normal joints striking parallel to the fold hinge (J1) aredocumented alongside conjugate shear fractures with an acutebisector parallel to the transport direction (S1 & S2) (Muecke andCharlesworth, 1966) in folded Cardium Sandstones of the Cana-dian Rocky Mountain foothills. Complete fracture set assemblageshave been documented from field examples such as in the Umbria-Marche Apennines (Di Naccio et al., 2005) and on the Khavizanticline, SW Iran (Wennberg et al., 2007).
If fractures are stratabound (i.e. fracture height does not exceedthe thickness of the mechanical layer withinwhich the fracture hasdeveloped (Odling et al., 1999)), the height of a fracture is limited bythe mechanical layer thickness (e.g. Wennberg et al., 2006), whichlimits fracture length (the exact relationship between mechanicallayer thickness and fracture length depends on the aspect ratio offracture length to height). Fracture length may also be structurallycontrolled; if strain increases during folding fractures may propa-gate in order to accommodate this strain. This would, in theory,lead to longer fractures in higher strained zones (Fig. 1); this rela-tionship is shown by Ghosh and Mitra (2009) who calculate higheraverage fracture lengths in hinges than limbs. Fracture apertures
Fig. 1. Expected fracture characteristics on a thrust-related anticline. Steeper-dippingforelimbs are thought to have undergone higher strain meaning that fractures arebetter developed; fractures are longer and have high intensities in these regions. Fourfracture sets are expected on thrust related anticlines; orientations relate to fold ge-ometries and regional thrust transport direction (Price, 1966).
may be controlled by strain; fracture widening accommodatesincreasing strain during folding, therefore we may expect to findwide apertures in high strain zones (Jamison, 1997) (Fig. 1). Thisrelationship is seen in the Sub-Andean fold and thrust belt (I~nigoet al., 2012) where fracture apertures widen from the low strainbacklimbs to the higher strain hinge and forelimbs. Fracture aper-ture is also though to correlate to fracture lengths; longer fracturestend to have wider apertures. This relationship is shown byVermilye and Scholz (1995) who use many field locations acrossNorth America, and Ellis et al. (2012) who use data from the Tor-ridon Group of NW Scotland.
Controls on fracture intensity (fracture length per unit area in2D) have been widely investigated through field-based studies.Many authors attribute variations in fracture intensity to rockstrength and brittleness, which are controlled by rock composi-tion, texture, grain size and porosity (e.g. Hugman and Friedman,1979). Rocks with low competency such as clay-rich chalk, lime-stone or dolomite (Corbett et al., 1987; Ferrill and Morris, 2008)are often associated with low fracture intensities. Higher com-petency rocks such as dolomite-rich carbonates are associatedwith much higher fracture intensities (Barbier et al., 2012; Ferrilland Morris, 2008; Hanks et al., 1997; Hugman and Friedman,1979; Ortega et al., 2010) as dolomite is a brittle mineral.Porosity is also seen to affect fracture intensity. In many caseshigher fracture intensities are found in low porosity, high densityrocks (e.g. Ameen, 2014), whereas in other examples higher po-rosities are associated with higher fracture intensities in car-bonates (e.g. Barbier et al., 2012). Correlations are also seenbetween fracture intensity and carbonate grain size (Hanks et al.,1997; Hugman and Friedman,1979), although this may be becausecoarser grained sedimentary rocks tend to be deposited withlower mud and clay content than finer grained rocks. As well aslithology, bed thickness is thought to influence fracture intensity;Mitra (1988) shows that fracture intensity is generally higher inthin beds.
Evidence for fracture intensity being structurally controlled isalso seen; Bergbauer and Pollard (2004) report 5e10 timeshigher fracture intensities in folded sandstones & shales than inunfolded regions, although intensity values are constant on thefold itself. McQuillan (1973) also suggests fracture density isconstant within fold structures of the Asmari Formation, SWIran, providing bed thickness and lithology are constant. Manystudies show an increase in fracture intensity in high curvatureand high strain regions of individual fold structures in a range oflithologies (Hobbs, 1967; Jamison, 1997; Ortega et al., 2010), forexample fracture intensity is often seen to be higher in foldforelimbs and crests than backlimbs (Barbier et al., 2012; Awdalet al., 2013).
We investigate variations in fracture set orientation, length,aperture, spatial distribution and intensity in a deformed tight (lowmatrix porosity and permeability) sandstone. We aim to determinewhether fracture patterns are systematically structurally controlledwithin a fold and thrust belt, and therefore vary depending on theirstructural position.
2. Achnashellach Culmination
The Achnashellach Culmination is used as a field location forfracture data collection. The culmination is a fold-and-thrust belt inthe southern Moine Thrust zone (Fig. 2b), which formed during theCaledonian Orogeny (c. 439-410 Ma, Mendum et al., 2009). Up toeight large-scale thrust-related anticlines of Torridon Group andCambro-Ordovician sedimentary rocks (Basal Quartzite, Pipe Rock,Fucoid Beds, Salterella Grit and Durness Group) are exposed withina narrow, 3.5 km wide zone (Fig. 2a). The Achnashellach
Fig. 2. a. Geological map of the Achnashellach Culmination showing fracture sampling regions presented in this region, section traces (AeA0 , BeB0) and 3D model extent (blackrectangle). b. Map showing the location of the Achnashellach Culmination (black square) in NW Scotland. c. Key to Geological map showing the stratigraphy of the Southern MoineThrust Belt.
H. Watkins et al. / Journal of Structural Geology 74 (2015) 64e8066
Culmination contains the highest relief of the entire thrust belt (upto 1000 m vertical sections), allowing detailed mapping of thrustgeometries and determination of a thrusting history (Fig. 3a).Deformation in the Achnashellach Culmination is dominated bybrittle fracturing. Skolithos trace fossils in the Pipe Rock remain un-sheared, indicating very little internal deformation. A lack ofcrystal-plastic deformation suggests folding and thrusting occurredunder cool ambient temperatures (Butler et al., 2007).
Folding and thrusting of the Achnashellach Culmination isthought to have formed within the footwall of the Kishorn/Kinlo-chewe Thrusts, which are structurally below the Moine Thrust(Butler et al., 2007). Large scale folds formed from a detachmenthorizon within the Torridon Group (Butler et al., 2007; Watkinset al., 2014) in a WNW directed foreland propagating thrustsequence (see Watkins et al., 2014 for a discussion of the fold andthrust evolution history and structural restorations).
A 3D model of the sampling area, colour mapped for simplecurvature, is shown on Fig. 4 (see Fig. 2a for model extent). Twotypes of fold curvature can be measured; simple curvature andgaussian curvature. Gaussian curvature is a measure of the degreeof double curvature (Lisle, 2000), and is the sum of two principle
curvatures (usually parallel and perpendicular to the hinge on afold). This means a cylindrical fold, where one principle curvatureequals zero (i.e. curvature along the fold hinge), will have aGaussian curvature of zero (Lisle, 1994). Simple curvature is ameasure of rate of change of dip, measured in the direction ofmaximum dip (e.g. Hennings et al., 2000), meaning the simplecurvature value for a cylindrical fold can be greater than zero. Themodel (Fig. 4) shows that the four folds sampled in this study havevariable geometries; the oldest anticline sampled (Anticline 1) hasstraight limbs (simple curvature: 0.00e0.03) and a narrow, mod-erate simple curvature hinge zone (simple curvature: 0.03e0.06).Anticlines 2 and 3 have straight, low simple curvature backlimbs(simple curvature: 0.00e0.03); forelimb and hinges are notexposed. The youngest anticline (Anticline 4) has a high simplecurvature forelimb in which bedding is often overturned (simplecurvature: 0.06e0.14), and an un-curved backlimb (simple curva-ture: 0.00e0.03).
The Torridon Group sandstone is used to study fractures on thefour youngest anticlines of the Achnashellach Culmination as it iswell exposed within the chosen sampling areas (Fig. 3b) and pro-vides a suitable analogue for tight sand reservoirs. The Torridon
Fig. 3. a. High relief in the Achnashellach Culmination allows for detailed mapping of thrust and fold geometries in Torridon Group sandstone, Basal Quartzite and Pipe-Rock. b.Well exposed bedding planes of Torridon Group sandstone provide a suitable study area for fracture data collection. c. High intensity, orthogonal fracture sets on a Torridon Groupbedding plane. d. Low intensity fractures with irregular orientations; variations in fracture attributes (e.g. compared to Fig. 3c) mean that the Achnashellach Culmination is an idealarea to investigate controls on fracturing.
H. Watkins et al. / Journal of Structural Geology 74 (2015) 64e80 67
Group is a low porosity, low permeability, sandstone, deposited inlarge braided river systems during the Proterozoic (c. 1024 Ma)(Stewart, 2002). Within the study area the Torridon Group is madeup of thick beds (1e5 m) of coarse grained, cross bedded sand-stones. The Torridon Group is composed of roughly 45e55% quartz,25% plagioclase and orthoclase, 15e20% clays (illite and chlorite)and minor proportions of muscovite mica (Stewart, 2002). Indi-vidual beds of Torridon Group sandstone show only limited averagegrain size variations, which is ideal for fracture data collection todetermine structural control as it reduces the chances of fracturevariations due to bed anisotropy. Torridon Group bedding planeswithin the study area show significant variations in fracture ori-entations, lengths, apertures, spatial distribution and intensitythroughout the fold structures (e.g. Fig. 3ced), making this an idealarea to study controls on fracture formation.
3. Data collection
3.1. Methods
Fracture data is collected from over 140 sampling sites within a7 km2 area on the four youngest anticlines of the AchnashellachCulmination (see Fig. 2a for sampling regions). Data collection re-gions are selected from aerial photographs where Torridon Groupbedding plane outcrops are extensive, well exposed and accessible.
The sampling regions are then gridded using a 200 m grid-squaresystem where sampling sites are at, or as close as possible to, thecorners of each grid square. In order to investigate higher resolu-tion variations in fracture attributes additional sampling sites areselected along linear transects either parallel to the regionaltransport direction or parallel to the fold hinge. These samplingsites are spaced 10e100 m apart, often on the same bedding planeas neighbouring sampling sites (for a full description of samplingsite selection workflow, refer to Watkins et al., 2015).
At each pre-selected sampling site a circle of known radius isdrawn onto the outcrop in chalk. The orientation, length, apertureand spacing (distance to nearest fracture of the same orientation)are recorded for each fracture intersecting the sampling circle, andaverage grain size is recorded fromwithin the circle. The number offracture intersections with the circle (n) is also recorded; values forn are used to estimate bulk fracture intensity at each sampling siteusing equation (1) (Mauldon et al., 2001).
I ¼ n=ð4rÞ (1)
Where I ¼ fracture intensity (m/m2), n ¼ number of fracture in-tersections with the sampling circle, and r ¼ circle radius (m).(Mauldon et al., 2001).
This data collection method is favoured over other techniquessuch as linear scan line sampling (Priest and Hudson, 1981; Priest,1993) and window sampling (Pahl, 1981; Priest, 1993) as it allows
Fig. 4. 3D diagram created using Move software, showing the geometries and variations in simple curvature of the four folds discussed in this paper. Cross section plane AeA0 isshown, sampling sites are shown at their correct structural positions (yellow circles). See Fig. 2a for map location of 3D model.
H. Watkins et al. / Journal of Structural Geology 74 (2015) 64e8068
for rapid data collection of a range of fracture attributes withoutincurring any orientation bias (see Watkins et al., 2015; forappraisal of fracture sampling techniques). Sampling circle radiivaried depending on fracture intensity; minimum n counts of 30were required to ensure results were representative (see Watkinset al., 2015). Circle radii range from 0.25 m in the highest fractureintensity regions to 2 m in very low intensity regions.
Bedding data collected in the field is used to construct a series ofparallel cross sections representing fold geometries of the TorridonGroup. From these cross sections 3Dmodels are created (e.g. Fig. 4),from which simple curvature of the folds can be determined foreach sampling site. Simple curvature values are compared withfracture attribute data to infer any relationship between fracturingand structural position. Strain, calculated using 2D forwardmodelling and 3D restorations, is also compared with fractureattribute data in order to determine any variations in fracture at-tributes in high and low strain regions.
3.2. Uncertainty
Errors in data collection are incurred for all fracture attributes,as well as grain size and simple curvature. Individual fracturelengths and spacing have been measured to the nearest 5 cm andapertures to the nearest 0.5 mm. Fracture lengths may be censoredif the length of an individual fracture trace exceeds the extent of theoutcrop; this usually affects only a small percentage of fracturesbecause most fractures in this study are short compared to the sizeof the outcrop. Aperture measurements are likely to have addi-tional errors due to erosion and fracture widening, however a valuefor this error is not known. A minimum number of 30 n points hasbeen set to ensure fracture set orientation data is representative(see Watkins et al., 2015).
An average value for grain size is assigned to each samplingsite; this is estimated from the exposure within the sampling
circles, subject to exposure quality being good enough for a cleansurface to be assessed. The average grain size at each samplingsite is assigned to a category (150 mm, 187 mm, 219 mm, 250 mm,313 mm, 375 mm, 435 mm, 500 mm, 625 mm, 750 mm, 875 mm,1000 mm & 1500 mm) based on standard grain size card classesand intermediate classes for sand. Although the average grainsize changes little in Torridon Group beds, sorting can be poordue to a fluvial depositional environment; this may cause sig-nificant errors in average grain size values, which have not beenquantified.
Errors for simple curvature are also difficult to define; valuesare measured to three decimal places directly from TorridonGroup surfaces in the 3D model. The major source of error arisesfrom the 3D model building process. 3D surfaces are created byprojection between adjacent cross sections; the model buildingalgorithm used ensures the surface is a smooth fold shape, wherebedding dip gradually changes. This process ‘irons out’ any kinksthat would appear to be present due to bedding measurementerrors or natural heterogeneity of the folded bedding surface; thismeans the 3D fold surfaces may not exactly match fold geometrieson cross sections or in the field. In theory this should reduce errorin simple curvature measurements but will smooth out naturalperturbations and kinks that may influence strain and fracturing.Errors in simple curvature measurements due to incorrect 3Dmodel fold geometries are most likely to occur in regions whereoutcrop is sparse, and therefore bedding data used to build 3Dmodels is limited.
Watkins et al. (2015) test the intensity estimator of Mauldonet al., 2001 against actual fracture intensity values measured inthe field. The study finds a very good correlation between the twodatasets (R2 ¼ 0.9837). This means that the Mauldon method(Mauldon et al., 2001) can be used to identify overall trends infracture intensity and determine how intensity varies dependingon structural position (Watkins et al., 2015).
Fig. 5. a. An Ruadh-Stac cross section (BeB0 , Fig. 2a). b. Forward modelling by faultparallel flow to recreate original section geometry (Fig. 5a). c. Forward modelling byfault bend folding. d. Forward modelling by combined trishear & fault parallel flow.
H. Watkins et al. / Journal of Structural Geology 74 (2015) 64e80 69
4. Strain modelling
Strain distribution during fold-thrust belt evolution variesdepending on the active thrusting mechanism. End membermodels for thrust mechanisms include detachment folding (Pobletand McClay, 1996), fault propagation folding (Suppe andMedwedeff, 1990), trishear (Erslev, 1991), fault bend folding(Suppe, 1983) and fault parallel flow (Egan et al., 1997; Kane et al.,1997). Each mechanism creates folds of different geometries, andstrain distributions are dependent on the folding mechanism; thishas been shown in model folds (Salvini and Storti, 2001). Fracturedistribution is affected by strain distribution, as well as mechanicallayer properties (Cosgrove and Ameen, 2000); homogeneousisotropic layers undergo tangential longitudinal strain foldingcausing outer arc extension and inner arc compression in hinges,and limited deformation in limbs (Ramsay, 1967; Cosgrove andAmeen, 2000). Homogeneous anisotropic layers may undergoflexural slip or flexural flow where bedding-parallel slip leads toshearing in fold limbs and relatively undeformed hinges (Ramsay,1967; Cosgrove and Ameen, 2000).
Using cross section forward modelling we illustrate the differ-ence in three of the above thrusting mechanisms; fault parallelflow, fault bend folding and trishear. Fault bend folds are formed bydisplacement on a simple ramp-flat geometry fault, where theshape of the fold is purely due to the shape of the underlying thrust(Suppe, 1983). Bed thickness and length are conserved duringhangingwall deformation (Medwedeff and Suppe, 1997). Faultparallel flow is similar to fault bend folding, however deformationis accommodated by fault-parallel shear (Kane et al., 1997; Eganet al., 1997), meaning bed thickness is not necessarily preserved.Trishear is a type of fault propagation foldingmechanismwhere thethrust tip propagates as the fold develops (Erslev, 1991). Strain isdistributed in a triangular zone in front of the thrust tip (trishearzone); there is a gradual decrease in fault slip velocity between thehangingwall and footwall. This gives folds curved geometries, andin some cases causes bed overturning (Erslev, 1991).
Section BeB0 (Fig. 5a) shows the geometry of the southernAchnashellach Culmination (see Fig. 2a for section line); threedifferent forward modelling algorithms are used to recreatethese fold geometries from a restored section and strain circlesare used to highlight differences in strain distribution. The faultparallel flow mechanism (Fig. 5b) shows highest strain associatedwith thrust steepening and outer arc extension in upper units.Fault bend fold forward modelling (Fig. 5c) shows much higherstrains than the previous model (Fig. 5b); strain is highest wherethrust geometries are complex. Combined trishear and faultparallel flow indicate strains are generally low in backlimbs, evenwhere thrusts are complex, and the highest strains are found infront of thrust tips and in forelimb regions (Fig. 5d). The differ-ences in strain distributions in Fig. 5 show that it is important todetermine the most realistic mechanisms of thrusting and foldformation in order to understand how strain evolves and isdistributed.
4.1. Cross section forward modelling
In order to determine the most appropriate end member thrustmechanism for the Achnashellach Culmination we compare theforward modelled top Torridon Group horizons (Fig. 5bed) withthose of the original section (Fig. 5a). We find the geometry of thecombined trishear and fault parallel flow model (Fig. 5d) bestrepresents the top Torridon Group horizon on the original section(Fig. 5a), so infer that this was the most likely thrust mechanismactive during the evolution of the Achnashellach Culmination. Thistest was also undertaken on the Sgorr Ruadh section (AeA0 , Fig. 2);
the combined trishear and fault parallel flow forward modellingmechanism was found to best re-create fold geometries on theoriginal Sgorr Ruadh cross section.
Forward modelling is applied to the Sgorr Ruadh section (AeA0 ,Fig. 2a) in order to determine strain distribution and identify howstrain relates to fold simple curvature and structural position in themain fracture data collection region. Initially the cross section(Fig. 6a) is restored using line-length restoration (Dahlstrom,1969);
Fig. 6. a. Sgorr Ruadh cross section (AeA0 , Fig. 2a). b. Restored-state Sgorr Ruadh cross section, used as a template for forward modelling. c. Forward modelled Sgorr Ruadh cross section to recreate original section geometries (Fig. 5a).
H.W
atkinset
al./Journal
ofStructuralG
eology74
(2015)64
e80
70
Fig. 7. Forward modelling workflow for combined trishear and fault parallel flowthrusting.
H. Watkins et al. / Journal of Structural Geology 74 (2015) 64e80 71
the restored state section (Fig. 6b) is then used as a template forforward modelling to ensure that the locations and geometries ofthrusts are accurate. A foreland propagating thrust sequence isused for forward modelling; on each thrust the trishear thrustingmechanism is applied, and if the thrust tip propagates to the level ofthe roof thrust, further deformation is accommodated by faultparallel flow (Fig. 7).
The forward modelled Sgorr Ruadh section (Fig. 6c) illustratesthe strain distribution predicted by the forward model through thefold and thrust belt. High strains aremodelled in front of thrust tips,on fold forelimbs, and in narrow footwall and hanging wall zonesclose to thrusts. Strain is generally low in backlimb regions; how-ever an overall increase in backlimb strain is seen to the ESE instructures that have undergone a longer deformation history. Ageof fold structures is used as a proxy for strain and deformationhistory, where older structures (closer to the ESE hinterland) areinferred to have undergone higher strain. Fig. 6c also shows a clearrelationship between strain and simple curvature; strain is gener-ally highest in high curvature regions. Simple curvature is seen toincrease in fold forelimbs, in front of thrust tips and in hangingwalland footwall positions, where strain is high. Lower simple curva-ture backlimbs are associated with lower strains.
4.2. 3D model restoration
Folds and faults in the study area change geometry along strikeso in order to determine how strain is distributed in 3D we mustconsider 3D modelling of fold surfaces. This is completed, firstly bycreating a series of closely spaced cross sections parallel to theregional transport direction, using bedding data to create the topTorridonian horizon lines and thrust lines. From these lines 3Dsurfaces are created (see Fig. 4 for 3D model and Fig. 2a for location
of the 3D model); fault displacements are restored and anticlinesare unfolded. Strain associated with the restoration is calculatedand colour mapped onto the surfaces.
Fig. 8a shows the strain distribution for Anticline 4 (region x,Fig. 2a); the region of highest strain is found in the forelimb,associated with unfolding of a high simple curvature region(Fig. 8b). A rapid decrease in strain is seen through the fold hingeinto the backlimb. Backlimb strain is very low, corresponding to lowbacklimb simple curvature (Fig. 8a and b). Linear strain trends seenon the backlimb are an artefact of the restoration process relating tothe WNW transport direction used, and do not reflect actual strainpatterns. 3D modelling reinforces the correlation between strainand simple curvature predicted using 2D forward modelling; thisrelationship is also seen in 3D on Anticlines 2e4 where increases instrain are found in regions of elevated simple curvature.
4.3. Predicting fracture attributes from simple curvature
From 2D forwardmodelling (Figure 6) and 3D restoration (Fig. 8)we have established that high strain is associated with high simplecurvature. From this relationship we can begin to predict variationsin fracture attributes depending on structural position. High strain,high simple curvature regions such as fold forelimbs and areas inclose proximity to thrust planes are expected to contain high in-tensity, long fractures with wide apertures (e.g. Fig. 1). Lower strain,low simple curvature regions such as fold backlimbs are expectedto contain lower intensity, shorter fractures with narrow apertures(e.g. Fig. 1). Since fracture orientation is thought to be related tostress orientations (Price, 1966) we would expect fracture orien-tations to be similar, regardless of structural position. The folds allformed during the same compressional event meaning regionalstresses were relatively constant. However since high simple cur-vature regions have undergone significant outer arc stretchingduring folding we may expect well developed hinge-parallel frac-tures (J1 fractures, Fig. 1, Price, 1966).
5. Field fracture attributes
Sampling site localities discussed below are shown on Fig. 4 attheir correct structural position. These sites are only a small sampleof the total data set. These data have been chosen because they area good representation of fracture distributions observedthroughout the whole dataset, and exhibit fracture characteristicpatterns observed throughout the fold belt.
Fractures observed in the Torridon Group sandstone are mostlyjoints, with a very limited number of shear fractures. As a resultfracture offsets are rare. Fractures lack any systematic terminationrelationships between different fracture sets, meaning it is verydifficult to determine relative ages. The Torridon Group forelandcontains multiple fracture sets that appear not to be related toMoine Thrust Belt structures but instead formed either before orafter folding and thrusting (Ellis et al., 2012). Measured intensitiesof these fractures are very low (<10 m/m2). Since fractures in theAchnashellach Culmination lack cross-cutting or consistent termi-nation relationships, it is not possible to determine which fracturesare fold-related andwhichmay be related to other events. Howeversince the intensities of these non-fold related fractures are so low itis assumed that they will not have a significant impact on ourresults.
5.1. Orientation
Orientation data from each circular scan line is presented onequal area projections as contoured poles to fracture planes (Fig. 9).
Fig. 8. a. Maximum principle strain (e1) for Anticline 4 (zone x, Fig. 2a), calculated by 3D model restoration in Move software. b. Simple curvature on a 3D surface for Anticline 4(zone x, Fig. 2a), calculated using Move software.
H. Watkins et al. / Journal of Structural Geology 74 (2015) 64e8072
Fractures have been unfolded relative to bedding for comparisonpurposes.
Regions of high simple curvature, such as the forelimb ofAnticline 4, have a dominant fracture set striking parallel to thefold hinge (see sites A & B, Fig. 9). These are tension fracturesequivalent to Price's J1 fracture set (Fig. 1, Price, 1966). Otherfractures at different orientations can be seen in the high simplecurvature regions but they are not as abundant. This J1 fractureset can be seen at all observed outcrops within the forelimb ofAnticline 4 and has a consistent orientation throughout. Thecorrelation of orientation data between adjacent sampling sitesin high simple curvature regions is good (sites A & B, Fig. 9).Although the orientation of this fracture set is consistent alongstrike, the Fisher dispersion values are highly variable (46e114for sites A & B, Fig. 9); this is because fractures are typically notstraight.
In lower simple curvature regions we find fracture set ori-entations are very inconsistent, even over short distances (50 mbetween sites E & F, Fig. 9). It could be argued that the presenceof non-fold related fractures could affect the orientation distri-butions, however as we have already stated, that intensity ofthese fractures in the foreland is so low that they should notsignificantly affect the overall orientation distribution in the foldand thrust belt. Some sampling sites contain fracture sets whoseorientations relate to fold geometry (e.g. sites C & E have twosets parallel and perpendicular to fold hinges, J1 & J2 on Fig. 9, 63& 134 Fisher dispersion), but often fractures are dispersed withno dominant clustering (e.g. sites D, F & G, Fig. 9, 87, 75 & 59Fisher dispersion values). Dispersion of fracture orientations,along with a lack of evidence for relative timing of fracture
formation, means it is not possible to divide fractures into indi-vidual sets.
Anticlines 2, & 4 comply with a relationship whereby highcurvature simple regions have consistent fracture set orientationsand lower curvature regions do not. Fracture orientation data onAnticline 1 is consistent across the entire structure; all samplingsites exhibit a J1 fracture set parallel to the fold hinge and a J2fracture set parallel to the thrust transport direction (sites H, I & J,Fig. 9), despite having low simple curvature limbs (Fig. 4). Fisherdispersion values are consistently high throughout Anticline 1 (115average Fisher dispersion for sites on Anticline 1), meaning thatdata scatter is minimal.
5.2. Length & aperture
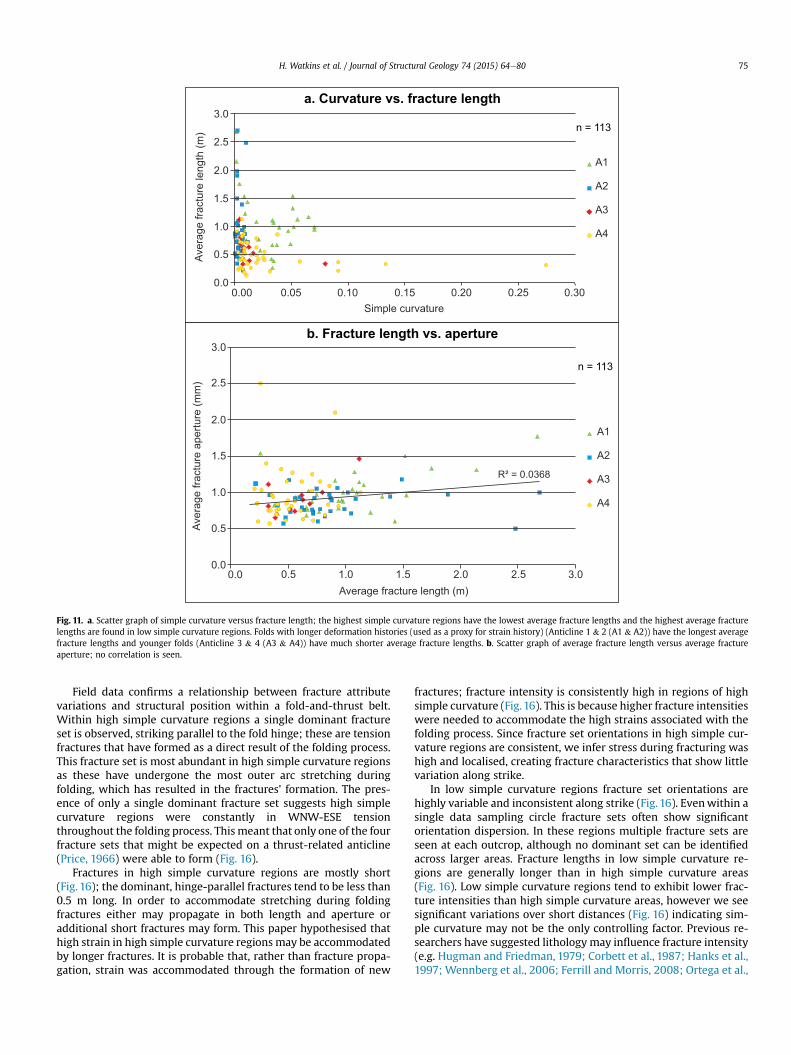
Field data shows a relationship between fracture length andstructural position. Individual sampling sites in high simple cur-vature regions consistently show fractures are mostly short (lessthan 0.5 m) (e.g. sites J & A, Fig. 10). Lower simple curvature re-gions commonly exhibit a mixture of long and short fractures andthere appears to be no particular pattern for length distribution(e.g. sites K, L, M & N, Fig. 10). Fig. 11a shows a weak trend be-tween fracture length and simple curvature, where high simplecurvature regions have low average fracture lengths and thelongest average fracture lengths are found in low simple curvatureregions. Lengths also vary depending on the age of the fold onwhich the sampling site is located. The highest average fracturelengths (up to 2.75 m) are found on Anticlines 1 & 2, which are theoldest two structures, despite simple curvature in these regionsbeing low. The youngest two structures (Anticlines 3 & 4) have
Fig. 9. Equal-area and lower-hemisphere projections showing contours of poles to fracture planes; fractures have been unfolded relative to bedding for comparison purposes.Sampling site locations are shown on Fig. 4. Sites in high simple curvature regions have consistent fracture orientations (A & B), whereas in low simple curvature regions fractureorientations are dispersed and inconsistent (CeG). Sampling sites on Anticline 1 are consistent across the entire structure (HeJ). Data is colour mapped above 1% density, using a 1%contour interval for sites AeJ. Data is colour mapped above 0.25% density, using a 0.25% contour interval for the ‘All Fractures’ plot. (For interpretation of the references to colour inthis figure legend, the reader is referred to the web version of this article.)
H. Watkins et al. / Journal of Structural Geology 74 (2015) 64e80 73
much shorter average fracture lengths, with maximum values ofonly 1.2 m.
Average fracture length and average fracture aperture arecompared on Fig. 11b. Although correlations between fracturelength and aperture are observed in other field locations (e.g.Vermilye and Scholz, 1995; Ellis et al., 2012), no clear relation-ship is seen, and a poor coefficient of correlation is calculated(R2 ¼ 0.0368). This may be due to errors in aperture measure-ments; data is taken from glacially scoured bedding planesmeaning that some fractures have been widened by erosion soaperture data is ambiguous. The average ratio of fracture aper-ture to length has been calculated as 0.0006 by plotting fracturelength vs aperture for individual sampling sites (i.e. a fracture1 m long will have an aperture of roughly 0.6 mm). This ratiovaries depending on the grain size at each sampling site; coarsergrained rocks have the narrowest fractures per unit length, andthe widest apertures per unit length are found in fine grainedrocks.
5.3. Intensity
Fracture intensity values, calculated using the Mauldon method(equation (1), Mauldon et al., 2001), and simple curvature show avery weak trend (Fig. 12). In general fracture intensity increaseswith increasing simple curvature but data is significantly scattered.A contour map for Anticline 4 (Fig.13) shows a band of high fractureintensity in the high simple curvature forelimb (see Fig. 4), runningparallel to the fold hinge. Fracture intensity gradually decreasesinto the backlimb, where intensity values are generally lowersuggesting simple curvature is a key controlling factor on fractureintensity. Intensity values in the backlimb of Anticline 4 are highlyvariable; these variations do not relate to variations in simplecurvature or strain as simple curvature is consistently low.
The intensity variability in low simple curvature zones may becaused by factors other than simple curvature variations such aslithology. Aweak trend is seen between fracture intensity and grainsize (Fig. 14a); intensity is consistently low in coarser grained rocks
Fig. 10. Histograms for fracture length at individual sampling sites (localities shown on Fig. 4). Sites in high simple curvature regions contain very short fractures (J & A), whereaslower simple curvature regions have a mixture of long and short fractures and no clear length distribution pattern in seen (KeN).
H. Watkins et al. / Journal of Structural Geology 74 (2015) 64e8074
and the highest fracture intensities are found in fine grained rocks.If data is divided according to the average grain size at each sam-pling site (Fig. 14bed) the trend between simple curvature andfracture intensity strengthens (R2 values are higher in Fig.14 than inFig. 12). This data suggests that fracture intensity may be controlledby both fold simple curvature and lithological variations.
5.4. Spatial distribution
The spatial distribution of fractures is affected by fractureorientation, length, intensity and fracture spacing. Fracture tracemaps, created by digitising fractures on bedding planes from fieldphotographs, show distinct differences between high and lowsimple curvature regions. Fig. 15a shows fracture patterns on twoadjacent bedding planes in a high simple curvature region onAnticline 1 (location y, Fig. 2a). Fracture orientations, lengths, in-tensity and spacing are relatively consistent across both beddingplanes and any change in the fracture distribution occurs gradually.
In low simple curvature regions fracture distributions canchange significantly over short distances, shown by two adjacentbedding planes in a low simple curvature region of Anticline 2(location z, Fig. 2a). Bedding plane ‘b’ (Fig. 15b) contains two main
orthogonal fracture sets which are long and often form clusters offractures. Fracture intensity on bedding plane ‘b’ is low. Beddingplane ‘c’ (Fig. 15c) contains three fracture sets, most of which areshort with variable spacing. Intensity on bedding plane ‘c’ is muchhigher than on bedding plane ‘b’, despite the two being only 2 mapart.
6. Discussion
From previous work documenting structural controls on frac-ture attributes (e.g. Price, 1966; Hobbs, 1967; Jamison, 1997;Bergbauer and Pollard, 2004; Ortega et al., 2010; Barbier et al.,2012; Awdal et al., 2013) we predicted an increase in strainwould lead to increased fracture intensity, length and aperture.Fracture orientations were predicted to be similar throughout thefold belt, with well-developed hinge-parallel fractures in highstrain regions. Using 2D forward modelling and 3D restorations,high simple curvature regions were predicted to have undergonehigh strain during folding and thrusting. From this inferred rela-tionship it was predicted that fracture intensity, length and aper-ture of hinge-parallel fractures would increase in high simplecurvature regions such as fold forelimbs and close to thrust planes.
Fig. 11. a. Scatter graph of simple curvature versus fracture length; the highest simple curvature regions have the lowest average fracture lengths and the highest average fracturelengths are found in low simple curvature regions. Folds with longer deformation histories (used as a proxy for strain history) (Anticline 1 & 2 (A1 & A2)) have the longest averagefracture lengths and younger folds (Anticline 3 & 4 (A3 & A4)) have much shorter average fracture lengths. b. Scatter graph of average fracture length versus average fractureaperture; no correlation is seen.
H. Watkins et al. / Journal of Structural Geology 74 (2015) 64e80 75
Field data confirms a relationship between fracture attributevariations and structural position within a fold-and-thrust belt.Within high simple curvature regions a single dominant fractureset is observed, striking parallel to the fold hinge; these are tensionfractures that have formed as a direct result of the folding process.This fracture set is most abundant in high simple curvature regionsas these have undergone the most outer arc stretching duringfolding, which has resulted in the fractures' formation. The pres-ence of only a single dominant fracture set suggests high simplecurvature regions were constantly in WNW-ESE tensionthroughout the folding process. This meant that only one of the fourfracture sets that might be expected on a thrust-related anticline(Price, 1966) were able to form (Fig. 16).
Fractures in high simple curvature regions are mostly short(Fig. 16); the dominant, hinge-parallel fractures tend to be less than0.5 m long. In order to accommodate stretching during foldingfractures either may propagate in both length and aperture oradditional short fractures may form. This paper hypothesised thathigh strain in high simple curvature regions may be accommodatedby longer fractures. It is probable that, rather than fracture propa-gation, strain was accommodated through the formation of new
fractures; fracture intensity is consistently high in regions of highsimple curvature (Fig.16). This is because higher fracture intensitieswere needed to accommodate the high strains associated with thefolding process. Since fracture set orientations in high simple cur-vature regions are consistent, we infer stress during fracturing washigh and localised, creating fracture characteristics that show littlevariation along strike.
In low simple curvature regions fracture set orientations arehighly variable and inconsistent along strike (Fig. 16). Evenwithin asingle data sampling circle fracture sets often show significantorientation dispersion. In these regions multiple fracture sets areseen at each outcrop, although no dominant set can be identifiedacross larger areas. Fracture lengths in low simple curvature re-gions are generally longer than in high simple curvature areas(Fig. 16). Low simple curvature regions tend to exhibit lower frac-ture intensities than high simple curvature areas, however we seesignificant variations over short distances (Fig. 16) indicating sim-ple curvature may not be the only controlling factor. Previous re-searchers have suggested lithology may influence fracture intensity(e.g. Hugman and Friedman, 1979; Corbett et al., 1987; Hanks et al.,1997; Wennberg et al., 2006; Ferrill and Morris, 2008; Ortega et al.,
Fig. 12. Scatter graph of simple curvature versus fracture intensity; a weak trend is shown.
Fig. 13. Contour map of Anticline 4 (region x, Fig. 2a) showing the high fracture in-tensity in the forelimb and lower fracture intensity in the backlimb.
H. Watkins et al. / Journal of Structural Geology 74 (2015) 64e8076
2010; Barbier et al., 2012); we see evidence for this in low simplecurvature regions as lower fracture intensities are found at sam-pling sites with coarse grain sizes. This variability in fracture in-tensity may be caused by pre-failure strain variations wheremicrostructural deformation accommodates strain before brittlefailure and fracturing occurs. Mechanisms of pre-failure strain mayinclude micro-fracturing, pressure solution, cataclastic flow as wellas the formation of undulose extinction, deformation lamellae anddeformation twinning and kinking (Passchier and Trouw, 2005).Certain lithological characteristics may allow for higher strains tobe accommodated by these mechanisms prior to brittle fracturing,which could mean lower fracture intensities are seen at outcrop.The scatter of fracture orientation data in low curvature regionssuggests strain was dispersed during folding, and the variability infracture intensity suggests strain was low enough for lithologicalfactors to influence fracture formation.
Field evidence shows that fold simple curvature has an influenceon fracture characteristics; fractures in high simple curvature re-gions are primarily controlled by strain and are relatively predict-able. Fractures in low simple curvature regions are highly variableand may be controlled by a combination of strain and lithologicalvariations, such as grain size. However, the relationships betweenfracture length and intensity with simple curvature, and fractureintensity with grain size (Figs. 11a, 12 and 14) are weakly con-strained, indicating other factors are partially controlling fractureattributes. For example distance to major faults or lithological fac-tors other than grain size are seen to affect fracture intensity inother regions. These observations have been made at other fieldlocations, where the influence of structural controls on fracturingincreases as strain increases. Barbier et al. (2012) suggest structuralposition is important for fracture intensity on the Sheep MountainAnticline, Wyoming; the forelimb and crest have higher fractureintensities than the backlimb. The authors suggest fracture in-tensities on the relatively undeformed backlimb are strati-graphically, rather than structurally controlled. Hanks et al. (1997)suggest that fracture intensity variations in the Lisburne Group,Northeast Alaska, are controlled by changes in rock composition,grain size & texture, however structural position influences frac-turing in deformed regions. We suggest that in deformed regions
Fig. 14. a. Scatter graph of grain size versus fracture intensity; higher grain sized rocks consistently show very low fracture intensities and the highest fracture intensities are foundin very fine grained rocks. bed). Scatter graphs of simple curvature versus fracture intensity; dividing data by grain size shows that the trend between simple curvature and fracturestrengthens slightly (compared with Fig. 12).
H. Watkins et al. / Journal of Structural Geology 74 (2015) 64e80 77
such as folds, lithology may still influence fracture intensity butstructural position becomes increasingly important as strainincreases.
As well as fold simple curvature playing an important role incontrolling fracture characteristics, we have seen that the defor-mation history of fold structures may also be important. AlthoughAnticline 1 has very straight, low simple curvature limbs we seethat fracture orientations are consistent across the entire fold.Anticline 1 is inferred to be the oldest fold within the samplingregion, and therefore has the longest deformation history. It ispossible that, following initial folding due to displacement onThrust A (see Fig. 2a), Anticline 1 was then passively folded due touplift associated with the formation of Anticlines 2e4. This meansthe present day simple curvature observed on Anticline 1, espe-cially in the forelimb, may be slightly lower than it was prior to theformation of Anticlines 2e4, and, in this case, is not a good pre-dictor of strain history.
Length of deformation history appears to have influenced otherfracture characteristics, namely fracture length. The highest frac-ture lengths are found in the two oldest anticlines (Anticline 1 & 2)and the shortest fractures are found in the youngest two anticlines(Anticline 3 & 4). Longer deformation histories of Anticlines 1 & 2mean they have undergone more passive bending due to the for-mation of underlying, younger folds. This is because, in a forelandpropagating sequence, Anticline 1 has undergone passive defor-mation by the formation of 3 underlying folds (Anticlines 2e4),
which formed later than itself. Anticline 4, on the other hand, hasundergone no passive deformation as it is the youngest structureand no folding has occurred in its footwall subsequent to its for-mation. Strain associated with this passive deformation may havebeen accommodated by length propagation and fracture wideningof pre-existing fractures, rather than the formation of new fracturesas fracture intensities are generally relatively low (Fig. 12).
7. Conclusions
Using cross section forward modelling, 3D model restorationsand field fracture data we have inferred a combination of structuraland lithological controls on fracture characteristic variations withinthe Achnashellach fold-and-thrust belt. Both fold simple curvatureand deformation history have influenced fracture formation; ulti-mately both relate to strain, which is the key structural control onfracture attribute variation. Lithology may also play a role ininfluencing fracture development, and the importance of lithologyvaries depending on structural position. In low strain regions var-iations in fracture attributes are influenced by lithology changes; asstrain increases lithology continues to influence fracture shape andintensity but structural position takes over as the most importantcontrolling factor on fracture formation.
By using data collected from four anticlines, all of which havedifferent geometries and deformation histories, we have high-lighted the importance of sampling on multiple fold structures.
Fig. 15. a. Two bedding planes in a high strain region (y on Fig. 2a) have consistent fracture orientations, lengths, intensities and distribution. b. Two adjacent bedding planes in alow strain region (z on Fig. 2a), spaced 2 m apart. Fracture orientations are completely different despite being at the same structural position. Fracture trace maps are shown relativeto the orientation of the fold hinge (NNE).
Fig. 16. Field data suggests high strain regions of thrust-related anticlines contain high intensity, short fractures which have relatively consistent orientations across large areas. Incontrast to this low strain regions contain fractures with highly variable fracture intensities, lengths and orientations.
H. Watkins et al. / Journal of Structural Geology 74 (2015) 64e8078
H. Watkins et al. / Journal of Structural Geology 74 (2015) 64e80 79
Sampling only Anticline 1 would indicate that deformation historyis the key control as fractures are well developed across the entirestructure, even though simple curvatures are generally low. Sam-pling only Anticlines 2 & 3 may suggest that lithological variationsare the key control on fracture variations and structural controlsplay only a minor role. Sampling on only Anticline 4 would suggestfold simple curvature is the main influence on fracture patternvariations. This raises the question as to the efficiency of potentialpredictions of fracture attributes in adjacent structures or the sub-surface from studies of single structures in a fold and thrust belt.
Acknowledgements
This research is funded by a NERC CASE studentship (NERC codeNE/I018166/1) in partnership with Midland Valley. The authorsthank Midland Valley for use of FieldMove Clino software forfracture data collection, and Move software for cross section con-struction, and strain modelling. 3D Field software is acknowledgedfor contour map creation. We also thank Toru Takeshita for over-seeing the editorial process, and Catherine Hanks and Ole PetterWennberg for constructive reviews.
References
Ameen, M.S., 2014. Fracture and in-situ stress patterns an impact on performance inthe Khuff structural prospects, eastern offshore Saudi Arabia. Mar. Pet. Geol. 50,166e184.
Awdal, A.H., Braathen, A., Wennberg, O.P., Sherwani, G.H., 2013. The characteristicsof fracture networks in the Shiranish formation of the Bina Bawi Anticline;comparison with the Taq Taq field, zagros, Kurdistan, NE Iraq. Pet. Geosci. 19,139e155.
Barbier, M., Hamon, Y., Callot, J., Floquet, M., Daniel, J., 2012. Sedimentary anddiagenetic controls on the multiscale fracturing pattern of a carbonate reser-voir: The Madison Formation (Sheep Mountain, Wyoming, USA). Mar. Pet. Geol.29, 50e67.
Bellahsen, N., Fiore, P., Pollard, D.D., 2006. The role of fractures in the structuralinterpretation of Sheep Mountain Anticline, Wyoming. J. Struct. Geol. 28,850e867.
Bergbauer, S., Pollard, D.D., 2004. A new conceptual fold-fracture model includingprefolding joints, based on the Emigrant Gap anticline, Wyoming. GSA Bull. 116(3/4), 294e307.
Butler, R.W.H., Matthews, S.J., Morgan, R.K., 2007. Structural evolution of the Ach-nashellach Culmination, southern Moine Thrust Belt: testing the duplex model.In: Ries, A.C., Butler, R.W.H., Graham, R.H. (Eds.), Deformation of the ContinentalCrust: the Legacy of Mike Coward, pp. 103e120. Geological Society, London,Special Publications, 272.
Cooper, M., 1992. The analysis of fracture systems in subsurface thrust structuresfrom the Foothills of the Canadian Rockies. In: McClay, K.R. (Ed.), Thrust Tec-tonics. Chapman and Hall, London, pp. 391e405.
Corbett, K., Friedman, M., Spang, J., 1987. Fracture development and mechanicalstratigraphy of Austin Chalk, Texas. AAPG Bull. 71 (1), 17e28.
Cosgrove, J.W., Ameen, M.S., 2000. A comparison of the geometry, spatial organi-zation and fracture patterns associated with forced fold and buckle folds. In:Cosgrove, J.W., Ameen, M.S. (Eds.), Forced Fold and Fractures, pp. 7e21.Geological Society, London, Special Publications, 169.
Dahlstrom, C.D.A., 1969. Balanced cross sections. Can. J. Earth Sci. 6, 743e757.Di Naccio, D., Boncio, P., Cirilli, S., Casaglia, F., Morettini, E., Lavecchia, G.,
Brozzetti, F., 2005. Role of mechanical stratigraphy on fracture development incarbonate reservoirs: insights from outcropping shallow water carbonates inthe Umbria-Marche Apennines, Italy. J. Volcanol. Geotherm. Res. 148, 98e115.
Egan, S.S., Buddin, T.S., Kane, S.J., Williams, G.D., 1997. Three-dimensional modellingand visualisation in structural geology: new techniques for the restoration andbalancing of volumes. In: Proceedings of the 1996 Geoscience InformationGroup Conference on Geological Visualisation. Electronic Geology, pp. 67e82. V.1, Paper 7.
Ellis, M.A., Laubach, S.E., Eichhubl, P., Olson, J.E., Hargrove, P., 2012. Fracturedevelopment and diagenesis of Torridon Group Applecross Formation, near AnTeallach, NW Scotland: millennia of brittle deformation resilience? J. GeologicalSoc. Lond. vol. 169, 297e310.
Erslev, E.A., 1991. Trishear fault-propagation folding. Geology 19, 617e620.Ferrill, D.A., Morris, A.P., 2008. Fault zone deformation controlled by carbonate
Florez-Ni~no, J.-M., Aydin, A., Mavko, G., Antonellini, M., Ayaviri, A., 2005. Fault andfracture systems in a fold and thrust belt: an example from Bolivia. AAPG Bull.89 (4), 471e493.
Guiton, M.L.E., Sassi, W., Leroy, Y.M., Gauthier, B.D.M., 2003. Mechanical constraintson the chronology of fracture activation in folded Devonian sandstone of theWestern Moroccan Anti-Atlas. J. Struct. Geology 25, 1317e1330.
Hanks, C.L., Lorenz, J., Teufel, L., Krumhardt, A.P., 1997. Lithologic and structuralcontrols on natural fracture distribution and behavior within Lisburne Group,Northeastern Brooks Range and North Slope Subsurface, Alaska. AAPG Bull. 81(10), 1700e1720.
Hennings, P.H., Olson, J.E., Thompson, L.B., 2000. Combining outcrop data and three-dimensional structural models to characterize fractured reservoirs: an examplefrom Wyoming. AAPG Bull. 84 (6), 830e849.
Hobbs, D.W., 1967. The formation of tension joints in sedimentary rocks: anexplanation. Geol. Mag. 104 (6), 550e556.
Hugman, R.H.H., Friedman, M., 1979. Effects of texture and composition on me-chanical behavior of experimentally deformed carbonate rocks. AAPG Bull. 63(9), 1478e1489.
I~nigo, J.F., Laubach, S.E., Hooker, J.N., 2012. Fracture abundance and patterns in theSubandean fold and thrust belt, Devonian Huamampampa Formation petroleumreservoirs and outcrops, Argentina and Bolivia. Mar. Pet. Geol. 35, 201e218.
Jamison, W.R., 1997. Quantitative evaluation of fractures on Monkshood anticline, adetachment fold in the Foothills of Western Canada. AAPG Bull. 81 (7),1110e1132.
Kane, S.J., Williams, G.D., Buddin, T.S., Egan, S.S., Hodgetts, D., 1997. Flexural-slipBased Restoration in 3D, a New Approach, 1997 AAPG Annual ConventionOfficial Program, A58.
Lisle, R., 1994. Detection of zones of abnormal strains in structures using GaussianCurvature Analysis. AAPG Bull. 78 (12), 1811e1819.
Lisle, R., 2000. Predicting patterns of strain from three-dimensional fold geome-tries: neutral surface folds and forced folds. In: Cosgrove, J.W., Ameen, M.S.(Eds.), Forced Folds and Fractures, pp. 213e221. Geological Society, London,Special Publications, 169.
Mauldon, M., Dunne, W.M., Rohrbaugh, M.B., 2001. Circular scanlines and circularwindows: new tools for characterizing the geometry of fracture traces. J. Struct.Geology 23, 247e258.
McQuillan, H., 1973. Small-scale fracture density in Asmari Formation of SouthwestIran and its relation to bed thickness and structural setting. AAPG Bull. 57 (12),2367e2385.
Odling, N.E., Gillespie, P., Bourgine, B., Castaing, C., Chil�es, J.-P., Christensen, N.P.,Fillion, E., Genter, A., Olsen, C., Thrane, L., Trice, R., Aarseth, E., Walsh, J.J.,Watterson, J., 1999. Variations in fracture system geometry and their implica-tions for fluid flow in fractured hydrocarbon reservoirs. Pet. Geosci. 5, 373e384.
Ortega, O.J., Gale, J.F.W., Marrett, R., 2010. Quantifying diagenetic and stratigraphiccontrols on fracture intensity in platform carbonates: an example from theSierra Madre Oriental, northeast Mexico. J. Struct. Geology 32, 1943e1959.
Pahl, P.J., 1981. Estimating the mean length of discontinuity traces. Int. J. Rock Mech.Min. Sci. Geomech. Abstr. 18, 221e228.
Poblet, J., McClay, K., 1996. Geometry and kinematics of single layer detachmentfolds. Bull. Assoc. Pet. Geol. 80, 1085e1109.
Price, N.J., 1966. Fault and Joint Development in Brittle and Semi-brittle Rocks(Pergamon, Oxford).
Priest, S.D., 1993. Discontinuity Analysis for Rock Engineering. Chapman & Hall,London, United Kingdom.
Priest, S.D., Hudson, J.A., 1981. Estimation of discontinuity spacing and trace lengthusing scanline surveys. Int. J. Rock Mech. Min. Sci. Geomech. Abstr. 18,183e197.
Ramsay, J.G., 1967. Folding and Fracturing of Rocks. McGraw-Hill Book Company.Salvini, F., Storti, F., 2001. The distribution of deformation in parallel fault-related
folds with migrating axial surfaces: comparison between fault-propagationand fault-bend folding. J. Struct. Geology 23, 25e32.
Stewart, A.D., 2002. The Later Proterozoic Torridonian Rocks of Scotland: TheirSedimentology, Geochemistry and Origin. Geological Society, London, Memoirs,24.
Storti, F., Salvini, F., 2001. The evolution of a model trap in the central Apennines,Italy: development of cataclastic rocks in carbonates at the Narni anticline.J. Pet. Geol. 24 (2), 171e190.
Suppe, J., 1983. Geometry and kinematics of fault-bend folding. Am. J. Sci. 283,684e721.
H. Watkins et al. / Journal of Structural Geology 74 (2015) 64e8080
Suppe, J., Medwedeff, D.A., 1990. Geometry and kinematics of fault-propagationfolding. Eclogae Geol. Helvatiae 83, 409e454.
Vermilye, J.M., Scholz, C.H., 1995. Relation between vein length and aperture.J. Struct. Geology 17 (3), 423e434.
Watkins, H., Bond, C.E., Butler, R.W.H., 2014. Identifying multiple detachment ho-rizons and an evolving thrust history through cross-section restoration andappraisal in the Moine Thrust Belt, NW Scotland. J. Struct. Geol. 66, 1e10.
Watkins, H., Bond, C.E., Healy, D., Butler, R.W.H., 2015. Appraisal of fracture sam-pling methods and a new workflow to characterise heterogeneous fracturenetworks at outcrop. J. Struct. Geol. 72, 67e82.
Wennberg, O.P., Svånå, T., Azizzadeh, M., Aqrawi, A.M.M., Brockbank, P., Lyslo, K.B.,Ogilvie, S., 2006. Fracture intensity vs. mechanical stratigraphy in platform topcarbonates: the Aquitanian of the Asmari Formation, Khaviz Anticline, Zagros,SW Iran. Pet. Geosci. 12, 235e245.
Wennberg, O.P., Azizzadeh, M., Aqrawi, M.M., Blanc, E., Brockbank, P., Lyslo, K.B.,Pickard, N., Salem, L.D., Svånå, T., 2007. The Khaviz Anticline: an outcropanalogue to giant fractured Asmari Formation reservoirs in SW Iran. In:Lonergan, L., Jolly, R.J.H., Rawnsley, K., Sanderson, D.J. (Eds.), Fractured Reser-voirs, pp. 23e42. Geological Society, London, Special Publications, 270.