16
JOURNAL OF THE lNSTllUTE OF EDUCATION
JOURNAL OF THE lNSTllUTE OF EDUCATION
..
IFE JOURNAL OF THEORY AND RESEARCH IN EDUCATION
ISSN: 0794-6754
Journal of the Institute of Education Obafemi Awolowo University,
lle - lfe .
Bi-Annual Vol. 17, Nos. 1 & 2, 2016.
IJOTRE Bi - Annual Vol. 17, Nos. l & 2, 2016. iii

CALL FOR PAPERS IFE JOURNAL OF THEORY AND RESEARCH IN EDUCATION
(IJOTRE) NOTES TO CONTRIBUTORS
The Institute of Education Journal of Theory and Research in Education (IJOTRE) disseminates information derived from research findings and theoretical topics in the areas of Nursery, Primary, Secondary and Higher Education for practitioners, educators, educationists, academia, researchers, curriculum planners and policy- makers with the main goal of improving educational status. IJOTRE is a bi-annual and peer-rcviewedjoumal.
Articles arc expected to focus on any of the following topics:
I. Contributions on th eoret ical, methodological and practical teac hing aspects of education.
2. Research notes and projects repor1s.
3. Articles representing scholarly opinions on contemporary issues and trends stemming from any aspects of education.
4. Book reviews that arc significant in the field of education.
*
*
*
Guide! ines for Papers Submission
Articles should not be longer than 15 A4-si7ed pages usmg Time New Roman, font size of 12. Longer articles will attract additional publication fee.
Reference style should conform to the America Psychologtcal Assocration forn1at ( 6. Edition). This should be arranged in alphabetical order according to the surname of the authors. Footnotes are not allowed
Dr Pn Pn Pre Dr. Dr. Dr. Dr.
EDITORIAL CONS Prof. S.A. Adeyanju
Prof. M.A.Adelabu Prof. E.R.I.Afolabi -
Prof. 0.0. Obi lade-
Prof B.I.Popoola
Prof. J. A. AkandeProf. B.A. Omoteso-
Prof Y 1\. Ajibade Manuscripts' cover should include the title a ffil iation and E-mail address.
* of the paper, author(s)' name(s). institution Prof. M.A. Adeleke-
Abstract shou ld not be more than 250 words D
Two hard copies of the manuscripts should be submitted for review. Articles can also be • r. A. Adekomi
* *
*
submitted by post to The Managing Editor, IJOTRE. Institute l>f Education, Obafemi Awoi0\.\0 Un i versity, lie - lfe. Nigeria or electronically via e-mail to hajayib(ffioauife.edu.ng.
Prof. M.E. M. Kolawole Prof. J .0. Faluyi-Prof. D. Okunoye-Dr E.T.O. BabalolaProf. M.A. Ajayi -
Assessment fee of N3,000 ($30). It is a condition for publtcation that a manuscript submitted to Ife Journal of Theory and Research in Educatton (IJOTRE) has not been published and will not be simultaneously submitted or published elsewhere.
Submissions are published at the editor's exclusive discretion. Submisstons that do not conform to Prof. J.B. Bilesanmi these guidelines may not be considered for publication
Bi 1\nnual Dr. J.A. Adegbile -
IJOTRE, Vol. l 7, l'ws. I & 2, 2016.
IJOTRf Bi Annual Vol. 17 I
IJO fRF Bi Annual Vol. 17. :-.Jos. I & 2. 2016 IV
•N
:E) disseminates ~ursery, Primary, mia, researchers,
1l status. IJOTRE
ing aspects of
trends stemmmg
,man, font size of
iation fom1at ( 6'h :::of the authors.
arne( s). mst i tut!On
rticles can also be ducation, Obafcmi
via e-mai I to
that a manuscnpt 'RE) ha~ not been lished elsewhere.
I fe Journal ofThcory and Research in Education
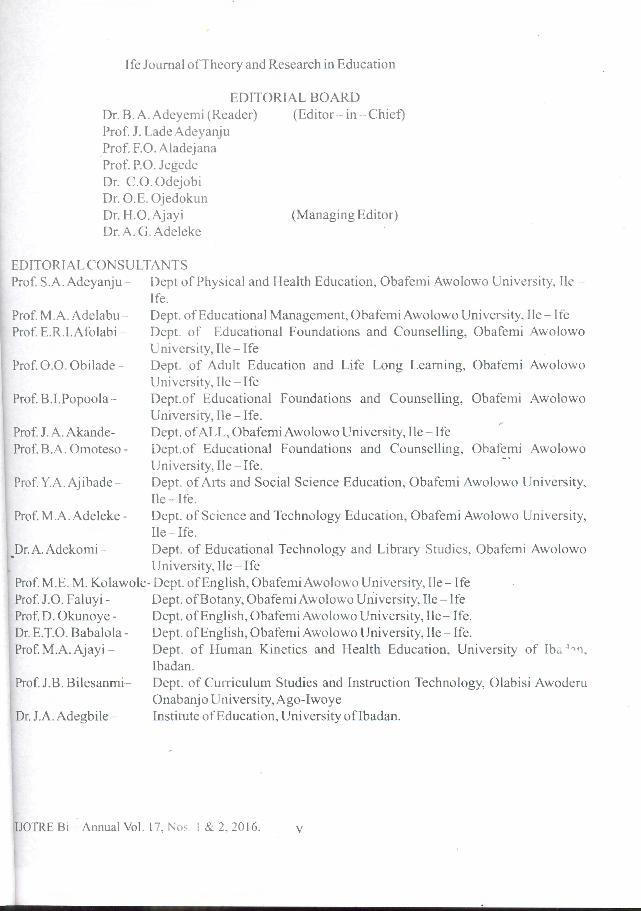
CDITORIAL BOARD Dr. B.A.Adeyemi (Reader) Prof. J. Lade Adcyanj u Prof. F.O. Aladejana Prof. P.O. Jcgcde Dr. C.O. OdcJobi Dr. O.E. Ojedokun Dr. H.O Ajayi Dr. A. G. Adclcke
EDITORIAL CONSULTANTS
(Editor in - Chief)
(Managing Editor)
Prof. S.A. Adeyanju- Dept of Physical and Health Education, Obafcmi Awolowo University. lie Ife.
Prof. M.A. Adclabu ~~ Dept. of Educational Management, Obafemi Awolowo Univcr.:;ity, lie I fc Prof. E.R.I.Atolabi Dept. of Educational Foundations and Counselling, Obafcmi Awolowo
Cniverstty, lie Ife Prof. 0.0. Obtlade Dept. of Adult Education and Life Long Learning, Obafemi Awo lowo
Universtty, lie [fe Prof. B.I.Popoola - Dcpt.of Educational Foundations and Counselling, Obafemi Awolowo
University, lie lfe. Prof. J. A. Akande- Dept. of ALL, Obafcmi Awolowo University, lie- Ifc Prof. B.A. Ornoteso- Dept.of Educational Foundations and Counselling, Obafemi Awolowo
University, Ile Tfe. Prof Y.A.Ajibade- Dept. of Arts and Social Science Education, Obafcmi Awolowo University,
lie Ife. Prof. M.A. Adelcke- Dept. of Science and Technology Education, Obafcmi Awolowo University,
Ile Ife. Dr. A. Adckomi Dept. of Educational Technology and Library Studtes, Obafemi Awolowo
University, lie Ife Prof. M.E . M. Kolawole- Dept. ofEnglish, ObaferniAwolowo University, Ile Ife Prof. J .0. Faluyi- Dept. ofBotany, Obafemi Awolowo University, Ile I fe Prof. D. Okunoyc- Dept. of English, Obafemi Awolowo University, lie Ife. Dr. E.T.O. Babalola- Dept. of English, Obaferni Awolowo University, lie - Ife. Prof. M.A. Ajayi- Dept. of Human Kinetics and Health Education, University of lb .. 1
""·
Ibadan.
1at do not confom1 to Prof. J.B. Bilesanrni - Dept. of Curriculum Studies and Instruction Technology, Olabisi Awoderu Onabanjo University, Ago-Iwoye
Dr. J.A. Adegbile- Institute of Education , University oflbadan.
lJOTRE Bt Annual Vol. 17. '\th & 2. 2016. v
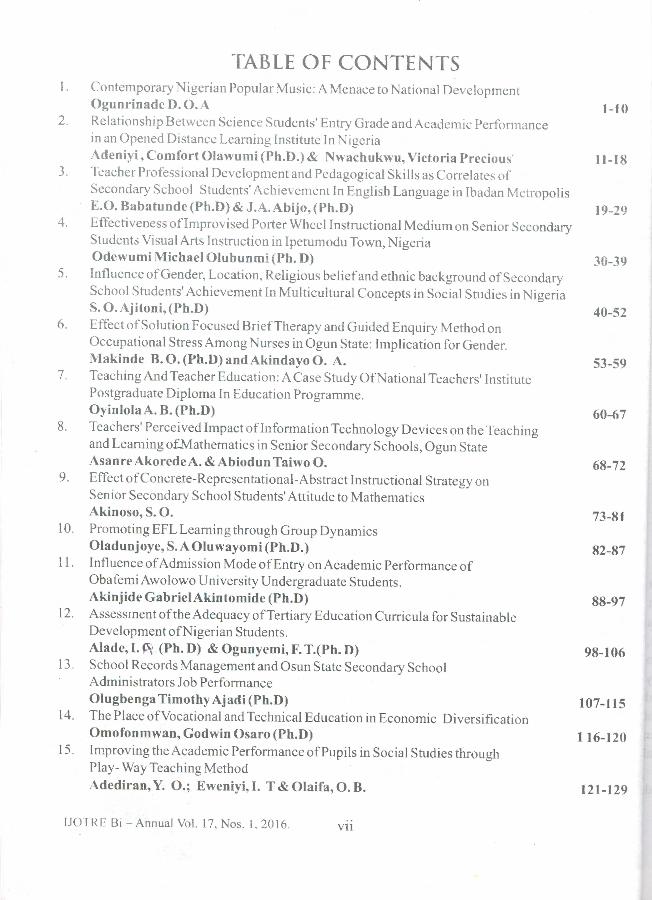
TABLE OF CONTENTS I. Contemporary Nigeri,tn Popular Music: A Menace to National Development
Ogunrinadc D. 0. A 1-10 2. RelatiOnship Between Science Students' Entry Grade and AcademiC Performance
in an Opened Dtstance Learning Institute In l'.:tgeria Adeni) i, Comfort Olawumi (Ph.D.) & Nwachukwu, Victoria Precious 11-18
3. Teacher Professional Development and Pedagogical Skills as CotTelatcs of Sccondaty School Students' Achievement In English Language in Ibadan Me ropolis E.O. Babatunde (Ph.D) & J.A. Abijo, (Ph.D) 19-29
4. Effectiveness of Improvised Porter Wheel Instructional Medium on Senior Secondary Students Visual Arts Instruction m lpctumodu Town, Nigeria Odewumi :\1ichael Olubunmi (Ph. D) 30-39
5. Influence of Gender, Location, Religious belief and ethnic background ofSecondary School Students' Achievement In Multicultural Concepts in Social Studies in 1\iigeria S. 0. •_jitoni, (Ph.D) 40-52
6. Effect of~olution Focused BncfTherapy and Guided Enquiry Method on Occupational Stress Among Nurses in Ogun State: Implication for Gender. :\lakindc B. 0. (Ph.D) and Akindayo 0. A. 53-59
7. Teaching And Teacher Education: A Case Study OfNational Teachers' Institute Postgraduate Diploma In Education Programme. Oyinlola A. B. (Ph.D) 60-67
8. Teachers' Perceived Impact oflnformation Technology Devices on the Teachmg and Learn ing o£Jv1.athcmatics in Senior Secondary Schools, Ogun State As a nrc Akorede A. & Abiodun Taiwo 0. 68-72
9. Effect ofConcrete-Rcpresentational-Abstract Instructional Strategy on Senior Secondary School Students' Attitude to Mathematics Akinoso, S. 0. 73-81
I 0. Promoting EFL Learning through Group Dynamics Oladunjoye, S. A Oluwayomi (Ph.D.) 82-87
II. Influence of Admission Mode of Entry on Academic Performance of Obafemi Awolowo University Undergraduate Students. Akinjide Gabriel Akintomide (Ph.D) 88-97
12. Assessment of the Adequacy ofTertiary Education Curricula for Sustainable Development ofNigerian Students. Alade, I.~ (Ph. D) & Ogunyemi, F. T.(Ph. D) 98-106
13 . School Records Management and Osun State Secondary School Administrators Job Performance Olugbenga Timothy Ajadi (Ph.D) 107-115
14. The Place ofVocational and Technical Education in Economic Diversification Omofonmwan,GodwinOsaro(Ph.D) 116-120
15. Improving the Academic Performance of Pupils in Social Studies through Play- Way Teaching Method
-\dediran, Y. 0.; Eweniyi, I. T & Olaifa, 0. B. 121-129
!JOJ RF Bi - Annual Vol. 17. Nos. I. 2016. Vll
Abstract
There is no gainsayil packaged, made avai/1 uprightness in Nigeric. and violence. This is e\ lives of the citizenry -money mongering, ind Music is a powerful 1
deformation of charac. songs. This paper exw. assess its negative an1 society. The paper the1 apart from entertainm music that egg on and 1
societal reformation S<
holistic human develop, Keywords: Popular Governance, National
Introduction
"Music des true judgm( worse.'1
Music is an irr conveyed. Since the ea musical themes are ofter their audience and the increasingly witnessing , compantes. thereh} mak often neglected theme,
IJOTRE Bt Annual Vo
Abstract
blvestment in Education and blclusive Growth: Any Relationship for Nigeria?
Adediran, Oluwasogo S. Corresponding Author:Department of Economics and Development Studies,
College of Development Studies, Covenant University, Ota, Ogun. E-mail: [email protected]
os06742n6t
Amoda, Bisola M. Business Education Department
Tai Solarin University of Education, Ijagun, Ijebu- Ode, Ogun State.
[email protected] 08055418653
Adebayo, Adekunle A. DepruronentofEcononrics
Michael Otedola College of Primary Education, Naforija, Epe, Lagos State. [email protected]
Until recently,.Jhe last decade has witnessed massive economic growth in Nigeria, but the literature
has proved that the growth has not been inclusive in nature. This is because, in spite of the level of growth recorded overtime, the poverty rate is still very high. This study investigates the relationship between human capital (education) and inclusive growth in Nigeria between the sample period of 1981
to 2013. The Johansen co-integration me_thod and Error Correction Mechanism (ECM) were adopted. The result reveals that human capital has a positive and significant long run relationship with inclusive growth in Nigeria. While, it showed a negative and significant relationship for public capital expenditure on education and a negative, it was not having significant relationship with public recurrent expenditure and education. The study however suggest that, f or the Nigerian economy to maximise the benefits from human capital and public expenditure on education, the government must initiate policies that will drive not only quantity and quality education, but that is all inclusive, so OJ to create more employment opportunities. An increase in employment will therefore increase income and standard ofliving, which will in tum reduce poverty and inequality. Keywords: Education; Inclusive Growth; Economic Growth; Poverty and Inequality.
Introduction The research on the role of human capital in econonric growth cannot be overemphasized in
the study of the economies of the developed and developing countries. Following Becker (1962) and Schultz (1961). human capital can be defined as the set of knowledge, skills, competencies, and
IJOTRE Bi -Annual VoL 17. Nos. 2. 2016. 86
abilities embodJ and nrigration.
investments tha and various am
growth (Lawai' theoretical poin returns on educ 1994).
All the endogenous gro former argue tl increase in the Moreover, there accumulation ax output increase stock. Conseqw VanReenen, 2()(
Theore1 affects econom
increases labor 1 in endogenous knowledge of t andWoessmann policies that fac long-run econm Barro and Sala facilitating eco participation are
Meanw literature (see St proved that the 1 recorded overtir people out ofp spending on edu growing econon economy in Afi billion(World D African GOP, 3~
these facts, it is • economic prospt economy. Henc• inequality gap is
IJOTRE Bi- An

-- ·. --·-~., , ....
hip for N"~geria?
Studies, \Ul.
r, but the literature ;pite of the level of ·es the relationship
1ple period of 1981 CM) were adopted. rship with inclusive for public capital •nship with public "{erian economy to ~government must l inclusive, so aJ to crease income and
uality.
•veremphasized in Jecker (1962) and ompetencies, and
abilities embodied in individuals and acquired, for example, through education, training. medical care, and migration. Therefore, education is considered as one of the most significant human capital investments that a nation can embark upon. It plays an importantrole in the process of economic growth and various amount of researches have been undertaken to access the link between education and growth (Lawal and Iyiola, 2011; Ndiyo, 2007, Benos and Zotou, 2014 ). Looking at this nexus from the theoretical point of view, economic models have emphasized the role of education in determining returns on education that ultimately foster economic growth (Lucas 1988; Rebelo 1991 and Romer, 1994).
All these models have explained the important distinction between neo-classical and endogenous growth theories regarding the linkage between human capital andeconomic growth. The former argue that a one-off permanent increase in the stock of human capital results in a one-off increase in the economy's growth rate until the economy reaches the new higher steady-state. Moreover, there are two strands of new growth theories, which focus on the impact of (a) human capital accumulation and (b) human capital stock respectively. A one-off rise in human capital causes a one-off output increase in human capital accumulation and a permanent increase in growing human capital stock. Consequently, the social benefits of education are much greater in the latter case (Sianesi and VanReenen,2003).
Theoretical contributionsalso,emphasized different mechanisms through which education affects economic growth. First, education increases the human capital of the labor force, which increases labor productivity and transitional growth toward a higher equilibrium output level. Second, in endogenous growth theories, education increases the innovative capacity.. of the economy, knowledge of new technologies, products and processes, and thus promotes growth (Hanushek andWoessmann, 2008). From the empirical point of view, studies have shown that education and the policies that facilitate the process of innovation and knowledge creation have profound effects on the long-run economic growth and development patterns of an economy (Barro, 1991; Rebelo, 1991 and Barro and Sala-i-Martin, 1998). Hence, the benefits of information and knowledge diffusion in facilitating economic transactions, productive arrangements, social inter*tions and political participation are also widely acknowledged (Sen, 1999 and Masino and Nino-Zarazua, 20 16).
Meanwhile, the last decade has witnessed massive economic growth in Nigeria, but the literature (see Sodipe and Ogunrinola, 2011; Oseni and Oseni, 2015andAyinde and Ymusa, 2016) has proved that the growth has not been inclusive in nature. This is because, inspite of the level of growth recorded overtime, the poverty rate is still very high. While, economic growth is a perfect way to lift people out of poverty into gainful employment and higher incomes that would increase personal spending on education andhealthBhagwati (20 11 ). With the economy ofNigeria been one of the fastest growing economies in the world, in terms of nominal Gross Domestic Product (GDP) and the largest economy in Africa with an average annual growth rate of 6.2 percent and nominal GDP of $568 billion(World Development Indicator, 2015). Nigeria accounts for around 55 percent of the West African GDP, 35 percent of Sub-Saharan Africa's GDP and one-fifth of the African population. With these facts, it is evident that th .... t;onomy is buoyant, prosperous and growing. However. this level of econorruc prosperity has not Jwn much visible impact on a large percentage of the participants m the economy. Hence, as the t' .Jomy is growing, poverty and unemployment are increasmg and the mequality gapis~dening
lJOTRE Bt Annual V . Nos. 2. 2016. 87

Looking at these issues raised, several of the empirical literature reviewed confirmed that a positive relationship exists between human capital and economic growth, but studies testing the relationship between human capital and inclusive growth is stilJ scanty in Nigeria and this study attempts to fill that gap by introducing new variable to measure inclusive growth. Also, in the empirical literature for Nigeria, many studies only relates human capital to economic growth and neglected the sustainability of growth or how human capital development can solve the growth without development problem ofNigeria. This study attempt to fill that gap.
The rest of the paper is organized as follows. Section 2 gives some stylized facts on the relationshipbetween education expenditure and economic growth. Section 3 presents the proxies employed to measure education and growth and descnbe the methodology. Section 4 presents the model specification and technique of estimation. Section 5analyzes the results and main findings. Finally, Section 6 concludes with the policy implications and recommendations.
2. Some Stylized Facts Until 2016, the GDP ofNigeria has been growing at an average of 6.2 percent per annum, but
with this growth, most Nigerians are still below poverty line of spending less than $2 a day. The Gini index that is used to measure inequality has been ranging from 0.4 to 0.47 since 1980. The
unemployment rate bas equally been higher above 24 percent, according to official figure by the
National Bureau of Statistics. Nigeria's poverty rate, inequality rate and unemployment rate are high and correlates with growth rate. The economy is seen as growing outside its people as only the
economy is experiencing buoyancy and success, while the people are not so catered for as far as the growth is concerned. The expectation is that as an economy is growing, there should be creation of
employment opportunities that will reduce the unemployment rate. An increase in employment will therefore increase income and standard ofli ving, which will in turn reduce poverty and inequality.
In contrast to this, Nigeria is yet to experience such transforming growth as the economy is plagued with increasing unemployment and stagnant low incomes. The presence of stagnant and low income has prevented an increase in expenditure, especially on education. Although, there has been an
improvement in the access to education in Nigeria, tQe quality has continued to decline as a result of poor funding in the recent time (see Ahmed, 2015). For instance in 2010, 2011 and 2012; the allocations were N234.8b representing 6.40 percent,N306.3b (7.69 percent) and N400.15b (10.0 percent) of the total budget resepectively. With the following allocations for the subsequent years: 2013-N426.53b (8.70percent),2014-N493b (10.6percent) and2015-N392.2b (9.5percent), still far below the expected mark of26 percent of the total budget recommended by UNESCO.
Inclusive growth entails the participation of the people in the growth of their economy and the ability to enjoy equally the proceeds from this growth. Researchers have done extensive research on this issue as it pertains to inclusive growth. They gave various barriers and constraints to poor people's participation in growth in Nigeria, these include geography; human capital; access to credit; economic insecurity; and health amongst others. Some of the literature argues that facilltating access of the poor to growth is insufficient to obtain inclusive growth; attention must also be paid to the quality of their participation.
IJOTRE B1 - Annual Vol. 17. Nos. 2, 2016. 88
3. Methodol~
The s' neoclassical gx human capital objectives oftl: for co-integrat further explair 1981-2013 SO\
Bank ofNigeri
4.1 ModelSpe A stan
endogenous gr
where; Y: ou~ A:tec:
K:pb~
L:labt This model pre
activities. Hen•
The c.
payment in tot
+ f3> 1. There
are two sectors
as teachers to I and physical C2
Tbest
factor payment
and developmt
technological
Levine, 2001 ). and capital, tht:
This equation i Hence, the gro•
2014). Thenat
The variables
specified using
IJOTRE B1-A
. -...:-·_ .. .:~"· ·'
viewed confirmed that a , but studies testing the 1 Nigeria and this study rth. Also, in the empirical :rowth and neglected the t1h without development
ne stylized facts on the 3 presents the proxies
. Section 4 presents the ults and main findings. s.
percent per annum, but
than $2 a day. The Gini
0.47 since 1980. The
> official figure by the
aployment rate are high its people as only the
;atered for as far as the
~ should be creation of
se in employment will rty and inequality.
wth as the economy is ce of stagnant and low >ugh, there has been an o decline as a result of , 2011 and 2012; the • and N400.15b ( 10.0 the subsequent years: (9.5percent), still far sco. their economy and the extensive research on raints to poor people's ss to credit; economic ing access of the poor to the quality of their
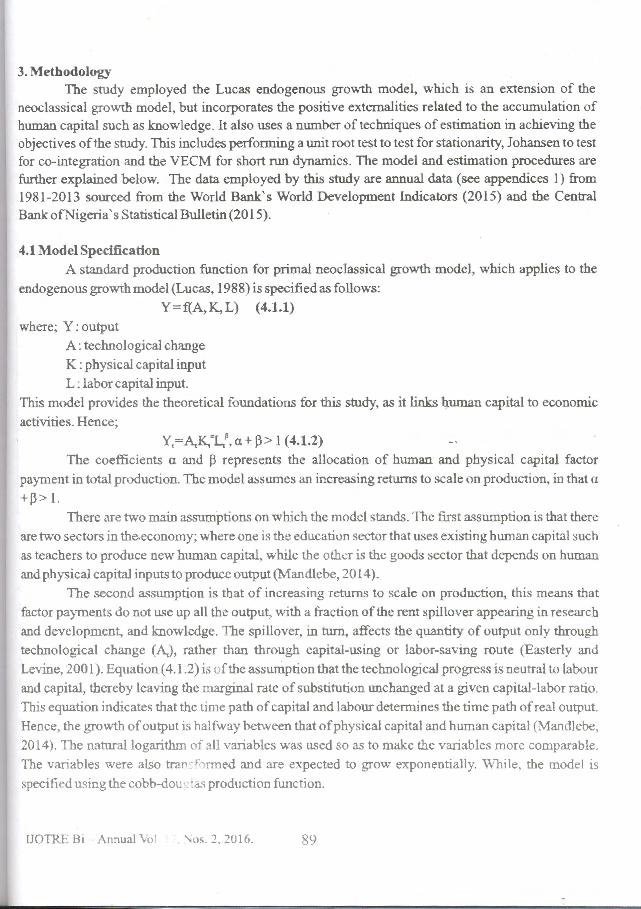
3. Methodology The study employed the Lucas endogenous growth model, which is an extension of the
neoclassical growth model, but incorporates the positive externalities related to the accumulation of human capital such as knowledge. It also uses a number of techniques of estimation in achieving the objectives of the study. This includes performing a unit root test to test for stationarity, Johansen to test for co-integration and the VECM for short run dynamics. The model and estimation procedures are further explained below. The data employed by this study are annual data (see appendices I) from 1981-2013 sourced from the World Bank's World Development Indicators (2015) and the Central Bank ofNigeria' s Statistical Bulletin (20 15) .
4.1 Model Specification
A standard production function for primal neoclassical growth model, which applies to the
endogenous growth model (Lucas, 1988) is specified as follows:
Y = f{A, K.,L) (4.1.1)
where; Y: output
A : technological change
K : physical capital input
L : labor capital input.
This model provides the theoretical foundations for this study, as it links human capital to economic
activities. Hence; Y,=A,K,a.L,~, a+j}> 1 (4.1.2)
The coefficients a and p represents the allocation of human and physical capital factor
payment in total production. The model assumes an increasing returns to scale on production, in that a +~> l.
There are two main assumptions on which the model stands. The first assumption is that there
are two sectors in the..economy; where one is the education sector that uses existing human capital such
as teachers to produce new human capital, while the other is the goods sector that depends on human
and physical capital inputs to produce output (Mandlebe, 20 14).
The second assumption is that of increasing returns to scale on production, this means that
factor payments do not use up all the output, with a fraction of the rent spillover appearing in research
and development, and knowledge. The spillover, in turn, affects the quantity of output only through
technological change (A,), rather than through capital-using or labor-saving route (Easterly and
Levine, 2001 ). Equation ( 4.1.2) is fthe assumption that the technological progress is neutral to labour
and capital, thereby leaving the uarginal rate of substitution unchanged at a given capital-labor ratio.
This equation indicates that the t me path of capital and labour determines the time path of real output.
Hence, the growth of output is halfway between that of physical capital and human capital (Mandlebe,
2014). The natural logarithm ofatl variables was used so as to make the variables more comparable.
The variables were also tran '>rmed and are expected to grow exponentially. \Vhile, the model is
specified using the cobb-dou as production function.
IJOTRE B1 Annual Vl ·os 2. 2016 89
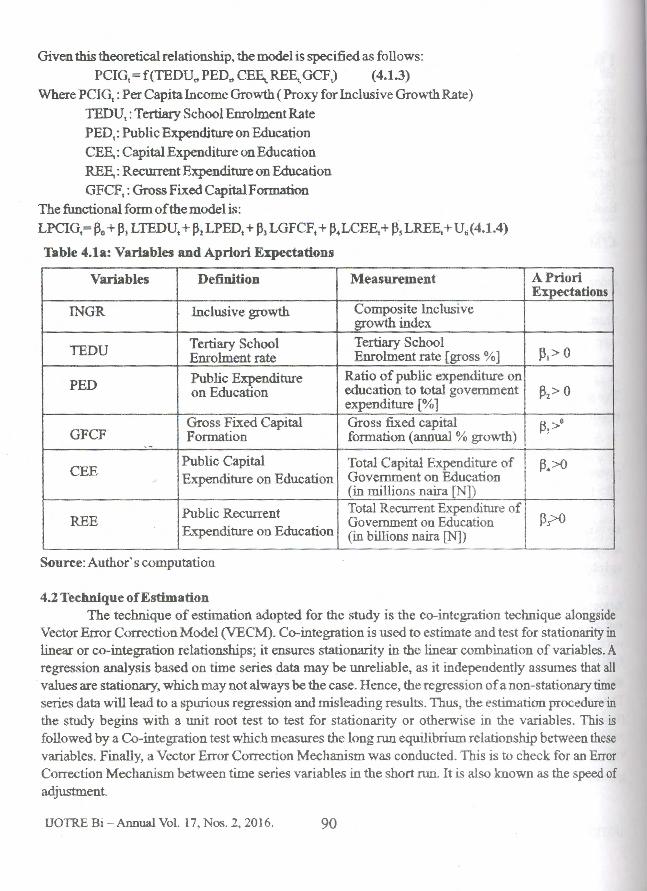
Given this theoretical relationship, the model is specified as follows:
PCIG,=f(TEDU.,PED.,CEI;,REE._GCF.) (4.1.3)
Where PCIG,: Per Capita Income Growth (Proxy for Inclusive Growth Rate)
TEDU, :Tertiary School Enrolment Rate
PED,: Public Expenditure on Education
CEE,: Capital Expenditure on Education
REE,: Recurrent Expenditure on Education
GFCF,: Gross Fixed Capital Formation
The functional form of the model is:
LPCIG,= ~o + ~~ LTEDU, + ~2 LPED, + ~3 LGFCF, + ~.LCEE, + ~' LREE, + U"(4.1.4)
Table 4.1a: Variables and Apriorl Expectations
Variables Definition Measurement
INGR Inclusive growth Composite Inclusive growth index
TEDU Tertiary School Tertiary School Enrolment rate Enrolment rate [gross%]
PED Public Expenditure Ratio of public expenditure on on Education education to total governrnent
expenditure [%]
GFCF Gross Fixed Capital Gross fixed capital Fonnation formation (annual % growth)
·-
CEE Public Capital Total Capital Expenditure of Expenditure on Education Government on Education
(in millions naira [Nl)
REE Public Recurrent Total Recurrent Expenditure of
Government on Education Expenditure on Education (in billions naira [N])
Source: Author's computation
4.2 Technique of Estimation
A Priori Expectations
~,>0
~l> 0 i I
~l>o
~4>0
~,>0
The technique of estimation adopted for the study is the co-integration technique alongside Vector Error Correction Model (VECM). Co-integration is used to estimate and test for stationarity in linear or co-integration relationships; it ensures stationarity in the linear combination of variables. A regression analysis based on time series data may be unreliable, as it independently assumes that all values are stationary, which may not always be the case. Hence, the regression of a non-stationary time series data will lead to a spurious regression and misleading results. Thus, the estimation procedure in the study begins with a wlit root test to test for stationarity or otherwise in the variables. This is followed by a Co-integration test which measures the long run equilibrium relationship between these variables. Finally, a Vector Error Correction Mechanism was conducted. This is to check for an Error Correction Mechanism between time series variables in the short run. It is also known as the speed of adjustment
UO'fRE Bi - Annual Vol. 17, Nos. 1, 2016. 90
4.3 Presentatio The Au.
such that; the nu
oftheADFtest~
less, the null hyp Thevar
1(1 ), the ADF re percent respecti integration state attempted. The t
at first differenct
Table4.1b:Aug
Variable
LPCIG
LREE
LCEE
LTEDU
LGFCF
LPED
Source: Author
The Joh
common stocb.ru relationship betv co-integration ra statistic at the 5 p
Maximwn-Eiget
Eigenvalue stati~ The res\
statistic is used t4
approximately e4
statistic is less th;
UOTRE Bt - Aru

4)
A Priori Expectations
131 > 0
on ~nt 13.> 0
h) 13)>0
,f 134>0
of 13?0
~hnique alongside :t for stationarity in :ion of variables. A ly assumes that all ton-stationary time tation procedure in variables. This is
;hip between these check for an Error wn as the speed of
4.3 Presentation and Discnssion of Results
The Augmented Dickey-Fuller (ADF) test was employed in this study. The rule of thumb is
such that; the null hypothesis that the variables are non-stationary will be rejected if the absolute value
oftheADF test statistics is greater than the critical value 1 percent. 5 percent and 10 percent and if it is
less, the null hypothesis is accepted.
The variables LPCIG, LTEDU, LPED, LCEE, LREE and LGFCF, when integrated of order
1(1), the ADF test statistics in absolute value are greater than their critical values at 1 percent and 5 percent respectively. Hence, we say they are stationary at first difference. The hypothesis of co
integration states that only a linear combination of series that are integrated of the same order should be
attempted. The unit root at first difference was adopted in this study because all variables are stationary
at first difference.
Table 4.1 b: Augmented Dickey-Fuller (AD F) Tests for Unit Roots
Variable ADF Test Statistic with s•;. Critical Value Order of Remark Constant and Linear Trend Integration
LPCIG -6.796268 -2.960411 I(l) Stationary
LREE -5.198528 -2.971853 1( 1) Stationary
LCEE -8.281376 -2.960411 I(l) Stationary
LTEDU -4.544821 -2.960411 1(1) Stationary
LGFCF -3.902149 -2.960411 1(1) Stationary
LPED -5.130745 -2.971853 I(l) Stationary
Source: Author's Computation using E-views 7.
The Johansen Co-integration test is used to determine the co-integrating rank and number of
common stochastic trends in the system. The test is carried out to specify the nature of the long run
relationship between inclusive growth based on a question this study seeks to answer. The result of the
co-integration rank test present below reveal that there is three co-integration equations for the Trace
statistic at the 5 percent level. The result also revealed that there are one co-integration equations for the
Maximum-Eigenvalue statistic at the 5 percent level. This study is employs the use of the Maximum
Eigenvalue statistics in interpretation.
The results from the Johansen co-integration test are displayed below in Table 4.1. The T
statistic is used to show the significance of the independent variable in the long run. If the T-statistic is
approximately equal to 2 or greater than 2, the variable is statistically significant but however, if the T
statistic is less than 2, the variable is not statistically significant.
DOTRE B1- Annual Vol. 17. Nos. 2. 2016. 91
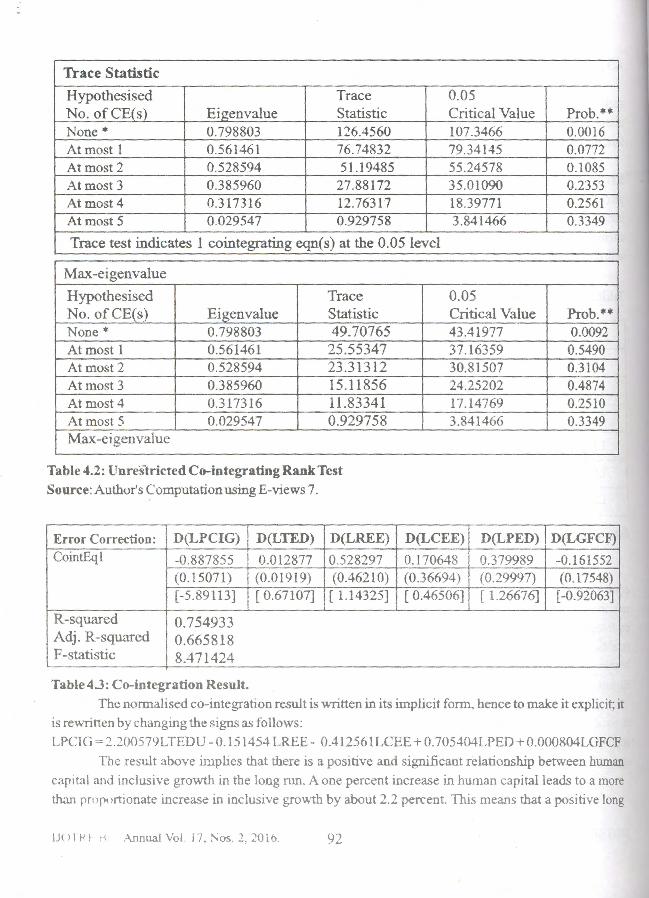
Trace Statistic
Hypothesised Trace 0.05 No. ofCE(s) Eigenvalue Statistic Critical Value None* 0.798803 126.4560 107.3466 At most 1 0.561461 76.74832 79.34145 At most 2 0.528594 51.19485 55.24578 At most 3 0.385960 27.88172 35.01090 Atmost4 0.317316 12.76317 18.39771 At most 5 0.029547 0.929758 3.841466
Trace test indicates 1 cointegrating eqn(s) at the 0.05 level
Max-eigenvalue
Hypothesised Trace No. ofCE(s) Ei_g_envalue Statistic None* 0.798803 49.70765 At most 1 0.561461 25.55347 At most 2 0.528594 23.31312 At most 3 0.385960 15.11856 Atmost4 0.317316 11.83341 At most 5 0.029547 0.929758 Max-eigenvalue
Table 4.2: Unres1ricted Co-integrating Rank Test Source: Author's Computation using E-views 7.
Error Correction: D(LPCIG) D(LTED) D(LREE) CointEql -0.887855 0.012877 0.528297
(0.15071) (0.01919) (0.46210) [-5.89113] [ 0.67107] [ 1.14325]
R-squared 0.754933 Adj. R-squared 0.665818 F-statistic 8.471424
-
Table 4.3: Co-integration Result.
0.05 Critical Value 43.41977 37.16359 30.81507 24.25202 17.14769 3.841466
- ---···--··· - ··· ·· - ----
D(LCEE) D(LPED)
0.170648 0.379989 (0.36694) (0.29997) [ 0.46506] [ 126676]
Prob.** 0.0016 0.0772 0.1085 0.2353 0.2561 0 .3349
•
•
Prob.** 0.0092
0.5490 0.3104 0.4874 0.2510 0.3349
- --- ------- -
D(LGFCF)
-0.161552 (0.17548)
[-0.92063)
The normalised co-integration result is written in its implicit form, hence to make it explicit; it is rewritten by changing the s1gns as follows:
LPCIG <~.200579LTEDU- 0.151454 LREE- 0.412561 LCEE+0.705404LPED+0.000804LGFCF
fhc result above implies that there is a pos1t1ve and significant relationship between human
capital and inclusive gro\\-1h in the long run. A one percent increase in human capital leads to a more
than rrurort!Onate increase in inclusive growth by about 2.2 percent. This means that a positive long
IJ< ll f<' t ·< -\nnual Vol i 7. :-.os. 2, 20 io 92
run relationsl
priori expect relationship.
Then
expenditure <
education exJ:
percent. This . is expected to
The result alx expenditure o expenditure o percent. This additional scb
longrun. There
expenditure a: percent increa lead to a more
with the a prio
the education ~ The«
flXed capital f capital format: percent. This t inclusive gro~ formation and an increase in tJ
4.4 Vector Err Thepr
restricted VA]
relationship the with the long
variables to ino adjustments.TI
sign and lies bet The coefficient
shows that there
Note: T-statistic
Source: Author
UOTRE B1-Ar
lue Prob.** 0.0016 0.0772
I 0.1085 I 0.2353
0.2561 I 0.3349
I
ue Prob.** 0.0092
I 0.5490 0.3104
I 0.4874 ~ 0.2510
I 0.3349
I
I
l [)) D(LGFCF)
9 -0.161552
D (0.17548)
~ (-0.92063]
i
nake it explicit; it
. 000804LGFCF
1 between human
I leads to a more
U a positive long
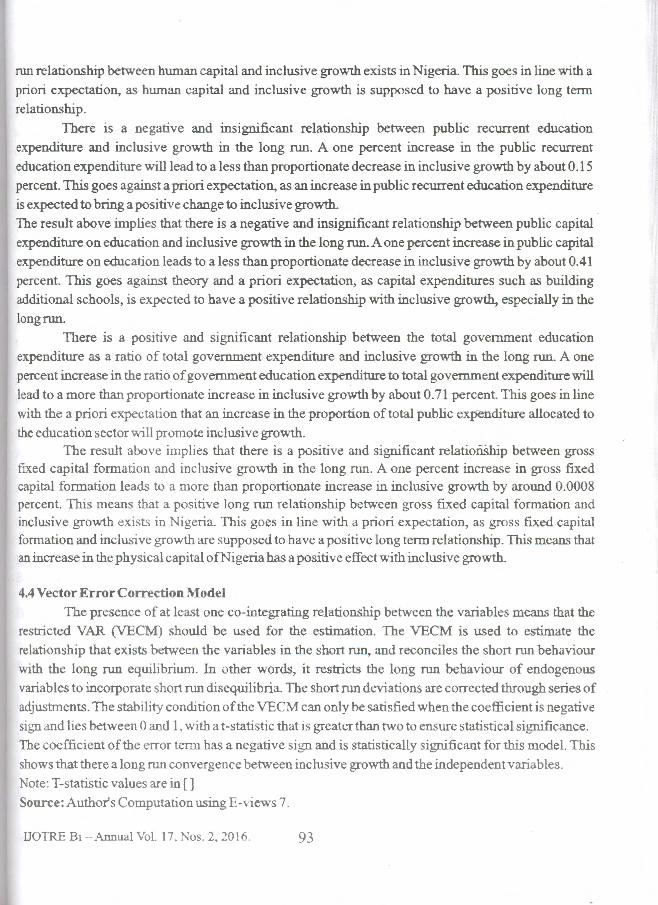
run relationship between human capital and inclusive growth exists in Nigeria. This goes in line with a
priori expectation, as human capital and inclusive growth is supposed to have a positive long term
relationship.
There is a negative and insignificant relationship between public recurrent education
expenditure and inclusive growth in the long run. A one percent increase in the public recurrent
education expenditure will lead to a less than proportionate decrease in inclusive growth by about 0.15
percent. This goes against a priori expectation, as an increase in public recurrent education expenditure
is expected to bring a positive change to inclusive growth. The result above implies that there is a negative and insignificant relationship between public capital
expenditure on education and inclusive growth in the long run. A one percent increase in public capital expenditure on education leads to a less than proportionate decrease in inclusive growth by about 0.41
percent. This goes against theory and a priori expectation, as capital expenditures such as building
additional schools, is expected to have a positive relationship with inclusive growth, especially in the
longrun. There is a positive and significant relationship between the total government education
expenditure as a ratio of total government expenditure and inclusive growth in the long run. A one
percent increase in the ratio of government education expenditure to total government expenditure will
lead to a more than proportionate increase in inclusive growth by about 0. 71 percent. This goes in line
with the a priori expectation that an increase in the proportion of total public expenditure allocated to
the education sector will promote inclusive growth. The result above implies that there is a positive and significant relatioiiShip between gross
fixed capital formation and inclusive growth in the long run. A one percent increase in gross fixed capital formation leads to a more than proportionate increase in inclusive growth by around 0.0008 percent. This means that a positive long run relationship between gross fixed capital formation and inclusive growth exists in Nigeria. This goes in line with a priori expectation, as gross fixed capital formation and inclusive growth are supposed to have a positive long term relationship. This means that an increase in the physical capital ofN igeria has a positive effect with inclusive growth.
4.4 Vector Error Correction Model The presence of at least one co-integrating relationship between the variables means that the
restricted VAR (VECM) should be used for the estimation. The VECM is used to estimate the
relationship that exists between the variables in the short run, and reconciles the short run behaviour
with the long run equilibrium. In other words, it restricts the long run behaviour of endogenous variables to incorporate short run disequilibria. The short run deviations are corrected through series of adjustments. The stability condition of the VECM can only be satisfied when the coefficient is negative
sign and lies between 0 and 1. with at-statistic that is greater than two to ensure statistical significance .
The coefficient of the error term has a negative sign and is statistically significant for this model. This
shows that there a long run convergence between inclusive growth and the independent variables.
Note: T-statistic values are in [ ]
Source: Author's Computation using E-Vlews 7.
UOTRE Bt Annual Vol 17. Nos. 2. 2016. 93

The results of the estimation give the short run relationships among the variables. The result
reveals that though the coefficient of all the independent variables lie between 0 and 1, only LPCIG and
LGFCF are negative. It also reveals that of all the independent variables, none is statistically
significant. This implies there is no meaningful error correction taking place in the isolated
independent variables; LTEDU, LREE, LCEE, LPED and LGFCF. The result confirms the positive
relationship between LTEDU, LCEE, LPED, LREE, LGFCF and inclusive growth. The result showed
that a positive relationship exists in LTEDU in relation to inclusive growth in the short run. The
coefficient shows that 88.7 percent of errors in the current period will be corrected in the subsequent
period respectively which implies a more than average speed of adjustment The result of the
estimation shows that the explanatory variables account for about 75.49 percent of the variations in inclusive growth.
Summary ofFindings The analysis was carried out mainly to investigate the relationship between education
expenditure and inclusive growth in Nigeria. All variables were revealed to be stationary at first difference. The Johansen co-integration and VECM results reveal that there is a positive and significant relationship between human capital and inclusive growth in the long run, which goes strongly in line with a priori expectations. Gross fixed capital formation and ratio of public expenditure on education to total government expenditure also showed a positive relationship, while total recurrent expenditure of government on education and total capital expenditure of government on education showed a negative relationship in the co-integration.
Tertiary ~olment rate, total recurrent expenditure of government on education, total capital
expenditure of government on education, gross fixed capital formation and ratio of public expenditure
on education to total government expenditure showed a positive relationship in the VECM. In the
VECM, none of the independent variables were significant. This means that human capital positively
influences inclusive growth in both the short and long run, while total capital expenditure of
government on education and total recurrent expenditure of government on education negatively
influences inclusive growth in the long run, but positively influences growth in the short run. The
results also showed that gross fixed capital formation and ratio of public expenditure on education to total government expenditure positively influences growth both in the short and long run. While
working papers on inclusive growth have claimed that a positive relationship exists between human
capital and inclusive growth, this research accepts that inference and supports government's
expenditure on education as well as the human capital itself. Hence, all the null hypotheses of this study
should be rejected.
6. Policy Implications and Recommendation The positive impact of human capital on inclusive growth conforms to the Lucas endogenous
growth theory. Thts study emphasised quantity and quality of human capital. Hence, human capital is
an important factor for the attainment of inclus1ve growth in Nigeria. Nigeria has the potentials and
opportunity due to the high revenue from 011, but has not engaged these potentials and opportunities
IJOlR!· H1 Annual \ol 17. Nos. 2. 2016. 94
,.
into creating ani growth. These i: standard of 26 I
academic currie courses; increasi of these tertiary i ages) and promo development cer
The result sho" education and i recurrent expenc exists between tc
inclusive growtl Actual and oppoof primary educa at all levels. He:
remarkable chan
and quality ofhu
References Ahmed, s. (201
Journal Ayinde, T. & Ym
analysis Barro, R. J. (199
106(2),
Barro, R. & Sala· Becker, G.S. (19
70(5), ~ Benos, N. & Zo1
Develof. Bhagwati, J. (20 Easterly, w. & 1
growth?
It's not factor ac 177-21S
Hanushek, E. A. Journal
Lawal,A.& lyiol Emergir
UOTREBi-Am
- ' '
. . . ~
lhles. The result
only LPCIG and
~ is statistically
in the isolated
rms the positive
1e result showed
: short run. The
1 the subsequent
1e result of the
:he variations in
;veen education ation.azy at first a positive and un, which goes Jlic expenditure e total recurrent nt on education
on, total capital
>lie expenditure
VECM. In the
1pital positively
expenditure of
tion negatively
~ short run. The
on education to
:mg run. While
:>etween human
1 government's
ses of this study
~endogenous
uman capital is
: potentials and
d opportunities
into creating an inclusive growth procedure. The nation needs to restructure the educational system for
growth. These issues can be accessed through: increase in budgetary allocation to meet the world
standard of 26 percent of the annual total budget to the education sector; the restructuring of the
academic curriculum at each level of education to include more applied. vocational and practical
courses; increasing the quality and quantity of the faculties in these institutions; increasing the quantity
of these tertiary institutions; the introduction of the concept of continuing education (education for all ages) and promotion of research, innovation and development through the construction of research and
development centers in all tertiary institutions.
The result shows a negative and significant relationship between public capital expenditure on
education and inclusive growth, while a negative and insignificant relationship between public
recurrent expenditure on education and inclusive growth. Also, a positive and significant relationship
exists between total government education expenditure as a ratio of total government expenditure and
inclusive growth. AB earlier stated. access to education does not necessarily guarantee enrolment
Actual and opportunity costs have great impact on tertiary level education in Nigeria. Though the goal
of primary education for all is yet to be achieved, the policy has contributed to the increase in enrolment
at all levels. Hence, if this policy is introduced at the secondary and tertiary level, it may bring a
remarkable change. These policies if properly applied to the economy will spur an increase in the level
and quality ofhuman capital in the economy, which will translate to inclusive growth.
References Ahmed, S. (2015). Public and private higher education financing in Nigeria. European Scientific
Jouma/11(7), 92-109. Ayinde, T. & Ymusa, 0. (20 16). Financial Development and Inclusive Growth in Nigeria: A threshold
analysis .Acta Universitats Danubius, 12( 5), 166-189. Barro, R J. ( 1991 ). Economic growth in a cross section of countries. Quarterly Journal of Economics
106(2),407-443. , Barro, R & Sala-i-Martin,X. (1998). Economic growth, Cambridge, MA.,MlT Press. Becker, G.S. (1962r Investment in human capital: a theoretical analysis. Journal of political Economy
70(5), 9-49. Benos, N. & Zotou, S. (2014). Education and economic growth: A metal-Regression analysis. World
Development64, 669-689. Bhagwati, J. (20 11 ). Growth and poverty: The great debate. CUTS International. Easterly, W. & Levine, R (2015). What have we learned from a decade of empirical research on
growth? I~s not factor accumulation: Stylized facts and growth models. World Bank Econ Rev 2001; 15 (2):
177-219. doi: 10.1093/wber/15.2.177. Hanushek, E. A., & Woessmann, L. (2008). The role of cognitive skills in economic development.
Journal ofEconomic Literature46(3 ), 607-668.
Lawai, A.& Iyiola, W. T. (20 11) F..ducation and economic growth: The Nigerian experience. Journal of Emerging Trends in E ~onomics and Marulgement &iences, 2(3), 22~231.
UOTRE Bi-Annual Vol. P Nos. 2, 2016. 95

Lucas, R E. (1988). On the mechanics of economic growth. Journal ofMonetaryEcoMmics.22(1), 3-42.
Mandlebe, W. (2014). Human capital and inclusive growth: A case ofBotswana. ProQuest UC. Masino, S. & Nino-Zarazu.a, M. (2016). What works to improve the quality of student learning in
developing countries? International Journal of Educational Development 48, 5 3-65. Ndiyo, N. A (2007). A dynamic analysis ofEducation and economic growth in Nigeria The Journal of
Developing Areas, 41 (1 ), 1-16. Oseni, 0. & Oseni, E. (2015). Achieving inclusive economic growth and development in Nigeria
through MSMEs. Journal of Economic and Financial Studies, 3( 4), 30-40. Rebelo, S. ( 1991 ). Long-run policy analysis and long-run growth. Journal ofPolitical Economy, 99(3),
500-521. Romer, P. ( 1994). The origins of endogenous growth. Journal ofEconomic Perspective, 8( 1 ), 3-22. Schultz, T. W. ( 1961 ). Investment in human capital. American Economic Review 51 ( 1 ), 1-17. Sen, A. (1999). Development as Freedom. Oxford: Oxford University Press. Sianesi, B.& VanReenen, J. (2003). The returns to education: Macroeconomics. Journal of Economic
Surveys L 7(2), 157-200. Sodipe, 0. A. & Ogunrinola, 0. I. (2011). Employment and economic growth nexus in Nigeria.
Journal ofBusinessand&cialScience, 2(ll),pp:232-239. World Bank (2015) . World Development Indicators. Washington, DC: World
Bankdoi: 10.1596/978-1 -4648-{)440-3.
UOTRE Bi - Annual Vol. 17. Nos. 2. 2016. 96
Compara
Abstract In the Niger£
institutions ar
power for the
while the priv.
class in the soc class who uszu therefore wast
Ogun State wz design methoa
universities WJ
universities an categories of
Questionnaire
respondents an
Correlation (Pl
there is no sign Ogun State. It l'.
diffirent. The sl
and private in. management an
Keywords: PJ Universities
Introduction Nigeriar
can fit in and et
highest educati01 production of hi
UOTRE Bt - Am:


