Journal of Volcanology and Geothermal Research 351 (2018) 115–133
Contents lists available at ScienceDirect
Journal of Volcanology and Geothermal Research
j ourna l homepage: www.e lsev ie r .com/ locate / jvo lgeores
Geological evolution of the Boset-Bericha Volcanic Complex,Main EthiopianRift: 40Ar/39Ar evidence for episodic Pleistocene to Holocene volcanism
Melanie Siegburg a,⁎, Thomas M. Gernon a, Jonathan M. Bull a, Derek Keir a,b, Dan N. Barfod c, Rex N. Taylor a,Bekele Abebe d, Atalay Ayele e
a School of Ocean and Earth Science, National Oceanography Centre Southampton, University of Southampton, European Way, Southampton SO14 3ZH, UKb Dipartimento di Scienze della Terra, Universita degli Studi di Firenze, Florence 50121, Italyc Argon Isotope Facility, Scottish Universities Environmental Research Centre, Rankine Avenue, Scottish Enterprise Technology Park, East Kilbride G75 0QF, UKd Department of Earth Sciences, Addis Ababa University, P.O. Box 1176, Addis Ababa, Ethiopiae Institute of Geophysics, Space Science and Astronomy, Addis Ababa University, Addis Ababa, Ethiopia
Article history:Received 8 October 2017Received in revised form 14 December 2017Accepted 19 December 2017Available online 29 December 2017
TheBoset-BerichaVolcanic Complex (BBVC) is one of the largest stratovolcanoes of the northernMain EthiopianRift(MER). However, very little is known about its eruptive history, despite the fact that approximately 4million peoplelivewithin 100 km of the complex. Here, we combine field observations, morphometric analysis using high-resolu-tion LiDARdata, geochemistry and 40Ar/39Ar geochronology to report thefirst detailed account of the geological evo-lution of the BBVC, with a focus on extensive young lava flows covering the two edifices, Gudda and Bericha. Theselavas exhibit a bimodal composition ranging dominantly from basaltic rift floor lavas and scoria cones, topantelleritic trachytes and rhyolite flows at Gudda, and comenditic rhyolites at Bericha. Further, several intermedi-ate compositions are associated with fissure vents along the Boset-Kone segment that also appear to link the siliciccentres. We divide the BBVC broadly into four main eruptive stages, comprising: (1) early rift floor emplacement,(2) formation of Gudda Volcano within two main cycles, separated by caldera formation, (3) formation of theBericha Volcano, and (4) sporadic fissure eruptions. Our new 40Ar/39Ar geochronology, targeting a representativearray of these flows, provides evidence for episodic activity at the BBVC from ~120 ka to the present-day. Wefind that low-volume mafic episodes are more frequent (~10 ka cyclicity) than felsic episodes (~100 ka cyclicity),but the latter are more voluminous. Over the last ~30 ka, mafic to intermediate fissure activity might havereinvigorated felsic activity (over the last ~16 ka), manifested as peralkaline lava flows and pyroclastic deposits atGudda and Bericha. Felsic episodes have on average a higher eruption rate (2–5/1000 years) and productivity atGudda compared to Bericha (1–2/1000 years). The young age of lavas and current fumarolic activity along thefault system, suggest that the BBVC is still potentially active. Coincident episodic activitywithin the BBVC and at sev-eral rift segments in the MER is observed, and facilitates continental rifting.
Volcanism in Ethiopia is thought to have commenced at ~60 Mawith a strong pulse offlood basalt activity around ~28–31Ma associatedwith the Afar Plume (Hofmann et al., 1997). The flood basalts are ap-proximately coeval with initiation of rifting in the Red Sea and Gulf ofAden, whereas rifting started around 11 Ma in the northern part of theMER (WoldeGabriel et al., 1990; Wolfenden et al., 2004). Time con-straints of Quaternary volcanism within the northern Main EthiopianRift (MER) (Fig. 1) are rare and mainly developed in the context ofearly hominid evolution (Vogel et al., 2006; Morgan and Renne, 2008;Sahle et al., 2013, 2014; Hutchison et al., 2016a). Two main Quaternary
ccess article under
silicic-centre volcanic episodes occurred in the rift between 2 and 1 Mawith basaltic flows followed by ignimbrites, while activity in the last~0.65 Ma was dominated by axial silicic volcanoes and basalts(Chernet et al., 1998; Abebe et al., 2007). Absolute dates of fault activity(WoldeGabriel et al., 1990; Chernet et al., 1998; Boccaletti et al., 1999;Wolfenden et al., 2004) and eruptive phases of Quaternary volcanoesthroughout the northern MER (Harris, 1844; Cole, 1969; Di Paola,1972; Bigazzi et al., 1993; Peccerillo et al., 2003; Williams et al., 2004;Hutchison et al., 2016b; Rapprich et al., 2016) are scattered and at a re-gional scale. Further, detailed age control fromhigh resolution studies toconstrain the evolution of individual volcanic complexes is rare anduntil now only constrained for Aluto Volcano (Hutchison et al.,2016b). Such constraints are vital to understand the role of magmatismwithin individual volcanic complexes though time during continentalrifting.
the CC BY license (http://creativecommons.org/licenses/by/4.0/).
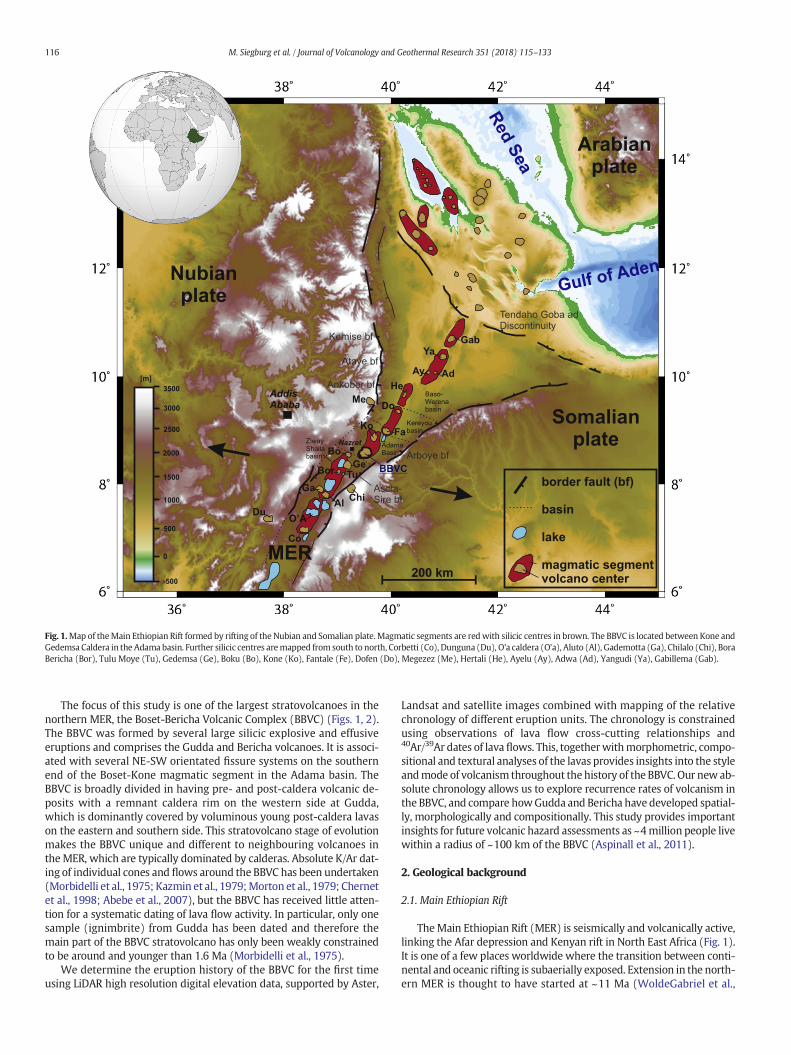
Fig. 1.Map of theMain Ethiopian Rift formed by rifting of the Nubian and Somalian plate.Magmatic segments are redwith silicic centres in brown. The BBVC is located between Kone andGedemsa Caldera in the Adama basin. Further silicic centres aremapped from south to north, Corbetti (Co), Dunguna (Du), O'a caldera (O'a), Aluto (Al), Gademotta (Ga), Chilalo (Chi), BoraBericha (Bor), Tulu Moye (Tu), Gedemsa (Ge), Boku (Bo), Kone (Ko), Fantale (Fe), Dofen (Do), Megezez (Me), Hertali (He), Ayelu (Ay), Adwa (Ad), Yangudi (Ya), Gabillema (Gab).
116 M. Siegburg et al. / Journal of Volcanology and Geothermal Research 351 (2018) 115–133
The focus of this study is one of the largest stratovolcanoes in thenorthern MER, the Boset-Bericha Volcanic Complex (BBVC) (Figs. 1, 2).The BBVC was formed by several large silicic explosive and effusiveeruptions and comprises the Gudda and Bericha volcanoes. It is associ-ated with several NE-SW orientated fissure systems on the southernend of the Boset-Kone magmatic segment in the Adama basin. TheBBVC is broadly divided in having pre- and post-caldera volcanic de-posits with a remnant caldera rim on the western side at Gudda,which is dominantly covered by voluminous young post-caldera lavason the eastern and southern side. This stratovolcano stage of evolutionmakes the BBVC unique and different to neighbouring volcanoes intheMER, which are typically dominated by calderas. Absolute K/Ar dat-ing of individual cones and flows around the BBVC has been undertaken(Morbidelli et al., 1975; Kazmin et al., 1979;Morton et al., 1979; Chernetet al., 1998; Abebe et al., 2007), but the BBVC has received little atten-tion for a systematic dating of lava flow activity. In particular, only onesample (ignimbrite) from Gudda has been dated and therefore themain part of the BBVC stratovolcano has only been weakly constrainedto be around and younger than 1.6 Ma (Morbidelli et al., 1975).
We determine the eruption history of the BBVC for the first timeusing LiDAR high resolution digital elevation data, supported by Aster,
Landsat and satellite images combined with mapping of the relativechronology of different eruption units. The chronology is constrainedusing observations of lava flow cross-cutting relationships and40Ar/39Ar dates of lava flows. This, togetherwithmorphometric, compo-sitional and textural analyses of the lavas provides insights into the styleandmode of volcanism throughout the history of the BBVC. Our new ab-solute chronology allows us to explore recurrence rates of volcanism inthe BBVC, and compare howGudda and Bericha have developed spatial-ly, morphologically and compositionally. This study provides importantinsights for future volcanic hazard assessments as ~4million people livewithin a radius of ~100 km of the BBVC (Aspinall et al., 2011).
2. Geological background
2.1. Main Ethiopian Rift
TheMain Ethiopian Rift (MER) is seismically and volcanically active,linking the Afar depression and Kenyan rift in North East Africa (Fig. 1).It is one of a few places worldwide where the transition between conti-nental and oceanic rifting is subaerially exposed. Extension in the north-ern MER is thought to have started at ~11 Ma (WoldeGabriel et al.,
Fig. 2.Oblique satellite view on the BBVC, looking southwith 3× vertical exaggeration. Eruption phases are indicated and show the differentmorphologies as well as compositions (phaseJ: rhyolite, phase N: obsidian) and flow structures of individual lava flows. Fissures and fractures are along and parallel to the rift axis (red).(Satellite image from Google Earth.)
117M. Siegburg et al. / Journal of Volcanology and Geothermal Research 351 (2018) 115–133
1990;Wolfendenet al., 2004) onNE-striking border faults,whichdefine60–100 km wide grabens (Hayward and Ebinger, 1996). Early riftingwas associated with volcanism, mainly near the rift margins (Chernetet al., 1998; Wolfenden et al., 2004; Rooney et al., 2014). Throughtime, extension and volcanism became focused on the 20-km-wide,right-stepping en-echelon zones of magmatism and faulting (Mohr,1962, 1967; Ebinger and Casey, 2001; Casey et al., 2006; Keir et al.,2006; Corti, 2009), referred to as “magmatic segments”. The morpho-logical expression of these segments is dominated by Quaternary silicicvolcanoes (2.6 Ma to present), with aligned monogenetic cones andNNE striking faults and fissures the rift axis (Ebinger and Casey, 2001)(Fig. 1). Extensionhas been episodic rather than smooth and continuous(Keranen and Klemperer, 2008; Corti, 2009). GPS measurements andplate kinematic modelling suggest extension is still focused on the riftaxis and is directed between 095 to 108° from north and at a rate of4–6 mm per year (Bilham et al., 1999; Fernandes et al., 2004; Bendicket al., 2006; Calais et al., 2006).
The peak in basaltic volcanism (~28 to 31 Ma) (Hofmann et al.,1997; Ukstins et al., 2002; Coulié et al., 2003) was broadly coeval withsilicic ignimbrite eruption in the northern MER around 30.2 Ma(Ukstins et al., 2002). The bimodal episode was followed by formationof large basaltic shield volcanoes of transitional to Na-alkaline basaltsand minor trachytes in the Miocene (Piccirillo et al., 1979). The nextphase of volcanism saw an increase in Miocene activity within theAdama basin including the eruption of Megezez volcano at ~11 Ma(Chernet et al., 1998). Widespread ignimbritic deposits with minorfelsic and mafic lavas were emplaced between 6.6 and 5 Ma(WoldeGabriel et al., 1990; Chernet et al., 1998) at the rift margin inthe central and northern MER. Magmatism became focused in the riftcentre around ~4 Ma to 1 Ma ago (Abebe et al., 2005, 2007; Corti,2009; Beutel et al., 2010), promoting basaltic eruptions along theWonji fault belt (e.g. Mohr, 1971), including the Bofa basalt (3.5 to2.0 Ma (Kazmin et al., 1979); 0.3 Ma (Chernet et al., 1998)). Axial silicic
volcanoes and basalts erupted during the last ~650 ka and are dominat-ed by caldera formation events with peralkaline rhyolitic ignimbritesand pumices, ash fall and minor lava flows. Silicic centres becamefaulted and allowed basalts to erupt through the volcanic edifices andalong their flanks (Abebe et al., 2007). The most recent volcanic activityin the northern MER is recorded by historical accounts of fissure basaltflows at Sabober vent south of Fantale volcano between 1770 and1808 (Harris, 1844), and of theGiano obsidiandomes at TulluMoyeVol-cano (Di Paola, 1972) indicate very recent volcanism in magmaticsegments.
Crustal thickness in this area is constrained fromwide-angle seismicrefraction and from teleseismic receiver functions and decreases from38 km in the southern MER beneath the caldera lakes (Fig. 1), to24 km in the northern MER beneath Fantale volcano (Maguire et al.,2006). The crust of the southeastern plateau is around ~40 km thick,whereas the western plateau of the rift is underlain by ~45–50 kmthick crust including a ~10 to 15 km high-velocity lower crust believedto be lower crustal intrusions (Mackenzie et al., 2005). Previous tomo-graphic models (Bastow et al., 2005; Gallacher et al., 2016) indicatethat current decompression melting occurs in the asthenosphere atdepths of ~70–100 km. Further, Kendall et al. (2005) proposed that par-tial melt beneath the MER rises through dikes that penetrate thethinned lithosphere and continue into the upper crust (Keir et al., 2005).
2.2. Boset-Bericha Volcanic Complex
The BBVC is located in the northern MER at the southern tip of theNNE-SSW orientated Boset-Kone magmatic segment, 20 km east ofAdama/Nazret (Fig. 1). It is one of the largest stratovolcanoes in theMER with a lateral extent of 17 km E-W and 20 km N-S and comprisesthe northern Bericha Volcano (2120m) and the southern Gudda Volca-no (2447 m) (Fig. 2).
118 M. Siegburg et al. / Journal of Volcanology and Geothermal Research 351 (2018) 115–133
The volcanic history of the BBVC was previously documented by DiPaola (1972) and Brotzu et al. (1974, 1980), whose rock sample datawas further analysed by Ronga et al. (2010) and Macdonald et al.(2012). Brotzu et al. (1980) divided the formation of the BBVC intothreemain phases, 1) pre-caldera activity and formation of themain ed-ifice from “oldGuddaVolcano”, 2) caldera formation, 3) post-caldera ac-tivity, which covers the eastern part of the caldera at the Gudda Volcanoand formed the edifice of the Bericha Volcano. The pre-caldera stage inthe Pleistocene includes basaltic lava flows, spatter and cinder cones aswell as domes and composite cones, and ended with the emplacementof ash and pumice fall deposits. This post-dates the formation of “Balchi-formation” (3.5–1.6 Ma) (Morbidelli et al., 1975; Kazmin et al., 1979;Chernet et al., 1998). “Old Gudda Volcano” is thought to have collapsedduring caldera formation on anunknown timescale and post-caldera ac-tivity started with thick trachytic pantelleritic lava flows and intercalat-ed pumiceous deposits some time during the Pleistocene–Holocene, onthe eastern side of the BBVC. Bericha is thought to have formed ataround the same time as Gudda, and involved two central phases anda lateral activity of alkali trachytic rhyolites and comendites (Brotzu etal., 1980). Activity between both edifices is documented asfissure activ-ity sourced from the rift axis and is believed to be younger than thenearby Gara Chisa cone (Morton et al., 1979).
Extension measured by GPS across the Boset-Kone segment (1992–2003), combined with the occurrence of a Mw 5.2 earthquake near theBBVC in 1993 are best explained by dyke intrusion and induced faulting(Bendick et al., 2006). Ongoing seismicity in the EAR is mostly localisedin the rift axis above 15 km depth. At the BBVC, however, seismicity isshallower than 8 km (Mazzarini et al., 2013) suggesting heat flow ishigher than at other volcanoes in the rift (Beutel et al., 2010). Gravityevidence for a 5 km wide body between 2 and 7.5 km depth directlybeneath the BBVC and above the north-western edge of a gabbroicintrusion is interpreted as a distribution of dykes feeding the BBVCfrom a ca. 8 km deep intrusion (Cornwell et al., 2006; Mickus et al.,2007). At 20 km below surface, high conductivities observed bymagnetotellurics suggest a deep zone of partial melt (Whaler andHautot, 2006). Further the occurrence of a caldera and another shal-low conductivity zone (Whaler and Hautot, 2006) suggest a shallowmagma storage reservoir (e.g. Ronga et al., 2010). These observa-tions, combined with fumarolic activity and fresh appearance oflava flows suggest the BBVC is active.
Fig. 3.GISmorphometric tools hillshade, slope and aspect analyses (left to right) were used tomlight source is 315° and 45°, respectively, in the hillshade analysis. The location of the box is sh
3. Methodology
3.1. Field work
Mapping and sampling of the BBVC was undertaken in 2012 and2015. Fieldwork concentrated on mapping lava flows, ground-truthingremote sensing data (identification of boundaries and sources of differ-ent lava flow phases), and mapping of fumarolic activity and fault net-works (Figs. 3, 4). Rock specimens (locations shown in Fig. 4) werecollected for geochemical and textural analysis as well as radiometricdating using the 40Ar/39Ar technique.
3.2. Remote sensing data
Volcano-tectonicmapping at the BBVC integrated observations fromremote sensing, in particular LiDAR elevation data, with field observa-tions. High resolution LiDAR data were collected during a NERC ARSFLiDAR survey over BBVC in November 2012 and have 2 m horizontaland 0.2 m vertical resolution. The LiDAR data (Figs. 3, 4) cover the cen-tral rift from the edge of the southernmost lava flow of Gudda up to thenorthern fissure eruption north of Bericha and are recorded within twostripes (30 km long, 5.8 km and 0.75 km width) parallel to the rift axisand one stripe (26.5 km long, 0.75 kmwidth) across the remnant calde-ra wall of Gudda Volcano. Accuracy of LiDAR data was verified andcorrected with GPS stations for ground control points by the AirborneResearch and Survey Facility. LiDAR data were combined with more re-gional Aster data (Fig. 4), to cover the whole volcanic complex. In addi-tion to the digital elevation data, satellite images and Landsat data(multispectral, panchromatic and pansharpened with different resolu-tion and colour bands) were used to identify lava flows, lithology anddegree of vegetation.
3.3. Remote sensing methodology - mapping
We mapped different phases of the BBVC as well as individual lavaflows, cones and craters, fractures and fissures, topographic featuresand infrastructure around the BBVC. Geographic Information System(GIS) (UTM, WGS 1984 Zone 37 N) morphometric functions were ap-plied to the LiDAR and Aster data, including Slope, Aspect, Curvature
ap lavaflows, cones, craters and tectonic features. The azimuth angle and altitude angle ofown in Figs. 4 and 5.
Fig. 4.Map of the BBVC. Different colours denote eruption phases from old to young (blue to red, as in Fig. 7) showing the temporal and spatial evolution of lava flow emplacement. AerialLiDARdatawere collectedwithin threemain strips over the volcanic edifice and indicate topography andmorphologyof lavaflows and tectonic structures.Most recent activity is indicatedby fumaroles along themain fissure system and the youngest eruption phases (N, P and O, red). The orientation of faults and alignment direction of crater and cones are shown in a lengthweighted rose diagram, and are consistent with the orientations measured from a more regional perspective by Muirhead et al. (2015). Composition of samples subject to bulk rockanalysis are shown using symbols. Contour lines are in intervals of 20 m. Detailed maps of Bericha and Gudda are shown in Figs. 5 and 6.
119M. Siegburg et al. / Journal of Volcanology and Geothermal Research 351 (2018) 115–133
120 M. Siegburg et al. / Journal of Volcanology and Geothermal Research 351 (2018) 115–133
andHillshade for identification of lava flow edges cross-cutting relation-ships between volcanic and tectonic features (Figs. 3, 4).
3.4. Morphometric analyses
Morphometric analysis of lava flows enables an understanding oferuption activity, type and volume. This study utilised LiDAR and Asterremote sensing data to obtain length, thickness, area and volume foreach eruptive phase. Length was measured by tracing the flow pathfrom the source to the end of the flow (error ± 50–100 m). The thick-ness T is determined by measuring the difference in elevation of thelava flow edge and ground elevation. Volume of the eruption phasesand the edifices of the BBVCwere estimated byusing aGenericMappingTools (GMT) volume calculation tool developed by Lara Kalkins de-scribed inNomikou et al. (2014). This script calculates the difference be-tween the surface morphology and an artificial smoothed surface foreach exposed eruption phase polygon. For all individual lava flowsand in particular for subhorizontal eruption phases volumes are esti-mated by the product of area and thickness assuming that thickness atthe edge of the lava flow is representative of the entire lava flow.
3.5. Geochemical analyses
Petrographic observation and analyses of feldspar were performedwith a polarising microscope and a Leo 1450VP scanning electron mi-croscope (SEM)with anOxford Instruments EDS detector at theUniver-sity of Southampton. For whole rock analyses, 41 selected rock sampleswere crushed, soaked in water for 3–6 h and dried in 60 °C for 12 h. Thesamples were ground in agate to avoid contamination. For each sample,the Loss on Ignition (LOI) has been determined by weighing before andafter 100 °C and 750 °C (felsic rocks) or 1000 °C (mafic rocks). Glassdiscs for analysing major elements were prepared with lithiumtetraborate grains on the propane-oxygen gas Vulcan Fusion instru-ment. Whole rock analyses were undertaken with the Philips MagiXPro Xray fluorescence spectrometer at the University of Southampton.Analytical precision and accuracy were monitored by standards.
3.6. Geochronology
An absolute timescale for the eruption history of the BBVC is provid-ed by 40Ar/39Ar dating of 16 feldspar and groundmass separates of lavaflows (Figs. 4–7, Table 1, A.1, A.2). Samples for 40Ar/39Ar datingwere se-lected to achieve a representative geographic and compositional distri-bution (Fig. 4). Groundmass samples were screened for potassiumcontent and degree of alteration. Feldspar separates were selectedbased on potassium content, low or negligible degree of alteration, crys-tal morphology (tendency towards euhedral shapes) and lack of inclu-sions. Sample preparation took place at the NERC Argon IsotopeFacility (AIF) hosted by the Scottish Universities Environmental Re-search Centre (SUERC) in East Kilbride. Samples were pulverized in ajaw crusher, sieved and washed to obtain a 250–500 μm fraction andleached in 25% HNO3 to remove altered phases. Feldspars were separat-ed using magnetic Frantz machine and leached ultrasonically with 5%HF for 3–5 min (some required several runs) to remove adhering glassand groundmass, followed by repeated rinsing in distilled water anddrying at T b 100 °C. Handpicking under a binocularmicroscope provid-ed 1 g of clean and inclusion-free feldspar and groundmass separates foreach sample.
4. Results
4.1. Geological map of the BBVC – relative and absolute chronology of lavaflows
Based on the integration of high resolution DEM (LiDAR, Aster), sat-ellite, aerial and Landsat images, field observations and geochemical
data, the BBVC can be divided into four main eruptive stages: (1) riftfloor basalts, (2) formation of Gudda Volcano in two main cycles(“old” Gudda and Gudda), between which caldera formation occurred,(3) the formation of Bericha Volcano, and, (4) sporadic fissure eruptionsrecurring between those stages. Stages (1) and (4), described togetheras rift floor activity, are most likely formed by fissure eruption, and aredifficult to differentiate as individual eruption events.
These four broad stages are further differentiated into 16 eruptionphases (A to P) (Figs. 4–6, 8, 9), defined as several discrete eruptionsof the same style that are spatially and temporally clustered. In total,~128 discrete lava flows (excluding rift floor) were identified andassigned to an individual eruption phase based on a combination oferuption type, composition, morphology, morphometry and degree ofvegetation andweathering. A relative chronology of the eruption phaseswas determined primarily by cross-cutting relationships, in addition theabove criteria. The relative chronology was combined with an absolutechronological framework provided by 40Ar/39Ar dating (Table 1, Fig.7). We expect phases with many lava flows to have a greater agerange. The synthesis of the eruption history of the BBVC is describedin the following section based on the fourmain eruption stages, startingwith the earliest.
4.1.1. Rift floor and fissure eruptionsFissure eruptions occur episodically before and between the main
eruptions of Gudda and Bericha, showing evidence for reactivation onseveral occasions, and are likely the source of the rift floor basalt(phase A1, A2), underlying the main BBVC. Fissures are characterizedby tectonic fractures and chains of cones, craters and domes (phaseA0, C, H), dominantly situated along the Boset-Kone segment (Fig. 4).Fissure lava flows with distinct sources are north and northeast ofBericha (phases F, C, I), whereas phases G and P are located betweenthe Gudda and Bericha edifices (Figs. 4, 5, 8, 9).
4.1.1.1. Rift floor basalts (phase A1, A2 ~300 ka, D 104 ± 17 ka to 29.0± 8.1 ka). The oldest rocks exposed, phase A, occur as rift basalts, pre-date the main BBVC edifice and are exposed north (A1) and south(A2) of the BBVC (Figs. 4, 7-9), with the southern basalt belonging tothe Bofa Basalt Formation (Kazmin et al., 1979; Brotzu et al., 1980,1981; Chernet et al., 1998). Mapping of these rift floor basalts is chal-lenging due to Quaternary cover, but the total thickness of both phasesis estimated to be ~10 ± 5 m. The exposed northern part (phase A1~228 km2) is assumed to be sourced from fissures of the Kone segmentand is buried by flows of the Boset segment north of the BBVC, whereasa potential source for the mapped Bofa basalt (phase A2 ~98 km2) is acovered fissure beneath or south of the BBVC. The Bofa Basalt is elevated~100 m above the northern basalt, which can only be partly explainedby the topographic trend of decreasing elevation towards Afar (Fig. 1).Lava flows from Gudda Volcano clearly post-date these rift floor basalts,most immediately by phase B (Fig. 4). After volcanism associated withGudda had started, a further phase of rift floor basalt volcanism oc-curred (phase D ~153 km2) to the north-east and south-west, likelysourced by reactivation of the Kone segment and Sodore lavas, respec-tively. The age range of phase D can be constrained by cross-cutting re-lations and morphology to 104 ± 17 ka to 29.0 ± 8.1 ka (Figs. 4, 8, 9).
4.1.1.2. Cones, domes and craters on the BBVC segment (phase A0, C 104± 17 ka, H 12 ± 18 ka). Cones and craters are aligned along fissureson the BBVC and Kone segment north of the BBVC edifice, whereassouthwest of the BBVC there is less clear alignment along the tectonicfabric (Figs. 3, 4, 8, 9). Based on 40Ar/39Ar dating, at least two differentphases, C (~45 km2; 104 ± 17 ka, possible source for the basaltic lavaflows C01–C03 (Fig. 5)) and H (~2.3 km2; 12 ± 18 ka) along the conechain on the BBVC segment north of the BBVC, can be identified, andsuggest reactivation of this fissure on several occasions. Dome struc-tures (phase A0, ~10 km2), mapped on the northern BBVC segmentand west of Bericha edifice, likely pre-date the basaltic rift floor.
Fig. 5.Map of Bericha Volcano and fissure eruption between both volcanic centres of the BBVC with detailed lava flow chronology within eruptive phases. Colours and symbols are thesame as on the map of the whole edifice of the BBVC (Fig. 4). 40Ar/39Ar ages in ka indicated with the white square and relative phase indicated by letter. Contour lines are in intervalsof 20 m.
121M. Siegburg et al. / Journal of Volcanology and Geothermal Research 351 (2018) 115–133
Morphology of cones, sources and topographic steps of the north east-ern slope of Bericha Volcano andonGudda (phaseO, K, L) suggest a con-tinuation of the cone chain of the BBVC segment below and near thesummit of the BBVC (Figs. 4, 5, 8, 9).
4.1.1.3. Phase F (30 ± 39 ka). Fissure eruptions of phase F (36 km2; atleast six lava flows; flow F01 30 ± 39 ka) took place parallel to, but off-set from, the main rift axis, and are most likely sourced from severaltruncated NNE-SSW fissures north of the BBVC or from the axial fissurepre-dating Bericha (Figs. 4, 7, 8, 9). This phase formed between the riftfloor basalts (phase A, D) and Bericha (phase J). The eastern lava flows(F06–F07) pre-date phase M (Fig. 5). The dated flow is partly coveredby the oldest lavas of phase G.
4.1.1.4. Phase I (N14± 3.8 ka). Phase I (4 km2; five lava flows (I00–I04))occurs to the north-east of Bericha (Figs. 4, 5, 8, 9), covering the rift axis(I00, I01, I04), as well as flowing towards the west (I03) and northeast(I02) from the fissure. These lava flows post-date the basalts and cindercones of rift floor activity belonging to phase C (104 ± 17 ka) and pre-date phase J and phase N of Bericha Volcano. Thus, their age can beconstrained to be between 104 ± 17 ka and 14 ± 3.8 ka.
4.1.1.5. Phase G (29 ± 8.1 ka) and P (13 ± 8.3 ka west, 4.2 ± 3.2 ka east).The largest exposed fissure eruptions occurred along the central NE-SWtrending rift axis between Bericha and Gudda (Figs. 4, 5, 8, 9). This partof the rift axis was tectonically and magmatically reactivated on at leasttwo occasions (phase G, P). The lavas flowed towards the southeast andnorthwest. During phase G (28 km2; 3 mafic lava flows; flow G01 29±8.1 ka) the oldest flow (G01) moved towards the southeast and wasfollowed by alternating flows towards both sides of the fissure. Cross-cutting relations indicate that both phases (G and P) post-date thephase B and E on the eastern side and phase F phase on the westernside. The older flows in phase G on both sides of the fissure (G00–G02) (Figs. 4, 5) appear to pre-date the first Bericha phase (J). In thelast eruptive phase P (9 km2; 2 lava flows; flow P02 west 13 ± 8.3 kaandflowP01 east 4.2±3.2 ka)fissure lavas post-date Bericha's eruptivephases J and M and have characteristically dark (fresh) appearance insatellite images. Different compositions of lavas in phase P indicate indi-vidual eruptions even if absolute ages are within error.
4.1.2. Gudda VolcanoLava flows can be subdivided into at least five different eruptive
phases (B, E, K, L, O). Multiple eruption centres, including cones, craters,
Fig. 6.Map of lava flows of post-caldera phases at Gudda Volcanowith detailed lavaflow chronologywithin eruptive phases. Colours and symbols are the same as on themap of thewholeedifice of the BBVC (Fig. 4). 40Ar/39Ar ages in ka indicatedwith the white square and relative phase indicated by letter. Contour lines are in intervals of 20m. Samples shown on the right-hand edge of the map were taken at the edge of the lava flow(off the map) in which the symbol is shown.
122 M. Siegburg et al. / Journal of Volcanology and Geothermal Research 351 (2018) 115–133
fissures and a remnant caldera are aligned along the main rift segmentat the summit of Gudda (Figs. 3, 4). Based on distribution, flow directionand cross-cutting relations of lava flows, Gudda can be divided into pre-caldera activity on the western side (phase B) and post-caldera activityon the southern, central and eastern sides (phase E, K, L, O).
4.1.2.1. Phase B (119.8 ± 6.1 ka). Phase B (~71 km2; at least 6 lava andpumice – lapilli deposits; B06 - 119.8 ± 6.1 ka) is mainly exposed onthe western side of Gudda and represents a part of “old” Gudda edifice.It either pre-dates or formed during the youngest caldera-formingevent, and constituent deposits appear to have been truncated by theremnant caldera rim to the west (Figs. 4, 6–9). Based on the flow direc-tion of the post-caldera lava flows (phase K, O), the eastern part of thecaldera rim is assumed to be on the central rift axis of Gudda Volcano,or slightly west of it, covered by phases K and O. This unit is strongly af-fected by erosion and reworking. Our analysis suggests that the originalcaldera diameter is ca. 4 km (Figs. 4, 8).
4.1.2.2. Phase E (119.8 ± 6.1 and 29.0 ± 8.1 ka). Phase E (~43 km2) con-tains 9 thick lavas that flowed from the central rift segment on Gudda
towards the east (Figs. 4, 6, 9). A possible extension of this unit couldunderlie lava flows of Bericha. The eruption age range is constrainedto be between 119.8 ± 6.1 and 29.0 ± 8.1 ka, as it post-dates phase Band pre-dates a fissure eruption NE of it and lava flows of phases G, Jand P.
4.1.2.3. Phase K (6.4± 5.3 ka). Phase K (55 km2; 28 lava flows; flowKs106.4 ± 5.3 ka) represents post-caldera activity and is mainly exposed onthe southern side (Ks) and central part of Gudda Volcano (Kc)with lavaflows sourced frommultiple cones and craters along the rift axis (Figs. 4,6–9). The central part pre-dates the fissure eruption of phase O andpost-dates phase B, as it flowed from the rift axis down into the calderaand covers the eastern caldera rim and floor. Based on cross-cutting re-lations, the southern part of phase K post-dates (6.4 ± 5.3 ka) phase Band pre-dates lava flows of phase L and O. Lava flows of the centralpart of this phase (~13 km2, 8 lava flows Kc1-Kc9) are significantly af-fected by erosion compared to the southern part (Ks) and lava flowsof phase E. The southern part of phase K (~42 km2, at least 21 differentlava flows) has multiple sources along the main fracture system on thesouthern edifice slope.
sample 85
0 20 40 60 80 100
-0.4
-0.2
0
0.2
0.4
0.6
0.8
App
aren
tAge
(Ma)
0.1198 ± 0.0045 Ma (3.8%, MSWD = 1.61, p = 0.13, n = 8)
phase B
sample 109
0 20 40 60 80 100
-0.4
-0.2
0
0.2
0.4
0.6
0.8
App
aren
tAge
(Ma)
0.0140 ± 0.0037 Ma (26.4%, MSWD = 1.08, p = 0.37, n = 9)
phase J
sample 93-2
0 20 40 60 80 100
-0.4
-0.2
0
0.2
0.4
0.6
0.8
App
aren
tAge
(Ma)
0.0064 ± 0.0053 Ma (82.8%, MSWD = 1.13, p = 0.34, n = 9)
phase K
Gud
da V
olca
noB
eric
ha V
olca
noPlateau Age
inte
rmed
iate
fiss
ure
“old
” G
udda
Vol
cano
Isochron
0 20 40 60 80 100
-0.4
-0.2
0
0.2
0.4
0.6
0.8
App
aren
tAge
(Ma)
0.040 ± 0.065 Ma* (162.5%, MSWD = 1.99, p = 0.03, n = 11)
Cumulative % 39Ar Released
0.022 ± 0.019 Ma (86.4%, MSWD = 1.60, p = 0.09, n = 12)
composite 0.030 ± 0.039sample WE2-1, phase FWE2-2
sample 85
0 0.20 0.40 0.60 0.80 1.00 1.200
0.0008
0.0016
0.0024
0.0032
B
C
D
E
F
G
H
I
J
K
LM
N
age = 0.1235 ± 0.0063 Ma (5.1%)
36A
r/40
Ar
sample 93-2
0 0.8 1.6 2.4 3.2 4.0 4.80
0.0008
0.0016
0.0024
0.0032
B
D
F
G
H
IJ K
L
M
N
age = 0.012 ± 0.015 Ma (131.7%)
36A
r/40
Ar
sample 109
0 0.4 0.8 1.2 1.6 2.0 2.4 2.80
0.0008
0.0016
0.0024
0.0032
B
C
D
EFG H I
J K LM
N
age = 0.0137 ± 0.0075 Ma (55.1%)
36A
r/40A
r
age = 0.044 ± 0.048 Ma (110.8%)
WE2-2sample WE2-1,
0 0.020 0.040 0.060 0.080 0.1000
0.0008
0.0016
0.0024
0.0032
B
C
D
E FG HI
JKL
M
N
age =0.043 ± 0.042 Ma (96.5%)
39Ar/ 40 Ar
36A
r/40
Ar
Fig. 7. Representative 40Ar/39Ar step-heating spectra plateau and isochron ages here shown for 4 samples from “old”Gudda, Gudda, Bericha Volcano and the fissure between both edificesas an example of high quality results. Error increase with decreasing age is due to the lower resolution for younger samples as well as the lower potassium content in mafic lavas, but allanalysed samples give a representative age for their eruption phases.
123M. Siegburg et al. / Journal of Volcanology and Geothermal Research 351 (2018) 115–133
Table 140Ar/39Ar analyses of 16 lava flows of the BBVC.
Run c: composite of 2–3 runs; note that bold characters signify plateau ages from composite runs. Nucleogenic production ratios, isotopic constants, decay rates and plateau age criteria aredescribed in Appendix A.1. Raw data for individual runs are listed in complete table in Appendix A.2.
124 M. Siegburg et al. / Journal of Volcanology and Geothermal Research 351 (2018) 115–133
4.1.2.4. Phase L (8.9 ± 3.4 ka). Phase L (33 km2, 12 flows, L00–L13; flowL08 8.9 ± 3.4 ka) consists of a radial chain of ten exposed craters andcones on the south-eastern slope of Gudda (Figs. 4, 6–9). Three lavaflows within this phase (L04, L11, L13) are sourced by themain rift seg-ment on top of Gudda. The lava flows of this phase cover and obscurethe lava flows of phase K and A2 in the south-eastern part, as well asphase E in the eastern part. Compared to the dated lava flow of phaseK, the lava of phase L is within error of the absolute age but is clearlyyounger based on the relative chronology of eruption. These observa-tions suggest that phase K (southern part) and L erupted temporally rel-atively close to each other and the possibility of broadly coeval activitycannot be excluded.
4.1.2.5. Phase O (3.3 ± 2.4 ka). The third and youngest phase of Gudda(~4 km2, flow O12 3.3 ± 2.4 ka) was erupted from craters and pumicecones along the rift axis on the central edifice of Gudda, closer to the fis-sure lava flows of phases G and P (Figs. 3–5, 8, 9). The flows constituteobsidian lava and are relatively small in comparison to other obsidianflows from the BBVC. Some of them infill the crater, while others flowdown the crater walls. These flows post-date phase K. The relation be-tween this unit and thefissure lava of phase P is unclear as although jux-taposed they do not crosscut. Absolute dating shows similar ages to
ig. 8. Chronology of eruption phases at the BBVC based on relative cross-cutting relations of lava flows and absolute 40Ar/39Ar ages measuredwithin this study. Phase A is divided into A0r rhyolitic domes, A1 for thenorthern riftfloor basalt andA2 for the southern riftfloor basalt, based on existing K/Ar ages (Chernet et al., 1998). Age ranges for phaseD, E, I are constrainedy relative chronology.
Ffob
phase P and N. It is possible that obsidian lava flows on the summit ofGudda's rift axis, mapped here as phase K, may represent an earlierflow of phase O.
4.1.3. Bericha VolcanoBericha is composed of at least 21 lava flows, that erupted during
three main exposed phases (J, M, N) (Figs. 4, 5, 7–9). In comparison toGudda, Bericha's lavaflows are distributed radially fromonemain cratersource on the top of the edifice and only a few side vents on the north-ern and north-eastern slope. Relative chronology is determined bycross-cutting relations of Bericha's lava flows with other eruptivephases on the south-eastern and south-western slope of the Berichaedifice.
4.1.3.1. Phase J (14.0± 3.8 ka). Bericha's first eruption phase J (~19 km2;five thick rhyolitic lava flows; flow J04 14.0 ± 3.8 ka) occurred on thewestern (flows J00–J02) and eastern slopes (flows J03, J04) of Bericha.Phase J post-dates phase B and G, based on cross-cutting relations onthe western side of the edifice; phases E and G based on cross-cuttingrelations on the eastern side of the edifice; and phases C, F and I basedon cross-cutting relations on the northern side of the Bericha edifice.The upper relative age limit can only be determined by cross-cutting
125M. Siegburg et al. / Journal of Volcanology and Geothermal Research 351 (2018) 115–133
Fig. 9. Schematic diagram of magmatic activity at the BBVC classified into activity at fissures, Bericha Volcano, Gudda Volcano and on the rift floor. Error bars for absolute 40Ar/39Ar dating(solid) and constrained ages (dotted) are shown. Colours represent age likelihood based on absolute and relative chronology, with stronger colour indicating the most likely age range.Letters refer to eruption phases shown in Fig. 8.
126 M. Siegburg et al. / Journal of Volcanology and Geothermal Research 351 (2018) 115–133
relations with younger phases at Bericha (phases M & N). Thus, the ageof phase J can be constrained to 29.0 ± 8.1 b phase J b 4.5 ± 4.1 ka,which is consistent with the 40Ar/39Ar age determination of flow J04(Figs. 4, 5, 7–9).
4.1.3.2. Phase M. The second eruption phase M (8 km2; 13 lava flows;flow M03 1.2 ± 3.4 ka, flow M08 3.8 ± 4.7 ka, flow M10 4.5 ± 4.1 ka)in the northern and southern part of Bericha was most likely sourcedfrom different parts of the fissure on the rift axis running through themiddle of Bericha (Figs. 4, 5, 8, 9). Cross-cutting relations demonstratethat the northern part clearly post-dates phase J and pre-dates phase N.The southern part may have erupted either during or after phase J, dueto similar morphology and composition of at least two flows, or arebroadly coeval to the northern part on the basis of similar absolute ages.
4.1.3.3. Phase N. Lava flows of the third eruptive phase N (~12 km2; fourlava flows; flow N02 4.9 ± 4.0 ka; flow N04 13.3 ± 3.3 ka) of Berichaoverlay phase M and J, mainly in the north-eastern part of Bericha(Figs. 4, 5, 8, 9). The youngest lava flows (N03-N04) are sourced from
Fig. 10. Alkali verses SiO2 diagram after Le Bas et al. (1986) shows a bimodal distributionfrom basalt towards trachyte (Gudda Volcano) and rhyolite (Bericha Volcano), which alsoincludes one trachyte sample. Intermediate lavas are rare and mainly sourced by fissureeruption north and south of Bericha Volcano. Data from previous studies at the BBVC(grey diamonds) (Brotzu et al., 1974, 1980, 1981; Ronga et al., 2010; Macdonald et al.,2012) are consistent with this study.
the main crater, whereas lava flows N01 and N02 are sourced fromside vents, aligned NE-SW and younging from lava flows of phase I to-wards the centre of Bericha. The youngest lava flow of Bericha (N04),determined by relative chronology and clear flow structures, flowedfrom the centre to north-north-east on top of lava flows (M03, M04,M07) of phase M.
4.2. Geochemistry of lava flows
4.2.1. Major element chemistryOverall major element variation of the study area follows a basalt –
trachyte – rhyolite pathway in terms of SiO2 versus total alkali content(Le Bas et al., 1986) (Fig. 10). Specifically the BBVC has a bimodal com-position ranging from basalt (rift floor basalts and scoria cones, phasesA, C, D) to trachyte (Gudda phases E, K, L) and rhyolite (Gudda phaseO; Bericha phases J, M, N) (Fig. 10, Table 2). Intermediate rocks arefound in the associatedfissure vents (phases F, G, I, P). Thefissure north-east of Bericha (phase I) (Fig. 4) is most evolvedwith a trachyte compo-sition (62.2 b SiO2 N 64.4 wt%), and the fissure eruptions (phase F) aretrachy-basaltic to basaltic trachy-andesitic (49.8 b SiO2 N 55.9 wt%).The fissure between Gudda and Bericha is most variable with a
Table 2Average whole rock compositions (wt%) and phenocryst assemblage (%) as examples forthe main compositions.
Fig. 11. Classification of peralkaline rocks after MacDonald (1974). Bericha has acomenditic composition and Gudda Volcano is mainly pantelleritic, whereas the samplesof “old” Gudda Volcano has the highest FeO content. Symbols are explained in Fig. 10.
127M. Siegburg et al. / Journal of Volcanology and Geothermal Research 351 (2018) 115–133
trachy-basaltic composition (phase P, west), basaltic trachy-andesiteflow (phase G), and in places trachyte (phase P, east) (49.4 b SiO2
N 63.7 wt%). Lavas from Gudda and Bericha are all peralkaline, definedby a molecular excess of Na2O and K2O over Al2O3 (i.e. peralkaline/agpaitic index) of 1.0–1.8 for Gudda, 1.0–1.1 for Bericha. Peralkalinelavas of Bericha are comendites (3.8–4.8 wt% FeOtot, 13.2–15.5 wt%Al2O3), whereas Gudda's lavas have higher FeOtot (7.3–10.5 wt%),Na2O, MnO and TiO2 and lower Al2O3 (8.8–13.6 wt%) and K2O, and arepantellerites (Fig. 11). Typical compositions and a petrological summaryof the BBVC lavas are shown in Table 2.
4.2.2. Whole rock chemistry over timeThe compositional trends over time indicate bimodal (mafic – felsic)
activity at the BBVC from 300 ka to present day with an apparent longterm (regular) recurrent activity ofmafic – intermediate lavas and a clus-tered distribution of felsic activity around 120 ka and in the last 16 ka(Figs. 9, 12). Intermediate fissure eruptions occur as a transitional phasebefore and during Gudda's and Bericha's felsic episodes in the last~30 ka. The transitional phase shows a general trend frommafic towardsfelsic with increasing SiO2 and alkali content and decreasing CaO andFe2O3. Al2O3 shows a smooth decreasing trend over time. Lavas ofGudda differ most with lower Al2O3 and higher Fe2O3 contents (Fig. 12).
4.2.3. Feldspar analyses for 40Ar/39Ar datingFeldspars are represented as plagioclases from bytownite to oligo-
clase up to anorthoclases, depending on whole-rock compositions. Ba-saltic rock samples contain plagioclase feldspars with a bytownitecomposition and an andesine to labradorite composition. Rhyolites con-tain feldspars, mainly anorthoclase and, subordinately, sanidine pheno-crysts with a composition of Ab70–79, An0–2 and Or20–29. Somephenocrysts exhibit a transitional composition from orthoclase toanorthoclase. Anorthoclase or sanidine bearing samples were targetedfor 40Ar/39Ar dating as these phases are especially amenable to high pre-cision dating. In contrast, holocrystalline groundmass fragments wereused for dating basaltic rocks as these tended to be more potassic thanassociated plagioclase phenocrysts.
4.3. Morphometric analyses of lava flows
Morphometric analysis of lava flowswas undertaken to characterizethe type, size, geometry and volume of individual lava flows (Table 3)and for parent eruptive phases (Table 4, Fig. 13). Morphometric proper-ties of individual lavas are presented in Table 4, differentiated by com-position of mafic (phase A1, A2, C, D, H), intermediate (trachy-basalt
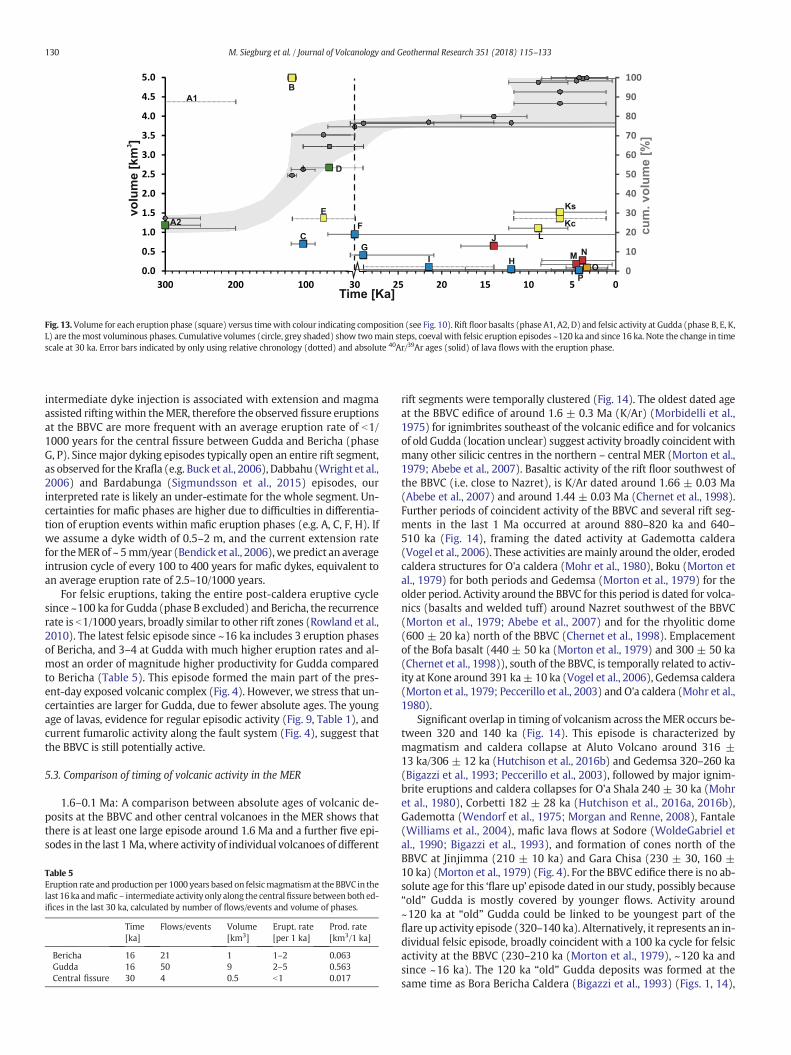
to trachyte, phase F, G, I, P) and felsic (trachyte-rhyolite, phase B, E, J–O) lavas. Lava flow thickness increases with SiO2 and alkali contentfrom ~2 m (46 wt% SiO2) to ~160 m (71 wt% SiO2) (Table 3). Bothmafic and felsic flows are characterized by a'a lavas. Felsic lava flowsthicken at the flow front, whereas mafic flows thin at the edges. Thethickest lava flows are rhyolitic flows of Bericha (phase J, ~160 m) and“old” Gudda deposits (phase B, ~120 m). Gudda's obsidian lava flowsrepresent the thinnest felsic lava flows (phaseO, 5–13m). Composition,viscosity and cooling rate control the length of lava flows (Table 3),however for themore felsic lava flows of the BBVC, the flow size, topog-raphy and flow dynamics become more important factors. Areas foreach eruption phase range between 3 and 71 km2 for lava flow phasesand between 45 and 228 km2 for rift floor basaltic phases (Table 4).Fig. 13 illustrates a similar pattern of area and volume of each eruptivephase verses composition and time. The largest volume (3–5 km3)and area (71–228 km2) of eruptive phases are associated with themafic northern rift floor basalts (phase A1, D), and the felsic exposedparts of “old” Gudda ~120 ka (phase B) and represent multiple events.Bericha's three eruption phases (J, M, N) together have a similar volume(4–5% of total volume) as one phase of Gudda. The Bericha edifice rep-resents ~10% (volume and area) of the total BBVC edifice (Table 4).
5. Discussion
Our new absolute lava flow chronology, in conjunctionwith compo-sitional and morphometric constraints, provide detailed new insightsinto the geological evolution of the BBVC, in particular the episodic dis-tribution of eruptive activity over the past ~120 ka.
5.1. Compositional evolution
Since 120 ka, magmatism at the BBVC has been bimodal with recur-rent mafic lavas and clustered felsic lava episodes (at 120 ka, and since16 ka). We observe a general trend from dominantly mafic eruptionsalong a fissure system with minor felsic activity (from 100 to 30 ka),to dominantly felsic activity at Gudda and Bericha with sporadic fissureeruptions of intermediate compositions (from 30 ka to present) (Figs. 9,12). This bimodal magmatism has been described in previous studies ofthe BBVC (Di Paola, 1972; Brotzu et al., 1974, 1980, 1981; Ronga et al.,2010; Macdonald et al., 2012), as well as at other Ethiopian rift volca-noes such as Gedemsa (Peccerillo et al., 2003), Fantale (Gibson, 1974)and others (Trua et al., 1999). Felsic compositions at the BBVC can befurther subdivided into dominantly pantelleritic trachytes for post-cal-dera lavas at Gudda (phase E, K, L) and dominantly comenditic rhyolitefor Bericha (phase J, M, N). These distinct differences support the pres-ence of independent felsic magma reservoirs beneath Gudda andBericha. Geochemical differences could be explained by additional feld-spar crystallisation (e.g. Brotzu et al., 1980), due to low pressures in ashallow magma chamber, or by the presence of hydrous magmas atGudda Volcano (e.g. Sisson and Grove, 1993; Blundy and Cashman,2001).
Large volume eruptive phases (N1.0–0.5 km3) generally constitutethick felsic flows of Gudda (phase B, E, K, L) and Bericha (phase J), butalso include early rift floor basalts (phase A2, D), which cover largeareas (Figs. 4, 13) and likely represent multiple eruptive events. Thelavas included in this study have a total volume equating to ~25–30%(Table 4, excluding rift floor basalts) of the entire BBVC edifice, indicat-ing amore extensive history of volcanism. Further, tephra layers aroundthe BBVC, pumice cones (phase O) and the remnant caldera rim suggestthat lava flow emplacement are associated with explosive eruptions.The prevalence of voluminous felsic lavas and absence of mafic lavason Bericha andGudda can be explained by the inability ofmaficmagmasto dynamically ascend through a relatively low-density felsic reservoir(i.e. a mafic ‘shadow zone’ (Walker, 1999)).
Amajor finding of our study is that the BBVC fissure systemhas beenepisodically active, with considerable geochemical variation along the
45
50
55
60
65
70
45
50
55
60
65
70
0
2
4
6
8
10
12
14
0
2
4
6
8
10
12
14
8
10
12
14
16
18
20
8
10
12
14
16
18
20
3
5
7
9
11
13
15
3
5
7
9
11
13
15
2
4
6
8
10
12
01002003002
4
6
8
10
12
051015202530
Na
O +
KO
22
FeO 2
3A
lO 23
SiO
2C
aO
Time [ka]
Fig. 12. Compositional evolution of the BBVC lava flows over time show a bimodal distribution with recurrent mafic activity and clustered felsic activity. Note the scale used on the x-axischanges at 30 ka. Colours indicate sample location and are the same as in Fig. 10. Error bars indicate error of absolute ages (black line) and relative range of non-dated lavas (grey dashedline) for BBVC lavas of this study (circle) and age constraints from Chernet et al. (1998) (square) and Morton et al. (1979) (diamond).
128 M. Siegburg et al. / Journal of Volcanology and Geothermal Research 351 (2018) 115–133
rift segment over time. The central fissure systems between both edi-fices (Figs. 4, 5) were reactivated on several occasions over the last30 ka, with compositions changing from basaltic trachy-andesite
(phase G) to trachy-basalt (phase P west) and trachyte (phase P east).The fissure system northeast of Bericha (Figs. 4, 5) changed in composi-tion from basaltic (phase C, H) to trachytic (phase I) over the last
Table 3Morphometric analyses of individual lava flows including thickness at the flow edge, length, area and volumes (based on estimated thickness and area measurements).
SiO2 [wt%] Thickness [m] Length [km] Area [km2] Volume [km3]
Range Average Range Average Range Average Range Average
129M. Siegburg et al. / Journal of Volcanology and Geothermal Research 351 (2018) 115–133
~104 ka. Further,fissure lavas belonging to phase I have a comenditic af-finity, making these more likely to be a felsic outward fissure propaga-tion from the Bericha plumbing system (Fig. 11). The composition offissures north of Bericha (Fig. 4) varies from rhyolite (phase A0), to ba-salt (phase A1, C, H), trachy-basalt and trachy-andesite (phase F) withtime (i.e. from 600 to 30 ka). A fissure eruption near the summit ofGudda changed composition from pantellerite trachyte to pantelleriterhyolite (phase O; Figs. 4, 5) within the last 10 ka, with geochemicaltrends consistent with fractional crystallisation (Figs. 10–12). On thewhole, the observed spatio-temporal geochemical changes could be re-lated to magmatic evolution, changing sources and/or growth of frac-ture systems tapping different magma storage levels or the uppermantle (Boccaletti et al., 1999). Further geochemical studies are ongo-ing to determine the contrasting pre-eruptive magmatic processes ofBericha and Gudda (Siegburg et al., in prep).
5.2. Episodic activity at the BBVC
The 40Ar/39Ar ages of lava flows reported in our study are generallyconsistent with the relative eruption chronology. In particular, absolutedated lava flows within the last felsic episode (since 16 ka), are mainlywithin error of each other (Fig. 9) and chronology is improved by ob-served field relationships. The only significant difference between ourrelative chronology and absolute 40Ar/39Ar ages are found in samples116 (phase P) and sample 64 (phaseN), where the absolute ages appearto be older than those interpreted from our relative chronology.Groundmass of sample 116 is dated in three runs (Table 1), but two ofthree runs are within error of the relative chronology. Although not ap-parent in the inverse isochron ages (Table 1; Appendix A.2), the third,
Table 4Morphometric analyses summarised for each eruption phase. *Ages for phase A are K-Arages measured by Chernet et al. (1998), all other are 40Ar/39Ar ages from this study. Forquoted values in text we used preferentially eruption phase volumes calculated by GMTand volume estimation for sub-horizontal eruption phases.
older aliquot may be affected by subtle excess argon or xenocryst con-tamination. Feldspars in sample 64 show intergrowth textures andxenocrystic characteristics. We interpret the anomalously old apparentage for this sample as being affected by xenocrystic uptake immediatelyprior to eruption (e.g. Singer et al., 1998; Gardner et al., 2002).
Dated felsic and mafic activity around the BBVC occurred in twomain episodes around ~1.6–1.4 Ma (Morbidelli et al., 1975; Chernet etal., 1998; Abebe et al., 2007) and b650 ka (Morton et al., 1979;Chernet et al., 1998). Additional mafic phases were very active during~440–300 ka (Morton et al., 1979; Chernet et al., 1998) and ~104 ka,and formed extensive underlying rift floor basalts as well as basalticcones. Later fissure eruptions at the BBVC are mafic to intermediateand likely represent reactivation of fissure phases with a ~10 ka fre-quency, recurring at ~30 ka (phases F, G), ~12 ka (phase H) and in thelast ~6 ka (phase P) (Fig. 9). Further felsic activity at the BBVC occurredbetween the mafic episodes at ~840 ka, ~230–210 ka and between160 ka (Morton et al., 1979) and ~119 ka (“old” Gudda). The last felsicepisode is b16 ka (14 ka, 8 ka, b5 ka) (Fig. 9), and represents large vol-ume post-caldera activity at Gudda Volcano and formation of BerichaVolcano. The 3 main felsic episodes over the last 230 ka (~230 ka,~119 ka, since ~16 ka) might suggest an overall frequency of around~100 ka, similar to that reported for Aluto volcano (Hutchison et al.,2016b). The temporal distribution of mafic and felsic magmatismaround the BBVC suggests that this part of themagmatic segment expe-rienced regular and recent felsic activity. Over the last ~30 ka, mafic tointermediate fissure activity potentially stimulated reactivation of felsicactivity (over the last ~16 ka), manifested as peralkaline lava flows andexplosive eruptions at Gudda and Bericha (Fig. 9); additional work is re-quired to test this hypothesis. The overall dominance of felsic volcanismin the BBVC is likely due to the relatively early stage of rifting (stretchingfactor b 2), insofar as relatively thick continental crust encourages meltstorage and fractional crystallisation. This contrasts with the more de-veloped Afar rift, where dominantly basaltic volcanism is observed(e.g. Barberi and Varet, 1970).
An unexpected finding of this study is the young age of the latestlarge-volume felsic episode, since 16 ka. This magmatic episode repre-sents the climax of peralkaline lava flow eruption for rhyolitic lavas ofBericha (phase M and N) and trachytic post-caldera activity at Gudda(phase K south, L, O), as well as fissure eruption between both edifices(phase P). Our finding that the last felsic episode at Gudda and Bericha(Fig. 9) are broadly coeval corroborates previous field observation(Brotzu et al., 1980). Average ages for dated lavas seems to be slightlyolder for Gudda compared to Bericha (Fig. 9, Table 1). The morphologyand size of the edifice, as well as variation of eruption style and sourcesof Gudda and Bericha support the interpretation that Gudda is generallyolder with a more mature magmatic plumbing system. Given theirproximity, Gudda and Bericha may interact hydraulically, or throughstress transfer (e.g. Biggs et al., 2016), but compositionally they developindependently. Our chronology suggests that the most recent eruptionof the BBVC was either a rhyolitic eruption sourced from Bericha(phase N), a mafic-intermediate fissure eruption between Gudda andBericha (phase P), or a rhyolitic eruption of Gudda (phase O); furtherdetailed tephrochronology is necessary to establish the relationshipsbetween these phases.
We now consider the recurrence rates of eruptions at Gudda andBericha, focusing on well-exposed phases (Table 5). Stepwise mafic/
0.0
0.5
1.0
1.5
2.0
2.5
3.0
3.5
4.0
4.5
5.0
01002003000
10
20
30
40
50
60
70
80
90
100
051015202530Time [Ka]
3vo
lum
e [k
m]
cum
. vol
ume
[%]
A1
A2
B
C
D
EF
GHI
J
Ks
KcL
M N
OP
Fig. 13.Volume for each eruption phase (square) versus timewith colour indicating composition (see Fig. 10). Rift floor basalts (phase A1, A2, D) and felsic activity at Gudda (phase B, E, K,L) are themost voluminous phases. Cumulative volumes (circle, grey shaded) show twomain steps, coeval with felsic eruption episodes ~120 ka and since 16 ka. Note the change in timescale at 30 ka. Error bars indicated by only using relative chronology (dotted) and absolute 40Ar/39Ar ages (solid) of lava flows with the eruption phase.
130 M. Siegburg et al. / Journal of Volcanology and Geothermal Research 351 (2018) 115–133
intermediate dyke injection is associated with extension and magmaassisted riftingwithin theMER, therefore the observed fissure eruptionsat the BBVC are more frequent with an average eruption rate of b1/1000 years for the central fissure between Gudda and Bericha (phaseG, P). Since major dyking episodes typically open an entire rift segment,as observed for the Krafla (e.g. Buck et al., 2006), Dabbahu (Wright et al.,2006) and Bardabunga (Sigmundsson et al., 2015) episodes, ourinterpreted rate is likely an under-estimate for the whole segment. Un-certainties for mafic phases are higher due to difficulties in differentia-tion of eruption events within mafic eruption phases (e.g. A, C, F, H). Ifwe assume a dyke width of 0.5–2 m, and the current extension ratefor theMERof ~ 5mm/year (Bendick et al., 2006),we predict an averageintrusion cycle of every 100 to 400 years for mafic dykes, equivalent toan average eruption rate of 2.5–10/1000 years.
For felsic eruptions, taking the entire post-caldera eruptive cyclesince ~100 ka for Gudda (phase B excluded) and Bericha, the recurrencerate is b1/1000 years, broadly similar to other rift zones (Rowland et al.,2010). The latest felsic episode since ~16 ka includes 3 eruption phasesof Bericha, and 3–4 at Gudda with much higher eruption rates and al-most an order of magnitude higher productivity for Gudda comparedto Bericha (Table 5). This episode formed the main part of the pres-ent-day exposed volcanic complex (Fig. 4). However, we stress that un-certainties are larger for Gudda, due to fewer absolute ages. The youngage of lavas, evidence for regular episodic activity (Fig. 9, Table 1), andcurrent fumarolic activity along the fault system (Fig. 4), suggest thatthe BBVC is still potentially active.
5.3. Comparison of timing of volcanic activity in the MER
1.6–0.1 Ma: A comparison between absolute ages of volcanic de-posits at the BBVC and other central volcanoes in the MER shows thatthere is at least one large episode around 1.6 Ma and a further five epi-sodes in the last 1Ma,where activity of individual volcanoes of different
Table 5Eruption rate and production per 1000 years based on felsicmagmatism at the BBVC in thelast 16 ka andmafic – intermediate activity only along the centralfissure betweenboth ed-ifices in the last 30 ka, calculated by number of flows/events and volume of phases.
rift segments were temporally clustered (Fig. 14). The oldest dated ageat the BBVC edifice of around 1.6 ± 0.3 Ma (K/Ar) (Morbidelli et al.,1975) for ignimbrites southeast of the volcanic edifice and for volcanicsof old Gudda (location unclear) suggest activity broadly coincident withmany other silicic centres in the northern – central MER (Morton et al.,1979; Abebe et al., 2007). Basaltic activity of the rift floor southwest ofthe BBVC (i.e. close to Nazret), is K/Ar dated around 1.66 ± 0.03 Ma(Abebe et al., 2007) and around 1.44 ± 0.03 Ma (Chernet et al., 1998).Further periods of coincident activity of the BBVC and several rift seg-ments in the last 1 Ma occurred at around 880–820 ka and 640–510 ka (Fig. 14), framing the dated activity at Gademotta caldera(Vogel et al., 2006). These activities aremainly around the older, erodedcaldera structures for O'a caldera (Mohr et al., 1980), Boku (Morton etal., 1979) for both periods and Gedemsa (Morton et al., 1979) for theolder period. Activity around the BBVC for this period is dated for volca-nics (basalts and welded tuff) around Nazret southwest of the BBVC(Morton et al., 1979; Abebe et al., 2007) and for the rhyolitic dome(600 ± 20 ka) north of the BBVC (Chernet et al., 1998). Emplacementof the Bofa basalt (440 ± 50 ka (Morton et al., 1979) and 300 ± 50 ka(Chernet et al., 1998)), south of the BBVC, is temporally related to activ-ity at Kone around 391 ka± 10 ka (Vogel et al., 2006), Gedemsa caldera(Morton et al., 1979; Peccerillo et al., 2003) and O'a caldera (Mohr et al.,1980).
Significant overlap in timing of volcanism across theMER occurs be-tween 320 and 140 ka (Fig. 14). This episode is characterized bymagmatism and caldera collapse at Aluto Volcano around 316 ±13 ka/306 ± 12 ka (Hutchison et al., 2016b) and Gedemsa 320–260 ka(Bigazzi et al., 1993; Peccerillo et al., 2003), followed by major ignim-brite eruptions and caldera collapses for O'a Shala 240 ± 30 ka (Mohret al., 1980), Corbetti 182 ± 28 ka (Hutchison et al., 2016a, 2016b),Gademotta (Wendorf et al., 1975; Morgan and Renne, 2008), Fantale(Williams et al., 2004), mafic lava flows at Sodore (WoldeGabriel etal., 1990; Bigazzi et al., 1993), and formation of cones north of theBBVC at Jinjimma (210 ± 10 ka) and Gara Chisa (230 ± 30, 160 ±10 ka) (Morton et al., 1979) (Fig. 4). For the BBVC edifice there is no ab-solute age for this ‘flare up’ episode dated in our study, possibly because“old” Gudda is mostly covered by younger flows. Activity around~120 ka at “old” Gudda could be linked to be youngest part of theflare up activity episode (320–140 ka). Alternatively, it represents an in-dividual felsic episode, broadly coincident with a 100 ka cycle for felsicactivity at the BBVC (230–210 ka (Morton et al., 1979), ~120 ka andsince ~16 ka). The 120 ka “old” Gudda deposits was formed at thesame time as Bora Bericha Caldera (Bigazzi et al., 1993) (Figs. 1, 14),
0123456789
101112131415
00.20.40.60.811.21.41.61.8 00.020.040.060.080.1
CorbettiO’A caldera
AlutoGademotta
ChilaloTullu Moje
GedemsaSodore
BokuBBVC rift floorBBVC edifice
KoneFantale
Age [Ma]
Dunguna
Bora-Bericha
K/Ar 40 39Ar/ Ar FT14C F
SW
NE
Fig. 14. Comparison of activity at the BBVC from this study (red)with other central volcanoes in theMER shown from southwest to northeast along the rift (Fig. 1), based on absolute agesand folklore (square). Dating method is indicated by symbol, K/Ar (grey circle), 40Ar/39Ar (triangle), 14C (star), fission track (grey diamond). Note the change in the absolute age scale at0.1 Ma (dashed line) to highlight our new ages alongside other Upper Pleistocene and Holocene volcanoes in the MER. References are provided within the text.
131M. Siegburg et al. / Journal of Volcanology and Geothermal Research 351 (2018) 115–133
suggesting different rift segments were active at broadly the same time.The caldera collapse at the BBVC could feasibly have occurred in the‘flare up’ episode, during formation of phase B (~120 ka), or later, butbefore eruption of the central part of Gudda (phase Kc) (Figs. 4, 6, 8).We stress that more detailed investigations of caldera deposits and“old” Gudda are necessary to test this further. Comparing the detailederuption history of the BBVC (our study) and Aluto Volcano(Hutchison et al., 2016a, 2016b), both show evidence for ~100 ka cycliclarge voluminous felsic activity, which might be applicable to otherneighbouring volcanoes.
Since 100 ka, considerably fewer age constraints are available (Fig.14), but this does not necessarily indicate a hiatus in activity. Notableclusters of activity are dated at ~60–55 ka at Aluto (Hutchison et al.,2016b), Gademotta (Vogel et al., 2006) and Tullu Moye (Bigazzi et al.,1993), and at ~20 ka at Aluto (Hutchison et al., 2016b) and Corbetti(Hutchison et al., 2016a, 2016b). The BBVC does not appear to havebeen active at these times, but relative chronology and errors of40Ar/39Ar dates do not preclude the possibility of activity during this pe-riods. Coincident activity at the BBVC (felsic andmafic), Kone (Williamset al., 2004) and Aluto (Hutchison et al., 2016a, 2016b) are around 14–10 ka. Coeval activity at Kone and the BBVC (Fig. 14) potentially sug-gests a rift segment-wide episode.
5.4. Possible processes for episodic activity
We observe episodic activity of clustered volcanic eruptions on100 ka (felsic) and 10 ka (mafic) timescales at the BBVC, as well as ona range of spatial scales (e.g. within a single volcanic complex, rift seg-ment, overall rift) in theMER. Episodic rifting has been observed in sev-eral rifts (e.g. Iceland, New Zealand, Afar, Atlantic) and explained by (a)a sudden release of tension, which affects the entire rift or is transferredbetween segments (e.g. Björnsson, 1985); (b) an acceleration in exten-sion rate immediately prior to continental break up (Brune et al., 2016)resulting in higher melt production; (c) high mantle flux due to achange in melt fraction and viscosity (Gravley et al., 2016; Lamb et al.,2017); (d) pulsic mantle hotspot (Parnell-Turner et al., 2014) and e)magma evolution in the crust.
We favour the hypothesis that episodic mantle, crustal and tectonicprocesses interact to explain the observed trends of activity at the BBVC.Plate kinematic models do not suggest major changes in extension ratein the MER during the timescale of our study (e.g. Stamps et al., 2008).We interpret both episodic mantle flux, either from decompression
melting caused by rifting (Gallacher et al., 2016) or the presence of amantle hotspot (Schilling et al., 1992) to be plausible explanations.Both P- and S-wave tomographic imaging of the upper mantle showsegmented low velocity anomalies beneath the MER and Afar(Hammond et al., 2013; Gallacher et al., 2016). The magnitude and seg-mented shape of the tomographic anomalies are interpreted as evi-dence for buoyancy driven decompression melting (Gallacher et al.,2016), which could cause temporal variations in melt flux. In addition,to date we have no evidence to rule out temporal changes in tempera-ture or chemistry of hotspotfluxover the timescale of our study. The ob-served differences in timing and cyclicity of mafic and felsic episodescan be explained by fundamental differences in magma formation andascent. Mafic dyke emplacement is associated mainly with decompres-sion melting, occurring broadly on the timescales of tectonic activity(Rooney et al., 2007). In contrast, felsic magma requires longer time-scales to develop through fractional crystallisation and other crustalprocesses such as melting, storage, assimilation and homogenisation(Cashman et al., 2017), mainly during periods of tectonic quiescence(Boccaletti et al., 1999). Coeval activity within the BBVC and along thesame magmatic segment may be caused by a hydraulic connection be-tween different magma storage levels by sills and well-developedmush zones, whereas large volume eruptions, a shared deep magmasource and broad extensional tectonic stress could affect several seg-ments (Biggs et al., 2016).
6. Conclusions
The first detailed geological evolution of the Boset-Bericha VolcanicComplex (BBVC) is synthesised from field observations, morphometricanalysis using high-resolution LiDAR data, geochemistry and new40Ar/39Ar geochronology. This paper focused on understanding theeruption history of extensive young lavaflows covering the two edifices,Gudda and Bericha. These lavas exhibit a bimodal composition rangingdominantly frombasaltic riftfloor lavas and scoria cones, to pantelleritictrachytes and rhyolite flows at Gudda, and comenditic rhyolites atBericha. Intermediate compositions are associated with fissure ventsalong the Boset-Kone segment that link the silicic centres. Our analysisindicates that the BBVC can be described by four main eruptive stages:
1. early rift floor emplacement, (≥300 ka)
2. formation of Gudda Volcano within twomain cycles, (~120 ka, since~16 ka), separated by a period of caldera formation
132 M. Siegburg et al. / Journal of Volcanology and Geothermal Research 351 (2018) 115–133
3. formation of the Bericha Volcano (14 ka, since ~5 ka)4. sporadic fissure eruptions (including episodes at ~104 ka, and since
30 ka).
Our new 40Ar/39Ar geochronology provides compelling evidence forepisodic activity at the BBVC from ~120 ka to the present-day. Low-vol-ume mafic episodes are more frequent (~10 ka cyclicity) than highervolume felsic episodes (~100 ka cyclicity). The most recent felsic epi-sode occurred during the last ~16 ka. Felsic episodes have on averagea higher eruption rate (2–5/1000 years) and productivity at Guddacompared to Bericha (1–2/1000 years). The voluminous lava eruptionsfrom theBBVC at ~120 ka and since ~16 ka are coincidentwith dated ac-tivity at nearby volcanic centres in the MER.
Acknowledgments
Wewould like to thank the NERC Airborne Research and Survey Fa-cility (grant ET12-14) for undertaking a LiDAR survey over the BBVC.We thank staff of the Institute of Geophysics, Space Science and Astron-omy and Department of Earth Science at Addis Ababa University, Ethio-pia for support during data collection (2012) and field work (2015).Wethank R. Dymock and J. Imlach of the AIF laboratory at SUERC, and E.Roberts from University of Southampton for their assistance with sam-ple preparation and 40Ar/39Ar measurement. We acknowledge theNERC Isotope Geosciences Facilities Steering Committee for funding toundertake 40Ar/39Ar dating at the Argon Isotope Facility (grant IP-1569-1115). We thankW. Hutchison and F. Illsley-Kemp for their help-ful assistance with the GMT script for lava volume measurement. DK issupported by NERC grant NE/L013932.
Appendix A. Supplementary data
Supplementary data to this article can be found online at https://doi.org/10.1016/j.jvolgeores.2017.12.014.
References
Abebe, T., Manetti, P., Bonini, M., Corti, G., Innocenti, F., Mazzarini, F., Peckzay, Z., 2005.Geological map (scale 1:200,000) of the northernMain Ethiopian Rift and its implica-tions for the volcano-tectonic evolution of the rift. Geol. Soc. Am. Map Chart Ser.MCH094 :pp. 1–20. https://doi.org/10.1130/2005MCH094TXT.
Abebe, B., Acocella, V., Korme, T., Ayalew, D., 2007. Quaternary faulting and volcanism inthe Main Ethiopian Rift. J. Afr. Earth Sci. 48:115–124. https://doi.org/10.1016/j.jafrearsci.2006.10.005.
Aspinall, W., Auker, M., Hincks, T., Mahony, S., Nadim, F., Pooley, J., Sparks, S., Syre, E.,2011. Global Facility for Disaster Reduction and Recovery (GFDRR), volcano riskstudy. Volcano Hazard Expo. GFDRR Prior. Ctries. Risk Mitig. Meas., pp. 1–41
Barberi, F., Varet, J., 1970. The Erta Ale volcanic range (Danakil depression, northernAfar, Ethiopia). Bull. Volcanol. 34:848–917. https://doi.org/10.1007/BF02596805.
Bastow, I.D., Stuart, G.W., Kendall, J.M., Ebinger, C.J., 2005. Upper-mantle seismic structurein a region of incipient continental breakup: Northern Ethiopian rift. Geophys. J. Int.162:479–493. https://doi.org/10.1111/j.1365-246X.2005.02666.x.
Bendick, R., McClusky, S., Bilham, R., Asfaw, L., Klemperer, S., 2006. Distributed Nubia-So-malia relative motion and dike intrusion in the Main Ethiopian Rift. Geophys. J. Int.165:303–310. https://doi.org/10.1111/j.1365-246X.2006.02904.x.
Beutel, E., van Wijk, J., Ebinger, C., Keir, D., Agostini, A., 2010. Formation and stability ofmagmatic segments in the Main Ethiopian and Afar rifts. Earth Planet. Sci. Lett.293:225–235. https://doi.org/10.1016/j.epsl.2010.02.006.
Bigazzi, B., Bonadonna, F.P., Di Paola, G.M., Giuliani, A., 1993. K-Ar and fission track ages ofthe last volcano tectonic phases in the Ethiopian rift valley (Tullu Moye area). Geol.Miner. Recources Somalia Surround. Reg. 113, pp. 311–322.
Biggs, J., Robertson, E., Cashman, K., 2016. The lateral extent of volcanic interactionsduring unrest and eruption. Nat. Geosci. 9:1–5. https://doi.org/10.1038/ngeo2658.
Bilham, R., Bendick, R., Larson, K., Mohr, P., Braun, J., Tesfaye, S., Asfaw, L., 1999. Secularand tidal strain across the Main Ethiopian Rift. Geophys. Res. Lett. 26:2789. https://doi.org/10.1029/1998GL005315.
Björnsson, A., 1985. Dynamics of crustal rifting in NE Iceland. J. Geophys. Res. 90:10151–10162. https://doi.org/10.1029/JB090iB12p10151.
Blundy, J., Cashman, K., 2001. Ascent-driven crystallisation of dacite magmas at Mount StHelens, 1980–1986. Contrib. Mineral. Petrol. 140:631–650. https://doi.org/10.1007/s004100000219.
Boccaletti, M., Mazzuoli, R., Bonini, M., Trua, T., Abebe, B., 1999. Plio-Quaternaryvolcanotectonic activity in the northern sector of the Main Ethiopian Rift: relation-ships with oblique rifting. J. Afr. Earth Sci. 29:679–698. https://doi.org/10.1016/S0899-5362(99)00124-4.
Brotzu, P., Morbidelli, L., Piccirillo, E.M., Traversa, G., 1974. Petrological features of BosetiMountains, a complex volcanic system in the axial portion of the Main Ethiopianrift. Bull. Volcanol. 38:206–234. https://doi.org/10.1007/BF02597811.
Brotzu, P., Ganzerli-Valenini, M.T., Morbidelli, L., Piccirillo, E.M., Stella, R., Traversa, G.,1981. Basaltic volcanism in the northern sector of the main Ethiopian Rift.J. Volcanol. Geotherm. Res. 10, 365–382.
Buck, W.R., Einarsson, P., Brandsdóttir, B., 2006. Tectonic stress and magma chamber sizeas controls on dike propagation: constraints from the 1975–1984 Krafla rifting epi-sode. J. Geophys. Res. Solid Earth 111:1–15. https://doi.org/10.1029/2005JB003879.
Calais, E., Ebinger, C., Hartnady, C., Nocquet, J.M., 2006. Kinematics of the East African Riftfrom GPS and earthquake slip vector data. In: Yirgu, G., Ebinger, C.J., Maguire, P.K.H.(Eds.), The Afar Volcanic Province Within the East African Rift System. Geological So-ciety, London, Special Publications, London, pp. 9–22.
Casey, M., Ebinger, C., Keir, D., Gloaguen, R., Mohamed, F., 2006. Strain accommodation intransitional rifts: extension by magma intrusion and faulting in Ethiopian rift mag-matic segments. Geol. Soc. Lond. Spec. Publ. 259:143–163. https://doi.org/10.1144/GSL.SP.2006.259.01.13.
Cashman, K.V., Sparks, R.S.J., Blundy, J.D., 2017. Vertically extensive and unstablemagmat-ic systems: a unified view of igneous processes. Science (80-.) 355 (6331), eaag3055.https://doi.org/10.1126/science.aag3055.
Chernet, T., Hart, W.K., Aronson, J.L., Walter, R.C., 1998. New age constraints on the timingof volcanism and tectonism in the northern Main Ethiopian Rift - southern Afar tran-sition zone (Ethiopia). J. Volcanol. Geotherm. Res. 80:267–280. https://doi.org/10.1016/S0377-0273(97)00035-8.
Cornwell, D.G., Mackenzie, G.D., England, R.W., Maguire, P.K.H., Asfaw, L., Oluma, B.,2006. Northern Main Ethiopian Rift crustal structure from new high-precisiongravity data. In: Yirgu, G., Ebinger, C., Maguire, P.K.H. (Eds.), The Afar VolcanicProvince Within the East African Rift System. Geological Society, London (pp.259, 307–321).
Corti, G., 2009. Continental rift evolution: from rift initiation to incipient break-up in theMain Ethiopian Rift, East Africa. Earth Sci. Rev. 96:1–53. https://doi.org/10.1016/j.earscirev.2009.06.005.
Coulié, E., Quidelleur, X., Courtillot, V., Lefèvre, J.C., Chiesa, S., 2003. Comparative K-Ar andAr/Ar dating of Ethiopian and Yemenite Oligocene volcanism: implications for timingand duration of the Ethiopian traps. Earth Planet. Sci. Lett. 206:477–492. https://doi.org/10.1016/S0012-821X(02)01089-0.
Di Paola, G.M., 1972. The Ethiopian Rift Valley (between 7° 00′ and 8° 40′ lat. North). Bull.Volcanol. 36:517–560. https://doi.org/10.1007/BF02599823.
Ebinger, C.J., Casey, M., 2001. Continental breakup in magmatic provinces: an Ethiopianexample. Geology 29:527–530. https://doi.org/10.1130/0091-7613(2001)029b0527:CBIMPAN2.0.CO;2.
Fernandes, R.M.S., Ambrosius, B.A.C., Noomen, R., Bastos, L., Combrinck, L., Miranda, J.M.,Spakman, W., 2004. Angular velocities of Nubia and Somalia from continuous GPSdata: implications on present-day relative kinematics. Earth Planet. Sci. Lett. 222:197–208. https://doi.org/10.1016/j.epsl.2004.02.008.
Gallacher, R.J., Keir, D., Harmon, N., Stuart, G., Leroy, S., Hammond, J.O.S., Kendall, J.-M.,Ayele, A., Goitom, B., Ogubazghi, G., Ahmed, A., 2016. The initiation of segmentedbuoyancy-driven melting during continental breakup. Nat. Commun. 7:13110.https://doi.org/10.1038/ncomms13110.
Gardner, J.E., Layer, P.W., Rutherford, M.J., 2002. Phenocrysts versus xenocrysts in theyoungest Toba Tuff: implications for the petrogenesis of 2800 km3 of magma. Geolo-gy 30:347–350. https://doi.org/10.1130/0091-7613(2002)030b0347:PVXITYN2.0.CO;2.
Gibson, I.L., 1974. Quaternary silicic volcanic centres in the Main Ethiopian Rift. Bull.Volcanol. 38, 791–802.
Hammond, J.O.S., Kendall, J.M., Stuart, G.W., Ebinger, C.J., Bastow, I.D., Keir, D., Ayele, A.,Belachew, M., Goitom, B., Ogubazghi, G., Wright, T.J., 2013. Mantle upwelling and ini-tiation of rift segmentation beneath the Afar Depression. Geology 41:635–638.https://doi.org/10.1130/G33925.1.
Harris, W.C., 1844. The Highlands of Ethiopia. vol. III. Longmans, London.Hayward, N.J., Ebinger, C.J., 1996. Variations in the along-axis segmentation of the Afar
Rift system. Tectonics 15:244. https://doi.org/10.1029/95TC02292.Hofmann, C., Courtillot, V., Féraud, G., Rochette, P., Yirgu, G., Ketefo, E., Pik, R., 1997.
Timing of the Ethiopian flood basalt event and implications for plume birth and glob-al change. Nature 389:838–841. https://doi.org/10.1038/39853.
Hutchison, W., Fusillo, R., Pyle, D.M., Mather, T.A., Blundy, J.D., Biggs, J., Yirgu, G., Cohen,B.E., Brooker, R.A., Barfod, D.N., Calvert, A.T., 2016a. A pulse of mid-Pleistocene riftvolcanism in Ethiopia at the dawn of modern humans. Nat. Commun. 7:13192.https://doi.org/10.1038/ncomms13192.
Hutchison, W., Pyle, D.M., Mather, T.A., Yirgu, G., Biggs, J., Cohen, B.E., Barfod, D.N., Lewi, E.,2016b. The eruptive history and magmatic evolution of Aluto volcano: new insights
133M. Siegburg et al. / Journal of Volcanology and Geothermal Research 351 (2018) 115–133
into silicic peralkaline volcanism in the Ethiopian rift. J. Volcanol. Geotherm. Res. 328:9–33. https://doi.org/10.1016/j.jvolgeores.2016.09.010.
Kazmin, V., Seife, M.B., Nicoletti, M., Petrucciani, C., 1979. Evolution of the Northern Part ofEthiopian Rift - Geodynamic Evolution of the Afro-Arabain Rift System. Accad. Naz.Lincei, Roma.
Keir, D., Kendall, J.M., Ebinger, C.J., Stuart, G.W., 2005. Variations in late syn-rift melt align-ment inferred from shear-wave splitting in crustal earthquakes beneath the Ethiopi-an rift. Geophys. Res. Lett. 32:1–4. https://doi.org/10.1029/2005GL024150.
Keir, D., Ebinger, C.J., Stuart, G.W., Daly, E., Ayele, A., 2006. Strain accommodation bymagmatism and faulting as rifting proceeds to breakup: seismicity of the northernEthiopian rift. J. Geophys. Res. Solid Earth 111:1–17. https://doi.org/10.1029/2005JB003748.
Keranen, K., Klemperer, S.L., 2008. Discontinuous and diachronous evolution of the MainEthiopian Rift: implications for development of continental rifts. Earth Planet. Sci.Lett. 265:96–111. https://doi.org/10.1016/j.epsl.2007.09.038.
Lamb, S., Moore, J.D.P., Smith, E., Stern, T., 2017. Episodic kinematics in continental riftsmodulated by changes in mantle melt fraction. Nature 547:84–88. https://doi.org/10.1038/nature22962.
Le Bas, M.J., Le Maitre, R.W., Streckeisen, A., Zanettin, B., 1986. A chemical classification ofvolcanic rocks based on the total alkali silica diagram. J. Petrol. 27:745–750. https://doi.org/10.1093/petrology/27.3.745.
MacDonald, R., 1974. Nomenclature and petrochemistry of the peralkaline oversaturatedextrusive rocks. Bull. Volcanol. 38:498–516. https://doi.org/10.1007/BF02596896.
Macdonald, R., Bagiński, B., Ronga, F., Dzierzanowski, P., Lustrino, M., Marzoli, A., Melluso,L., 2012. Evidence for extreme fractionation of peralkaline silicic magmas, the Bosetivolcanic complex, Main Ethiopian Rift. Mineral. Petrol. 104:163–175. https://doi.org/10.1007/s00710-011-0184-4.
Mackenzie, G.D., Thybo, H., Maguire, P.K.H., 2005. Crustal velocity structure across theMain Ethiopian Rift: results from two-dimensional wide-angle seismic modelling.Geophys. J. Int. 162:994–1006. https://doi.org/10.1111/j.1365-246X.2005.02710.x.
Maguire, P.K.H., Keller, G.R., Klemperer, S.L., Mackenzie, G.D., Keranen, K., Harder, S.,O'Reilly, B., Thybo, H., Asfaw, L., Khan, M.A., Amha, M., 2006. Crustal structure of thenorthern Main Ethiopian Rift from the EAGLE controlled-source survey; a snapshotof incipient lithospheric break-up. In: Yirgu, G., Ebinger, C.J., Maguire, P.K.H. (Eds.),The Afar Volcanic Province Within the East African Rift System. Geological Society,London, Special Publications, London:pp. 269–292 https://doi.org/10.1144/GSL.SP.2006.259.01.21.
Mazzarini, F., Keir, D., Isola, I., 2013. Spatial relationship between earthquakes and volca-nic vents in the central-northernMain Ethiopian Rift. J. Volcanol. Geotherm. Res. 262:123–133. https://doi.org/10.1016/j.jvolgeores.2013.05.007.
Mickus, K., Tadesse, K., Keller, G.R., Oluma, B., 2007. Gravity analysis of the Main Ethiopianrift. J. Afr. Earth Sci. 48:59–69. https://doi.org/10.1016/j.jafrearsci.2007.02.008.
Mohr, P.A., 1962. Surface cauldron subsidence with associated faulting and fissure basalteruptions at Gariboldi pass, Shoa, Ethiopia. Bull. Volcanol. 24:421–428. https://doi.org/10.1007/BF02599358.
Mohr, P.A., 1967. Major volcano-tectonic lineament in the Ethiopian rift system. Nature:664–665 https://doi.org/10.1038/213664a0.
Mohr, P.a., 1971. Ethiopian rift and plateaus: some volcanic petrochemical differences.J. Geophys. Res. 76:1967–1984. https://doi.org/10.1029/JB076i008p01967.
Mohr, P., Mitchell, J.G., Raynolds, R.G.H., 1980. Quaternary volcanism and faulting at O'Acaldera, central Ethiopian rift. Bull. Volcanol. 43:173–189. https://doi.org/10.1007/BF02597619.
Morbidelli, L., Nicoletti, M., Petrucciani, C., Piccirillo, E.M., 1975. Ethiopian South-EasternPlateau and related escarpment: K/Ar ages of the main volcanic events (Main Ethio-pian Rift from 8°10′ to 9°00′ lat. North). In: Pilger, A., Rosler, A. (Eds.), Afar Depressionof Ethiopia. E. Schweizerbart'sche Verlagsbuchhandlung (Nӓgele u. Obermiller),Stuttgart, pp. 362–370.
Morgan, L.E., Renne, P.R., 2008. Diachronous dawn of Africa's Middle Stone Age: new40Ar/39Ar ages from the Ethiopian Rift. Geology 36:967. https://doi.org/10.1130/G25213A.1.
Muirhead, J.D., Kattenhorn, S.A., Le Corvec, N., 2015. Varying styles of magmatic strainaccomodation across the East African Rift. AGU Publ. Geochem. Geophys. Geosyst.16:2775–2795. https://doi.org/10.1002/2015GC005918.Received.
Nomikou, P., Parks, M.M., Papanikolaou, D., Pyle, D.M., Mather, T.A., Carey, S., Watts, A.B.,Paulatto, M., Kalnins, M.L., Livanos, I., Bejelou, K., Simou, E., Perros, I., 2014. The emer-gence and growth of a submarine volcano: the Kameni islands, Santorini (Greece).GeoResJ 1–2:8–18. https://doi.org/10.1016/j.grj.2014.02.002.
Parnell-Turner, R., White, N., Henstock, T., Murton, B., Maclennan, J., Jones, S.M., 2014. Acontinuous 55-million-year record of transient mantle plume activity beneath Ice-land. Nat. Geosci. 7:914–919. https://doi.org/10.1038/ngeo2281.
Peccerillo, A., Barberio, M.R., Yirgu, G., Ayalew, D., Barbieri, M., Wu, T.W., 2003. Relation-ships between mafic and peralkaline silicic magmatism in continental rift settings:a petrological, geochemical and isotopic study of the Gedemsa Volcano, Central Ethi-opian Rift. J. Petrol. 44:2003–2032. https://doi.org/10.1093/petrology/egg068.
Piccirillo, E.M., Justin-Visentin, E., Zanettin, B., Joron, J.L., Treuil, M., 1979. Geodynamicevolution from plateau to rift: major and trace element geochemistry of the centraleastern Ethiopian plateau volcanics. N. Jb. Geol. Paläont. (Abh.) 158 (2), 139–179.
Rapprich, V., Žáček, V., Verner, K., Erban, V., Goslar, T., Bekele, Y., Legesa, F., Hroch, T.,Hejtmánková, P., 2016. Wendo Koshe Pumice: the latest Holocene silicic explosiveeruption product of the Corbetti Volcanic System (Southern Ethiopia). J. Volcanol.Geotherm. Res. 310:159–171. https://doi.org/10.1016/j.jvolgeores.2015.12.008.
Ronga, F., Lustrino, M., Marzoli, A., Melluso, L., 2010. Petrogenesis of a basalt-comendite-pantellerite rock suite: the Boseti Volcanic Complex (Main Ethiopian Rift). Mineral.Petrol. 98:227–243. https://doi.org/10.1007/s00710-009-0064-3.
Rooney, T., Furman, T., Bastow, I., Ayalew, D., Yirgu, G., 2007. Lithospheric modificationduring crustal extension in the Main Ethiopian Rift. J. Geophys. Res. Solid Earth 112.https://doi.org/10.1029/2006JB004916.
Rooney, T.O., Bastow, I.D., Keir, D., Mazzarini, F., Movsesian, E., Grosfils, E.B., Zimbelman,J.R., Ramsey, M.S., Ayalew, D., Yirgu, G., 2014. The protracted development of focusedmagmatic intrusion during continental rifting. Tectonics 33:875–897. https://doi.org/10.1002/2013TC003514.
Rowland, J.V., Wilson, C.J.N., Gravley, D.M., 2010. Spatial and temporal variations inmagma-assisted rifting, Taupo Volcanic Zone, New Zealand. J. Volcanol. Geotherm.Res. 190:89–108. https://doi.org/10.1016/j.jvolgeores.2009.05.004.
Sahle, Y., Hutchings, W.K., Braun, D.R., Sealy, J.C., Morgan, L.E., Negash, A., Atnafu, B., 2013.Earliest stone-tipped projectiles from the Ethiopian rift date to N279,000 years ago.PLoS One 8:1–9. https://doi.org/10.1371/journal.pone.0078092.
Sahle, Y., Morgan, L.E., Braun, D.R., Atnafu, B., Hutchings, W.K., 2014. Chronological andbehavioral contexts of the earliest Middle Stone Age in the Gademotta formation,Main Ethiopian rift. Quat. Int. 331:6–19. https://doi.org/10.1016/j.quaint.2013.03.010.
Schilling, J., Kingsley, R.H., Hanan, B.B., Mccully, B.L., 1992. Nd-Sr-Pb isotopic variationsalong the Gulf of Aden: evidence for afar mantle plume - continental lithosphere in-teraction. J. Geophys. Res. 97, 927–966.
Sigmundsson, F., Hooper, A., Hreinsdóttir, S., Vogfjörd, K.S., Ófeigsson, B.G., Heimisson,E.R., Dumont, S., Parks, M., Spaans, K., Gudmundsson, G.B., Drouin, V., Árnadóttir, T.,Jónsdóttir, K., Gudmundsson, M.T., Högnadóttir, T., Fridriksdóttir, H.M., Hensch, M.,Einarsson, P., Magnússon, E., Samsonov, S., Brandsdóttir, B., White, R.S.,Ágústsdóttir, T., Greenfield, T., Green, R.G., Hjartardóttir, Á.R., Pedersen, R., Bennett,R.A., Geirsson, H., La Femina, P.C., Björnsson, H., Pálsson, F., Sturkell, E., Bean, C.J.,Möllhoff, M., Braiden, A.K., Eibl, E.P.S., 2015. Segmented lateral dyke growth in arifting event at Bárðarbunga volcanic system, Iceland. Nature 517:15. https://doi.org/10.1038/nature14111.
Singer, B.S., Wijbrans, J.R., Nelson, S.T., Pringle, M.S., Feeley, T.C., Dungan, M.A., 1998.Inherited argon in a Pleistocene andesite lava: 40Ar/39Ar incremental-heating andlaser-fusion analyses of plagioclase. Geology 26:427–430. https://doi.org/10.1130/0091-7613(1998)026b0427:IAIAPAN2.3.CO;2.
Sisson, T.W., Grove, T.L., 1993. Temperatures and H2O contents of low-MgO high-aluminabasalts. Contrib. Mineral. Petrol. 113:167–184. https://doi.org/10.1007/BF00283226.
Stamps, D.S., Calais, E., Saria, E., Hartnady, C., Nocquet, J.M., Ebinger, C.J., Fernandes, R.M.,2008. A kinematic model for the East African Rift. Geophys. Res. Lett. 35:1–6. https://doi.org/10.1029/2007GL032781.
Trua, T., Deniel, C., Mazzuoli, R., 1999. Crustal control in the genesis of Plio-Quaternary bi-modal magmatism of the Main Ethiopian Rift (MER): geochemical and isotopic (Sr,Nd, Pb) evidence. Chem. Geol. 155:201–231. https://doi.org/10.1016/S0009-2541(98)00174-0.
Ukstins, I.A., Renne, P.R., Wolfenden, E., Baker, J., Ayalew, D., Menzies, M., 2002. Matchingconjugate volcanic rifted margins: 40Ar/39Ar chrono-stratigraphy of pre- and syn-riftbimodal flood volcanism in Ethiopia and Yemen. Earth Planet. Sci. Lett. 198:289–306.https://doi.org/10.1016/S0012-821X(02)00525-3.
Vogel, N., Nomade, S., Negash, A., Renne, P.R., 2006. Forensic 40Ar/39Ar dating: a prove-nance study of Middle Stone Age obsidian artifacts from Ethiopia. J. Archaeol. Sci.33:1749–1765. https://doi.org/10.1016/j.jas.2006.03.008.
Shafiqullah, M., Scarborough, R., 1975. Dates for the Middle Stone Age of East Africa.Science (80-.) 187, 0–2.
Whaler, K.A., Hautot, S., 2006. The electrical resistivity structure of the crust beneath thenorthern Main Ethiopian Rift. In: Yirgu, G., Ebinger, C.J., Maguire, P.K.H. (Eds.), TheAfar Volcanic Province Within the East African Rift System. Geological Society, Lon-don, Special Publications, London:pp. 293–305 https://doi.org/10.1144/GSL.SP.2006.259.01.22.
Williams, F.M., Williams, M.A.J., Aumento, F., 2004. Tensional fissures and crustal exten-sion rates in the northern part of the Main Ethiopian Rift. J. Afr. Earth Sci. 38:183–197. https://doi.org/10.1016/j.jafrearsci.2003.10.007.
WoldeGabriel, G., Aronson, J.L., Walter, R.C., 1990. Geochronology and rift basin develop-ment in the central sector of the Main Ethiopian Rift. Geol. Soc. Am. Bull. 102:439–485. https://doi.org/10.1130/0016-7606(1990)102b0439.
Wolfenden, E., Ebinger, C., Yirgu, G., Deino, A., Ayalew, D., 2004. Evolution of the northernMain Ethiopian rift: birth of a triple junction. Earth Planet. Sci. Lett. 224:213–228.https://doi.org/10.1016/j.epsl.2004.04.022.
Wright, T.J., Ebinger, C., Biggs, J., Ayele, A., Yirgu, G., Keir, D., Stork, A., 2006. Magma-main-tained rift segmentation at continental rupture in the 2005 Afar dyking episode. Na-ture 442:291–294. https://doi.org/10.1038/nature04978.