Monitoring of Water Quality Parameters in Uppanar River of
Cuddalore District, Tamil Nadu State, India
P. Mullai1*, M. K. Yogeswari1, B. Oommen1, K. Saravanakumar2, K. Kathiresan2 1Pollution Control Research Laboratory, Department of Chemical Engineering,
Annamalai University, Annamalai Nagar - 608 002, Tamil Nadu State, India 2Centre of Advanced Study in Marine Biology, Annamalai University,
Parangipettai - 608 502, Tamil Nadu State, India
ABSTRACT The Uppanar River is situated in the Cuddalore district of Tamil Nadu, India. The study was conducted to find out
the physico-chemical characteristics of the river. 11 physico - chemical variables were analyzed in the water sam-
ples collected every month for 3 years during November 2009 - December 2012. Continuous monitoring of the wa-
ter quality is very important in order to protect the river and it reveals the pollution status of the river. Various pa-
rameters like temperature, pH, redox potential, salinity, alkalinity, dissolved oxygen, reactive silicates, total phos-
phates, nitrate-nitrogen, nitrite-nitrogen and ammonia-nitrogen gave an outline of water quality of the Uppanar
River. The results indicated that the water quality of the Uppanar River was moderately polluted might be due to the
continuous discharge of municipal and industrial effluents.
Water is the elixir of life, an essential natural resource for the survival and sustainability of life on earth. Though the water available in the universe is estimated to contain about 1.36 billion km3, only 3% of the water existing as fresh water in rivers, stream springs and aqui-fers, is available for human use (Chinedu et al., 2011; Usharani et al., 2010). Among the fresh water only 5% are available for beneficial use. The total water resource available in India is 1850 km3, which is roughly 4% of the world’s fresh water resource (EPA-PWD, 2001). Water is a vital resource for agriculture, manufac-turing and other human activities to lead life. Fresh water resources are deteriorating
day-by-day at a faster rate which is a fright-ening global problem at present (Mahananda et al., 2010). Almost 70% of India’s surface water resources have been contaminated by biologi-cal, organic and inorganic pollutants (Agarwal and Saxena, 2011; Joseph and Jacob, 2010).
The addition of various kinds of pollutants and nutrients through the agency sewage, in-dustrial effluents, agricultural runoff etc, into the river bodies brings about a series of changes in the physicochemical characteristics of water (Mullai et al., 2011, 2012; Singh et al., 2010). Once the surface water is contaminated, its quality cannot be restored by stopping the pollutants from its source. Hence, continuous monitoring of the water quality becomes cru-cial in order to protect it (Yisa and Jimoh,
Journal of Water Sustainability, Volume 3, Issue 4, December 2013, 179–192
180 P. Mullai et al. / Journal of Water Sustainability 4 (2013) 179-192
2010). In Indian estuaries and seas the physico- chemical characteristics have been determined by many researchers (Damotharan et al., 2010; Khare et al., 2011; Mahananda et al., 2010; Manikannan et al., 2011; Sankar et al., 2010; Shraddha et al., 2011). In the present study, the influence of effluent discharge on physi-co-chemical characteristics in the Uppanar River was investigated from November 2009 to December 2012.
2. METHODOLOGY
2.1 Study area
The Uppanar river is situated at Cuddalore (N 11° 43’E; N 79° 46’E) (Figure 1), 180 Km South of Chennai and 25 Km South of Pondi-cherry. This river flows between Cuddalore
town and most part of Chidambaram Taluk and confluences with the Bay of Bengal through a mouth of Gadilam River. It runs behind the SIPCOT (State Industrial Promotion Corpora-tion of Tamil Nadu Limited) industrial com-plex covering an area of about 700 acres with 70 industries (Mullai et al., 2013). It is specif-ically established for chemical, petrochemical, fertilizers, pharmaceutical, dyes, soup, deter-gent, packing materials resins, pesticides, drugs, antibiotics etc., manufacturing indus-tries. Most of the industries are wet process industries and they consume large quantity of water for their manufacturing process. The effluents of these industries are released un-treated into the estuary. In addition to the in-dustrial wastes, the estuary receives also the municipal wastes and domestic sewage from Cuddalore old town.
Figure 1 Study area of the River Uppanar, southeast coast of India
P. Mullai et al. / Journal of Water Sustainability 4 (2013) 179-192 181
2.2 Sampling stations
The four sampling stations, namely S1 – be-tween SIPCOT and Uppanar Estuary (N 11º42’11.4” E 079º46’18.6”), S2 – at the start of the SIPCOT industrial complex (N 11º39’28.0” E 079º44’59.7”) , S3 – near the port office of the Uppanar Estuary (N 11º42’11.8” E 079º46’18.3”) , and S4 – near the site of plantation (N 11º43’51.4” E 079º46’18.8”) were selected along Uppanar River, as shown in Figure 1.
2.3 Sampling and analysis
Surface water samples were collected in acid washed polythene bottles from 4 stations for every 30 days at the selected locations along Uppanar River. Water samples were analyzed for water temperature, redox potential, hy-drogen ion concentration (pH), dissolved ox-ygen, salinity, alkalinity, relative silicate (Strickland and Parsons, 1972), total phos-phorus (Murphy and Riley, 1962), nitrate - nitrogen, nitrite - nitrogen, and ammonia - ni-trogen according to the standard procedure of APHA (1995).
3. RESULTS AND DISCUSSION
3.1 Temperature
Temperature is one of the important physical factors as it regulates the rate of photosynthe-sis and also affects the chemical and biologi-cal reactions in water. The temperature varia-tion may influence the physico-chemical characteristics, distribution and abundance of flora and fauna (Manikannan et al., 2011; Soundarapandian et al., 2009). Water temper-ature recorded was more or less similar at all the stations but fluctuated during the sampling period (Figure 2). The maximum temperature recorded was 32.1°C during May 2010 and 2011 at station I; March 2011 at station IV and
minimum temperature was 24.2°C during Oc-tober 2012 at station I. At many sampling time points, temperature was recorded above 25°C, exceeding the WHO (1984) permissible limits. The maximum temperature could be attributed to high solar radiation, evaporation, freshwa-ter influx and cooling and mixing up with ebb whereas the minimum temperature was due to sea breeze and precipitation (Damotharan et al., 2010; Sankar et al., 2010). This variation in water temperature might be because of an increase in rate of chemical reaction and na-ture of biological activities, since temperature governs the assimilative capacity of the aquatic system (Adefemi and Awokunmi, 2010; EPA, 1976).
3.2 pH
pH is an important parameter in evaluating the acid - base balance of water. The hydrogen ion concentration (pH) ranged from 6 to 9.8 at all the 4 stations (Figure 3). The lowest pH 6 recorded at station III during February 2012 might be due to the dilution of alkaline sub-stances or dissolution of atmospheric carbon dioxide, also due to the influence of effluent from the industries (Kumar et al., 2010), whereas the highest pH 9.8 indicating the al-kaline nature of water during December 2009 at Station II might be due to high temperature that reduces the solubility of CO2, the influ-ence of fresh water influx, dilution of sea wa-ter, low temperature and organic matter de-composition. The observed results exceeded the permissible limit of ICMR, 1975 (6.5 - 8.5) at some sampling stations. Similar trend in pH was reported by Gasim et al. (2007) from Be-bar river, Malaysia, Prabu et al. (2008) from Pichavaram mangroves, Damotharan et al. (2010) from Point Calimere coastal waters, Sundaramanickam et al. (2008) from Paran-gipettai and Cuddalore coast of India and Yadav and Srivastava (2011) from river Ganga. A change in water pH affects the aquatic life
182 P. Mullai et al. / Journal of Water Sustainability 4 (2013) 179-192
indirectly by altering water chemistry which in turn alters the dissolved oxygen level in the
water, photosynthesis of aquatic plants, meta-bolic rates of aquatic organisms.
24
26
28
30
32
34
Te
mpe
ratu
re º
C
Time (months)
Station I Station II Station III Station IV
Figure 2 Monthly variations of temperature in the study area during the study period
5
6
7
8
9
10
pH
Time (months)
Station I Station II Station III Station IV
Figure 3 Monthly variations of pH in the study area during the study period
P. Mullai et al. / Journal of Water Sustainability 4 (2013) 179-192 183
3.3 Redox potential
Redox potential measurement is an excellent indicator of TDS, which is a measure of salin-ity that affects the taste of potable water. The redox potential of water samples at station I, station II, station III, and station IV showed wide variations from 4.2 mv to 49 mv (Figure 4). The lowest Eh was seen at station II during June 2010 whereas highest Eh was recorded at station I during September 2011. The highest redox potential might be due to its proximity to sea and high influx of surface run off (Adefemi and Awokunmi, 2010; Chinedu et al., 2011; Shraddha et al., 2011; Yadav and Srivastava, 2011). This indicated that the river water had different quality at different loca-tions and also between different aquifers
(Gasim et al., 2007).
3.4 Salinity
Salinity is the measure of the salt content of water. Salinity of the Uppanar river ranged from 0 ppt to 29.1 ppt during the study period (Figure 5). The maximum salinity was rec-orded during November 2009 at station II and minimum was during March 2010 at station I. The lower salinity was due to heavy rainfall and large quantity of fresh water inflow (Manikannan et al., 2011; Soundarapandian et al., 2009). The high value of salinity could be due to low amount of rainfall, higher rate of evaporation and also due to intrusions into the river (Chinedu et al., 2011; Damotharan et al., 2010; Sankar et al., 2010).
0
10
20
30
40
50
60
Eh
(mv)
Time (months)
Station I Station II Station III Station IV
Figure 4 Monthly variations of redox potential in the study area during the study period
184 P. Mullai et al. / Journal of Water Sustainability 4 (2013) 179-192
0
5
10
15
20
25
30
35S
alin
ity (p
pt)
Time (months)
Station I Station II Station III Station IV
Figure 5 Monthly variations of salinity in the study area during the study period
3.5 Alkalinity
Alkaline nature of water provides an idea of natural salts present in the water. In this study, the maximum alkalinity of 80 mg/L was rec-orded during November 2010 and 2012 at sta-tion II, and during December 2009 at station III. The minimum alkalinity of 20 mg/L at sta-tion III was observed during November 2009 and May 2010 (Figure 6). Alkalinity values were within the permissible limits ICMR, 1975 (120 ppm). This is in accordance with the findings of Chandra et al. (2011), Khare et al. (2011), Mahananda et al. (2010) and Umamaheswari et al. (2009).
3.6 Dissolved oxygen (DO)
Dissolved oxygen in natural and waste water depends on the physical, chemical and bio-logical activities in the water body. The max-
imum DO concentration of 3.8 mg/L was rec-orded at station I during December 2010 and 2012; and the minimum DO of 1.2 mg/L was at station III during June 2010 and August 2010 and 2012 (Figure 7). DO contents in all samples exceeded the permissible limit of IS: 10500, 1991 (6 mg/L). These fluctuations in DO concentration could be due to anthropo-genic activity in and around the Uppanar Riv-er and also due to turbulence flow patterns. The lower DO value might be due to the high rate of oxygen consumption by oxidisible matter and higher level of nutrient load. As that of the present work, lower DO values were observed by Chandra et al. (2011), Ma-hananda et al. (2010), Yadav and Srivastava (2011), but fluctuation in DO concentration was seen in the work of Singh et al. (2010), Sundaramanickam et al. (2008) and Umama-heswari et al. (2009).
P. Mullai et al. / Journal of Water Sustainability 4 (2013) 179-192 185
0
20
40
60
80
100A
lka
linity
(mg
/L)
Time (months)
Station I Station II Station III Station IV
Figure 6 Monthly variations of alkalinity in the study area during the study period
0
1
2
3
4
5
DO
(mg
/L)
Time (months)
Station I Station II Station III Station IV
Figure 7 Monthly variations of DO in the study area during the study period
186 P. Mullai et al. / Journal of Water Sustainability 4 (2013) 179-192
3.7 Reactive silicate (Primary productivity)
Silicon plays an important role in the produc-tivity of aquatic ecosystem. Silicon found in the form of reactive silicates ranged between 0.84 and 48.59 mg/L during September 2010 and 2012. From the obtained values we can infer that the fluctuation in silicate concentra-tion could be seen at all four stations during the study period (Figure 8). The higher sili-cates values were due to heavy inflow of freshwater from land drainage carrying silicate leached out from rocks and also from the bottom sediment (Damotharan et al., 2010; Sankar et al., 2010). This finding corroborates well with the results of Nayak et al. (2004) and Sundaramanickam et al. (2008) in their work on physico-chemical analysis of the river water.
3.8 Total phosphate
A range of 0.41 - 49 mg/L of total phosphate was recorded at station II during January and June 2010 and at station I during July 2011 and 2012 respectively (Figure 9). Phosphate values in many samples exceeded the standard limit of (0.1 mg/L) US Public Health Stand-ards (De, 2002).The high amount of total phosphate during July - September 2010 and 2011 at all the four stations might be due to pollution dispersion from the surrounding area and this gradual increase of total phosphate concentration was due to the effect of excess of land drainage, runoff from agricultural areas, human use and sewage discharges into the Uppanar River. The possible sources of phosphate to rivers were firm rock deposit, runoff from surface catchments and interac-tion between the water and sediment from dead plant and animal remains at the bottom of rivers (Adeyemo et al., 2008). But the higher amount of phosphate represents high pollution loads and causes eutrophication of the aquatic body. Similar trend of increase in
total phosphate concentration were docu-mented by Sithik et al. (2009), Usharani et al. (2010) whereas Sundaramanickam et al. (2008), Shraddha et al. (2011), Yadav and Srivastava (2011) reported less variation in total phosphate concentration.
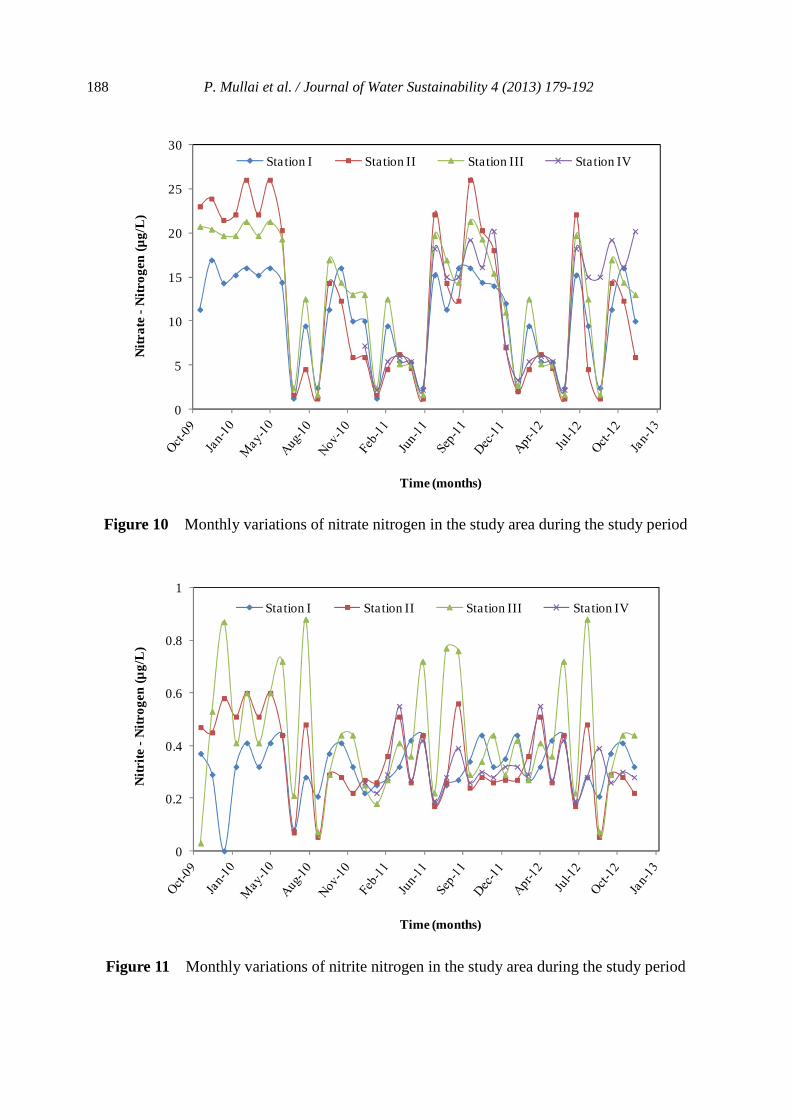
3.9 Nitrate – Nitrogen
Nitrate is a form of nitrogen and a vital nutri-ent for growth, reproduction, and the survival of organisms. The maximum of 26.04 µg/L of nitrate was observed during March and May 2010, October 2011 at station II whereas the minimum nitrate concentration of 1.21 µg/L was observed during September 2010, June 2011 and 2012 at station II (Figure 10). Nitrates were found to be within the permissi-ble limits of 10 mg/L (IS: 10500, 1991; WHO, 1984). The highest nitrates value was mainly due to the organic materials receiving from the catchment area during rainfall, fresh water inflow and litter fall decomposition. Another possible way of nitrates entry was through oxidation of ammonia form of nitrogen to nitrite formation (Joseph and Jacob, 2010; Mahananda et al., 2010; Manikannan et al., 2011). The low values might be due to its utilization by phytoplankton as evidenced by high photosynthetic activity (Sithik et al., 2009; Sankar et al., 2010; Umamaheswari et al., 2009).
3.10 Nitrite – Nitrogen
The nitrite concentration varied between 0.053 µg/L and 0.88 µg/L during September 2010 and 2012 at station II and during August 2010 and 2012 at station III. Throughout the study period, the nitrite levels recorded at all stations (Figure 11) were within the permissi-ble limit of WHO, 1984. The higher nitrite concentration might be due to increased planktonic organisms excretion, oxidation and reduction of ammonia and nitrate respectively, and also due to bacterial decomposition of
P. Mullai et al. / Journal of Water Sustainability 4 (2013) 179-192 187
planktonic detritus. In addition to this, increase in nitrate concentration at the surface water layer might also be due to denitrifica-tion and by air-sea interaction of exchange of chemical elements (Damotharan et al., 2010;
Manikannan et al., 2011; Sundaramanickam et al., 2008). The low nitrite concentration was might be due to lesser amount of freshwater inflow and high salinity (Sankar et al., 2010; Shraddha et al., 2011).
0
10
20
30
40
50
Re
act
ive
Sili
cate
s (m
g/L
)
Time (months)
Station I Station II Station III Station IV
Figure 8 Monthly variations of reactive silicates in the study area during the study period
0
10
20
30
40
50
60
To
tal P
hosp
hate
s (m
g/L
)
Time (months)
Station I Station II Station III Station IV
Figure 9 Monthly variations of total phosphate in the study area during the study period
188 P. Mullai et al. / Journal of Water Sustainability 4 (2013) 179-192
0
5
10
15
20
25
30N
itra
te -
Nitr
og
en (
µg
/L)
Time (months)
Station I Station II Station III Station IV
Figure 10 Monthly variations of nitrate nitrogen in the study area during the study period
0
0.2
0.4
0.6
0.8
1
Nitr
ite -
Nitr
og
en
(µg
/L)
Time (months)
Station I Station II Station III Station IV
Figure 11 Monthly variations of nitrite nitrogen in the study area during the study period
P. Mullai et al. / Journal of Water Sustainability 4 (2013) 179-192 189
0
0.2
0.4
0.6
0.8A
mm
oni
a -
Nitr
og
en (
µg
/L)
Time (months)
Station I Station II Station III Station IV
Figure 12 Monthly variations of ammoina nitrogen in the study area during the study period
3.11 Ammonia – Nitrogen
The ammonia - nitrogen concentration ob-served during the study period ranged between 0.23 - 0.62 µg/L. The maximum concentration was found at station II during August 2010, 2011 and 2012 whereas the minimum concen-tration was found at station I during October 2011 (Figure 12). There was not much varia-tion in the concentration during the study pe-riod that was almost within the permissible limit of WHO, 1984. Sithik et al. (2009) and Sundaramanickam et al. (2008) reported higher ammonia concentration which may be due to death and decomposition of phyto-plankton, and also due to the excretion of ammonia by phyto planktonic organism (Damotharan et al., 2010).
From the findings of the present study, it is known that the Uppanar River was moderately polluted. The National Water Policy of 2002 enacted by the Government of India aimed at meeting the challenges that have emerged in
the development and management of water resources including water pollution. If the Government enforces the existing water policy strictly, the rivers can be restored. It is sug-gested to undertake mangrove plantation pro-gramme along the coast on estuarine habitats with Avicennia marina and Rhizophora mu-cronata. It will help the remediation of river pollution due to anthropogenic influences such as industrial development, municipal waste disposal, agricultural waste and domestic run-off.
CONCLUSIONS
As the physico-chemical characteristics of a few of the river water samples exceeded the maximum permissible limit, it could be con-cluded that the Uppanar River was polluted moderately. Further increase in the pollution concentration poses a serious threat to the aquatic organisms and especially water quality
190 P. Mullai et al. / Journal of Water Sustainability 4 (2013) 179-192
of Uppanar River. The results would form a useful tool for the eradication of pollution.
ACKNOWLEDGEMENT
The authors gratefully thank the authorities of the Annamalai University, India for their sup-port and the Ministry of Environment and Forests, New Delhi, India for financial support (F. No. 19-09 / 2006-RE dated 30. 06. 2009).
REFERENCES
Adefemi, S.O. and Awokunmi, E.E. (2010). De-termination of physico-chemical parameters and heavy metals in water samples from Itaogbolu area of Ondo-State, Nigeria. African Journal of Environmental Science and Tech-nology, 4(3), 145-148.
Adeyemo, O.K., Adedokun, O.A., Yusuf, R.K. and Adeleye, E.A. (2008). Seasonal Changes in
Physico-Chemical Parameters and Nutrient Load of River Sediments in Ibadan City, Nige-ria. Global NEST Journal, 10(3), 326-336.
Agarwal, A. and Saxena, M. (2011). Assessment of pollution by physicochemical water parame-ters using regression analysis: a case study of Gagan river at Moradabad-India. Advances in Applied Science Research, 2(2), 185-189.
APHA (1995). Standard methods for the examina-tion of water and wastewater. 16th edition, American Public Health Association, New York, 1995.
Chandra, R., Gupta, M. and Pandey, A. (2011). Monitoring of river Ram Ganga: physi-co-chemical characteristic at Bareilly. Recent Research in Science and Technology, 3(6), 16-18.
Chinedu, S.N., Nwinyi, O.C., Oluwadamisi, A.Y. and Eze, V.N. (2011). Assessment of water quality in Canaanland, Ota, southwest Nigeria. Agriculture and Biology Journal of North America, 2(4), 577-583.
Damotharan, P., Perumal, N.V., Arumugam, M., Vijayalakshmi, S. and Balasubramaniyan, T. (2010). Seasonal variation of physico-chemical characteristics of Point Calimere coastal waters (south east coast of India). Middle-East Journal of Scientific Research, 6(4), 333-339.
De, A.K. (2002). Environmental chemistry. 4th edi-tion, New Age International, New Delhi, India. pp. 232.
EPA (1976). Quality criteria for water use. E.P.A, 440, 1a-76-023, Environmental Protection Agency, Washington, USA.
EPA-PWD (2001). Environmental planning frame work for water resources management in Tamil Nadu, final draft. Public Works Department, Government of Tamil Nadu.
Gasim, M.B., Ismail, B.S., Toriman, E., Mir, S.I. and Chek, T.C. (2007). A physico-chemical as-sessment of the Bebar river, Pahang, Malaysia. Global Journal of Environmental Research, 1(1), 7-11.
ICMR (1975). Manual of standard quality for drinking water supplies. 2nd edition, Special Report Series, No. 44.
IS: 10500 (1991). Indian standards of Drinking Water Specification. Bureau to Indian Standards (BIS), New Delhi, India.
Joseph, P.V. and Jacob, C. (2010). Physicochemi-cal characteristics of Pennar river, A fresh water wetland in Kerala, India. E-Journal of Chemis-try, 7(4), 1266-1273.
Khare, R., Khare, S., Kamboj, M. and Pandey, J. (2011). Physico-chemical analysis of Ganga river water. Asian Journal of Biochemical and Pharmaceutical Research, 1(2), 232-239.
Kumar, A., Bisht, B.S., Joshi, V.D., Singh, A.K. and Talwar, A. (2010). Physical, chemical and bacteriological study of water from rivers of Uttarakhand. Journal of Human Ecology, 32(3), 169-173.
Mahananda, M.R., Mohanty, B.P. and Behera, N.R. (2010). Physico-chemical analysis of surface and ground water of Bargarh district, Orissa,
P. Mullai et al. / Journal of Water Sustainability 4 (2013) 179-192 191
India. International Journal of Research and Reviews in Applied Sciences, 2(3), 284-295.
Manikannan, R., Asokan, S. and Ali, A.H.M.S. (2011). Seasonal variations of physi-co-chemical properties of the Great Ve-daranyam Swamp, Point Calimere wildlife sanctuary, south-east coast of India. African Journal of Environmental Science and Tech-nology, 5(9), 673-681.
Mullai, P., Bibin Oommen and Yogeswari M.K. (2013). Dispersion prediction in the Uppanar River of South East Coast of India. Journal of Water Sustainability, 3(1), 29-43.
Mullai, P., Yogeswari, M.K., Bibin Oommen, Saravanakumar, K. and Kathiresan, K. (2012). Application of QUASAR modelling in the Up-panar River of Cuddalore District of Tamil Nadu, India. Environmental Engineering Re-search, 17(1), 53-56.
Mullai, P., Yogeswari, M.K., Saravanakumar, K. and Kathiresan, K. (2011). Degradation of heavy metals by metal-tolerant bacteria (Klebseilla oxytoca) isolated from Uppanar River, Cuddalore, South East Coast of India. Advances in Environmental Research - An In-terdisciplinary Approach, Annamalai Nagar – 608002. Annamalai University, 11-12 March 2011, Annamalai, India.,
Murphy, J. and Riley, J.P. (1962). A modified sin-gle solution method for the determination of phosphate in natural waters. Analytica Chimica Acta, 27(1), 31-36.
Nayak, N.K., Acharya, B.C., Panda, U.C., Nayak, B.B. and Acharya, S.K. (2004). Variation of water quality in Chilika lake, Orissa. Indian Journal of Marine Sciences, 33(2), 164-169.
Prabu, V.A., Rajkumar, M. and Perumal, P. (2008). Seasonal variations in physico-chemical char-acteristics of Pichavaram mangroves, southeast coast of India. Journal of Environmental Biol-ogy, 29(6), 945-950.
Sankar, R., Ramkumar, L., Rajkumar, M., Sun, J. and Ananthan, G. (2010). Seasonal variations in physico-chemical parameters and heavy metals
in water and sediments of Uppanar estuary, Nagapattinam, India. Journal of Environmental Biology, 31(5), 681-686.
Shraddha, S., Rakesh, V., Savita, D. and Praveen, J. (2011). Evaluation of water quality of Narmada river with reference to physicochemical param-eters at Hoshangabad city, MP, India. Research Journal of Chemical Sciences, 1(3), 40-48.
Singh, P., Saharan, J.P., Sharma, K. and Saharan, S. (2010). Physico-chemical & EDXRF analysis of groundwater of Ambala, Haryana, India. Re-searcher, 2(1), 68-75.
Sithik, A.M.A., Thirumaran, G., Arumugam, R., Kannan, R.R.R. and Anantharaman, P. (2009). Physico-chemical parameters of holy places Agnitheertham and Kothandaramar temple. Southeast Coast of India. American-Eurasian Journal of Scientific Research, 4(2), 108-116.
Soundarapandian, P., Premkumar, T. and Dina-karan, G.K. (2009). Studies on the physi-co-chemical characteristic and nutrients in the Uppanar estuary of Cuddalore, south east coast of India. Current Research Journal of Biologi-cal Science, 1(3), 102-105.
Strickland, J.D.H. and Parsons, T.R. (1972). A practical handbook of sea water analysis. 2nd edition, Bulletin No. 167, Fisheries Research Board, Canada, Ottawa, Onto.
Sundaramanickam, A., Sivakumar, T., Kumaran, R., Ammaiappan, V. and Velappan, R. (2008). A comparative study of the physico-chemical in-vestigation along Parangipettai and Cuddalore coast. Journal of Environmental Science and Technology, 1(1), 1-10.
Umamaheswari, S. and Anbu Saravanan, N. (2009). Water quality of Cauvery river basin in Trichirappalli, India. International Journal of Lakes and Rivers, 2(1), 1-20.
Usharani, K., Umarani, K., Ayyasamy, P.M., Shanthi, K. and Lakshmanaperumalsamy, P. (2010). Physico-chemical and bacteriological characteristics of Noyyal river and ground wa-ter quality of Perur, India. Journal of Applied Sciences and Environmental Management,
192 P. Mullai et al. / Journal of Water Sustainability 4 (2013) 179-192
14(2), 29-35.
WHO (1984). Guidelines for Drinking Water Quality. World Health Organization, Geneva.
Yadav, R.C. and Srivastava, V.C. (2011). Physi-co-chemical properties of the water of river
Ganga at Ghazipur. Indian Journal of Scientific Research, 2(4), 41-44.
Yisa, J. and Jimoh, T. (2010). Analytical studies on water quality index of river Landzu. American Journal of Applied Sciences, 7(4), 453-458.