U n d e r s t a n d i n g the in te r re la t ion between the ba nk ing system and the econ- omy, and the c o n c o m i t a n t issues of m o n e y supply, Federa l Reserve policy, and interest rates, is cr i t ical ly dependen t on unde r s t and ing the compet i t ive s t ructure in banking . F a m a (1985), observ ing tha t commerc ia l p a p e r is a near ly perfect subst i tu te for certificates of depos i t s (CDs), concludes tha t the ba nk ing indus t ry has some degree of m a r k e t power in lending, or banks would be dr iven from a compet i t ive credi t m a r k e t by ins t i tu t ions with a lower cost of funds (to the extent banks use C D s as a source of funds). The pos i ted source of this m a r k e t
58 T.F. Cosimano, B. McDonald~Journal of Monetary Economics 41 (1998) 57-70
power is the comparative advantage of banks in processing information about borrowers' probability of default.
Although not an integral part of Fama's paper, his analysis implies that a perfectly competitive structure exists within the banking industry. There is not a consensus in the literature modeling banks on the appropriate competitive structure, with models proposed for virtually all combinations of monop- oly/perfectly competitive markets that can be assumed for the various units of analysis-individual banks, the banking industry and other financial intermedia- ries. 1 In this paper, we empirically assay whether monopoly power extends to the level of individual banks by examining their market value of equity at the time the reserve requirement on CDs was eliminated.
To simplify our initial discussion we employ the limiting cases of perfect competition versus a monopoly to analyze the long run impact of the reserve requirement change. 2 In this context, market power could be an artifact of two distinct phenomena: (1) bank loans might be perfect substitutes for each other, but imperfect substitutes for other forms of credit, or (2) bank loans may be unique at the level of the individual banks. In the first case, the banking industry has market power relative to other financial intermediaries, but the banking industry itself would be perfectly competitive. In the second case, individual banks have market power not only relative to other financial intermediaries, but also relative to other banks. We will refer to the former case of bank industry- level monopoly power as interindustry, and the latter case of bank-level monop- oly power as intraindustry.
Under Fama's scenario, the benefits of eliminating the reserve requirement should accrue to borrowers, if there is perfect interindustry competition. On the other hand, if individual banks have monopoly power, at least 100% of the direct benefit will go to banks' stockholders. That is, with monopoly power, banks will receive all of the released funds, plus, depending on the degree of loan demand elasticity, the potential of increased profits (since loan rates could be lowered). Given Fama's insights, empirical proof of banks' market power rela- tive to other financial intermediaries is self-evident, with CD and commercial
1 A useful survey of this literature appears in Bhattacharya and Thakor (1993).
z The discussion of market structure in banking potentially includes terminology from competing theories. Fama assumes an industry equilibrium where price is equal to marginal cost and economic profits are zero. These characteristics are satisfied in a perfectly competitive industry in the long run. A contestable market would also satisfy these conditions, as would an imperfectly competitive industry subject to Bertrand competition. Consequently, failure to satisfy these conditions would imply an imperfectly competitive market with some tacit collusion (see Tirole, 1990). In our empirical tests, using the simple dichotomy of perfect markets/monopoly produces a sharp null hypothesis of no effect. Clearly, under more general definitions, the null hypothesis of perfect competition could produce positive valuation effects in the short term that would be some fraction of the total reduction in costs. The magnitude of our empirical results and subsequent robustness tests indicate that such competing explanations are unlikely.
T.F. Cosimano, B. McDonald~Journal of Monetary Economics 41 (1998) 57-70 59
rates being essentially equivalent and banks, actively using CDs as a source of funds, not being driven from the credit market.
On 4 December 1990 the Federal Reserve System announced a change in the reserve requirement from 3 to 0% on non-personal time accounts, releasing more than $13.5 billion in bank reserves and yielding an estimated annual benefit of $1 billion. At the time of the announcement it was believed this change would increase bank profits and the supply of loans for credit-worthy borrowers. 3 The reserve requirement is usually characterized as an implicit tax on banks. Like any other tax, the actual incidence of the reserve requirement depends on the degree of monopoly power and the elasticity of demand and supply for the product. 4
In the next section, Fama's model of banking is discussed in the context of the reserve requirement changes and under various market structure scenarios. Section 3 uses a standard event study framework to estimate the extent of benefits, if any, accruing to banks as a result of the change in reserve require- ments. We find that the gains capitalized in the value of banks' equity at the time of the policy announcement are greater than the direct benefit, supporting the notion of monopoly power and a loan elasticity greater than one. Our results indicate that the monopoly power is vested at the level of individual banks, i.e., intraindustry. This form of monopoly power precludes theories of banking that assume informational advantages that are not unique at the level of individual banks. To the extent informational advantages at the bank level cannot sustain monopoly power over the long run, alternative arguments must be considered (e.g., regulation, economies of scale, or Benson's (1980) argument for locational advantages). Conclusions are presented in Section 4.
2. The incidence of reserve requirements
Reserve requirements force banks to hold a fixed percentage of their deposits in the form of reserves earning no interest, thus imposing an indirect unit tax on banks. The incidence of this tax is dependent on the elasticity of demand and supply of loanable funds along with the industry's competitive structure. Fama (1985) provides a partial equilibrium analysis of this tax. Observing that
3 See Murray and Bacon in the Wall Street Journal of 5 December 1990.
4 See Dwyer and Saving (1986), Romer (1985) and Sargent and Wallace (1985) for a discussion of reserve requirements and the incidence of this tax in a general equilibrium context. Osborne and Zaher (1992) and Slovin et al. (1990) examine the impact of all reserve requirement changes in the 1970s and 1980s. Possibly because of the incremental nature of these changes, these studies do not focus on identifying the degree of monopoly power. Keeley (1990) examines the relation between changes in competition and banks ' willingness to take on risk using Tobin 's q to measure market power. He finds that this measure declined throughout the 1970s and subsequently increased in the 1980s.
60 T.F. Cosimano, B. McDonaM/Journal of Monetary Economics 41 (1998) 57 70
commercial paper is a perfect substitute for negotiable CDs, he concludes that the banking industry must have some comparative advantage in issuing loans. Given banks' higher cost of funds resulting from the reserve requirement, the hypothesis concerning the uniqueness of bank loans follows. The monopoly power is attributed to the loans being inside debt. Consequently, idiosyncratic information is directly observable by the banks, providing them a low cost means of monitoring the borrower's credit history)
To provide a more precise basis for our discussion, we examine the theoretical response of banks to the removal of the reserve requirements in the context of Fama's graphical analysis. We characterize the problem in Fig. 1 and retain the graphical constructs introduced by Fama. 6
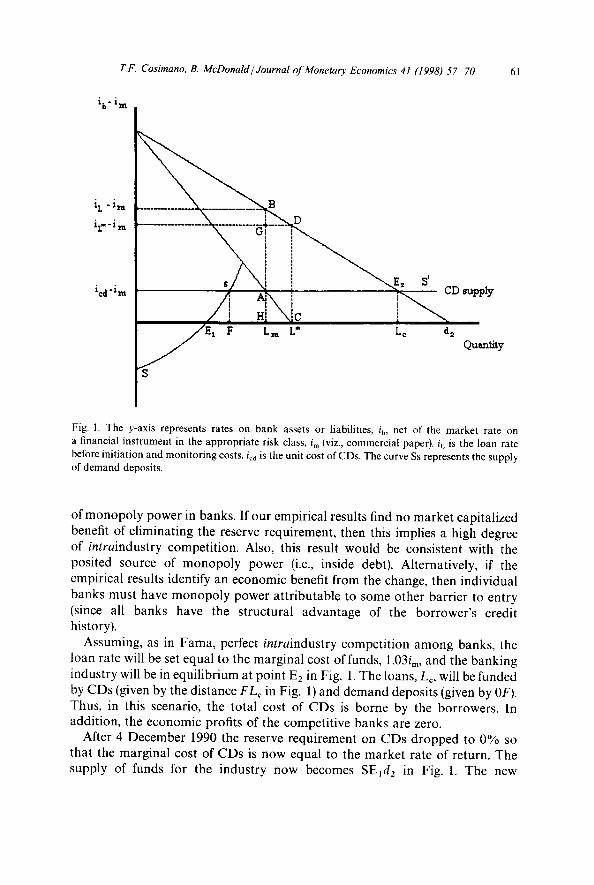
Following Fama, the banks' supply of funds has two components: (1) demand deposits and (2) negotiable CDs. The supply of demand deposits, represented by the curve Ss in Fig. 1, is assumed to be positively related to the spread between the deposit rate, iD, and the market interest rate, im. The supply of negotiable CDs, represented by the horizontal line sS' in Fig. 1, is perfectly elastic, given the premise that CDs are perfect substitutes for commercial paper. The marginal cost of CDs is above the x-axis, depicting the cost structure imposed by the reserve requirement of 3% on CDs before 4 December 1990. So, the spread between CDs and the commercial paper rate, iCD - im, or the incremental cost of CDs is equal to 0.03ira. The bank chooses the funding source with the lowest marginal cost, thus, the average cost of funds to the industry is represented by the curve SsS'. Borrowers in Fama's model do not have perfect substitutes for bank loans because of their difficulty in conveying the true probability of default, therefore the demand for loans is depicted as not perfectly elastic and is positively related to the spread between the loan rate, iL, and the market interest rate.
Notice that our initial discussion of monopoly power is in the context of the banking industry versus other financial intermediaries. Fama's posited source of monopoly power in banks (i.e., access to unique credit history through demand deposits), only implies an interindustry advantage. It does not preclude perfect competition within the banking industry. This is important in considering our empirical results. Fama's paper convincingly establishes that there is some form
5 Recent models by Sharpe (1990) and Rajan (1992) extend the argument of banks ' comparative advantage in monitor ing borrowers to a more complex information environment. Boot and Thakor (1996) analyze how relationship loans are influenced by the degree of monopoly power.
6As in Fama all rates measured on the y-axis are net of the market rate of return, (im), for non-bank securities in the relevant risk class (viz., commercial paper). The rates on bank liabilities (demand deposits and CDs), are expressed in terms of unit costs. Loan rates do not include initiation and monitor ing costs. Only the case of strong loan demand is considered, where CDs are being used as a source of funds. Also, for simplicity, we retain the assumpt ion that CDs are perfect substitutes for commercial paper.
T.F. Cosimano, B. McDonald/Journal of Monetary Economics 41 (1998) 57-70 61
i b- i m
i L - i m
iL- - i ra
ied - i m
. B
D
D supply
t t F Lra L* L c d 2 E Qun_ntity
Fig. 1. The y-axis represents rates on bank assets or liabilities, ib, net of the m a r k e t rate on a f inancial i n s t rumen t in the appropr ia te risk class, i m (viz., commerc ia l paper), iL is the loan rate before ini t iat ion and mon i to r ing costs, icd is the uni t cost of CDs. The curve Ss represents the supply of d e m a n d deposits .
of monopoly power in banks. If our empirical results find no market capitalized benefit of eliminating the reserve requirement, then this implies a high degree of intraindustry competition. Also, this result would be consistent with the posited source of monopoly power (i.e., inside debt). Alternatively, if the empirical results identify an economic benefit from the change, then individual banks must have monopoly power attributable to some other barrier to entry (since all banks have the structural advantage of the borrower's credit history).
Assuming, as in Fama, perfect intraindustry competition among banks, the loan rate will be set equal to the marginal cost of funds, 1.03ira, and the banking industry will be in equilibrium at point E2 in Fig. 1. The loans, Lc, will be funded by CDs (given by the distance FLc in Fig. 1) and demand deposits (given by OF). Thus, in this scenario, the total cost of CDs is borne by the borrowers. In addition, the economic profits of the competitive banks are zero.
After 4 December 1990 the reserve requirement on CDs dropped to 0% so that the marginal cost of CDs is now equal to the market rate of return. The supply of funds for the industry now becomes SE1d2 in Fig. 1. The new
62 T.F. Cosimano, B. McDonaM/Journal of Monetary Economics 41 (1998) 57-70
equilibrium with perfect intraindustry competition would be at d 2 , with the amount of loans given by the distance 0 d 2. The amount of CDs is now given by Eld2. These results imply that all benefits from removing the reserve require- ment are passed onto the bo r rower , / f banks are intraindustry competitive.
If instead, we assume that there is one monopoly bank to illustrate the impact of barriers to entry, then benefits will accrue to this bank. This perspective is illustrated by including a marginal revenue curve in Fig. 1. Given the same demand for loans, the optimal decision of the bank under the 3% reserve requirement is to issue the loans, LM, where marginal revenue would be equal to marginal cost (point A in Fig. 1). Extending this point to the demand curve (point B) provides the loan rate (iL - - ira). Thus, the bank's abnormal profits are given by the rectangle ( i cd- im)AB(iL- im). With no reserve requirement on CDs, the optimal decision is L* (point C). The loan rate derived from the intersection with demand (point D) is now reduced t o i L , - - ira. In addition the retail deposit rate drops from point s to El.
Thus, in this case, removing the reserve requirement increases banks' profits. The increase consists of three components. First, the bank will recoup the capitalized value of funds held in reserve, represented by the area FHAs. Second, profits will also change to an extent determined by the elasticity of demand for loans, i.e., the extent to which the area H C D G is greater than ( i L , - - im)GB(iL - im)" We know that the former area will always be greater than the latter for the case of a monopoly since the elasticity of demand must be greater than one. The third source of profits is OFs(icd -- im), which represents the reduced cost of demand deposits. 7 Kamien and Schwartz (1970) prove that the size of the benefit going to the monopolist bank is larger for more elastic linear demand curves. The change in the spread between the loan rate and the market rate, as well as the change in quantity of loans, is also larger, for more elastic demand curves.
3. Empirical observations
We examine empirically the structure of competit ion in banking by first determining if any benefits of eliminating the reserve requirements on
7 Hannan and Berger (1991) and Neumark and Sharpe (1992) both provide evidence of monopoly power in the retail deposit market. This monopoly power would raise the size of this third source. For a linear supply curve Hannan and Berger show that the marginal gain, expressed in terms of our application, is only 0.25(0.03im) 2. Thus, the effect of reducing demand deposit cost should be trivial relative to the first effect. For example, with a 10% change in M2 and the total gain estimated in the next section, this monopoly power would imply an elasticity of supply of only 8.6 10E-8. In addition, the existence of monopoly power in the loan market is necessary for the first effect to exist, otherwise, as pointed out by Fama, the benefit would be passed on to the borrowers.
T.F. Cosimano, B. McDonald~Journal of Monetary Economics 41 (1998) 57-70 63
4 December 1990 were capitalized in banks' equity values using a standard event study approach. We then provide some graphical observations on interest rates and quantity of loans around the event period and consider the robustness of our results to competing hypotheses.
3.1. Event study results
To determine whether the market perceived any benefits from this event accruing to banks, we examine the behavior of common stock returns for a sample of banks when the change was first announced. We define the event period as 4 and 5 December 1990. 8
If an effect on bank stocks is observed, it should be related to the relative quantity of non-personal time accounts used as a source of financing by each bank. Our sample includes all securities with valid observations for the Annual Bank C O M P U S T A T variable negotiable CDs in excess of $100000. This variable is actually a superset of the targeted information, but should provide a reasonable proxy for the deposits impacted by the change in reserve require- ments. The sample banks must also have available on the CRSP NYSE/AMEX or NASDAQ files at least 15 return observations in the 250-day interval preceding the event dates, and complete returns for the two event dates. These criteria produced a sample of 105 banks.
Descriptive statistics for the sample are reported in Table 1, panel A. The average bank in the sample had total assets of $16.3 billion, with roughly 90% of the sample having total assets greater than $1 billion. Thus, all of our empirical results should be interpreted in the context of large banks. The sum of total assets for all banks in the sample is $1.717 trillion, representing about 40% of all commercial bank and S&L assets in the United States as of December 1990 (based on Federal Reserve Bulletin data). The corresponding proportion for the dollar amount of CDs represented in our sample is about 30%. National banks comprise 56% of the sample with the remaining banks classified as state chartered commercial banks. The raw event period returns for the two event days of 2.8 and 5.0% reported in the table foreshadow the significance of subsequent formal tests and suggest that the response was substantial across both event days.
Since the event is contemporaneous across the sample, significance of the event period return can be measured by aggregating the returns cross-sectionally
There was no evidence that the FED announcement was uninformative because of prior expectations. A search of the Wall Street Journal identified the following sequence of articles. The first article, by Murray and Bacon on 4 December 1990, mentioned the possibility of a cut in the reserve requirement. This story came across the Broadtape at 7:33 a.m. on 4 December 1990. A second article, by Alcorn and Bauman, contained the actual FED announcement and was on the Dow Jones News Wire at 10:16 a.m. on 4 December 1990. The announcement was reported in the Wall Street Journal by Murray and Bacon on 5 December 1990.
64 T.F. Cosimano, B. McDonaM /Journal of Monetary Economics 41 (1998) 57-70
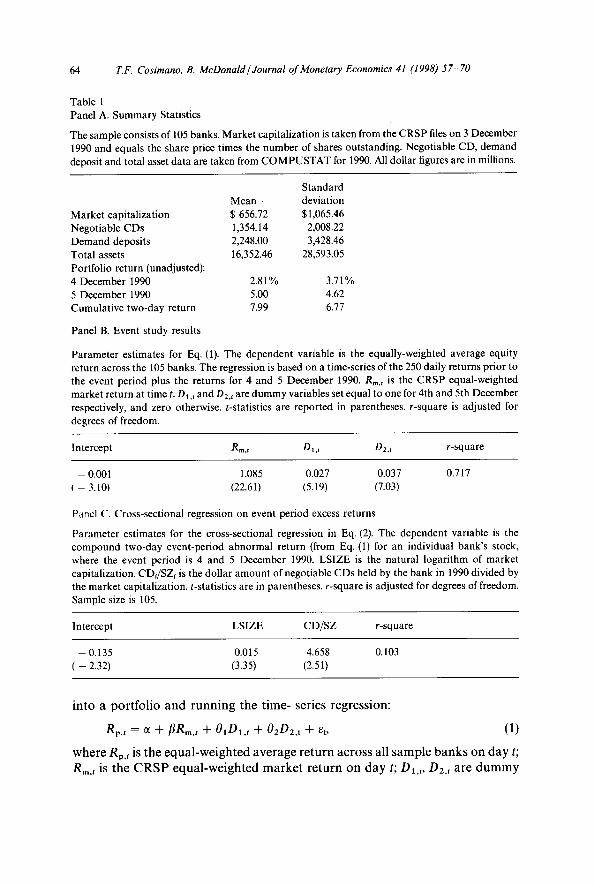
Table 1 Panel A. Summary Statistics
The sample consists of 105 banks. Market capitalization is taken from the CRSP files on 3 December 1990 and equals the share price times the number of shares outstanding. Negotiable CD, demand deposit and total asset data are taken from COMPUSTAT for 1990. All dollar figures are in millions.
Market capitalization Negotiable CDs Demand deposits Total assets Portfolio return (unadjusted): 4 December 1990 5 December 1990 Cumulative two-day return
Panel B. Event study results
Standard Mean deviation $ 656.72 $1,065.46 1,354.14 2,008.22 2,248.00 3,428.46 16,352.46 28,593.05
2.81% 3.71% 5.00 4.62 7.99 6.77
Parameter estimates for Eq. (1). The dependent variable is the equally-weighted average equity return across the 105 banks. The regression is based on a time-series of the 250 daily returns prior to the event period plus the returns for 4 and 5 December 1990. Rm.t is the CRSP equal-weighted market return at time t. D~., and D2,t are dummy variables set equal to one for 4th and 5th December respectively, and zero otherwise, t-statistics are reported in parentheses, r-square is adjusted for degrees of freedom.
Pane~ C. Cross-sectional regression on event period excess returns
Parameter estimates for the cross-sectional regression in Eq. (2). The dependent variable is the compound two-day event-period abnormal return (from Eq. (1) for an individual bank's stock, where the event period is 4 and 5 December 1990. LSIZE is the natural logarithm of market capitalization. CDI/SZI is the dollar amount of negotiable CDs held by the bank in 1990 divided by the market capitalization, t-statistics are in parentheses, r-square is adjusted for degrees of freedom. Sample size is 105.
Intercept LSIZE CD/SZ r-square
- 0.135 0.015 4.658 0.103 ( - 2.32) (3.35) (2.51)
i n t o a p o r t f o l i o a n d r u n n i n g t h e t i m e - ser ies r e g r e s s i o n :
Rp, t = ~ + fiRm, t + OlOl , t + 02D2, t +/3t, (1)
w h e r e Rp, t is t h e e q u a l - w e i g h t e d a v e r a g e r e t u r n a c r o s s all s a m p l e b a n k s o n d a y t;
Rm, t is t h e C R S P e q u a l - w e i g h t e d m a r k e t r e t u r n o n d a y t; DI,, , D2,t a r e d u m m y
T.F. Cosimano, B. McDonaM/Journal of Monetary Economics 41 (1998) 57 70 65
variables set equal to one for 4 and 5 December 1990, respectively; ~,fl, and 0 are estimated parameters; and e is the regression error. The null hypothesis is then 01 + 02 = 0, i.e., the total event period return is equal to zero. 9
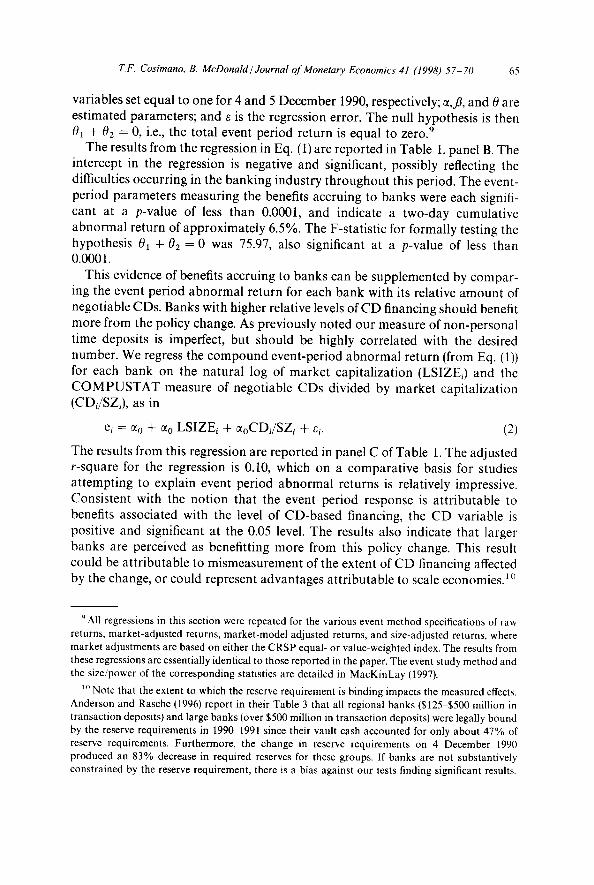
The results from the regression in Eq. (1) are reported in Table 1, panel B. The intercept in the regression is negative and significant, possibly reflecting the difficulties occurring in the banking industry throughout this period. The event- period parameters measuring the benefits accruing to banks were each signifi- cant at a p-value of less than 0.0001, and indicate a two-day cumulative abnormal return of approximately 6.5%. The F-statistic for formally testing the hypothesis 01 + 02 = 0 was 75.97, also significant at a p-value of less than 0.0001.
This evidence of benefits accruing to banks can be supplemented by compar- ing the event period abnormal return for each bank with its relative amount of negotiable CDs. Banks with higher relative levels of CD financing should benefit more from the policy change. As previously noted our measure of non-personal time deposits is imperfect, but should be highly correlated with the desired number. We regress the compound event-period abnormal return (from Eq. (1)) for each bank on the natural log of market capitalization (LSIZEi) and the COMPUSTAT measure of negotiable CDs divided by market capitalization (CDi/SZi), as in
ei = 7o + ~o LSIZEi + %CDI/SZi + ei. (2)
The results from this regression are reported in panel C of Table 1. The adjusted r-square for the regression is 0.10, which on a comparative basis for studies attempting to explain event period abnormal returns is relatively impressive. Consistent with the notion that the event period response is attributable to benefits associated with the level of CD-based financing, the CD variable is positive and significant at the 0.05 level. The results also indicate that larger banks are perceived as benefitting more from this policy change. This result could be attributable to mismeasurement of the extent of CD financing affected by the change, or could represent advantages attributable to scale economies.~°
9 All regressions in this section were repeated for the various event method specifications of raw returns, market-adjusted returns, market-model adjusted returns, and size-adjusted returns, where market adjustments are based on either the CRSP equal- or value-weighted index. The results from these regressions are essentially identical to those reported in the paper. The event study method and the size/power of the corresponding statistics are detailed in MacKinLay (1997).
lo Note that the extent to which the reserve requirement is binding impacts the measured effects. Anderson and Rasche (1996) report in their Table 3 that all regional banks ($125 $500 million in transaction deposits) and large banks (over $500 million in transaction deposits) were legally bound by the reserve requirements in 199~1991 since their vault cash accounted for only about 47% of reserve requirements. Furthermore, the change in reserve requirements on 4 December 1990 produced an 83% decrease in required reserves for these groups. If banks are not substantively constrained by the reserve requirement, there is a bias against our tests finding significant results.
66 72F. Cosimano, B. McDonald~Journal of Monetary Economics 41 (1998) 57-70
As previously emphasized, more interesting in this case than the traditional event study tests of significance, is the economic interpretation of the results, since the theory prescribes a minimum level of benefit on the event date under the alternative hypothesis ofintraindustry monopoly power. We next attempt to measure the economic magnitude of this benefit by applying the previous results to aggregate data for the banking industry. Our sample constitutes about 30% of the dollar amount of large CDs reported in December of 1990. The Federal Reserve estimated that $13.5 billion in reserves would be affected (this includes reserves for net Eurocurrency liabilities), implying a total benefit available to banks or bank customers in our sample of about $4 billion. 11 The dollar appreciation in the sample of bank stocks over the event period was $6.25 billion, lz Thus, consistent with the theory under the alternative hypothesis of intraindustry monopoly power, the results indicate all of the direct benefit was capitalized in the banks' stocks. And, within the precision of our aggregate estimates, the difference between the capitalized benefit and the direct benefit ($6.25 billion versus $4 billion), implies an elasticity of demand for loans greater than one. The fact that the measured effect is greater than the discounted value of money released also implies that the characterization of imperfect competi- tion is not a temporary aberration.
In summary, the event study tests allow us to establish a specific nontrivial hurdle for the alternative hypothesis of intraindustry monopoly power. The magnitude of this posited change precludes many competing hypotheses that could cause a statistically significant abnormal return not necessarily attribu- table to the scenario we have described. That is, in the analysis of competitive structures in banking, most competing hypotheses would imply a substantially smaller response than the one observed in this study. 13
3.2. Descriptive statistics on the rates and loans around the event period
In the previous section we showed that all of the direct benefit from the reserve requirement change accrued to banks, implying some degree of monop- oly power for individual banks. From the theoretical framework developed
1~ The value of the released funds is equal to the opportunity cost times the level of finds, discounted at an appropriate rate for all future periods. In subsequent empirical measures we will assume the current level of reserves is representative of future levels and the opportunity rate is equal to the discount rate, therefore allowing us to approximate this benefit using the absolute dollar amount currently in reserves.
12 This is the compound two-day abnormal return for each stock from Eq. (1), multiplied times its market capitalization. The point estimate for the dollar impact ranged from $6.23 to $7.59 billion for the various combinations of measuring event-period returns itemized in footnote 9.
3 One possible competing hypothesis where the magnitude of the effect cannot necessarily be predicted is based on signaling by the FED. We consider this case in Section 3.3.
T.F. Cosimano, B. McDonald~Journal of Monetary Economics 41 (1998) 57-70 67
in Fig. 1, information on the change in interest rates on loans and the quantity of loans during this period should provide more specific measures of the elasticity of demand. Although we do consider measures of these items, note that the effect on rates and quantity are not capitalized as they were for tests on stock returns. Thus, for example, even if no benefits accrued to banks and loan rates dropped by the full amount, the change in rates would only be 0.03ic~, which given prevailing CD rates at the time implies a change in rates of less than 0.25%. And, to the extent the elasticity of demand is greater than one, the change will be even less.
In Fig. 2 we plot a weekly time-series of relevant rates from March 1990 to November 1991 provided by the St. Louis Federal Reserve and Bank Rate Monitor. Depicted in the figure are rates for secondary 90-day CDs, 60 day commercial paper, automobile loans, and personal loans. The commercial paper/CD time-series reaffirms Fama's assertion of these instruments being nearly perfect substitutes. If the effects of the policy change are measurable, we expect to see a drop in the spread between loan rates and CD rates, which
18%
16%
14%
12%
10%
8%
6%
PERSONAL
AUTO
P
CD 4%
-40 -30 -20 -10 0 10 20 30 40 50
Event time (in weeks)
Fig. 2. Interest rates on certificates of deposit (CD), commercial paper (CP), automotive loans (AUTO), and personal loans (PERSONAL). Rates are reported weekly with time = 0 the week including 4 and 5 December 1990. The plotted series begins on 27 March 1990 and continues through 19 November 1991.
68 T.F. Cosimano, B. McDonald~Journal of Monetary Economics 41 (1998) 57 70
$205
$200
$Ig5
~ $185 -
I $180,
o r¢
$175
$170
$165 -160
. . . . . . R e t a i l l o a n s ( t h o u s a n d s ) : " ; • - , :',
T o t a L o a n s ( m i l l i o n s ) , , ~ , "v" ll:i,. . '. o, ,'~ , ' . . , ' - ' . , . , . . " " ' ,
,%. a =
$1.8
$1.8
$1.7
• $1.7 i
• $1.6 m g 0 , J
$1.6 m o p-
$1.5
$1.5
$14
- 1 ~ - I ~ . 1 ~ -80 -60 J O - ~ O
Event t ime (in w e e k s )
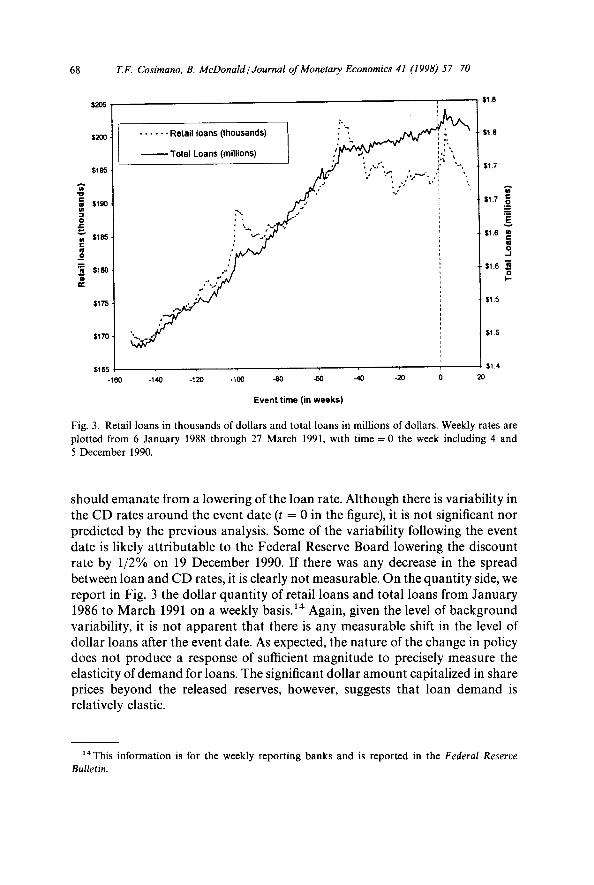
Fig. 3. Retail loans in thousands of dollars and total loans in millions of dollars. Weekly rates are plotted from 6 January 1988 through 27 March 1991, with time = 0 the week including 4 and 5 D e c e m b e r 1990.
should emanate from a lowering of the loan rate. Although there is variability in the CD rates around the event date (t = 0 in the figure), it is not significant nor predicted by the previous analysis. Some of the variability following the event date is likely attributable to the Federal Reserve Board lowering the discount rate by 1/2% on 19 December 1990. If there was any decrease in the spread between loan and CD rates, it is clearly not measurable. On the quantity side, we report in Fig. 3 the dollar quantity of retail loans and total loans from January 1986 to March 1991 on a weekly basis. 14 Again, given the level of background variability, it is not apparent that there is any measurable shift in the level of dollar loans after the event date. As expected, the nature of the change in policy does not produce a response of sufficient magnitude to precisely measure the elasticity of demand for loans. The significant dollar amount capitalized in share prices beyond the released reserves, however, suggests that loan demand is relatively elastic.
1*This information is for the weekly reporting banks and is reported in the Federal Reserve Bulletin.
T.F. Cosimano, B. McDonald/Journal o f Monetary Economics 41 (1998) 57 70 69
3.3. Competing hypotheses
A competing explanation for our results is that the banks are simply very sensitive to more subtle signals that may be conveyed in any FED announce- ment. That is, instead of the explicit effects tested in this study, the positive stock price reaction may be an artifact of more implicit signals in the announcement itself. Although we cannot test this competing hypothesis directly, we do consider the general issue of sensitivity to FED announcements by examining a time series of money supply announcements. Using survey data to measure the unanticipated component of money supply announcements, we run the follow- ing regression for daily returns from 3 January 1985 to 30 October 1990:
Rp, t :- o~ + f iRm, t -1- 0 UMt + e,, (3)
where Rp is the return on the portfolio of sample banks, R m is the CRSP equal-weighted market return, and UM is the unanticipated change in the money supply (measured as the announced change minus the survey mean for the expected change taken from Money Market Services, Inc.). Since the money supply announcements are weekly, UM is assigned a non-zero value equal to the measured unanticipated change for the trading day following the announcement date (since the announcements occur after the market is closed). The t-statistic on the coefficient associated with UM is - 0.34. This insignificant response to a relatively important signal produced by the FED suggests that our findings are not an artifact of general sensitivity to policy announcements.
4. Conclusions
The most fundamental issue in the economic analysis of banks, their raison d'etre, has yet to be satisfactorily resolved. Although there is no shortage of competing theories, none have been generally embraced as a unifying founda- tion. Understanding the competitive structure in banking is an important component in resolving this question and its concomitant issues. Fama provides a simple and convincing argument for monopoly power in banks at the industry level. He presents these findings in the context of an interindustry monopoly, with individual banks being perfectly competitive. We extend his results by examining the beneficiaries of the elimination of the reserve requirement on CDs in December 1990.
In short, our results should impact this topic in two ways. First, our evidence indicates the industry has monopoly power at the level of individual banks. Second, the usual information/contracting arguments proffered to explain in- terindustry monopoly power must be supplemented by ones that are consistent with intraindustry monopoly power. These results, together with the recent work documenting the rigidity of retail deposit rates by Hannan and Berger
70 T.F. Cosimano, B. McDonald~Journal o f Monetary Economics 41 (1998) 57-70
(1991), and Neumark and Sharpe (1992), suggest that more attention should be given to developing macroeconomic theories based on a non-competitive banking system.
Acknowledgements
We would like to thank Richard Anderson, Allen Berger, Richard Sheehan, and Daniel Thornton for helping us obtain data for this study. Financial support for Cosimano was provided by the Center for Research in Banking at the University of Notre Dame. We also appreciate the helpful comments of an anonymous referee and the editor, Robert King.
References
Anderson, R.G., Rasche, R.H., 1996. Measuring the adjusted monetary base in an era of financial change. The Federal Reserve Bank of St. Louis Review 78, 3 37.
Benson, B.L., 1980. Spatial microeconomics: Implications for the relationship between concentra- tion of ownership and bank performance. Proceedings of a Conference on Bank Structure and Competition, Federal Reserve Bank of Chicago, pp. 60-85.
Bhattacharya, S., Thakor, A., 1993. Contemporary banking theory. Journal of Financial Intermedi- ation 3, 2-50.
Boot, A.W.A., Thakor, A.V., 1996. Can relationship banking survive competition? Working paper, University of Michigan.
Dwyer, G.P. Jr., Saving, T.R., 1986. Government revenue from money creation with government and private money. Journal of Monetary Economics 17, 239-249.
Fama, E., 1985. What's different about banks?. Journal of Monetary Economics 15, 29 39. Hannan, T.H., Berger, A.N., 1991. The rigidity of prices: Evidence from the banking industry.
American Economic Review 81,938-945. Kamien, M.I., Schwartz, N.L., 1970. Market structure, elasticity of demand and incentive to invent.
Journal of Law and Economics 13, 241-252. Keeley, M.C., 1990. Deposit insurance risk, and market power in banking. American Economic
Review 80, 1183-1200. MacKinLay, A.C., 1997. Event studies in economics and finance. Journal of Economic Literature 35,
13-39. Neumark, D., Sharpe, S., 1992. Market structure and the nature of price rigidity: Evidence from the
market for consumer deposits. Quarterly Journal of Economics 107, 657-680. Osborne, D.K., Zaher, T.S., 1992. Reserve requirements, banks share prices, and the uniqueness of
bank loans. Journal of Banking and Finance 16, 799-812. Rajan, R.G., 1992. Insiders and outsiders: The choice between informed and arm's-length debt.
Journal of Finance 47, 1367-1400. Romer, D., 1985. Financial intermediation, reserve requirements, and inside money. Journal of
Monetary Economics 16, 175-194. Sargent, T., Wallace, N., 1985. Interest on reserves. Journal of Monetary Economics 15, 279 290. Sharpe, S.A., 1990. Asymmetric information, bank lending, and implicit contracts: A stylized model
of customer relationships. Journal of Finance 45, 1069 1087. Slovin, M.B., Sushka, M.E., Bendeck, Y.M., 1990. The market valuation effects of reserve regulation.
Journal of Monetary Economics 25, 3 19. Tirole, J., 1990. The Theory of Industrial Organization. MIT Press, Cambridge, MA.