24
JP Morgan Energy Conference June 18 - 20, 2018

JP Morgan Energy Conference June 18 - 20, 2018

Forward-looking Information This presentation contains forward-looking statements. When used in this presentation, the words “will”, “intend”, “plan”, ”potential”, “generate”, "grow", “deliver”, “can”, “continue”, “drive”, “anticipate”, “target”, “come”, “create”, “position”, “achieve”, “seek”, “propose”,
“forecast”, “estimate”, “expect”, “solution”, “outlook”, “assumes” and similar expressions, as they relate to AltaGas or any affiliate of AltaGas (including AltaGas or an affiliate of AltaGas following completion of the WGL Transaction), are intended to identify forward-
looking statements. In particular, this presentation contains forward-looking statements with respect to, among others things, business objectives; strategies; expected returns; expected growth (including growth in normalized EBITDA, normalized funds from operations,
dividends, payout ratios, customers, rate base and the components thereof) and sources of growth; capital spending; cash flow and sources of funds; results of operations; performance; expectations regarding growth and development projects and other opportunities
(including expected EBITDA contributions, capital expenditures, facility design specifications, cost, location and location benefits, ownership, operatorship, ability to expand, retrofit, double capacity, contracting capability, construction expertise, progress of construction;
development timelines; capacity; connection capability to infrastructure; transmission options; options for producers; access to markets; potential end markets; sale and purchase of LPG; export capability; sources of supply; tolling arrangements; shipping costs; and
timeline and targets and expected dates of construction completion; final investment decision; in-service and on-stream), expectations of Ridley Island Propane Export Terminal being Canada’s first west coast propane terminal and potential for first mover competitive
advantages; expectations regarding Astomos’ propane shipments; ability to capture market share and propane processing capacity; expectations on future market prices; access to capital markets; liquidity; target ratios (including normalized FFO to debt and net debt to
EBITDA), increase in gas production and demand for infrastructure in the Montney region; expectations regarding supply and demand for propane; sources of supply and WCSB exports and surpluses; expectations for the longevity and reliability of infrastructure
assets; expectations of third party volumes at Gordondale; expectations with respect to optimizing capacity at Gordondale; expectations regarding future expansion; the quantity and competiveness of pricing; barriers of entry for new gas generation and value of
existing infrastructure; increasing optionality at Blythe, development of solar and battery projects and other renewable projects; potential energy storage opportunities; expected system betterment-related capital expenditures; the timing, scale, and importance of
medium-term midstream projects and the RIPET; the commitment to maintaining a balanced long term mix across three business lines; natural gas pipeline replacement and refurbishment programs; cost, scale, and timing of the Marquette Connector Pipeline and
WGL’s Marcellus pipelines; the stability and predictability of dividends and the sources of funds therefor; expectations regarding volumes and throughput; competitiveness of WCSB gas; AltaGas’ view with respect to the California power market; sources of future
supply and opportunities that may become available for existing AltaGas facilities; commodity exposure; frac spread exposure; hedging exposure; foreign exchange; demand for propane; expectations regarding operating facilities; expected dates of regulatory
approvals, licenses and permits; expected impacts of the US tax reform; and other expected financial results. In particular this presentation also contains forward looking statements with respect to the combination of AltaGas and WGL and related performance,
including, without limitation: the transformative nature of the WGL Transaction; the portfolio of assets of the combined entity; total enterprise value; nature, number, value and timing of growth and investment opportunities available to AltaGas; the quality and growth
potential of the assets; the strategic focus of the business; the combined customers, rate base and customer and rate base growth; growth on an absolute dollar and per share basis; strength of earnings including, without limitation, EPS, EBITDA, EBIT and contributors
and components thereof; annual dividend growth rate, payout ratios, and dividend yield; the ability of the combined entity to target higher growth markets, high growth franchise areas, and other growth markets; the liquidity of the combined entity and its ability to
maintain an investment grade credit rating; balance sheet strength; improved credit metrics and target credit metrics (including in respect of FFO/debt and net debt/EBITDA); the leveraging of respective core competencies and strategies; the ability to deliver high
quality service at reasonable rates; the fact that closing of the WGL transaction is conditioned on certain events occurring; the acceptability of conditions from the Maryland PSC decision, the geographical and industry diversification of the business; the stability of cash
flows and of AltaGas’ business; the growth potential available to AltaGas in clean energy, natural gas generation and retail energy services; the significance and growth potential and expectations for growth in the Montney and Marcellus/Utica; export opportunities;
expectations regarding WGL's midstream investments; intentions for further investment; expectations for normalized EBITDA allocation geographically, by business segments and the other components thereof; expected timing and capex for certain AltaGas and WGL
projects and expected capital investment by business segment; future growth financing strategies; sources of financing and cash flow; long-term target business mix; access to capital; anticipated completion of the WGL Transaction, including certain terms and
conditions thereof and the anticipated completion and timing thereof; execution of permanent financing plans, including the consideration, ownership share, and value of potential asset sales and future offerings; expected closing of the sale of a 35% interest in the
Northwest B.C. Hydro facilities; and the timing and receipt of all necessary regulatory approvals. Information and statements contained in this presentation that are not historical facts may be forward-looking statements.
These statements involve known and unknown risks, uncertainties and other factors that may cause actual results or events to differ materially from those anticipated in such forward-looking statements. Such statements reflect AltaGas’ current views with respect to
future events based on certain material factors and assumptions and are subject to certain risks and uncertainties, including, without limitation, changes in market competition, governmental or regulatory developments, changes in political environment, changes in tax
legislation, general economic conditions, capital resources and liquidity risk, market risk, commodity price, foreign exchange and interest rate risk, operational risk, volume declines, weather, construction, counterparty risk, environmental risk, regulatory risk, labour
relations, any event, change or other circumstance that could give rise to termination of the merger agreement in respect of the WGL Transaction, the inability to complete the WGL Transaction due to the failure to satisfy conditions to completion, including that a
governmental entity may prohibit, delay or refuse to grant approval for the consummation of the WGL Transaction, uncertainty regarding the length of time required to complete the WGL Transaction, the anticipated benefits of the WGL Transaction may not materialize
or may not occur within the time periods anticipated by AltaGas, impact of significant demands placed on AltaGas and WGL as a result of the WGL Transaction, failure by AltaGas to repay the bridge financing facility, potential unavailability of the bridge financing facility
and/or alternate sources of funding that would be used to replace the bridge financing facility, including asset sales on desirable terms, lack of control by AltaGas of WGL and its subsidiaries prior to the closing of the WGL Transaction, impact of acquisition-related
expenses, accuracy and completeness of WGL’s publicly disclosed information, increased indebtedness of AltaGas after the closing of the WGL Transaction, including the possibility of downgrade of AltaGas’ credit ratings, historical and pro forma combined financial
information may not be representative of future performance, potential undisclosed liabilities of WGL, ability to retain key personnel of WGL following the WGL Transaction, risks associated with the loss of key personnel, risks relating to unanticipated costs of
integration in connection with the WGL Transaction, including operating costs, customer loss or business disruption, changes in customer energy usage, and other factors set out in AltaGas’ continuous disclosure documents. Many factors could cause AltaGas’ or any
of its business segments’ actual results, performance or achievements to vary from those described in this presentation including, without limitation, those listed above as well as the assumptions upon which they are based proving incorrect. These factors should not
be construed as exhaustive. Should one or more of these risks or uncertainties materialize, or should assumptions underlying forward-looking statements prove incorrect, actual results may vary materially from those described in this presentation as intended, planned,
anticipated, believed, sought, proposed, forecasted, estimated or expected, and such forward-looking statements included in this presentation herein should not be unduly relied upon. These statements speak only as of the date of this presentation. AltaGas does not
intend, and does not assume any obligation, to update these forward-looking statements except as required by law. The forward-looking statements contained in this presentation are expressly qualified by this cautionary statement.
Financial outlook information contained in this presentation about prospective financial performance, financial position or cash flows is based on assumptions about future events, including, without limitation, economic conditions and proposed courses of action, based
on management’s assessment of the relevant information currently available. Readers are advised to refer to AltaGas’ news release regarding the acquisition of WGL for a further description of the assumptions underpinning the financial outlook information contained in
this presentation relating to the combination of AltaGas and WGL. Readers are cautioned that such financial outlook information contained in this presentation should not be used for purposes other than for which it is disclosed herein.
In this presentation we use certain supplementary measures, including Normalized EBITDA, Normalized Funds from Operations (“FFO”), AFFO and net debt that do not have any standardized meaning as prescribed under U.S. generally accepted accounting principles
(“GAAP”) and, therefore, are considered non-GAAP measures. AltaGas’ method of calculating these non-GAAP measures may differ from the methods used by other issuers. Readers are advised to refer to AltaGas’ Management’s Discussion and Analysis (“MD&A”)
as at and for the three months ended March 30, 2018 for a description of the manner in which AltaGas calculates such non-GAAP measures and for a reconciliation to the nearest GAAP financial measure. In this presentation we also use the Non-GAAP measure
“Earnings Before Interest and Taxes (EBIT)”, which is disclosed in respect of WGL’s business segments only. As described in WGL's annual report on Form 10-K filed with the SEC, WGL considers EBIT to be a performance measure that includes operating income,
other income (expense), earnings from unconsolidated affiliates and is reduced by amounts attributable to non-controlling interests. EBIT is used in assessing the results of each segment's operations.
Readers are also cautioned that these non-GAAP measures should not be considered as alternatives to other measures of financial performance calculated in accordance with GAAP. Additional information relating to AltaGas can be found on its website at
www.altagas.ca. The continuous disclosure materials of AltaGas, including its annual and interim MD&A and Consolidated Financial Statements, Annual Information Form, Information Circular, material change reports and press releases, are also available through
AltaGas’ website or directly through the SEDAR system at www.sedar.com and provide more information on risks and uncertainties associated with forward-looking statements.
Unless otherwise stated, dollar amounts in this presentation are in Canadian dollars.
This presentation does not constitute an offer or solicitation in any jurisdiction or to any person or entity. No representations or warranties, express or implied, have been made as to the accuracy or completeness of the information in this presentation and this
presentation should not be relied on in connection with, or act as any inducement in relation to, an investment decision.
2
3
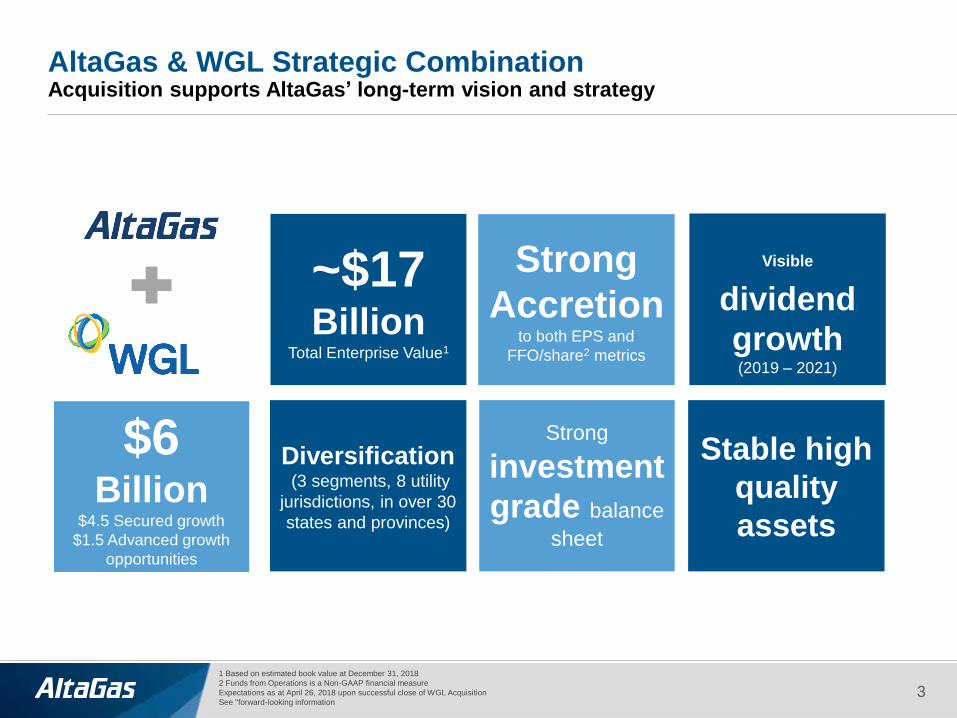
AltaGas & WGL Strategic Combination Acquisition supports AltaGas’ long-term vision and strategy
1 Based on estimated book value at December 31, 2018
2 Funds from Operations is a Non-GAAP financial measure
Expectations as at April 26, 2018 upon successful close of WGL Acquisition
See "forward-looking information
Strong
Accretion to both EPS and
FFO/share2 metrics
Diversification (3 segments, 8 utility
jurisdictions, in over 30
states and provinces)
Stable high
quality
assets
~$17 Billion
Total Enterprise Value1
Visible dividend
growth (2019 – 2021)
$6 Billion
$4.5 Secured growth
$1.5 Advanced growth
opportunities
Strong
investment
grade balance
sheet

AltaGas & WGL Significant Infrastructure Platform High-quality, contracted assets with attractive organic growth
1 AltaGas only; 2 AltaGas’ 1/3 Ownership in Ferndale, and 70% Ownership in Ridley Island Propane Export Terminal; 3 AltaGas expectation as of December 2017, WGL extrapolated
to calendar year end 2017 based on FY2017 rate base and a CAGR of 9.0%, US dollars converted C$1.26/US $1.00
* Expectations as at April 26, 2018, upon successful close of WGL Acquisition
** Normalized EBITDA is a non-GAAP Financial Measure
See "forward-looking information"
~$5B3
Utility Rate base
~1.8 million customers
8 Jurisdictions
Alberta, B.C. and Nova
Scotia in Canada
Alaska, District of
Columbia, Maryland,
Michigan and Virginia
in the U.S.
1,930 MW
of Power Generation
1,259 MW Gas
277 MW Hydro
117 MW Wind
35 MW Biomass
20 MW Energy Storage
222 MW Distributed Generation
~2 Bcf/d1
of Natural Gas
transacted ~70,000 Bbls/d liquids
produced
1,690 Mmcf/d of extraction
capacity
~900 Mmcf/d of FG&P
capacity
2 export terminals2
Interest in four major pipelines
in Marcellus / Utica
4
~75% U.S.
normalized EBITDA
contribution
~25% Canadian
normalized EBITDA
contribution
~80% normalized
EBITDA contracted
with medium and
long-term
agreements

Leading North American Diversified Energy Company Premier footprint in Canada and the U.S.
1 Expectations as at April 26, 2018, FX Rate of C$1.26/US$1, AltaGas standalone,
2 Expectations as at April 26, 2018, 2019E EBITDA is indicative, and based upon successful close of WGL Acquisition and assumed asset monetizations. FX Rate of C$1.26/US$1.00
Normalized EBITDA is a non-GAAP measure.
See "forward-looking information"
All three business segments
will have a premier footprint
in both Canada and the U.S.
5
Segment normalized EBITDA1 (2018F)
Gas ~30%
Utilities ~35%
Power ~35%
Balanced Long-Term
Target Business Mix
Power
Utility
Midstream
Regulated Cash Flow
PPA /
Contract
Cash
Flow
Fee /
Take-or-
Pay Cash
Flow
Segment normalized EBITDA2 (2019F)
Utilities ~40% - 45%
Power ~25% - 30%
Gas ~27% - 32%

-
10
20
30
40
50
Larger Scale Enhances AltaGas’ Competitive Position
6
1 As of Q1 2018
2 As of April 23, 2018
3 Based on estimated book value at December 31, 2018
See “forward-looking information”
Peer Group
Enterprise Value ($ billions)
Increased diversification ~$17 billion3 energy
infrastructure company post-close
Expanded access to
capital and greater
financial flexibility
TSX: ALA Today
$CAD
Common shares outstanding1 177 million
Common share trading price2 $24.51
52-week trading range2 $31.70-$22.82
Market capitalization2 $4.6 billion
Preferred shares2 $1.3 billion
Net debt1 $3.7 billion
Total enterprise value2 $9.6 billion
Corporate credit rating
S&P BBB
DBRS BBB

1 AltaGas has 1/3 interest in Ferndale facility. 2 NEB – Energy Market Assessment. 3 U.S. Energy Information Administration. 4 Source: Desjardins Capital Markets, Natural Gas Report,
March 8, 2018
Expectations as at April 26, 2018 upon successful close of WGL Acquisition
See "forward-looking information"
Combined Midstream in North America’s Most Prolific Gas Plays
Unique opportunity providing critical infrastructure for energy exports at three sites on both the Pacific and Atlantic
Only significant existing West Coast energy export terminal (Ferndale)1 with a second (RIPET) under construction, moving natural gas liquids to key markets including Asia
High grade asset base in sustainable plays drive growth
Strategic footprint in vertically integrated Montney & Marcellus / Utica plays
Montney expected to
grow from ~3 Bcf/d in
2014 to ~9.5 Bcf/d
by 20402
20-year GAIL Supply
Agreement at Cove Point (Cove Point shipped first export
cargo in March 20184)
7
Marcellus production
expected to grow from
~22 Bcf/d to well over
30 Bcf/d3
Strategic infrastructure provides producers with global market access

AltaGas’ Northeast B.C. and Energy Export Strategy Provides NEW market access for Western Canadian propane producers to Asia
8
AltaGas’ propane export
terminal at Ridley Island is
poised to create a hub for key
global markets to the west
Significant shipping
advantages vs. Gulf coast,
providing producers with
increased netbacks
($0.50)
$0.00
$0.50
$1.00
$1.50
$2.00
$2.50
$3.00
Jan-13 Jan-14 Jan-15 Jan-16 Jan-17 Jan-18
Japan Mont Belvieu Edmonton
Historical C3 Prices ($USD/Gal)
See "forward-looking information"

Ridley Island Propane Export Terminal First mover competitive advantage
1 Expectations as at April 26, 2018. Total project cost; ownership will be 70% ALA and 30% Royal Vopak
See "forward-looking information"
Expected to be Canada’s first West
Coast propane export terminal Construction is underway and is expected to be in service by
Q1 2019
Facility designed for 40,000 bbls/d of export capacity
Brownfield site includes existing world class marine jetty with
deep water access, excellent railway access which enables
the efficient loading of Very Large Gas Carriers that can
access key global markets
~10 day to Asia vs. ~25 days from the U.S. Gulf Coast
Astomos Energy Corporation to purchase 50% of the
propane shipped from the facility
Currently have close to 75% of supply secured
Expect at least 40% of the facility’s throughput to be
underpinned by tolling arrangements
Entered into a strategic joint venture with Royal Vopak who
will take a 30 percent interest in the Terminal
Estimated project cost of $450 - $500 million1
9

Marcellus Pipelines Connecting low cost producers with U.S. consumption markets and exports
Mountain Valley
US$350 Million Ownership: EQT (45.5%), NextEra (31%),
ConEd (12.5%), WGL (10%), RGC (1%)
Currently in service
Designed to gather 1.4 Bcf/d from
West Virginia
Target in service Dec. 2018
Designed to transport 2.0 Bcf/d
from West Virginia to Virginia
1 Source: Desjardins Capital Markets, National Gas Report, March 8, 2018
See "forward-looking information" 10
Constitution
US$95 Million
Ownership: Williams (41%), Cabot (25%),
Duke/Piedmont (24%), WGL (10%)
Designed to transport 1.7 Bcf/d as
part of the “Atlantic Sunrise”
project
In service expected mid-2018
Designed to transport 0.65 Bcf/d
to major northeastern markets
Marcellus / Utica Basins
Central Penn
Constitution
Mountain Valley
Stonewall
NH
CT
ME
MA
RI
MD
PA
VT
NY
NJ
OH
IN
DE
KY
MI
NC TN
VA
WV
Cove point
GAIL
Stonewall
US$135 Million Ownership: DTE (55%), WGL (30%),
Antero (15%)
Central Penn
US$434 million Ownership: Williams (61%), WGL (21%),
Ares/EIF (10%), Cabot (8%)
GAIL Supply at Cove Point
Natural gas sale and purchase
agreement for a period of 20 years.
~2.5 mtpa of LNG (~0.35 Bcf/d)
Cove Point shipped first export
cargo in March 20181

Combined Utility Business High quality assets underpinned by regulated, low-risk cash flow
1 Represents gross rate base which excludes depreciation
Expectations as at April 26, 2018 upon successful close of WGL Acquisition
See "forward-looking information"
Delivering clean and affordable natural
gas to homes and businesses in 8
jurisdictions
Estimated combined rate base more than
doubles and estimated combined
customer base triples in size
Increased diversification, across several
high growth areas, minimizing exposure
to any one jurisdiction
~$8 Billion Projected rate base in 20211
11
~1.8 Million customers
across 8 states and provinces

~$5.2bn
$2.2bn
$0.6bn ~$8.0bn
YE2017 WGL utilitycapex to
2021
AltaGas utilitycapex to
2021
Grosscombined rate
base 2021
AltaGas WGL
New business Replacements
Other utility
Customer Growth and Accelerated Replacements Drive Growth
12
High near-term growth
Expected near-term growth driven by
customer additions, accelerated
replacement programs and general
system betterment capital
expenditures
Increased diversification into high
growth areas such as Washington
(6th largest regional economy in the
U.S., among the highest median
household incomes in the U.S.)
1 As of December 2017
2 WGL extrapolated to calendar year end 2017 based on FY2016 rate base and a CAGR of 9.0%
3 WGL figures converted to Canadian C$1.26 / US $1.00
4 WGL Management estimates
5 Gross rate base excludes depreciation
See "forward-looking information"
3,4
1,2,3
5
Projected Rate Base Growth
(C$ billions)

Michigan Growth Opportunity
Proposed pipeline that will connect the Great
Lakes Gas Transmission pipeline to the Northern
Gas pipeline in Marquette, Michigan Approximately 42 miles mainly with 20” diameter pipe
Provides needed redundancy and additional supply
options to SEMCO’s ~35,000 customers in its
service territory in Michigan’s Western Upper
Peninsula. It will also provide additional natural
gas capacity to Michigan’s Upper Peninsula to
allow for growth
Cost is estimated at ~US$135 - $140 million.
Recovery on MCP is expected to be through a
general base rate case
Received approval of Act 9 application from the
Michigan Public Service Commission in August
2017 to construct, own and operate the project
Engineering and property acquisitions have begun
and will continue throughout 2018, and
construction to be completed in 2019
MCP is expected to be in service in Q4 2019
Marquette Connector Pipeline (MCP)
Expectations as at April 26, 2018
See "forward-looking information“
13

Combined Power Business1 Generating clean energy with natural gas and renewable sources
14
1,930 MW of power generation
Power generation in over 20 states and provinces
Contracts with creditworthy counterparties provide long-
term stable cash flow
Weighted average contract life is ~14 years2
Enhanced growth from clean energy
Up to $350 million in new battery storage opportunities
~US$100 million per year in distributed generation
opportunities
Over $300 million in new solar opportunities
Strong footprint provides excellent opportunities to
develop solar generation projects
Track record of building projects on-time / ahead of
schedule and under budget in both Canada and the U.S.
1 Includes WGL’s installed and under-construction assets of 222MW, and ALA’s 20MW of energy storage.
2 Assumes average of 20 year contracts for WGL distributed generation
3 Expectations as at April 26, 2018 2019E EBITDA is indicative, and based upon successful close of WGL Acquisition and assumed asset monitizations. FX Rate of C$1.26/US$1
See "forward-looking information
Diversified Power Portfolio
Gas 27% - 32%
Utilities 40% - 45%
California Gas-fired
generation, 10%
Northwest Hydro, 7%
Distributed Generation,
4%
Energy Storage,
1%
Power - Other, 7%
Power
25% - 30%
Segment normalized EBITDA3 (2019F)

Northwest B.C. Hydro – Stable Long-Term Financial Returns
Forrest Kerr
195 MW fully contracted to 2074
McLymont Creek
66 MW fully contracted to 2075
Volcano Creek
16 MW fully contracted to 2074
Announced definitive agreement to sell 35%
of Northwest Hydro Facilities for $922 million,
implying a 2017 EBITDA multiple of ~27
times and a total value of $2.7 billion on a
100% basis
60 Year PPA with high quality credit (B.C.
Hydro)
- 100% indexed to B.C. CPI
AltaGas as operator has excellent track
record
Minimal ongoing maintenance capital
Very high capacity factors translates into low
annual generation volatility
0
100
200
300
400
500
600
NWH 60-year EBITDA: CPI indexing can deliver significant growth
CPI 1% CPI 1.5% CPI 2% CPI 2.5%
$ Millions
See "forward-looking information"
15

Attractive Clean Energy Footprint Diversified Across Northern and Southern California
Tracy, Hanford and Henrietta
Deliver ~CAD $95 million in EBITDA on yearly basis
Fully contracted with PG&E through to fourth quarter 2022
Important assets for system reliability
Situated in load constrained areas with lower resource adequacy and higher locational marginal pricing
Pomona
Pomona Energy Storage (Phase one)
10 year Energy Storage Agreement with Southern California Edison for 20 MW energy storage at Pomona facility. Resource adequacy capacity for four hour period, equivalent of 80 MWh of energy discharge capacity
Participate in the energy and ancillary service market where additional revenues can be earned above the contracted resource adequacy payments
Blythe
Delivers ~CAD $60 million in EBITDA on a yearly basis
Fully contracted with SCE through Q2 2020
Large site capable of accommodating large scale solar or energy storage
Additional flexibility added with increased operating ranges, reduced minimum run and down times, and increased ramp rates
Secured second source of gas supply through the El Paso system which increases market reliability and flexibility
Utilities
See "forward-looking information"
16

Energy
Storage
Attractive Platform for Growth Through 2021
Distributed
Generation
U.S. Midstream
Marcellus /
Utica Footprint
Expectations as at April 26, 2018 upon successful close of WGL Acquisition
See "forward-looking information
Canadian
Utilities
System
Betterment and
Customer
Growth
Canadian
Midstream
Montney
Large Scale
Power
Development
17
U.S. Utilities
System
Betterment and
Customer
Growth
+ $1.5 billion Advanced growth
opportunities
$4.5 billion Secured growth
~C$6 billion of identified capital investment opportunities

Maryland
regulatory
approval
received on April
4, 2018
Virginia regulatory
approval received
on October 20,
2017
Transaction Timeline Update Close of WGL Acquisition continues to track to mid-2018
18
Q1-17 Q2-17 Q3-17 Q4-17 Mid-18
Announcement Expected close
FERC approval
received July 6,
2017
Waiting period for
HSR Act expired
July 17, 2017
CFIUS approval
received July 28,
2017
WGL Shareholder
Vote
Transaction
Regulatory
Approval received
May 10, 2017
Asset Sales Asset monetizations
See "forward-looking information
DC settlement
agreement filed
May 8, 2018 and
DC PSC is
expected to
announce
decision the
week of June 25,
2018
Announced
settlement
agreement with
key stakeholders1
in Maryland on
December 4, 2017
Remainder of
2018

~$9
~$3.2 ~$1.4
~$3.4
~$2.5
~$0.9 $0.9
Total transactionvalue
Assumed debt Subscriptionreceipts
Bridge loan Hybrid / prefs NWH MinorityInterest Sale
Asset sales / termdebt
Acquisition funding sources (C$bn)
Financing Strategy Prudent plan achieves acquisition accretion metrics and maximizes shareholder value
19
Acquisition financing - Completed
Long-term financing plan structured to maintain
strong investment grade credit profile
C$2.1bn bought deal and C$400mm private
placement of subscription receipts
Committed C$3.8bn acquisition bridge facility,
12 - 18 month asset sale bridge1
– Original bridge facility of C$6.3bn offset by issuance of $2.5bn in
subscription receipts
3
1 Bridge facility is denominated in US dollars (US$3.0bn), converted for presentation purposes to Canadian dollars at 1.26 CAD/USD; aggregate bridge amount of C$3.8bn includes
transaction costs and associated contingencies; 2 Includes additional transaction related items; 3 Debt, Minority Interest and Preferred shares as of December 31, 2017, converted to
Canadian dollars at 1.26 CAD/USD
2
Acquisition financing - Outstanding
Monetization of assets of over C$2bn
– Definitive agreement announced to indirectly sell a 35% interest in the
Northwest B.C. Hydro Electric Facilities for $922 million
– Consideration also being given for potential of minority or majority
interest, as well as outright sales of other assets
Hybrids, preferred shares, and incremental debt
provide funding flexibility for remaining portion
Asset sales aligned with long-term business
mix and are expected to close over the course
of 2018

Strong Investment Grade Credit Rating Prudent deal financing enhances balance sheet strength over the long-term
20
2016 2019
Net Debt/EBITDA
~5x
Combined larger platform and
financing plan reinforce a path to
improved credit metrics and a
strong investment grade balance
sheet
Focus on stable cash flows
2016 2019
FFO1/Debt
1 FFO is a non-GAAP financial measure
See "forward-looking information"
Credit Metric Target
FFO / Debt ≥ 15%
Net Debt / EBITDA ~ 5.0x
~15% Target
Target

Governing Financial Principles Delivering growth and security
1 FFO is a non-GAAP financial measure
2 ALA standalone
See "forward-looking information"
Dividend Sustainability
Strong Counterparty
Creditworthiness Overall
Managed Commodity Exposure
Manageable Targeted
Financing Requirements
Strong Stable Investment Grade
Balance Sheet
Target Expected Returns
50 - 60% FFO1 payout ratio
Expect ~85% of 2019 common dividends to be
underpinned by Regulated Utilities
Enhancing returns on existing assets
Specified targets for growth projects
BBB credit rating
Flexible financing plan to support growth using both
growing internally generated cash flow and external
financing (as required)
~85% or greater of contracted EBITDA
> 85% of exposure with investment grade counterparties2
Principles Targets
1
2
3
4
5
6
21

Highly Contracted, Low-Risk Business Model
22
1 Assumes RIPET is 40% underpinned by tolling agreements with balance being commodity exposed. Also assumes some commodity exposure for WGL (Energy Marketing).
2 Long term agreements includes rate-regulated gas utilities, Northwest BC hydro, regulated gas pipelines, WGL Contracted Pipelines, and long-term take-or-pay / cost-of-service midstream assets, *
Expectations as at April 26, 2018 upon successful close of WGL Acquisition
See "forward-looking information"
Managed Commodity Exposure1
2019E (First full year including WGL)
Highly Contracted1,2
2019E (First full year including WGL)
High-quality cash flows underpinned by long-term take-or-pay contracts
and rate regulated franchises
~13% of combined EBITDA
exposed to commodity prices
~80% of normalized EBITDA
underpinned by medium &
long-term agreements
87%
13%
Stable EBITDA Commodity Based EBITDA
13%
9%
6%
72%
Commodity Exposed Short-term (< 3 years)
Medium-term (3-5 years) Long-term (> 5 years)

Enbridge IF Gibson
Inter Pipeline
Keyera
Pembina TransCanada
AltaGas
Capital Power
Brookfield Renewable
Northland Power
Innergex
Canadian Utilities
Fortis
Emera
Algonquin
3%
4%
5%
6%
7%
8%
9%
0% 2% 4% 6% 8% 10% 12%
0
2
4
6
8
10
12
14
2019E P/AFFO1
Valuation Multiple
Attractive value for AltaGas, combined with sustainable dividend payment.
AltaGas has one of the lowest multiples in the entire sector.
1 CIBC data, April 23, 2018. AFFO equals FFO adjusted for gas and power maintenance capital, preferred share dividends and non-controlling interest. AFFO is normalized which is a non-
GAAP measure
2 Data provided by IR Insights
See "forward-looking information"
23
Average
Energy infrastructure group yield and growth2
2-Year Dividend CAGR through 2018
Yield
Attractive Valuation

Key Takeaways
Near-term catalysts
Expectations as at April 26, 2018
See "forward-looking information"
24
2018
Maryland regulatory approval received on April 4, 2018
DC settlement agreement filed May 8, 2018 and DC PSC is expected to announce decision the week of June 25,
2018. Continue to expect a mid-year close.
Debt/Hybrid Financing
Various asset monetization initiatives for a total of over $2B in proceeds
Potential new Gas and Power development initiatives
Commitment to maintaining balanced long-term mix across 3 business lines
2019 - 2020
New battery storage and solar projects
New Midstream projects including Townsend 2B, and North Pine (train 2)
Completion of Ridley Island Propane Export Terminal (Q1 2019)
Completion of Marquette Connector Pipeline in Michigan (Q4 2019)
Medium-term catalysts (12 – 24 Months)


