15
Tech Curv Novem Michae (212) 83 michae hnical A e, S&P mber 2011 el Krauss 34-5103 l.krauss@ Analysis P 500, R 1 jpmorgan. s: 2012 Russel com 2 Outlo ll 2000 ooks- T Treasur ries, Yie eld

TechCurv
Novem
Michae(212) 83michae
hnical Ae, S&P
mber 2011
el Krauss 34-5103 l.krauss@j
AnalysisP 500, R
1
jpmorgan.
s: 2012Russel
com
2 Outloll 2000
ooks- TTreasurries, Yieeld
US Fixed Income Strategy US Fixed Income Markets 2012 Outlook November 28, 2011
Michael KraussAC (1-212) 834-5103 J.P. Morgan Securities LLC
1
Technical Analysis
• 10-year note yields suggest a 1.60-2.60% “base case” trading range in 2012 (80% odds), with low yields expected in February-May and higher yields in 2H
• 10s’ low probability “Global risk-on”/”Global risk-off” alternatives (8% & 12% odds respectively) would shift each range higher/lower by 60bp
• 5s imply a trading range between extremes at 0.64-0.76% on the rich end, and 1.22-1.36% on the cheap end. We advise fading both ends
• 2s are an afterthought with the Fed on hold through 2013. Key interim support is 0.32%. We see rates stuck in a 0.10-0.50% range in 2012
• The 2s10s curve favors a sideways range between 210-230 on the “bear” steepening side, and 140-160 on the “bull” flattening side
• S&P 500 favors a 1350 to 1100 range in 2012 (80% odds), a likely inside-range year. For alternate “tail” extremes, we see 8% odds of a “Global risk-on” to 1500, and 12% odds of a “Global risk-off” to 950-1000, possibly 800
• Russell 2000 risks a 2011 bearish reversal year from May’s 868 all-time high. October’s 27.9% rally failed amid 765-782 resistance, a key barrier for 2012. There is a major floor at 550-600
Our goal with this 2012 Outlook is to present a most probable “base case” and less probable extreme bullish and bearish “tail risks,” combined with likely Treasury and US Equity targets under each scenario. As the financial markets are increasingly being driven by the gridlock of US and European political and policy decisions, forecasting outcomes have become increasingly uncertain. Market participants in recent months have become increasingly neutral, retaining fewer risk positions, given the difficulty in handicapping Global policy outcomes. Indeed, facts are changing almost daily in nearly manic-depressive fashion. Market whipsaws from “risk-on” to “risk-off” and back again have become commonplace from week to week, penalizing performance for many. From the technical analysis side, we have often provided singular annual “roadmaps,” when our confidence levels
were high. That is not the case for this 2012 Outlook. Rather, we will attempt to lay out our most confident targets/ranges, and then the less likely bullish and bearish extremes. The markets now are like ships caught in the treacherously stormy seas of headline risk. We shall try our best to help navigate these difficult markets with flexible technical analysis views, furthering the goal of getting to a safe harbor, while avoiding a shipwreck against the rocks!
More than any time in history mankind faces a crossroads. One path leads to despair and utter hopelessness, the other to total extinction. Let us pray that we have the wisdom to choose correctly - Woody Allen
2011 Outlook Reviewed: Ten-Year Yields Our 2011 Outlook primary focus was that the major 3.00-3.105% 10s inflection point would be the fulcrum for the next 50-60bp trend target, in a see-saw type pattern. We postulated that 10s would target 3.50-3.60% on a bearish yield break (risk-on situation), and 2.45-2.60% on a bullish yield break (risk-off situation). One week after the 2011 Outlook was published, we accurately became aggressive in our expectation that yields would gravitate towards the higher-yield zone. However, months later, when yields started falling in late-spring after the Japan tsunami and Arab spring, our 2.45-2.60% 2011 Outlook downside yield parameters proved not aggressive enough. In fact, the biggest “failure” in our 2011 Outlook was our adamant stance that the 2.035% December 2008 financial crisis yield bottom would not be bullishly eclipsed. Our incorrect rationale came via our Elliott Wave interpretation that the yield rise from that 2.035% December 2008 yield bottom to 4.01% in April 2010 was a five wave impulsive affair (i.e., the beginning of a larger bear market into 2012). That hypothesis proved incorrect and it warns against being too reliant on any one technique!

US Fixed Income Strategy US Fixed Income Markets 2012 Outlook November 28, 2011
Michael KraussAC (1-212) 834-5103 J.P. Morgan Securities LLC
2
10-year yields peaked this year at 3.765% on February 9, stopping just shy of 3.83-3.88% major support targets in our daily Global FI Technical Strategist (January 2000 38.2% retrace, June 2007 trendline, December-January range measurement). While we accurately did not believe that 10s would break the 4.00% major support area this year, we wrongly did not expect yields to peak in February, as it rarely does in February. The last time this occurred was in 1982! Seasonally, Treasury yields have tended to rise from the February refunding until the May refunding, effectively peaking in the April-June time frame, before falling into October-November (Exhibit 1). With these “facts,” we actually dismissed a very promising monthly and weekly momentum setup for lower yields in February, based on the incorrect expectation that yields would see a final peak in April-May. However, the mid-March Japanese tsunami ended that possibility, as perceptions quickly shifted to weaker global growth. The yield decline accelerated during the summer, as the European sovereign debt crisis intensified, and our US economic growth forecasts were cut three times. Yields reached a record low 1.67% on September 23, after accelerating down from 3.22% to 1.97% in July-August. With Global Equities melting down in late-September/early-October, the overbought Treasury market lost momentum with a 1.715% October 4 higher yield low, bearishly diverging with Equities on that day’s 1075 S&P 500 bottom for 2011. From there, 10s quickly achieved our 2.31-2.35% year-end targets sooner than expected, with a 2.415% October 28 yield peak. This retraced nearly 50% of the July-September yield decline.
2012 Outlook Targets: Treasuries 10-Year Yields For this 2012 Outlook, our base case assumption is for 10s to form a 1.60% to 2.60% trading range into December 2012 (Exhibit 2). It will be both difficult for yields to sustain back above the 2.60-2.80% yield breakdown inflection zone, as long as the European sovereign debt crisis and possible Fed QE3 lurks in the background. Oppositely, it will be tough to move below the tough 1.50-1.70% resistance, as long as the US avoids an economic recession and corporate profits stay elevated. In effect, our base case presumes that the various global macro economic and political factors affecting markets will be mixed, leading to the ebb and flow of a large trading range.
Exhibit 1: 10-year note yields peaked in February, much earlier than the average May seasonal peak 10-year note yields—1981-2010 se asonality versus 2011
Exhibit 2: We see a 1.60% to 2.60% base case yield range for 10-year note yields in 2012 (80% odds) 10-year note yields—weekly bars
Exhibit 3: 10s’ monthly momentum stays in a buy mode. We expect a bearishly diverging turn by 2H12 10-year note yields—monthly bars

US Fixed Income Strategy US Fixed Income Markets 2012 Outlook November 28, 2011
Michael KraussAC (1-212) 834-5103 J.P. Morgan Securities LLC
3
Timing-wise, current momentum signals give some insight into the likely trajectory of 10-year yields within our assumed 1.60-2.60% range. Effectively, we see the 1.70% rich-end being tested in 1H12, followed by the 2.60% cheap-end in 2H. First, monthly momentum has been favorable since July (Exhibit 3). We anticipate that this long-term gauge will reach a mature overbought condition by February-April, as buy signals in recent years have tended to last roughly seven to nine months. Next, weekly momentum is just giving a new mid-range buy signal (Exhibit 4). Assuming no whipsaws, this medium-term gauge’s buy signals have lasted about seven to nine weeks, which in this case would be into mid-January. In addition, 10-year yield’s weekly momentum trough/maximum overbought condition in September was coincident with the 1.67% yield low (Exhibit 4). However, momentum often diverges at the final yield bottom in a mature bull market. While not required, no bearish divergence has yet occurred in this post-February bull cycle. 10s would need to see a marginally lower-low in yield below the 1.67% September rich, while weekly momentum bearishly diverges with a “higher-low” and crosses upwards. The last time a weekly diverging sell signal like this occurred was just after the 2.33% October 2010 yield low (Exhibit 4). Given the magnitude of 10s’ resistance in the 1.50-1.70% zone, combined with the likelihood of a weekly momentum non-confirmation on a marginal new yield low, we anticipate a significant positional selling opportunity by late-winter/mid-spring. Overall, given the current momentum and chart setup, we suggest buying 10s’ weakness here in November, looking to exit and go short in late 1Q to mid-2Q, for a yield backup in 2H12. Three 10s Scenarios In terms of what 10s’ range will be in 2012, we offer three scenarios. We graph our most probable base case and the less probable bullish and bearish “tail” risk cases. While less likely, if global macro economic and political factors coalesce either bullishly (global risk-on) or bearishly (global risk-off) in 2012, rather than staying mixed as in our base case, then we would have to adjust our technical targeting expectations. Clearly, flexibility in this regard is paramount, given the unending uncertainty of global macro political and policy outcomes:
Exhibit 4: The weekly momentum measure is on the cusp of a bullish signal. These last about 7-9 weeks 10-year note yields—weekly bars
Exhibit 6: The 1.26% September 1993 monthly trendline tagged the Oct 1998 and June 2003 yield troughs 10-year note yields—monthly bars
Exhibit 5: 10-year yields sport January 2000 channel resistance at 1.34% 10-year note yields—monthly bars

US Fixed Income Strategy US Fixed Income Markets 2012 Outlook November 28, 2011
Michael KraussAC (1-212) 834-5103 J.P. Morgan Securities LLC
4
1. Under the base case situation (we assume 80% odds), 10s should find meaningful resistance near 1.60%, with a major 1.50-1.70% resistance band (Exhibit 2). This zone includes the 1.785% October range break objective, 1.725% October-November equal downswings, 1.715% October 4 yield low, 1.67% September 23 yield trough, 1.62% June 2008-April 2010 channel rich (Exhibit 3), 1.60% 2003-2008 monthly close trendline, 1.57% where the June 2007 rally equals the January 2000-June 2003 rally, 1.56% daily trendline connecting the August 2010/October 2010/September 2011 yield lows, 1.52% 2008-2010 Elliott triangle objective (Exhibit 3), 1.485% June 2003-December 2008 trendline (Exhibit 3). On the support side of our 1.60-2.60% base case 2012 range assumption, 10s sport an important 2.60-2.80% support band (Exhibit 2). This zone includes: 2.51% December 2008-October 2010 triangle trendline (Exhibit 3), 2.53% April-July trendline, 2.585% August 7 high yield after downgrade of the ‘AAA’ US credit rating, 2.625% July-September 61.8% retracement (Exhibit 4), 2.675% September-November equal yield upswings, 2.72% February-September 50% retracement (Exhibit 4), 2.80% September 2010-July 2011 internal trendline, 2.81% 200-day MA (Exhibit 2), and 2.815% July 12 low yield breakdown (Exhibit 4). Another reason why this 2.60-2.80% zone should hold in 2012 is that yields accelerated lower from this area, as part of this summer’s major bullish perception shift about Treasuries, coaxed by global economic weakness and European woes. It could take several quarters to reverse such perceptions and, thus, decisively re-penetrate 2.60-2.80%. 2. Under a global risk-on situation (we assume 8% odds), we would raise the base case yield range parameters by 60bp, creating a 2.20-3.20% 2012 trading range (Exhibit 7). Under this low-probability scenario, European Sovereign risks are “ring-fenced,” the ECB monetizes Sovereign debt and eases aggressively, the US economy surprises to the upside, and China sees a soft landing. Despite this, US rates do not accelerate higher as the Fed maintains a low-for-long bias, inflation measures stay tempered, and US consumers continue their post-housing bubble debt deleveraging. Key supports proximate to 3.20% include: 3.02% February-April trendline, 3.07% June 2007 38.2% retrace, 3.145% March low yield, 3.21% October 2010-September 2011 yield low channel cheap (Exhibit 4), 3.22% July 1 high yield (Exhibit 4), and 3.28% June 2008 61.8% retrace (Exhibit 3).
Longer-term supports are deemed to hold into 2013-2014, or such time that the Fed gets closer to tightening, inflation becomes a problem, and the housing market starts a long-term recovery. In that multi-year consideration, 10s long-term supports include the 3.765% February 2011 yield high, 3.79% June 2008-April 2010 trendline, 3.93% June 2007 61.8% retrace, 4.01% April 2010 yield peak (Exhibit 4), 4.23% Oct 1987-June 2007 trendline (Exhibit 6), 4.275% June 2008 cheap (Exhibit 3). Monthly closing breaks would test the 5.325% June 2007 high yield (Exhibit 5), 5.49% March 2002 yield peak (Exhibit 5), and 5.54% May 2001 cheap (Exhibit 5).
Exhibit 7: We see a 2.20% to 3.20% 10s yield range in 2012 under a “global risk-on” scenario (only 8% odds) 10-year note yields—weekly bars
Exhibit 8: We see a 1.00% to 2.00% 10s yield range in 2012 under a “global risk-off” scenario (only 12% odds) 10-year note yields—weekly bars
US Fixed Income Strategy US Fixed Income Markets 2012 Outlook November 28, 2011
Michael KraussAC (1-212) 834-5103 J.P. Morgan Securities LLC
5
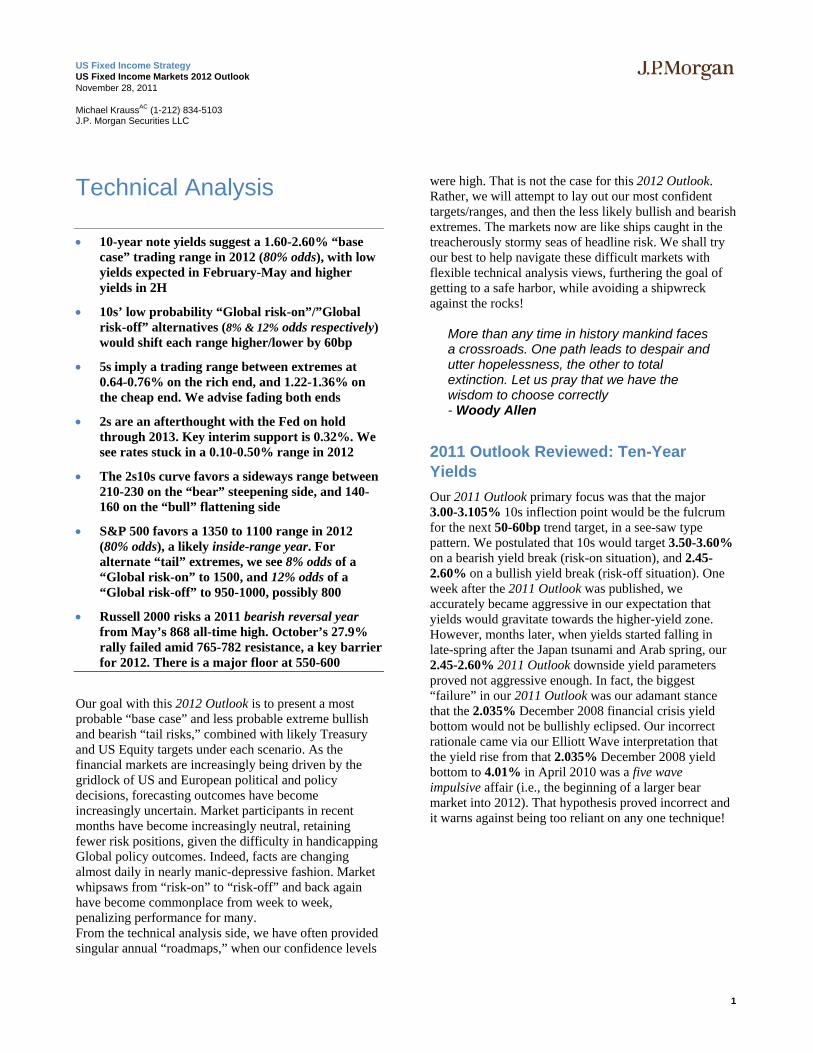
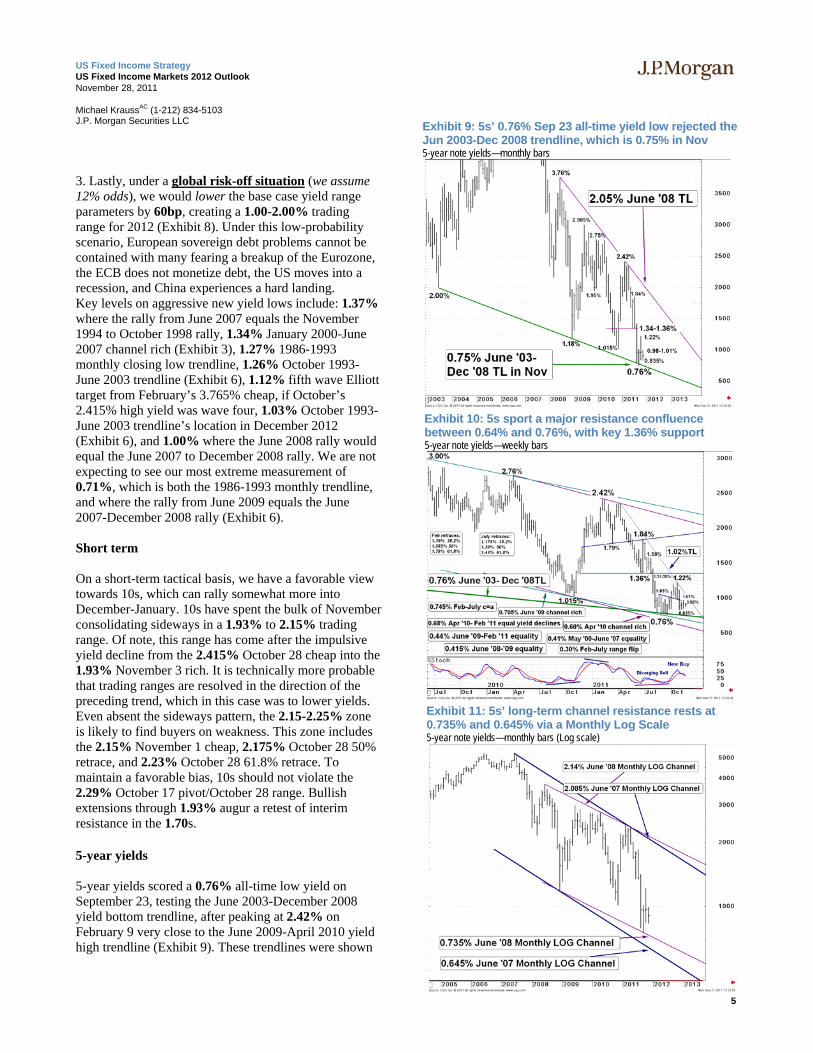
3. Lastly, under a global risk-off situation (we assume 12% odds), we would lower the base case yield range parameters by 60bp, creating a 1.00-2.00% trading range for 2012 (Exhibit 8). Under this low-probability scenario, European sovereign debt problems cannot be contained with many fearing a breakup of the Eurozone, the ECB does not monetize debt, the US moves into a recession, and China experiences a hard landing. Key levels on aggressive new yield lows include: 1.37% where the rally from June 2007 equals the November 1994 to October 1998 rally, 1.34% January 2000-June 2007 channel rich (Exhibit 3), 1.27% 1986-1993 monthly closing low trendline, 1.26% October 1993-June 2003 trendline (Exhibit 6), 1.12% fifth wave Elliott target from February’s 3.765% cheap, if October’s 2.415% high yield was wave four, 1.03% October 1993-June 2003 trendline’s location in December 2012 (Exhibit 6), and 1.00% where the June 2008 rally would equal the June 2007 to December 2008 rally. We are not expecting to see our most extreme measurement of 0.71%, which is both the 1986-1993 monthly trendline, and where the rally from June 2009 equals the June 2007-December 2008 rally (Exhibit 6). Short term On a short-term tactical basis, we have a favorable view towards 10s, which can rally somewhat more into December-January. 10s have spent the bulk of November consolidating sideways in a 1.93% to 2.15% trading range. Of note, this range has come after the impulsive yield decline from the 2.415% October 28 cheap into the 1.93% November 3 rich. It is technically more probable that trading ranges are resolved in the direction of the preceding trend, which in this case was to lower yields. Even absent the sideways pattern, the 2.15-2.25% zone is likely to find buyers on weakness. This zone includes the 2.15% November 1 cheap, 2.175% October 28 50% retrace, and 2.23% October 28 61.8% retrace. To maintain a favorable bias, 10s should not violate the 2.29% October 17 pivot/October 28 range. Bullish extensions through 1.93% augur a retest of interim resistance in the 1.70s. 5-year yields 5-year yields scored a 0.76% all-time low yield on September 23, testing the June 2003-December 2008 yield bottom trendline, after peaking at 2.42% on February 9 very close to the June 2009-April 2010 yield high trendline (Exhibit 9). These trendlines were shown
Exhibit 10: 5s sport a major resistance confluence between 0.64% and 0.76%, with key 1.36% support 5-year note yields—weekly bars
Exhibit 9: 5s’ 0.76% Sep 23 all-time yield low rejected the Jun 2003-Dec 2008 trendline, which is 0.75% in Nov 5-year note yields—monthly bars
Exhibit 11: 5s’ long-term channel resistance rests at 0.735% and 0.645% via a Monthly Log Scale 5-year note yields—monthly bars (Log scale)

US Fixed Income Strategy US Fixed Income Markets 2012 Outlook November 28, 2011
Michael KraussAC (1-212) 834-5103 J.P. Morgan Securities LLC
6
in the 2011 Outlook , but were not an important focus for us. This year’s updated monthly chart updates the current trendline locations (Exhibit 9). Currently, 5s are benefiting from Fed’s continued commitment to an exceptionally low policy rate for a very long time, minimally through 2013. That said, 5-year yields have effectively ranged sideways for the past four months, respecting key support and resistance zones. These inflection areas are expected to stay intact, and locationally tradable into 1Q12. Specifically, medium-term resistance entails 0.64-0.76%, while 1.22-1.36% defines medium-term support (Exhibit 10). The 0.64-0.76% interim resistance zone includes the 0.76% September 23 rich, 0.75% June 2003-December 2008 yield bottom trendline (Exhibit 9), 0.74% October range break objective, 0.735% June 2008-February 2011 Monthly LOG channel rich (Exhibit 11), 0.715% November range break measure, 0.705% June 2009 yield channel low (Exhibit 10), 0.68% June 2007-June 2008 equal yield downswings, 0.68% April 2010-February 2011 equal yield downswings (Exhibit 10), and 0.645% June 2007-February 2011 monthly LOG channel low yield (Exhibit 11). Just beyond, 0.60% marks the April 2010-February 2011 channel rich (Exhibit 10). Alternately, the 1.22-1.36% interim support zone includes: 1.22% October 23 high yield (Exhibit 10), 1.24% yield backup equivalent to June-July, 1.29% September-November equal yield upswings, 1.295% August 5 cheap, 1.30% July 50% retracement (Exhibit 10), 1.31% yield backup equivalent to March-April, 1.34% October 2010 cheap/July 29 low yield, 1.35% late-November 2010 rich, and 1.36% June 27 yield low/breakout zone (Exhibit 10). Weekly closes cheaper than 1.36% would signify that a more assertive risk-on situation was developing. In that situation, our technical work would dictate a 5’s yield backup to the 1.55% 200-day moving average, a 1.59% February 50% retrace, if not the 1.785% February 61.8% retrace, a 1.795% March yield low, and a 1.84% July 1 yield high (Exhibit 10). Longer term 5s LOG channel supports rest at 2.085% from June 2007 and 2.14% from June 2008, but are not visualized for 2012 (Exhibit 11). A more structurally-friendly “risk-off” environment driven by any European contagion and/or US Recession would seek 0.41-0.445% in 5-year yields. Here, 0.445% marks June 2009-February 2011 equal yield swings
(Exhibit 10), 0.415% equates June 2008-June 2009 swings (Exhibit 10), and 0.41% sports May 2000-June 2007 yield equality (Exhibit 10). Beyond this, 0.30% is where the 1.36% July inflection would be the mid-point of the rally from the 2.42% February cheap (Exhibit 10). We call this a “range flip” projection. On a short-term basis, 5-year yields indicate short-term support at the 0.98-1.01% August-October range pivots, with next support at the 1.075% October 27 61.8% retracement, and 1.115% October 31 cheap. On the rally side, 5s sport resistance at 0.835%, which is the rich-end
Exhibit 13: 2s reversed from the June 2009 channel at both the Oct 2010 yield low and Apr 2011 yield high! 2-year note yields—monthly bars
Exhibit 12: 2s favor maintaining a 0.10% to 0.50% range in 2012, with key support at 0.32% initially 2-year note yields—weekly bars

US Fixed Income Strategy US Fixed Income Markets 2012 Outlook November 28, 2011
Michael KraussAC (1-212) 834-5103 J.P. Morgan Securities LLC
7
of November’s daily range. Bullish extensions augur a retest of the 0.64-0.76% interim resistance zone. 2-Year Yields 2-year yields are more of an afterthought for 2012, as they should stay very low, anchored to the 0-25bp Fed funds rate, which our economics team expects to stay unchanged throughout 2013. As such, 2s should stay relatively range-bound next year, likely 0.10-0.50% (Exhibit 12). While likely uneventful for 2012, 2s have been exciting from a technical analysis standpoint over the past two years, oscillating nicely within the June 2009 yield downchannel. Interestingly, the June 2009 channel tagged both last year’s 0.31% October 2010 yield low, and this year’s 0.895% April yield high (Exhibit 12)! Yields peaked at 0.895% on April 1 this year, with a bullish reversal month that held two critical supports at the aforementioned 0.90% June 2009 channel cheap, and 0.89% level where the backup from the 0.31% November 2010 yield low (which held the June 2009 channel rich!), equaled the 57bp November 2009-April 2010 yield backup. From there, 2s bullishly stair-stepped to lower yields through trading ranges at 0.495% and 0.32% (Exhibit 12). These are key supports for 2012. Yields bottomed at an all-time low 0.14% yield on September 20, with a bearish key reversal day/week, and a bearish reversal month (Exhibit 13), prior to successfully retesting 0.315% support twice in October. A weekly close cheaper than 0.33% would bearishly submit a test of the 0.445% July 27 cheap, 0.495% March 15 range rich, 0.51% June 30 high yield, and 0.52% April 50% retrace (Exhibit 12). The June 2009 channel now rests at 0.70%, and may prove to be a more important factor in 2013 than in 2012 (Exhibit 12). Nearby resistance rests at the 0.205% November 3 rich, and the 0.16% April-June .618 swing target/August range high. Beyond this, 0.095% marks the February-April range break measure. The June 2009 channel rich no longer helps us, as it is currently at a negative yield below 0.00% (Exhibit 13). 2s10s Yield Curve The 2s10s yield curve favors a trading range environment for this 2012 Outlook, after establishing a 289 February 4 cyclical peak, which tagged the August 2003-February 2010 weekly closing trendline
(Exhibit14). We suspect a 2012 range, which stays between 210-230 on the steepening end, and 140-160 on the flattening end (Exhibit 14). Given the expected on-hold FED well-into 2013, 10s should be the primary driver in the continued medium-term process of bull flattenings and bear steepenings. The Treasury bull market this year saw a huge bull flattening to a 161 mid-September weekly close (151 intraday). August saw a decisive break below the key 200 parameter, which proved to be a key inflection area in May 2003, March 2008, February 2009, and September 2010 (Exhibit 14). Our 2s10s trading range parameters follow both key parameters within 2s and 10s individually, and the 2s10s weekly chart as constructed. Individually, it is most probable that 2s spend their 2012 between 0.10% and 0.50%, and 10s between 1.60% and 2.60%. So, the difference would see 2s10s at 150 at the low yields, and 210 at the high yields. Additionally, 2s10s chart levels corroborate the expected 210-230 and 140-160 anticipated 2012 trading range in the curve (Exhibit 14). The steepening resistance band includes the 208 October 27 wide, 211 July 50% retracement, February 50% retrace, 216 August 11 peak, 225 July 61.8% retrace, 230 September-November equal steepening upswings, and
Exhibit 14: Likely 2s10s 2012 range: 140-160 “bull” flattening narrows & 210-230 “bear” steepening wides 2s10s yield curve—weekly closes

US Fixed Income Strategy US Fixed Income Markets 2012 Outlook November 28, 2011
Michael KraussAC (1-212) 834-5103 J.P. Morgan Securities LLC
8
227-231 violated September-November 2010 range support (Exhibit 14). On the flattening side, the 2s10s curve sports flattening support at: 160 December 2008 78.6% retrace, 159 where the February 2011 flattening equals the November-December 2008 flattening, 157 December 2008-January 2011 1.618 swing target, 151 September 22 narrow, 140 November range flip objective below 174, 136 November 2006 bottom 50% retracement. In 2012, we do not see a violation of long term support at the 124 December 2008 and 123 June 2008 flattening lows (Exhibit 14). On a short-term basis, expect steepening resistance at the 184 November 8 wide and 187 October 25 narrows, and flattening support at the 174 November 9 low/September 29 high (Exhibit 14).
S&P 500 Index Outlook 2011 Outlook Reviewed: S&P 500 Index While our S&P 500 forecast for this year turned out to be more accurate than our 10-year yield forecast, looking back, it would have been better to have kept our S&P 500 scenario for the year from the 2011 Outlook , than to have made some subtle changes during March-April in our weekly US Equity Technical Strategist report. Specifically, in the 2011 Outlook (written when the S&P 500 was at 1,175), we suggested that the SPX would peak for the year at 1,300-1,350 around mid-year, and then “see a substantial correction” down to a 1,100-1,130 yearly bottom in 2H (Exhibit 15). This “roadmap” was not far off, as the S&P 500 peaked for the year at 1,371 in May and bottomed at 1,075 in October. Unfortunately, we somewhat changed our preferred scenario in March-April. We suggested a 1,350-1,370 “Sell in May and Go Away” peak, then a May-September correction that would hold 1,200-1,220 key 2010 range highs, which would be followed by 1,400-1,430 new highs by year-end. After properly suggesting “summer rally sales” at 1,340-1,360, we were forced to turn bearish below 1,200 in July, and eliminate the 1,400s year-end target. On a positive note, we suggest buying in late-September/mid-October amid 1,060-1,080 targets, for a rally towards 1,275 by year-end. That bottom and subsequent rally was accomplished in just three weeks, leading to a more neutral bias into year-end.
Exhibit 16: We see a 1,350 to 1,100 Base Case scenario for the S&P 500 in 2012 (80% odds) S&P 500 Index—monthly bars
Exhibit 17: S&P 500 Index weekly chart parametersS&P 500 Index—weekly bars
Exhibit 15: SPX Roadmap used in 2011 Outlook lastyear: a 1,350 “best case” mid-year peak and a down 2H S&P 500 Index—weekly bars

US Fixed Income Strategy US Fixed Income Markets 2012 Outlook November 28, 2011
Michael KraussAC (1-212) 834-5103 J.P. Morgan Securities LLC
9
2012 Outlook Targets: S&P 500 Index For this 2012 Outlook, our base case assumption is for the S&P 500 to form a 1,350 to 1,100 trading range into December 2012 (Exhibit 16). It will be difficult for Equities to sustain back above the 1,300-1,350 trendlines, as long as the European sovereign debt crisis and recession lurks in the background. Similarly, it will be tough to move below strong 1,075-1,100 clustered support, as long as the US avoids an economic recession, earnings stay elevated, and investors remain defensively positioned. We give this outcome 80% odds. Indeed, with this year’s range defined at the 1,371 May 2 peak, and 1,075 October 4 low, it is reasonable for 2012 to form an inside range year. For next year, resistance near our anticipated 1,350 2012 range high includes: 1,300 right shoulder channel symmetry with the July 2010 low/October 2011 low/April 2010 high (Exhibit 17), 1,325 May-July weekly downtrendline, 1,342 October 2007-May 2011 monthly downtrendline (Exhibit 16), 1,348 violated March 2009-July 2010 monthly uptrendline (Exhibit 16), and 1,353 March 2009-July 2010 .618 upside swing target, 1,355 parallel internal channel high on the quarterly bar chart off the 4Q02 low, 1Q09 low, and 1Q00 high (Exhibit 19). Just above, 1,371 is the May top, and 1,400 is the channel high off the July 2010 low/October 2011 low/May 2011 high (Exhibit 18). On the downside, key supports near our anticipated 1,100 range low include: 1,121 is the October rally 78.6% retrace (Exhibit 17), 1,113 is the rising 200 month MA (Exhibit 16), 1,100 is the May-October .618 downswing measure, 1,106 is the declining 40 month MA (Exhibit 16), 1,101 is the March 2009 38.2% retrace, and 1,075 is both the October low and January 2009-July 2010 weekly internal trendline (Exhibit 16). We respect the fact that the S&P 500 has made higher annual lows in each of the past three years, 666 in March 2009, 1,011 in July 2010, and 1,075 in October 2011 (Exhibit 18). S&P 500 Bullish versus Bearish Alternatives A more optimistic Equity case for 2012 would necessitate several of the following fundamental and policy outcomes: positive resolution of the European crisis, ECB quantitative easing, upward revisions to the J.P. Morgan US Economic forecast, US Fiscal Policy stimulus, Fed QE3, and a China soft-landing. We give this outcome only 8% odds.
Under the above global risk-on situation, the S&P 500 technically targets 1,500. Here: 1,473 is where the March 2009 bull market would equal the October 2002 to October 2007 bull market, 1,510 March 2009-October 2011 .618 upswing measure (Exhibit 20), 1,511 is the parallel internal channel high on the quarterly bar chart off the 4Q02 low, 1Q09 low, and 4Q07 top, and 1,564 March 2009-July 2010 equal upswing measure (Exhibit 20). Longer term, 1,600 is the trendline off the January 2000 and October 2007 peaks (Exhibit 20), 1,780 is the March 2009-October 2011 equal upswing (Exhibit 20), and 1,907 is the March 2009-July 2010 1.618 swing parameter (Exhibit 20).
Exhibit 18: S&P 500 Index monthly momentum gauges are currently in a bearish setup S&P 500 Index—monthly bars
Exhibit 19: This year’s 1,371 May top in the S&P 500 stopped exactly on this 1Q00 internal channel high S&P 500 Index—quarterly bars

US Fixed Income Strategy US Fixed Income Markets 2012 Outlook November 28, 2011
Michael KraussAC (1-212) 834-5103 J.P. Morgan Securities LLC
10
A more pessimistic Equity case for 2012 would arguably necessitate Global contagion from an unraveling of the European debt crisis, if not a dissolution of the EU itself; a US economic recession, zero US fiscal policy stimulus given continued partisan rancor from Congress and the President, and a Chinese hard-landing. We give this outcome the odds of only 12%, yet that is higher than the bull case. The bear Global risk-off case technically targets 950-1,000, and possibly 800 (Exhibit 21): 1,025 is the quarterly chart internal trendline with four points of contact since October 1998 (Exhibit 19), 1,019 is the March 2009 50% retrace, 1,011 is the July 2010 bottom (Exhibit 20), 997 is the May-October equal downswing measure (Exhibit 21), 956 is the June 2009 high breakout, 936 is the March 2009 61.8% retrace (Exhibit 21), 814 is the May-October 1.618 downswing collapse measure (Exhibit 21), and 785 is a downside projection from a potentially developing two-year Head and Shoulders top pattern (Exhibit 21). Repeating the last sentence of both the 2010 and 2011 Outlooks, “We do not expect the 666 cycle low breaking, absent a global depression.” Absent a resolution to the European debt crisis, and a market-friendly outcome to the November 2012 presidential election, we believe it will be extremely difficult to exceed this May’s 1,371 S&P 500 peak during 2012. If our favored 1,100-1,350 range proves incorrect, it is technically more likely that the downside support breaks, rather than the upside barrier. To that end, note that we did give slightly higher odds to the “bear case” than the “bull case”. There are four main factors for this defensive rationale: 1) Monthly momentum retains a July sell signal (Exhibit 18). These signals have tended to last 7 to 9 months on average, which in this case would last into February-April 2012. If correct, then the typical Equity seasonality would not work in 2012, like it did in 2011. Equity seasonality typically sees a decline from May until October, and then a rally into May. Seasonality only “works” when the underlying technical, sentiment, and momentum condition are supportive of the seasonal influence. This year, May peaked in our 1,350-1,370 by mid-year target zone (US Equity Technical Strategist), with distinct weekly momentum loss, and ebullient sentiment. Oppositely, the October seasonal bottom achieved our 1,060-1,080 late-September-mid-October
target low, with diverging weekly momentum, and alarming pessimism. 2) The 1,270 200-day moving average is falling with the major market averages trading below the moving average (Exhibit 17). To many technicians, that is the definition of a bear market. To us, the slope of the line is more important than the level, and changing the slope of the line can take months. A bull market would require the slope of the 200-day moving average to start rising, and for the market to sustain back above it. 3) The Elliott Wave pattern interpretation is bearishly concerning, as the May to October downtrend
Exhibit 20: We see potential upside for the S&P near 1,500 in a “Global risk-on” scenario (only 8% odds) S&P 500 Index—monthly bars
Exhibit 21: We see downside to 950-1,000 (maybe 800) in a “global risk-off” scenario (only 12% odds) S&P 500 Index—weekly bars

US Fixed Income Strategy US Fixed Income Markets 2012 Outlook November 28, 2011
Michael KraussAC (1-212) 834-5103 J.P. Morgan Securities LLC
11
from 1,371 to 1,075 was an impulsive 5-wave decline, and the subsequent rally to 1,293 has so far been a corrective 3-step affair (Exhibit 21). Under Elliott, another 5-wave decline is needed to either complete a large corrective ABC decline from May (ultimately macro bullish), or start a very negative progression of a larger 5-wave collapse (macro bearish). Either way, when subjectively interpreting Elliott Waves, sequences of five wave declines and three wave rallies are symptoms of bear markets that are incomplete. Note that at 997, equal downswings from the May and the October highs would measure in a large ABC decline (Exhibit 21). 4) There is a possibility that the S&P 500 has been forming a massive two-year “Head and Shoulders Top” pattern (Exhibit 21). The risk in this symmetrical pattern, is that the April 2010 peak is the “left shoulder”, the May 2011 top is the “head”, and the October 2011 rally is the “right shoulder” (Exhibit 21). The 1075 July 2010-October 2011 uptrendline would be the “neckline” (Exhibit 21). A parallel channel off the neckline, touching the 1,220 April 2010 high provides interesting symmetry with the 1,293 October 2011 peak (Exhibit 21). Decisive weekly closes above 1,325-1,350 on superior advance-decline breadth would invalidate this foreboding pattern, which theoretically measures to 785 on a neckline breakdown (Exhibit 21). Short term We expect two-sided action in the weeks ahead, as traditional December positive seasonality counters a negative interim momentum setup. Nearby resistance rests at 1200, and the 1,215/1,236 November 17 triangle range break. The 1163 triangle downside measured move, and 1158 October 61.8% retrace were met on November 25. Secondary supports are 1135-1150. Interim resistance entails the 1,267 declining 200 day moving average, 1,278 November 8 high, and 1,293 October 27 peak. In addition, the S&P 500 needs to close December above 1,257.64 to avoid a bearish 2011 downside reversal year. This would affirm some follow through weakness in 2012. Russell 2000 The Russell 2000 small cap index peaked at an 868 all-time high on May 2, with a bearish key reversal day rejecting the top-end of a 1998-2009 annual chart channel high, after slightly exceeding the 856 July 2007 top (Exhibit 22). The RTY risks a 2011 downside
Exhibit 23: Russell 2000 Index monthly parametersRussell 2000 Index—monthly bars
Exhibit 22: Russell 2000 is likely to complete an 868 2011 bearish reversal year at the end of December Russell 2000 Index—yearly bars
Exhibit 24: Russell Index rejects 767-782 key resistance Russell 2000 Index—weekly bars

US Fixed Income Strategy US Fixed Income Markets 2012 Outlook November 28, 2011
Michael KraussAC (1-212) 834-5103 J.P. Morgan Securities LLC
12
reversal year with a December close below 2010’s 783.65 annual close (Exhibit 22). This would favor some additional weakness in 2012. Like the S&P 500, the Russell 2000 is most likely to trade within this year’s range in 2012. The 602 bottom on October 4 scored a bullish key reversal day, and substantially held major supports: 605 March 2009 50% retrace (Exhibit 23), 596 150-month moving average (Exhibit 23), 596 May-August fifth wave down target (Exhibit 24), 593 March 2000-April 2004 internal trendline (Exhibit 22), 588 July 2010 low (Exhibit 24), 547-553 August-November 2009 lows (Exhibit 24), and 543 March 2009 61.8% retrace (Exhibit 23). The October 4-October 27 rally surged 27.9% to 769, in 17 trading days. Despite this strong showing, the RTY lifted in a corrective ABC fashion, and failed squarely in the 767-782 major resistance band, which shall be a major roadblock in 2012. This “barrier” includes: 765 “right-shoulder symmetry” with the possible April 2010 “left shoulder and May 2011 “head”, 766 May-October 61.8% retrace, 767 March-June Head & Shoulders Top neckline, 773 June low, 776 March low, 778 falling 40-week moving average, and 782 April 2010 internal trendline (Exhibits 23,24). Bulls need a weekly close above the 812 July 18 low breakdown/May 78.6% retracement, to garner sufficient momentum to retest the 868 May peak, if not score new all-time highs towards the 910 1990-2009 monthly channel high, 927 March 2009-May 2011 .618 swing projection, and 991 March 2009-July 2010 equal upswings (Exhibit 23). Russell 2000 near-term resistance rests at the 748/756 November peaks, and 759-756 October 31 bear gap. Short term supports rest at the 712 November 1 low, 707 October 26 low, 700 October 27 equal downswings, 697-702 October 21 bull gap, 686 October 4 50% retrace, 679 October 20 low, 666 October 4 61.8% retrace, 640 August 9 3rd wave acceleration low (Exhibit 24). Finally, the November 2012 Presidential election outcome should be a very important driver for the S&P 500 in the final two-months of 2012. While we have no political aims in this Outlook, we can see the SPX index about 100 points higher on average through 2013 under a Republican victory than a President Obama re-election. Increasingly, many investors feel the current Democratic administration has been anti-business, regulatory-heavy, and unwilling to cut entitlements. At the margin, one
would expect a shift to the Republicans to be welcomed by the Equity investor class.
Trading themes • 10-year Treasuries: Buy November weakness in
the 2.05-2.15% zone. Exit longs near 1.70-1.80%, looking to short a failure amid 1.50-1.70%. Cover shorts in the 2.40-2.60% zone, and attempt longs.
• 5-year Treasuries: Go long in the 1.22-1.36% zone, risking 1.41%. Go short in the 0.64-0.76% zone, risking 0.67%
• 2-year Treasuries: Counter-trade the 0.16% to 0.31% range for now. Go short behind 0.33% and cover in the 0.40-0.50% zone.
• 2s10s curve: Position flatteners against 210-230 range resistance, and position steepeners against 140-160 range support. Risk 8bp on each side.
• S&P 500: Sell short in the 1,225-1,265 range, risking above 1,311. Look to cover near the 1,135-1,185 zone. Position long in the 1,075-1,120 zone, risking 1069.
• Russell 2000: Look to short in the 745-775 zone, risking above 812. Cover shorts in the 650-685 zone.

Analyst Certification: The research analyst(s) denoted by an “AC” on the cover of this report certifies (or, where multipleresearch analysts are primarily responsible for this report, the research analyst denoted by an “AC” on the cover or within thedocument individually certifies, with respect to each security or issuer that the research analyst covers in this research) that: (1) allof the views expressed in this report accurately reflect his or her personal views about any and all of the subject securities orissuers; and (2) no part of any of the research analyst’s compensation was, is, or will be directly or indirectly related to the specificrecommendations or views expressed by the research analyst(s) in this report.
Conflict of Interest
This research contains the views, opinions and recommendations of J.P. Morgan credit research analysts. Research analystsroutinely consult with J.P. Morgan trading desk personnel in formulating views, opinions and recommendations in preparingresearch. Trading desks may trade, or have traded, as principal on the basis of the research analyst(s) views and report(s). There-fore, this research may not be independent from the proprietary interests of J.P. Morgan trading desks which may conflict withyour interests. In addition, research analysts receive compensation based, in part, on the quality and accuracy of their analysis,client feedback, trading desk and firm revenues and competitive factors. As a general matter, J.P. Morgan and/or its affiliatesnormally make a market and trade as principal in fixed income securities discussed in research reports.
Other Disclosures
J.P. Morgan (“JPM”) is the global brand name for J.P. Morgan Securities LLC (“JPMS”) and its affiliates worldwide. J.P. MorganCazenove is a marketing name for the U.K. investment banking businesses and EMEA cash equities and equity research businesses ofJPMorgan Chase & Co. and its subsidiaries. QIB Only
Options related research: If the information contained herein regards options related research, such information is available only topersons who have received the proper option risk disclosure documents. For a copy of the Option Clearing Corporation’s Characteristicsand Risks of Standardized Options, please contact your J.P. Morgan Representative or visit the OCC’s website at http://www.optionsclearing.com/publications/risks/riskstoc.pdf
Legal Entities DisclosuresU.S.: JPMS is a member of NYSE, FINRA, SIPC and the NFA. JPMorgan Chase Bank, N.A. is a member of FDIC and is authorized andregulated in the UK by the Financial Services Authority. U.K.: J.P. Morgan Securities Ltd. (JPMSL) is a member of the London StockExchange and is authorized and regulated by the Financial Services Authority. Registered in England & Wales No. 2711006. RegisteredOffice 125 London Wall, London EC2Y 5AJ. South Africa: J.P. Morgan Equities Limited is a member of the Johannesburg SecuritiesExchange and is regulated by the FSB. Hong Kong: J.P. Morgan Securities (Asia Pacific) Limited (CE number AAJ321) is regulated bythe Hong Kong Monetary Authority and the Securities and Futures Commission in Hong Kong. Korea: J.P. Morgan Securities (Far East)Ltd, Seoul Branch, is regulated by the Korea Financial Supervisory Service. Australia: J.P. Morgan Australia Limited (ABN 52 002 888011/AFS Licence No: 238188) is regulated by ASIC and J.P. Morgan Securities Australia Limited (ABN 61 003 245 234/AFS Licence No:238066) is a Market Participant with the ASX and regulated by ASIC. Taiwan: J.P.Morgan Securities (Taiwan) Limited is a participant ofthe Taiwan Stock Exchange (company-type) and regulated by the Taiwan Securities and Futures Bureau. India: J.P. Morgan India PrivateLimited, having its registered office at J.P. Morgan Tower, Off. C.S.T. Road, Kalina, Santacruz East, Mumbai - 400098, is a member ofthe National Stock Exchange of India Limited (SEBI Registration Number - INB 230675231/INF 230675231/INE 230675231) andBombay Stock Exchange Limited (SEBI Registration Number - INB 010675237/INF 010675237) and is regulated by Securities andExchange Board of India. Thailand: JPMorgan Securities (Thailand) Limited is a member of the Stock Exchange of Thailand and isregulated by the Ministry of Finance and the Securities and Exchange Commission. Indonesia: PT J.P. Morgan Securities Indonesia is amember of the Indonesia Stock Exchange and is regulated by the BAPEPAM LK. Philippines: J.P. Morgan Securities Philippines Inc. isa member of the Philippine Stock Exchange and is regulated by the Securities and Exchange Commission. Brazil: Banco J.P. MorganS.A. is regulated by the Comissao de Valores Mobiliarios (CVM) and by the Central Bank of Brazil. Mexico: J.P. Morgan Casa de Bolsa,S.A. de C.V., J.P. Morgan Grupo Financiero is a member of the Mexican Stock Exchange and authorized to act as a broker dealer by theNational Banking and Securities Exchange Commission. Singapore: This material is issued and distributed in Singapore by J.P. MorganSecurities Singapore Private Limited (JPMSS) [MICA (P) 025/01/2011 and Co. Reg. No.: 199405335R] which is a member of theSingapore Exchange Securities Trading Limited and is regulated by the Monetary Authority of Singapore (MAS) and/or JPMorgan ChaseBank, N.A., Singapore branch (JPMCB Singapore) which is regulated by the MAS. Malaysia: This material is issued and distributed inMalaysia by JPMorgan Securities (Malaysia) Sdn Bhd (18146-X) which is a Participating Organization of Bursa Malaysia Berhad and aholder of Capital Markets Services License issued by the Securities Commission in Malaysia. Pakistan: J. P. Morgan Pakistan Broking(Pvt.) Ltd is a member of the Karachi Stock Exchange and regulated by the Securities and Exchange Commission of Pakistan. SaudiArabia: J.P. Morgan Saudi Arabia Ltd. is authorized by the Capital Market Authority of the Kingdom of Saudi Arabia (CMA) to carry outdealing as an agent, arranging, advising and custody, with respect to securities business under licence number 35-07079 and its registeredaddress is at 8th Floor, Al-Faisaliyah Tower, King Fahad Road, P.O. Box 51907, Riyadh 11553, Kingdom of Saudi Arabia. Dubai:JPMorgan Chase Bank, N.A., Dubai Branch is regulated by the Dubai Financial Services Authority (DFSA) and its registered address isDubai International Financial Centre - Building 3, Level 7, PO Box 506551, Dubai, UAE.
Country and Region Specific DisclosuresU.K. and European Economic Area (EEA): Unless specified to the contrary, issued and approved for distribution in the U.K. and theEEA by JPMSL. Investment research issued by JPMSL has been prepared in accordance with JPMSL’s policies for managing conflicts ofinterest arising as a result of publication and distribution of investment research. Many European regulators require a firm to establish,implement and maintain such a policy. This report has been issued in the U.K. only to persons of a kind described in Article 19 (5), 38,47 and 49 of the Financial Services and Markets Act 2000 (Financial Promotion) Order 2005 (all such persons being referred to as“relevant persons”). This document must not be acted on or relied on by persons who are not relevant persons. Any investment or

investment activity to which this document relates is only available to relevant persons and will be engaged in only with relevantpersons. In other EEA countries, the report has been issued to persons regarded as professional investors (or equivalent) in their homejurisdiction. Australia: This material is issued and distributed by JPMSAL in Australia to “wholesale clients” only. JPMSAL does not issueor distribute this material to “retail clients”. The recipient of this material must not distribute it to any third party or outside Australiawithout the prior written consent of JPMSAL. For the purposes of this paragraph the terms “wholesale client” and “retail client” havethe meanings given to them in section 761G of the Corporations Act 2001. Germany: This material is distributed in Germany by J.P.Morgan Securities Ltd., Frankfurt Branch and J.P.Morgan Chase Bank, N.A., Frankfurt Branch which are regulated by the Bundesanstaltfür Finanzdienstleistungsaufsicht. Hong Kong: The 1% ownership disclosure as of the previous month end satisfies the requirements underParagraph 16.5(a) of the Hong Kong Code of Conduct for Persons Licensed by or Registered with the Securities and Futures Commission.(For research published within the first ten days of the month, the disclosure may be based on the month end data from two monthsprior.) J.P. Morgan Broking (Hong Kong) Limited is the liquidity provider/market maker for derivative warrants, callable bull bearcontracts and stock options listed on the Stock Exchange of Hong Kong Limited. An updated list can be found on HKEx website: http://www.hkex.com.hk. Japan: There is a risk that a loss may occur due to a change in the price of the shares in the case of share trading, andthat a loss may occur due to the exchange rate in the case of foreign share trading. In the case of share trading, JPMorgan SecuritiesJapan Co., Ltd., will be receiving a brokerage fee and consumption tax (shouhizei) calculated by multiplying the executed price by thecommission rate which was individually agreed between JPMorgan Securities Japan Co., Ltd., and the customer in advance. FinancialInstruments Firms: JPMorgan Securities Japan Co., Ltd., Kanto Local Finance Bureau (kinsho) No. 82 Participating Association / JapanSecurities Dealers Association, The Financial Futures Association of Japan, Type II Financial Instruments Firms Association and JapanSecurities Investment Advisers Association. Korea: This report may have been edited or contributed to from time to time by affiliates ofJ.P. Morgan Securities (Far East) Ltd, Seoul Branch. Singapore: JPMSS and/or its affiliates may have a holding in any of the securitiesdiscussed in this report; for securities where the holding is 1% or greater, the specific holding is disclosed in the Important Disclosuressection above. India: For private circulation only, not for sale. Pakistan: For private circulation only, not for sale. New Zealand: Thismaterial is issued and distributed by JPMSAL in New Zealand only to persons whose principal business is the investment of money orwho, in the course of and for the purposes of their business, habitually invest money. JPMSAL does not issue or distribute this material tomembers of “the public” as determined in accordance with section 3 of the Securities Act 1978. The recipient of this material must notdistribute it to any third party or outside New Zealand without the prior written consent of JPMSAL. Canada: The information containedherein is not, and under no circumstances is to be construed as, a prospectus, an advertisement, a public offering, an offer to sellsecurities described herein, or solicitation of an offer to buy securities described herein, in Canada or any province or territory thereof.Any offer or sale of the securities described herein in Canada will be made only under an exemption from the requirements to file aprospectus with the relevant Canadian securities regulators and only by a dealer properly registered under applicable securities laws or,alternatively, pursuant to an exemption from the dealer registration requirement in the relevant province or territory of Canada in whichsuch offer or sale is made. The information contained herein is under no circumstances to be construed as investment advice in anyprovince or territory of Canada and is not tailored to the needs of the recipient. To the extent that the information contained hereinreferences securities of an issuer incorporated, formed or created under the laws of Canada or a province or territory of Canada, anytrades in such securities must be conducted through a dealer registered in Canada. No securities commission or similar regulatory authorityin Canada has reviewed or in any way passed judgment upon these materials, the information contained herein or the merits of thesecurities described herein, and any representation to the contrary is an offence. Dubai: This report has been issued to persons regarded asprofessional clients as defined under the DFSA rules.
General: Additional information is available upon request. Information has been obtained from sources believed to be reliable butJPMorgan Chase & Co. or its affiliates and/or subsidiaries (collectively J.P. Morgan) do not warrant its completeness or accuracy exceptwith respect to any disclosures relative to JPMS and/or its affiliates and the analyst’s involvement with the issuer that is the subject ofthe research. All pricing is as of the close of market for the securities discussed, unless otherwise stated. Opinions and estimates consti-tute our judgment as of the date of this material and are subject to change without notice. Past performance is not indicative of futureresults. This material is not intended as an offer or solicitation for the purchase or sale of any financial instrument. The opinions andrecommendations herein do not take into account individual client circumstances, objectives, or needs and are not intended as recom-mendations of particular securities, financial instruments or strategies to particular clients. The recipient of this report must make itsown independent decisions regarding any securities or financial instruments mentioned herein. JPMS distributes in the U.S. researchpublished by non-U.S. affiliates and accepts responsibility for its contents. Periodic updates may be provided on companies/industriesbased on company specific developments or announcements, market conditions or any other publicly available information. Clientsshould contact analysts and execute transactions through a J.P. Morgan subsidiary or affiliate in their home jurisdiction unless governinglaw permits otherwise.
“Other Disclosures” last revised September 30, 2011.
Daily Sentiment Index (DSI) is courtesy of MBH Commodities, Winnetka, Ill. Stone & McCarthy survey is courtesy of Stone & McCarthy Research Associate, Princeton, NJ.
Copyright 2011 JPMorgan Chase & Co. All rights reserved. This report or any portion hereof may not be reprinted, sold orredistributed without the written consent of J.P. Morgan. #$J&098


