Global Neighborhoods: New Pathways to Diversity andSeparation1
John R. Logan andBrown University
Charles ZhangTexas A&M University
AbstractAnalyses of neighborhood racial composition in 1980–2000 demonstrate that in multiethnicmetropolitan regions there is an emerging pathway of change that leads to relatively stableintegration These are “global neighborhoods” where Hispanics and Asians are the pioneerintegrators of previously all-white zones, later followed by blacks. However, region-widesegregation is maintained at high levels by whites’ avoidance of all-minority areas and by theircontinued exodus (albeit at reduced levels) from mixed settings. Globalization of neighborhoodsadds a positive new element of diversity that alters but does not erase the traditional dynamic ofminority invasion succession.
There is a long-standing consensus among social scientists about the typical path ofneighborhood change that underlies persistent residential segregation between blacks andwhites. Decades ago, Chicago school sociologists introduced an ecological metaphor ofinvasion and succession to describe a common tendency for entry of African-Americans intopreviously all-white neighborhoods where the housing stock was aging and middle-classpeople and families with children were leaving (Hoover and Vernon 1959). Black“invasion” would be followed by continued racial change, leading finally to a predominantlyblack composition (Duncan and Duncan 1957; Taeuber and Taeuber 1965; Aldrich 1975;Schwirian 1983). Many white neighborhoods, it was recognized, remained resistant to blackinvasion, but once begun the process was nearly certain to result in “succession.” Thismodel is so widely accepted that empirical studies of community racial composition (Guest1978) have embraced terms like “invasion” and “succession” as cross-sectional descriptorsof neighborhoods with modest or large shares of black residents, respectively. Somescholars have investigated the alternative possibility of “stable integration” (Molotch 1972;Ottensman and Gleason 1992; Ellen 2000; Maly 2005). At best, they find that a mix of whiteand black residents can be maintained over time in unusually favorable conditions. Thesearch for stable integration, as Saltman (1990) characterizes it, is a “fragile movement.”
We argue that the theory of racial transition that served well for much of the 20th centurymust be reconsidered in an era when massive waves of Hispanic and Asian immigration aretransforming the racial and ethnic composition of metropolitan America (for a broaderreview of the implications for segregation, see Fong and Shibuya [2005]). In our analysis the
1This research was partly supported by a postdoctoral research fellowship to Charles Zhang by Brown University’s initiative in spatialstructures in the social sciences. Early versions of the findings were presented at the 2006 annual meeting of the InternationalSociological Association and the 2007 annual meeting of the Population Association of America.
Direct correspondence to John R. Logan, Department of Sociology, Brown University, Macxy Hall, Providence, Rhode Island [email protected].
NIH Public AccessAuthor ManuscriptAJS. Author manuscript; available in PMC 2013 September 05.
Published in final edited form as:AJS. 2010 January 1; 115(4): 1069–1109. doi:10.1086/649498.
NIH
-PA Author Manuscript
NIH
-PA Author Manuscript
NIH
-PA Author Manuscript
outstanding feature of the “global city” (defined by Sassen [1991] on the basis of itsfinancial innovation and control functions) is its ability to draw people from all parts of theworld, creating a new population diversity that affects the familiar pattern of race relationsin black and white. We identify the corresponding phenomenon of “global neighborhoods”—neighborhoods where the simple place categories of predominantly white, predominantlyblack, or racially mixed are no longer adequate.
The most important new category is that in which all four major racial/ethnic groups(whites, blacks, Hispanics, and Asians) are included. We observe a rapid growth of suchneighborhoods, whose creation and persistence are fundamentally at variance with theinvasion-succession model. These are not temporarily integrated places, diverse only as longas it takes for whites to abandon them. Nor do they arise out of processes of aging,disinvestment, and deprivation. We argue that stable diversity is possible and that it canoccur in average or even better-than-average neighborhoods, if and only if black entry ispreceded by a substantial presence of both Hispanic and Asian residents. Globalneighborhoods do not erase racial boundaries, but they introduce new dynamics that need tobe taken into account by urban theory.
We are not the first to suspect that immigration is having an impact on patterns of residentialsegregation. Lee and Wood (1991) speculated that something was already changing in the1970s. “The dominant trend,” they hypothesized, “is toward complex multiethnicneighborhoods in which all four groups are present. Whether the dynamics underlying thistrend are captured adequately by the succession model seems doubtful. At a minimum, theway in which the model depicts competition needs to be extended beyond the simple two-group scenario” (p. 37). Recent field-work on intergroup relations in diverse neighborhoods(Nyden et al. 1998; Sanjek 1998; Maly 2005) reinforces this suggestion, and scholars areshowing new interest in measures of neighborhood diversity (Maly 2002) to complementmeasures of segregation.
What is new in our study is an explicit alternative model based on evidence from 1980 to2000 of how Asians and Hispanics affect the paths of neighborhood change. We will showthat two directions of change coexist in global neighborhoods. One of these is a persistentprocess of white flight and white replacement by minorities (now including Hispanics andAsians in addition to blacks), the same demographic shift that underlies the familiar modelof invasion and succession. The other is the new diversity that Sanjek (1998) terms “thefuture of us all”—a future of mixed neighborhoods overcoming the black-white divide,where Sanjek believed members of all groups would learn to live together. We do not offerinsights here on the personal connections created in different kinds of neighborhoods, butwe do examine the phenomenon of residential mixing. In this respect the most pessimisticreading from the 1990s of trends in residential patterns was that American apartheid wouldcontinue into the 21st century (Massey and Denton 1993). The most optimistic reading sawthe newly multiethnic metropolis poised for a breakthrough in neighborhood diversity(Farley and Frey 1994). Our purpose here is to demonstrate that processes posited by bothscenarios are taking place at the same time and that the era of global neighborhoods createsnew possibilities for residential integration without erasing the old racial boundaries.
WHITE FLIGHT AND MULTIETHNIC BUFFERSThe theoretical invasion-succession model was based on decades of observation of whiteflight from places where blacks had gained a foothold. A handful of studies haveemphasized other aspects of neighborhood racial change. Lee and Wood’s early studyshowed, for 1970–80, that in most Western metropolitan regions, succession from mixed-race to all-black neighborhoods was uncommon, especially in tracts with a large Hispanic
Logan and Zhang Page 2
AJS. Author manuscript; available in PMC 2013 September 05.
NIH
-PA Author Manuscript
NIH
-PA Author Manuscript
NIH
-PA Author Manuscript
population. In the prototypical case of Los Angeles, “Hispanics and Asians replaceddeparting whites and decreased the chances of black residential dominance” (Lee and Wood1991, p. 32). This example shows that the new “complex multiethnic neighborhoods” havethe potential to become all minority. They may become more diverse than blackneighborhoods, but they are not necessarily areas of stable white-minority integration.Another study of the same 1970–80 decade (Denton and Massey 1991) suggested thatneighborhood diversity was increasing, by showing that the prevalence of all-white tractswas declining nationally in that period while the share of tracts with combinations of two orthree minority groups (tracts including blacks, Hispanic, or Asians—although notnecessarily whites) was growing. But they also presented evidence that (1) there was acountertrend for tracts including blacks in combination with other minority groups tobecome all black; (2) neighborhoods with whites plus Hispanics only or with multipleminorities were likely to lose their white populations; and (3) white population loss wasmore likely in neighborhoods with larger minority shares, in neighborhoods with multipleminority groups, and in neighborhoods that were geographically nearer to tracts with a morethan 50% black population.
If these results were the whole story, they would be largely consistent with the invasion-succession model. There is another narrative, although up to now the evidence supporting ithas been weak. This is the conjecture that the presence of Hispanic and Asian neighborsprovides a protection against white flight, or in the terminology of Farley and Frey (1994;also Frey and Farley 1996) a “buffer.” Buffering is shorthand for the argument that themovement of “more fully assimilated second and third generations of Latinos and Asians tohigher-status, more integrated communities” provides “a push that should lead to greaterintegration of blacks both with more fully assimilated minority members and with whites”(Frey and Farley 1996, p. 42).
Certainly whites are less segregated from Hispanics and Asians than they are from blacks(Denton and Massey 1988; Iceland 2004; Logan, Stults, and Farley 2004). This difference isaccentuated after controlling for differences in personal background characteristics. Logan etal. (1996) estimated locational outcomes at the individual level, including such controls, infive large multiethnic metropolitan regions (New York, Los Angeles, Chicago, Miami, andSan Francisco). In each one, they found that Hispanics and Asians lived in census tracts withtwo to three times the share of non-Hispanic whites as did comparable blacks. It would notbe surprising, then, if “more fully assimilated second and third generations” of these groupsbecame the initial integrators of white neighborhoods.
The buffer hypothesis goes a step further to posit that whites would remain in these places ifblacks also entered. Why would they remain? The term “buffer” may imply that Hispanicsand Asians live in an intermediate zone between whites and blacks within the same censustract (reducing their geographic proximity). Or it may refer to a social buffer, not ageographic one, in which the presence of other groups reduces the salience of blackneighbors to whites, even when they live on the same block. The history of entiremetropolitan areas or specific neighborhoods could help to explain this lower salience. Forexample, some metropolitan regions with large Hispanic and Asian populations are nottraditional areas of black settlement. During the Great Migration, large black ghettos werethe norm in cities in much of the Northeast and Midwest, but many black residents arrivedafter that period in newer cities without that history. It is plausible that, for them, racialbarriers may always have been lower. Iceland (2004) goes further, suggesting that thecontemporary presence of multiple minority groups can undermine the black-whitedichotomy, even in areas where it was historically entrenched.
Logan and Zhang Page 3
AJS. Author manuscript; available in PMC 2013 September 05.
NIH
-PA Author Manuscript
NIH
-PA Author Manuscript
NIH
-PA Author Manuscript
Scholars have sought support for the buffering hypothesis through studies of the correlatesof segregation at the city or metropolitan level. Frey and Farley (1996) focused on blacksegregation from all other groups combined, rather than from non-Hispanic whites alone.This research studied 37 metropolitan regions that the investigators classified as multi-ethnic, defined as areas where the share of at least two of the three major minority groupswas higher than in the nation as a whole (the threshold values were 9.0% for Hispanics,2.9% for Asians, and 12.1% for blacks). In these multiethnic metropolises, they argued,mixed-race neighborhoods should be more stable and blacks should be more dispersed thanin regions where they are the dominant minority group (p. 43). Contradicting thishypothesis, they found that multiethnic metropolitan regions did not have significantly lowerblack-nonblack segregation in 1990. Decline in black-nonblack segregation during 1980–90was greater in multiethnic regions and where the Hispanic population grew faster than theblack population (a finding replicated for 1980–2000 by Iceland [2004], using a differentprocedure). However, declining black-nonblack segregation could result either from blackintegration with whites or from the replacement of whites by other minorities, like the LosAngeles case noted above. Therefore, the findings are inconclusive.
In studies focused on black-white segregation, the findings are also mixed. Farley and Frey’searlier analysis of all metropolitan areas (1994) showed that black-white segregation wassignificantly lower in 1990 in those areas where a larger share of the minority populationwas Hispanic and Asian. But segregation did not decline more between 1980 and 1990 inmetropolises where the Hispanic and Asian population grew faster than the blackpopulation. This analysis was replicated for 1980–2000 by Logan et al. (2004), who foundno effect of Hispanic or Asian population size on change in black-white segregation.
We will argue that these studies have looked for evidence at the wrong geographic scale.Because both white flight and buffering are important constituents of neighborhood changein the current period, and because they are occurring simultaneously in different parts of thesame regions, the way to discover them is to examine changes over time in individualneighborhoods and to pay attention to conflicting trends. More attention needs to be given tothe pathways of change, rather than simply the trend line in measures of segregation orneighborhood diversity.
PATHWAYS OF NEIGHBORHOOD CHANGEResearch on invasion and succession has focused on a standard sequence of change, goingso far as to posit a specific “tipping point” at which succession was inevitable. There havebeen fewer studies of changes in a multiethnic context. Nyden et al. (1998) studied severalracially and ethnically diverse places in detail and pointed out that they were created invarious ways, including “an influx of immigrant groups; a change in neighborhoodcomposition as an aging White population moves out or dies and new residents take theirplace; and reinvestment in formerly rundown neighborhoods that brings a modest increase inWhite, Anglo, middle-income residents while a sluggish real estate market inhibitswholesale gentrification and resegregation” (p. 11). Hence, diversity could be temporary(until the last white resident leaves or until gentrification can run its course), or it could belonger lasting.
Two quantitative studies of neighborhood change offer evidence for both scenarios. Onestudy (Alba et al. 1995) focuses on the New York metropolis in 1970–90. This studyexplicitly categorizes census tracts by the presence of non-Hispanic whites as well as blacks,Asians, and Hispanics, and it presents a transition matrix of shifts in composition over time.The findings point to a decline of all-white neighborhoods and an emergence of morediverse categories involving Hispanics and Asians (and less often blacks) in combination
Logan and Zhang Page 4
AJS. Author manuscript; available in PMC 2013 September 05.
NIH
-PA Author Manuscript
NIH
-PA Author Manuscript
NIH
-PA Author Manuscript
with whites. But there is a countertrend involving the loss of whites from mixedneighborhoods: about a third of tracts with whites, blacks, and Hispanics in 1970 lost theirwhite presence by 1990, as did about one in five tracts that began with all four groups. Thesecond study (Friedman 2008) tracks a national sample of large metropolitan regions for1980–2000 (see also Ellen [1998], who studied 1980–90 with similar methods and results).Friedman uses a simpler classification of the population as non-Hispanic white, black, and“other race” (including Hispanic, Asian, Native American, and other races in one category).She reports a sharp decline of predominantly white tracts, rapid growth of white-other racetracts (not including blacks), and a quite modest increase in the number of multiethnic tractsincluding whites, blacks, and other races. When blacks were present along with whites in1980, it was most often in white-black tracts. By 2000, consistent with the bufferinghypothesis, black-white coresidence was mainly in white-black-other race (or multiethnic)tracts. But because Friedman finds that a majority of the multiethnic tracts existing in 1980had lost their white presence by 2000, her results suggest that buffering may be temporary.
These studies highlight three common forms of neighborhood change that have specialrelevance to our examination of global neighborhoods. The first is the disappearance of theall-white enclave. The second is the entry of blacks into communities where whites alreadyhave Hispanic or Asian neighbors or both. The third is white flight from mixedneighborhoods. We will focus on these transitions in greater detail to examine theirprevalence and the conditions under which they occur.
The Disappearance of the All-White NeighborhoodSeveral studies listed above emphasize the declining share of all-white census tracts,although they employed different classification schemes. Denton and Massey’s very strictdefinition of all-white tracts included only those where neither blacks nor Hispanics orAsians had a presence as high as 30 persons. By this definition, the national share of all-white tracts declined from 14% in 1970 to 7% in 1980. Alba et al. (1995) classified as “allwhite” those tracts where no minority group had as many as 100 residents. These were 29%of tracts in the New York metropolis in 1970 but only 7% in 1990. Friedman (2008) defined“predominantly white” neighborhoods as those with more than an 80% white population andwhere neither blacks nor other races comprised as much as 10%. Their share dropped from54% to 28% of census tracts in her national sample between 1980 and 2000.
What population dynamics explain the disappearance of white neighborhoods? One factor ispurely demographic—the metropolitan population as a whole is growing and becomingmore diverse. Where the criterion is a fixed absolute minority group size, growth of the tractpopulation even without a change in its composition could move a tract over the thresholdnumber. Or if minority populations grow in a metropolis over time, even without changingtheir spatial distribution, the number of all-white tracts in that region would be expected todecline. In these cases, there would be no change in segregation as it is most often measuredthrough the Index of Dissimilarity. If the definition of all-white neighborhoods wereadjusted for the changing overall composition of the metropolis, in fact, there would be nodecline of white neighborhoods.
The invasion-succession model offers clear predictions for which all-white neighborhoodsare most likely to increase their share of minority residents. As formalized by Hoover andVernon (1959), invasion is rooted in a natural loss of attractiveness of zones, with aging anddeteriorating housing stock causing groups with more options (whites and higher-incomeresidents) to begin abandoning the area, thus creating vacancies to be filled by others.Hence, whites remain in neighborhoods where they constitute a large majority and whereother conditions (e.g., income, education, and home ownership rates) suggest an attractivehousing market. They leave and new minorities are able to enter when conditions suggest
Logan and Zhang Page 5
AJS. Author manuscript; available in PMC 2013 September 05.
NIH
-PA Author Manuscript
NIH
-PA Author Manuscript
NIH
-PA Author Manuscript
that the neighborhood is no longer attractive to people with other options. These regularitieshave been repeatedly confirmed in metropolitan areas (Lee and Wood 1991) and in centralcity settings (Taeuber and Taeuber 1965; Guest and Zuiches 1971) as well as in suburbanregions (Guest 1978; Logan and Schneider 1984). We will test whether they continue now tobe predictors of disappearing all-white neighborhoods in multiethnic metropolises orwhether, in this new context, minorities gain entry even into “higher-status, more integratedcommunities,” as Farley and Frey suspect.
Entry of Blacks into Mixed Neighborhoods including WhitesThe initial entry of blacks into a neighborhood with whites is less common than the entry ofHispanics or Asians. In the New York metropolis, out of more than 1,000 all-white tracts in1970, only five had made the transition to white-black in 1990 (Alba et al. 1995). Incontrast, more than 200 all-white tracts experienced the entry of blacks along with Hispanicsor Asians. A larger number, more than 400, experienced Hispanic or Asian entry withoutblacks. In Friedman’s (2008) national sample, the transition from predominantly white towhite-other-race in the 1980s was three times more likely than the transition frompredominantly white to white-black. In the 1990s, it was seven times more likely.
Explaining black entry into mixed neighborhoods creates a test of two clearly competinghypotheses. From the perspective of invasion succession, as noted above, the mainpredictors of black entry should be indicators of weak neighborhood resources: low averageincome, transient population, and so on. The buffering hypothesis suggests that a strongpredictor of black entry should be the prior presence of more Hispanics or Asians, with nonecessary implication that the neighborhood is becoming less attractive to people of anyrace.
White FlightA third theoretically crucial kind of transition is the loss of the white population fromracially mixed neighborhoods. White flight was common in the New York metropolis during1970–90. About one in four white-black tracts in 1970 had no white presence in 1990; thesame was true of about a third of white-black-Hispanic tracts and about one in five tractsthat had included all four groups. Remarkably, white flight (by this measure) rarely occurredexcept in tracts that had a black presence at the initial time point. In Friedman’s (2008)research, declining white presence is indicated by the shift from “multiethnic” to thepredominantly minority categories, where the percentage white dropped below the 40%threshold. This transition occurred in 35% of multiethnic neighborhoods in the 1980s and43% in the 1990s.
Once again, from an invasion-succession perspective the key hypothesis is that white flightis precipitated by community decline. From the perspective of multiethnic buffering, thehypothesis is that white flight from areas with a black presence is less likely in places with alarger share of Hispanics and Asians.
These considerations lead to the following hypotheses about the predictors of these threespecific types of transition. As noted above, there is considerable empirical support for theinvasion-succession model, while the relevance of buffering has yet to be demonstrated.
Invasion-Succession Hypothesis.—Minorities are more likely to enter all-whiteneighborhoods, blacks are more likely to enter mixed neighborhoods, and whites aremore likely to desert areas with a lower-income, more transient population and otherindicators of unattractiveness in the housing market.
Logan and Zhang Page 6
AJS. Author manuscript; available in PMC 2013 September 05.
NIH
-PA Author Manuscript
NIH
-PA Author Manuscript
NIH
-PA Author Manuscript
Buffering Hypothesis 1.—Minority entry into all-white neighborhoods is unrelated tolevels of market attractiveness or is more likely in areas with average or higherattractiveness.
Buffering Hypothesis 2.—Black entry into neighborhoods with a white presence ismore likely in areas with a higher share of Hispanic and Asian residents.
Buffering Hypothesis 3.—White flight from neighborhoods including blacks is lesslikely in areas with a higher share of Hispanic and Asian residents and may be unrelatedto levels of market attractiveness.
RESEARCH DESIGNTo test these hypotheses, our plan is to analyze neighborhood change in racial compositionusing information from 1980 through 2000. We first develop criteria for a multifoldclassification of local areas on the basis of the distribution of residents by race and Hispanicorigin. We evaluate the distribution of neighborhoods across these types in 1980 and 2000,showing the overall rise and fall of each category. We then trace the evolution of each typeof neighborhood. As we shall show, when diversity is reduced it is most often the result ofwhite exodus from racially mixed neighborhoods, and when diversity is increased it is mostoften not by white entry but rather by introduction of a new minority group into aneighborhood where whites are already present. We then analyze the predictors of the keypaths of change that represent increasing or decreasing diversity.
Data SourcesThis study relies on tract-level data from the U.S. population census in 1980, 1990, and2000. Census tracts are geographic areas that typically have a population between 2,500 and8,000. Although designed to be relatively permanent, geographic boundaries of census tractsdo change over time. Across censuses, tracts can be merged, split, or otherwisereconfigured; this poses a challenge to the comparability of tract geography over time.Therefore, we use the Neighborhood Change Database (NCDB; see http://www2.urban.org/nnip/ncua/ncdb.html), which provides 1970–2000 long-form census variables recalculatedand normalized to the 2000 census tract boundary. As a result, all higher-level geographiesincluding metropolitan regions for previous censuses adopt the 2000 census’s definition.
NCDB was jointly developed by the Urban Institute and Geolytics. It employs geographicinformation system (GIS) mapping procedures to overlay tract boundaries from differentcensus years to identify boundary changes. Block-level components are used to reconfigurethe discrepant earlier tracts to conform to the 2000 geography, and block-leveldemographics from the 1990 redistricting release PL94-171 are used to determine thepopulation proportion of each earlier tract to be assigned to the new 2000 tract. Thesepopulation weights are then applied to the various 1980 and 1990 tract-level variables toconvert them to 2000 tract boundaries (Tatian 2003, app. J). Despite its utility, severallimitations of this data set need to be kept in mind. For several reasons, NCDB does notprovide a perfect match between censuses. Some complex patterns of boundary changesmake exact reconfiguration impossible. For instance, 45% of 1980–2000 matching in NCDBinvolves multiple tracts at both censuses, which makes it much more prone to error than thesimpler scenario of a merger or a split. In addition, the reconfiguration is based onassumptions made in order to estimate data values for reconfigured tracts: (a) that thepopulation is randomly spread within blocks, (b) that social and economic characteristics ofthe residents are homogeneous across blocks within tracts, and (c) that block-levelpopulation distributions from 1990 can be applied to 1980.
Logan and Zhang Page 7
AJS. Author manuscript; available in PMC 2013 September 05.
Consistent with the prior literature, we study four groups in this article: non-Hispanicwhites, non-Hispanic blacks, Hispanics, and Asians. For 1980 and 1990, when respondentscould choose one racial group only, the combined use of race and Hispanic origin variablesallows unequivocal categorization of these groups. The categorization became morecomplicated for 2000, when respondents were allowed to select one or more of six racialcategories. NCDB adopted “racial bridging” rules to create categories comparable to priorcensuses, by assigning multiracial groups to single-race groups. Because multiracialselection is rare (about 2% of respondents nationwide selected more than one racial group),little error is introduced by the use of these racial categories. NCDB’s race data rely on long-form tables drawn from a one-in-six sample only, which introduces some random error intothe data set.
To simplify the presentation, in the following tables we have aggregated data for tracts in allmetropolitan regions in the sample. There are significant differences across regions in therelative proportions of types of tracts, but similar trends are found in all of them.
Method of Classification and AnalysisThe analysis involves several steps. The first two are decisions about method. One is thechoice of metropolitan regions to include in the study, on the basis of the racial/ethniccomposition of their populations during 1980–2000. Another is to solve the problem ofneighborhood classification. What are the exact criteria to delineate the conceptualcategories that the study is based on, for example, how “white” is an all-white tract, andwhat representation of a group in a tract is enough to count the group as “present”?
Having made these methodological choices, our exploration of the data begins withdocumentation of trends over time in the relative frequency of different types ofneighborhoods and in the proportion of group members who live in each type. Here wedemonstrate the disappearance of all-white neighborhoods, the rapid growth of the mostdiverse four-group neighborhood, and the persistence of various types of minorityneighborhoods. We also show that the results are not dependent on a particular classificationscheme but appear in a similar pattern even when very different criteria are used to classifyneighborhoods.
The next step is to examine the evolution of neighborhoods. Following the lead of priorstudies, this is done through construction of a transition matrix. We have studied transitionmatrices for the single decades 1980–90 and 1990–2000. Here we present mainly the resultsfor the full two-decade period, 1980–2000. For every tract in 2000, the transition matrixreveals the category that the tract fell into 20 years before. It shows that some pathways ofchange and some kinds of persistence are remarkably common, while others are rarelyfound. For the three key transitions—from all white to mixed, the addition of blacks to tractswith the other three groups, and the loss of whites from the most diverse tracts—data arealso presented on decade-by-decade changes. These descriptive analyses and theirinterpretation in terms of pathways of racial change are the basis for the core conclusions ofthe study. Subsequent analytical steps are intended to examine why these transitions occur,testing the applicability of invasion-succession and buffering explanations.
IDENTIFYING DIVERSE METROPOLITAN AREAS AND DIVERSENEIGHBORHOODS
The new diversity spawned by immigration is hardly uniform across the country. Figure 1illustrates the variations in the percentage of the population born abroad in 2000 bymetropolitan region. The darkest-shaded areas had more than 15% foreign born, while thelightest areas had less than 5%. Clearly, we should not be looking for global neighborhoods
Logan and Zhang Page 8
AJS. Author manuscript; available in PMC 2013 September 05.
NIH
-PA Author Manuscript
NIH
-PA Author Manuscript
NIH
-PA Author Manuscript
in much of the United States, especially not in parts of the Midwest and South where thetraditional black-white color line prevails. But what level of diversity is enough to merit acloser look?
The problem of establishing cutoffs is critical in this study because we need to set criteriafirst for which metropolitan regions to study and then to classify census tracts within them.We have experimented with several alternative approaches at the metropolitan level, seekingcriteria that would (1) establish that there is a significant presence of whites and all threeminority groups but (2) not disqualify a region if one of the three minority groups fellmodestly short. We have selected 24 metropolitan regions where in 1980, 1990, and 2000 atleast two minority groups were present at or above their average national level and the thirdgroup was present at or above one-half of their average national level.2 Table 1 lists thethreshold values. These shifted over the decades, beginning quite low for Asians (1.1% in1980, meaning only 0.55% was the absolute minimum presence for that year for ametropolis to be included in our sample). The analysis includes only metropolitan regionsthat met these criteria in every decade. Arguments could be made for studying moremetropolitan regions or fewer; we view our criteria as a starting point for future studies.
These selection criteria identify a set of metropolitan regions that clearly stand out from theU.S. average. In 2000 the aggregate population of these areas was less than half non-Hispanic white (49.1%), and it was 14.4% non-Hispanic black, 27.4% Hispanic, and 8.8%Asian. The selection includes many of the largest metropolises: New York (plus Newark,Jersey City, Bergen-Passaic, and Trenton), Chicago, and Los Angeles. The West andSouthwest are well represented, especially California (San Francisco, Sacramento, SanDiego, Bakersfield, Oakland, Riverside, Stockton, and Vallejo) and Texas (Dallas, FortWorth, Houston, College Station, and Galveston). Others, more regionally isolated, includeMiami, Denver, Colorado Springs, and Las Vegas. These metropolitan regions are identifiedwith a star in figure 1.
The next methodological decision is how to classify census tracts within each metropolitanregion in terms of the specific combination of groups that are present in them. UnlikeDenton and Massey (1991), we are interested not only in the combinations of minoritygroups but also in the variable presence of non-Hispanic whites. This brings to 15 thenumber of neighborhood types that we will need to track (as in Alba et al. 1995). They couldbe all white, all black, all Hispanic, or all Asian. They could include any combination of twogroups (white and black, black and Hispanic, etc.) or of three groups, or they could includeall four groups.3
What should be the criteria for classifying tracts into these categories? As Smith (1998; seealso White 1986) points out, most measures of neighborhood diversity or integration arebased on the relative presence of group members (i.e., their percentage of the population)rather than their absolute number. This is true of the Index of Dissimilarity, in which a groupthat is present in a subarea to the same extent as it is in the full area (regardless of itsabsolute size) does not add to the value of the segregation score. It is also characteristic ofMaly’s (2000) Neighborhood Diversity Index and classification schemes used by Ellen(2000) and Fasenfest, Booza, and Metzger (2004). Yet some previous studies of racialtransitions used a fixed numerical threshold: 30 residents for the 1970–80 decade (Dentonand Massey 1991) or 100 residents for 1970–90 (Alba et al. 1995). One difficulty with a
2As noted above, Frey and Farley (1996) described as “multiethnic” a larger set of 37 areas in which any two minority groups werepresent to this degree in 1990, regardless of the population of the third group.3For simplicity, these types are referred to below with abbreviations that identify which groups are present. For example, “A” denotesan Asian-only tract, and “WBHA” denotes a tract where all four groups are present.
Logan and Zhang Page 9
AJS. Author manuscript; available in PMC 2013 September 05.
NIH
-PA Author Manuscript
NIH
-PA Author Manuscript
NIH
-PA Author Manuscript
fixed number is that tract populations vary widely, and 30 group members are a strongerpresence in a tract with 150 residents than in a tract with 7,500 residents (these sizes are nottypical but also not rare). To reduce the impact of such variation in tract size, Alba et al.(1995) limited their analysis to tracts with at least 500 residents. Another difficulty is thatany fixed number will be more difficult to attain for a small group (this would be Asians inmost metropolitan regions) than for a large one and will represent a different degree ofunder-or overrepresentation.
For some purposes, a fixed number may be the right choice; even in a very large tract, apopulation of 30 or 100 group members does establish a presence. We choose to use apercentage criterion instead. Our criterion also takes into account the group’s share of thetotal population in the metropolitan areas that we study. This is not true of all indexes. Forexample, the Entropy Index reaches its maximum value of diversity in cases in which everygroup is present in the same proportion (if there are four groups, therefore, the most diverseneighborhood is the one with 25% of the population from each group). This is anunreachable standard because groups vary in overall size. In fact, it may not be a desirablecriterion. In most metropolitan regions, a neighborhood that is 25% Asian represents anextreme level of Asian concentration, while a 25% non-Hispanic white neighborhood is onewhere whites are severely underrepresented. We use as a reference point the percentage ofeach group in the overall population of the 24 metropolises in each year (1980, 1990, and2000) of the study. Allowing the reference point to shift over time responds to the rapidgrowth of Hispanic and Asian populations. If the same criterion were used throughout theperiod, the growth of these groups would necessarily result in a rising number of tractswhere they are present, even if there were no shift in their relative location acrossneighborhoods. It could be argued that the criteria should also vary across metropolitanregions. In a study focused on a single region, we would agree that the criteria should betailored to that region’s racial and ethnic makeup. In this study in which results areaggregated across all 24 “diverse” regions, our preference is to ensure that the criteriaidentify similar kinds of places in every region.
Even these choices leave open the question of how closely a group’s share of the tractpopulation needs to approach the group’s share of the aggregate population to qualify as“present.” We have tested in the range of 10%–50% of the aggregate share. This means, forwhites in 2000, for example, who were 49.1% of the population in our diverse regions, thatwe tested criteria ranging from as little as 5% (this is the 10% criterion) to as high as 25%(this is the 50% criterion) of the tract population. At any of these levels, whites wereunderrepresented, but one could argue that there were “enough” whites to classify them aspresent. For the smallest group, Asians, who were 8.8% of the aggregate population, wetested criteria as low as 0.9% and as high as 4.4% in the tract.
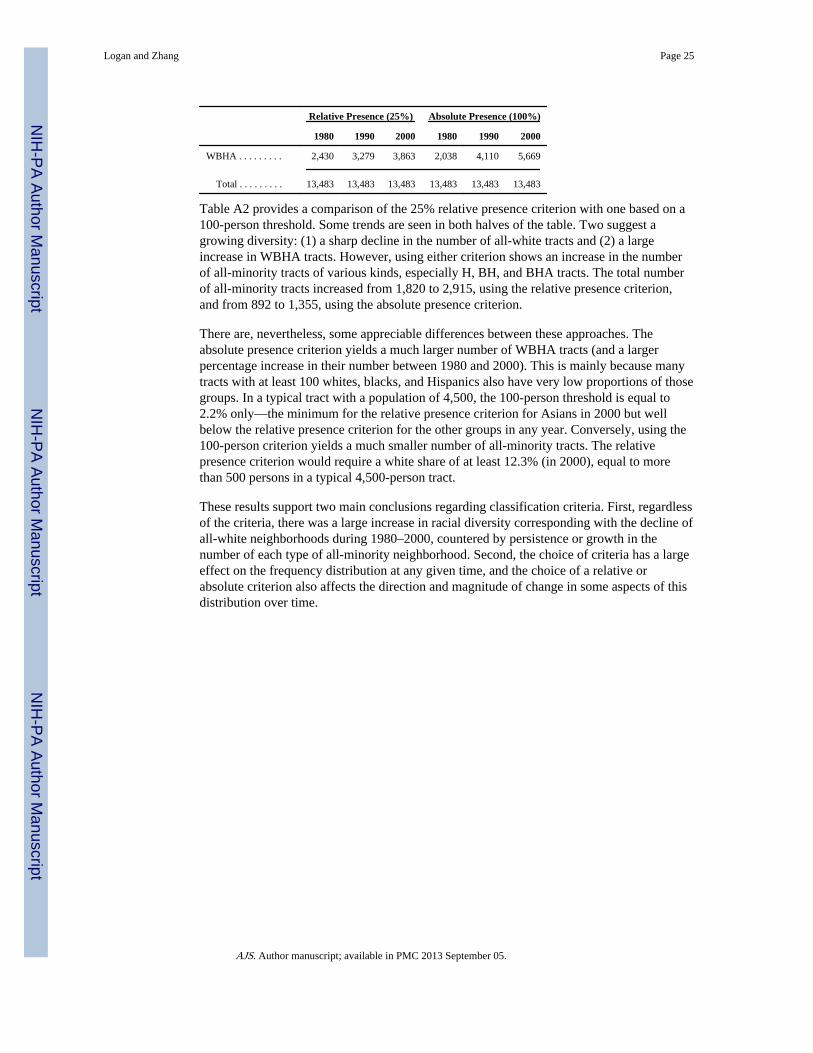
We adopt the 25% criterion for the remainder of this study. We have replicated all of theanalyses for the 15% and 50% criteria, and results on the patterns of change are robustacross the threshold levels that we tested. The appendix provides a comparison of thedistribution of tracts in 1980, 1990, and 2000 based on each of these percentage criteria. Theappendix also compares the distribution of tracts over time based on the 25% criterion withthe alternative of an absolute number threshold of 100 persons.
To clarify how tracts are classified by the 25% criterion, table 2 presents the average racialcomposition of each category of tract in 1980, 1990, and 2000. The table shows that all-white tracts averaged 93.7% white in 2000, with small shares of black (0.9%), Hispanic(3.8%), and Asian (1.1%) residents. All-black tracts averaged 94.8% black, all-Hispanictracts 92.4% Hispanic, and all-Asian tracts 86.2% Asian. At the other extreme, the mostdiverse type of tract containing all four groups (WBHA) had an average composition very
Logan and Zhang Page 10
AJS. Author manuscript; available in PMC 2013 September 05.
NIH
-PA Author Manuscript
NIH
-PA Author Manuscript
NIH
-PA Author Manuscript
close to each group’s share of the total metro population. They had a near majority of whiteresidents (47.9%; somewhat below whites’ 49.1% share of the total population of thesemetros). Blacks were 13.1%, compared to 14.4% of the metro total. Hispanics were 26.7%,close to their 27.4% of the population. And Asians were 11.9%, compared to 8.8% of thetotal. The results in table 2 make as clear as possible what we have in mind when we useterms like all white, all minority, or diverse to describe neighborhoods.
The table also shows some shifts in the average composition of different types of tractsbetween 1980 and 2000. These shifts reflect the general decline in the non-Hispanic whiteshare of the population and the growth of the Hispanic and Asian populations in theseregions. The average WBHA tract in 1980, for example, had a much larger white population(59.2%) and fewer Hispanics (18.5%) and Asians (6.8%) than that category of tract in 2000.The growing number of black-Hispanic tracts shifted from having a majority of blackresidents in 1980 (63.9% black and 30.3% Hispanic) to nearly equal shares of both groups(48.4% and 47.0%, respectively). Blacks were typically the largest group in BHA tracts in1980 but very much outnumbered by Hispanics in 2000. And in nearly every category oftracts with a white presence, the percentage of whites declined during these years. This said,the changes did not make the differences between these categories less meaningful. Table 2demonstrates that each category retained the distinctive average profile that is intended byour approach to classification.
TRANSITIONSWe now report the volume of various types of changes in racial composition, beginning withhow many people were affected by these changes. To do this, we start with a simplifiedtabulation that divides tracts into just four categories, on the basis of whether whites werepresent in 1980 or 2000. These are (1) all-minority tracts (with varying combinations ofminority groups) in both 1980 and 2000, (2) mixed tracts where whites were present invarying combinations with other groups in both years, (3) tracts that had no white presencein 1980 but gained a white presence by 2000, and (4) tracts where whites were present in1980 but not in 2000—examples of white exit. Table 3 provides these population counts forboth 1980 and 2000.
In this simplified scheme, where did members of each group live, and in what setting didtheir numbers increase the most? The figures show that neighborhood changes had relativelysmall effects on the distribution of the white population. There was a modest shift associatedwith white exit. Out of more than 29 million whites, about 1.5 million lived in tracts thatexperienced this sort of change in 1980, and only about 0.4 million whites remained in themin 2000. So the volume of white exit by this measure was 1.1 million. This loss was nearlybalanced by an increase of the white population in tracts that retained a white presence incombination with one or more minority groups, a change that represents growing exposureto diversity. There was therefore little net change in exposure of the white population tominorities. Almost entirely absent was movement of whites into newly integratedneighborhoods that were previously all minority.
In contrast, for each minority group the predominant change was growth in tracts that had awhite presence in 1980 and where whites remained in 2000. This pattern generallyrepresents increasing diversity. It was the Asian population that most dramatically increasedexposure to whites by this measure. The number of Asians more than tripled in tracts with acontinuing white presence, an increase of 3.2 million. In comparison, Asian growth in areasof white exodus and in all-minority tracts was modest.
For blacks and Hispanics, there were large shifts in the direction of both increasing diversityand persistent segregation. Representing greater exposure to whites, the total black
Logan and Zhang Page 11
AJS. Author manuscript; available in PMC 2013 September 05.
NIH
-PA Author Manuscript
NIH
-PA Author Manuscript
NIH
-PA Author Manuscript
population of tracts where whites remained more than doubled, increasing by about 2.3million, while the number of blacks living in tracts that remained all minority dropped by0.8 million. The countertrend is that about 1.4 million blacks lived in places that became allminority in 1980 because whites exited, and these tracts themselves housed a growing blackpopulation. Consequently, a majority of blacks continued to live in all-minorityneighborhoods despite the trend toward diversity. The Hispanic population exploded intracts where whites maintained a presence, from 3.7 million in 1980 to 10.6 million in 2000.But this growth was also partly counterbalanced by the 3.3 million Hispanics who lived inareas of white exodus and the increase of 0.9 million in areas that remained all minority.
We turn now to a more detailed examination of change over 20 years at the tract level.Results are presented in table 4 in the form of a 15 × 15 transition matrix. Tracts listedacross the columns are categorized by their composition in 2000; their 1980 composition isshown in the stub column. Cell entries are the number of tracts, not taking into account theirpopulation size. The discussion below includes information, which is not found in the table,on the average racial composition of tracts in each cell in 1980 and 2000. We have alsoexamined the separate 1980–90 and 1990–2000 transition matrices and found a smallervolume of change, but in similar directions, in both decades. We summarize some of themost significant 10-year paths of change in more detail in a following section.4
Changes in Tracts with a White PresenceWe begin with the lower-right-hand quadrant of table 4: tracts that had a white presence inboth 1980 and 2000. The single most notable change is increasing diversity of tractcomposition where whites are present. For example, there has been a substantial decline inthe share of all-white tracts. Of the 1,210 all-white tracts in 1980, only 333 remained allwhite. These 333 tracts averaged 97.5% white in 1980 and remained 94.0% white in 2000.Nearly three-quarters of the all-white tracts added other groups, especially Asians alone(301), Hispanics and Asians (166), or Hispanics alone (137).
The largest increase in tracts with a white presence was for WBHA tracts, which rose from18.5% to 28.9% of all tracts. This repeats what was already shown in table 2. What is new isinformation about the trajectories leading to this outcome. The rise in WBHA tracts ismainly because of the stability of tracts that already contained all groups in 1980 andbecause of the entry of blacks into tracts that previously contained only whites, Hispanics,and Asians. About a third of tracts that were WBHA by 2000 had been WHA in 1980.Hence, the main pathway toward the most diverse racial composition is through theintermediate step of having all groups except blacks. WHA tracts that became WBHAaveraged less than 2% black in 1980 but 8.5% black in 2000, an appreciable gain. They alsogained Hispanics and Asians. These tracts had been predominantly white (79.1%) in 1980,and they remained, on average, majority white (50.1%) in 2000.
4One question raised in the review process is whether the picture might be different for metropolitan areas that met the criteria in 1980but fell below the threshold criteria in either 1990 or 2000. There were three such cases: Merced, Calif. (population 210,554 in 2000),Salinas, Calif. (401,762), and Vineland-Millville-Bridgeton, N.J. (146,438). Merced and Salinas had very large Hispanic populationsby 2000 (over 45%), substantial Asian populations (over 8%), but modest and declining black populations (3.9% and 4.0%,respectively). Vineland-Millville-Bridgeton had large Hispanic and black populations throughout the period but a small Asianpresence (falling below our threshold in 2000 with only 1.1% Asian). These three metropolitan regions contain only 158 census tracts,not enough to have a major impact on the findings reported here. They are distinctive in including only one tract that was all minorityin 1980 and remained all minority, and only 21 tracts that became all minority in 2000 as a result of a declining white populationshare. Trajectories of other tracts are similar in some respects to what is reported here for the sampled regions: the largest share oftracts in 2000 were WHA and WBH, the largest source of WBHA tracts were those that were previously WHA, and the majority ofWBHA tracts in 1980 remained WBHA. One difference is that by 1980 there were only two all-white tracts in these metropolitanregions. Another difference, likely because of the declining black populations in the two California cases, is that 10 of 42 WBHAtracts in 1980 lost a black presence in 2000, reverting to the WHA category.
Logan and Zhang Page 12
AJS. Author manuscript; available in PMC 2013 September 05.
NIH
-PA Author Manuscript
NIH
-PA Author Manuscript
NIH
-PA Author Manuscript
Table 4 demonstrates that it is rare for blacks to enter a tract with white presence, exceptwhen both Hispanics and Asians were already in place. The implication is that the all-grouptract is the main route to black-white integration. This point is made in a simple butpowerful way in figures 2 and 3. These figures present scatter plots that show how the 1980–2000 increase in the percentage of whites and blacks who live in WBHA tracts in ametropolitan region is associated with a decline in segregation in that region (as measuredby the Index of Dissimilarity). Only San Francisco is omitted because this is the onemetropolis in which there were actually losses in the shares of whites and blacks in this typeof tract. The association for the remaining 23 regions is strong (with R2 of .67 and .76).Growth of WBHA tracts is a powerful predictor of declining segregation.
About two-thirds of WBHA tracts in 1980 remained in the same category by 2000,representing a high level of what could be called stable integration. Of the remainder, nearly500 lost white presence. A slightly smaller number retained white presence but lost one ormore minority groups. These departures limit the contribution of WBHA tracts to black-white integration. Of more concern for the future, the stock of WHA tracts is diminishing.WHA tracts were positioned in 1980 to contribute heavily to creation of all-group tractsbecause, at that time, they were the most numerous type, accounting for 28.2% of all tracts.But the number of newly minted WHA tracts created from tracts that had been white, whiteAsian, or white Hispanic in 1980 is not keeping up with the number of transitions fromWHA to another type. Hence, the potential for continued creation of the most diverseneighborhoods—while still considerable—is more limited in 2000 than it was in 1980.
Changes in Tracts with No White PresenceWe now turn to the situation of all-minority tracts. These, too, are increasing in number, arise of more than 50% (from 1,819 in 1980 to 2,904 in 2000). More than half (1,727) of all-minority tracts in 2000 were already all minority in 1980 (these are tracts in the upper-leftquadrant of table 4). But a considerable number (1,177) resulted from white exit. Forexample, 492 tracts that were WBHA in 1980 lost their white presence by 2000, the largestshare becoming BHA. Such tracts tended to be those that already had a smaller white sharein 1980. Those that remained WBHA averaged 64.5% white in 1980, while those thattransitioned to BHA had averaged only 39.6% white. Still, the white exodus wasconsiderable, with the white share falling to 7.9% in 2000 in those that became BHA.
White decline is especially important because it appears to be a one-way transition (in thevocabulary of Markov chains, the all-minority category is an absorbing state). Standing outfor its absence is a type of change that involves whites moving into minority areas. Forexample, almost no WHA tracts in 2000 had previously been all Hispanic, all Asian, ormixed HA, although in principle the addition of whites to such neighborhoods could havebeen a contributor. In fact there are very few cases of any type in which whites were notpresent in 1980 but had entered by 2000 (this is the upper-right quadrant of table 4 thatcontains only 92 tracts). This finding provides a strong counterpoint to the rapid growth inthe number of WBHA neighborhoods, and it is reminiscent of a key feature of the classicblack-white scenario. Invasion and succession in that model were understood to operateprincipally in one direction; once tracts became all black, it was assumed that a new stableequilibrium had been reached. All-minority tracts are now in the same position of havingvery little likelihood of future white presence.
Black-only tracts are a significant category. Their number has remained steady over timebecause a roughly equal number of black tracts add Hispanics or Asians versus those thatbecome all black because of the loss of other groups. Hispanic-only tracts, by contrast, haveincreased. The main source of new Hispanic tracts is the loss of whites and Asians fromformerly WH or WHA tracts. Hispanic-Asian tracts have grown in number for a similar
Logan and Zhang Page 13
AJS. Author manuscript; available in PMC 2013 September 05.
NIH
-PA Author Manuscript
NIH
-PA Author Manuscript
NIH
-PA Author Manuscript
reason, mainly from the loss of whites in WHA tracts. And black-Hispanic tracts have alsoincreased, partly from the addition of Hispanics to formerly black tracts but more often fromthe loss of whites or Asians from formerly more diverse areas.
One other pathway of change stands out in this table: Asian exit from tracts that were allminority in 1980. In fact, close to half of BHA tracts, half of HA tracts, and half of BA tractsin 1980 lost their Asian presence. These tended to be tracts whose Asian populations wereoriginally relatively small, and a typical change was from about 2.5% Asian to less than 1%Asian.
Changes from Decade to DecadeMore can be learned by examining the history of transitions in each decade, separating1980–90 from 1990–2000. At this level of detail, we focus only on the three starting pointsthat are most important in the global neighborhood context. One question is regarding thetrajectory of all-white tracts, where the introduction of Asian or Hispanic presence ispresumed to be the least threatening racial change in the perception of white residents, andthe introduction of blacks is another theoretically significant alternative. Another istransitions involving WHA tracts, where the most relevant changes involve adding blackpopulation (becoming WBHA) or losing white presence. A third concern is the durability ofWBHA tracts, which may also experience white exodus or lose the presence of one of theminority groups. The main transitions are displayed in table 5. This table shows the mostcommon outcomes in 1990 and 2000 for tracts that were WHA, WBHA, or W in 1980. The“other” category is the sum of all less common outcomes.
We first note the high degree of stability of WBHA tracts compared to all other types.Neighborhoods often move over time across categories, in part because many of them arenear the cutting points that were used to define the categories. The typical case is that 40%–60% of tracts remain in the same category. But table 5 offers three instances of whathappens to WBHA tracts over a decade, and in every one, more than 70% remain WBHA.The relative durability of this form of diversity contradicts the usual tipping pointassumption of the invasion-succession model. This result suggests that relatively stableintegration is possible in a global neighborhood context.
Another observation is the prevalence of certain specific sequences of change. White tracts(W) in 1980—if they do not remain all minority—are most likely to become white andAsian (WA) in 1990. But they are unlikely to gain a black presence at this point. Then in thefollowing decade, the most common outcome of change is to become WHA. And if they hadalready moved from W to WHA in the 1980s, the most likely outcome of change is to addblack presence as the next step. Similarly, WHA tracts in 1980, if they change, are mostlikely to become WBHA in 1990 and stay WBHA in 2000. There is a clear pattern ofincremental introduction of additional minority groups to areas with a white presence(blacks after Asians and Hispanics), and this phenomenon is key to the emergence of themost diverse global neighborhoods. White exit is among the least likely transitions for WA,WH, WHA, or WBHA tracts, contrary to the expectations of invasion succession.
Third, and perhaps surprising in light of these common sequences, is the weakness of pathdependence. That is, the percentage of tracts in category x in 1990 that are found in categoryy in 2000 does not depend strongly on tracts’ prior category in 1980. For some categories oftracts in 1990, the only contingency that we might expect is for tracts to revert to theirformer category. For example, if a WHA tract had recently been all white, perhaps thatwould make it more likely to return to all white. Alternatively, from an invasion-successionperspective, growth in minority population in one decade is expected to be followed, fairlyreadily, by white exit. In that case, for example, WHA tracts in 1990 that had been all white
Logan and Zhang Page 14
AJS. Author manuscript; available in PMC 2013 September 05.
NIH
-PA Author Manuscript
NIH
-PA Author Manuscript
NIH
-PA Author Manuscript
in 1980, that had been only WA or WH, or that had experienced growth in any minoritygroup’s population during the 1980s would be more likely to lose white presence by 2000.
Table 5 offers considerable information on transitions by WHA tracts, including those thatwere WHA in 1980 as well as those that became WHA in 1990. They are likely to remainWHA, regardless of what category they were in previously (this is the case for 54.5% ofWHA tracts in 1980, 59.3% of WHA tracts in 1990 that were already WHA in 1980, 46.8%of WHA tracts in 1990 that were WBHA in 1980, and 42.4% of WHA tracts in 1990 thatwere W in 1980). Otherwise they are most likely to transition to WBHA (this is the case for24.0% of WHA tracts in 1980, 25.2% of tracts that were WHA in both 1980 and 1990,28.2% of WHA tracts in 1990 that were WBHA in 1980, and 26.3% of WHA tracts in 1990that were W in 1980). The small range of variation in these transition probabilities isevidence against path dependence.
It is possible to test for path dependency more rigorously with multivariate methods,controlling for other characteristics of tracts in 1980 and examining whether the tract’scategory in 1980—or whether change in the size of a particular group in the 1980s—affectstransitions between 1990 and 2000. We have estimated multinomial logistic regressionmodels, parallel to those for 1980–2000 that are presented in the next section.5 Some of theeffects of 1980 category and of 1980–90 population shifts are statistically significant, butthey do not present a clear pattern.
First, all-white tracts in 1990 that had been more mixed in 1980 (WA or WHA) were morelikely to add Hispanic or Asian presence by 2000, suggesting a tendency for reversion totheir prior category. But curiously, higher gains in Hispanic residents in the 1980sdiminished the likelihood to add Hispanic or Asian presence by 2000. There were no effectsof 1980 category or 1980–90 changes on the likelihood of adding a black presence by 2000to these all-white tracts.
There are confusing effects for tracts that were WHA in 1990. Here there is no tendency toreturn to the prior category. The opposite is true: those that had been all white in 1980 weremore likely to add a black presence (becoming WBHA), while those that had been WBHAin 1980 were less likely to add blacks and return to the WBHA category. Those that hadbeen WH in 1980 were more likely to experience white exodus by 2000. If a Hispanicpopulation grew more in the 1980s, it was more likely that a black presence would be added,perhaps supportive of a buffering hypothesis.
Finally, WBHA tracts in 1990 that had been all white in 1980 were significantly more likelyto lose white presence by 2000. The history of white presence, for some reason, shows littlestaying power in this case. More understandably, the greater the increase in black, Hispanic,or Asian population in the 1980s, the more likely it is that whites would be absent by 2000.
PREDICTING PATHWAYS OF STABILITY AND CHANGE, 1980–2000Having found little evidence that changes in one decade are affected by conditions orchanges over the previous 10 years, we focus our attention now on predicting transitionsacross the full 20-year period. These transitions have the advantage that they are less likelythan 10-year changes to reflect random or short-term fluctuations. We test hypotheses fromthe invasion-succession and multiethnic buffering perspectives using multinomial logisticregression and logistic regression models to analyze changes between 1980 and 2000. Ineach model the reference category is “remaining the same,” and model coefficients estimate
5Model results are not presented here; tables are available on request.
Logan and Zhang Page 15
AJS. Author manuscript; available in PMC 2013 September 05.
NIH
-PA Author Manuscript
NIH
-PA Author Manuscript
NIH
-PA Author Manuscript
the impact of independent variables on the odds of experiencing a particular changeoutcome.
To simplify the analysis (considering that there are 15 starting points, each of which has 15possible outcomes), we study here only the three starting points examined in table 5. Forparsimony, some outcome categories have been combined to represent the substantivelyinteresting types of change.
Prior studies of neighborhood racial change have identified several potential predictors. Forexample, Lee and Wood (1991) found that a growing black population was more likely inareas with close proximity to the central business district and to an all-black tract, lowsocioeconomic status, a younger population, and a larger share of new residents. Tracts withsmaller Hispanic populations but larger shares of foreign-born residents were likely toexperience greater increases in black percentage. Most important to Lee and Wood, blackincreases were significantly lower in the West than in the other regions of the country, andthis regional variation is their main clue that succession is not a universal process.
The predictors in the following analysis include indicators of the initial 1980 racialcomposition (percentage black, percentage Hispanic, and percentage Asian). Nativity (shareof foreign-born residents) is included here to test whether there is also an independent effectof immigration. Income (median family income) and home ownership (share of owner-occupied housing) are the key indicators of socioeconomic status and market desirability.Family composition (share of female-headed households) is another potential indicator ofstructural deprivation. Age composition (share of residents age 65 and above) is included asan indicator of aging in place and immobility for long-time residents, often a correlate ofwhite flight and minority entry. Residential turnover (the share of residents who have livedin their homes for less than five years) is a likely predictor of growing minority presencebecause it reflects vacancies and weaker community ties, while population growth duringthe period (1980–2000) is viewed as an indicator of community attractiveness and also forthe potential of new groups to arrive along with other newcomers.
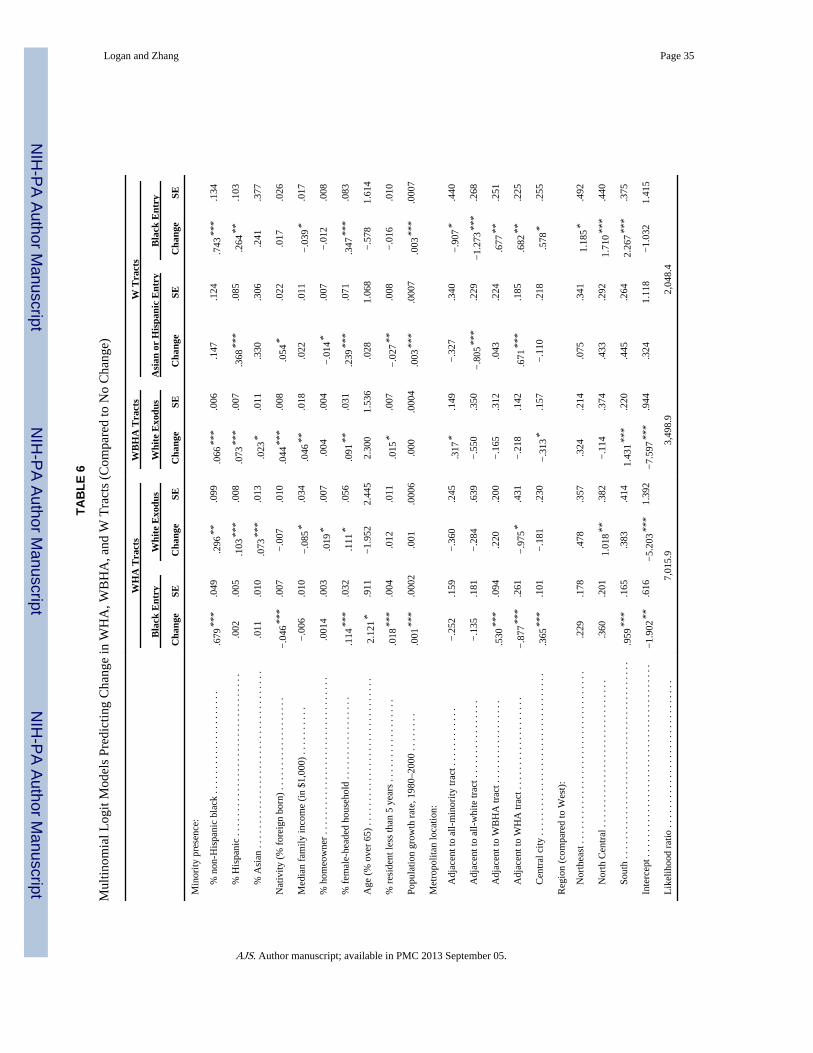
Following Denton and Massey (1991), the model also includes several spatial variables.Characteristics of surrounding areas are summarized as dummy variables that indicatewhether the tract is adjacent to an all-minority tract, an all-white tract, a WHA tract, and aWBHA tract. These variables model the spatial autocorrelation (or clustering ofneighborhood types) that is evident in most regions. They represent the substantive role ofproximity to all-minority areas (and conversely to all-white areas) in the invasion-successionmodel and proximity to neighborhoods that whites share with Hispanics and Asians in thebuffering model. Regional dummy variables (representing the Northeast, North Central, andSouthern states in comparison to the West) and a central-city/suburb dichotomy are alsointroduced as controls. Results are presented in table 6.
WHA TractsWe begin with the analysis of the 1980 WHA tracts. One potential end state in 2000 is toremain WHA. This is treated as the reference category in comparison to two alternatives:black entry (becoming WBHA) and white exodus (in which case the most likely end point isHA). Hence, this model is a multinomial logistic regression, and other less commonoutcomes are omitted from the analysis. A simpler bivariate analysis (not shown here)reveals that WHA tracts that gained blacks were very similar to those that remained WHA interms of initial racial composition and socioeconomic status. They were distinctive mainlyin having a higher share of recent growth. Those that lost whites already had a much lowerwhite presence in 1980 than those where whites remained; in fact, on average they already
Logan and Zhang Page 16
AJS. Author manuscript; available in PMC 2013 September 05.
NIH
-PA Author Manuscript
NIH
-PA Author Manuscript
NIH
-PA Author Manuscript
initially had a Hispanic majority. Their poverty rate was also more than double that of otherWHA tracts, reflecting initial differences that also appear in other socioeconomic indicators.
Table 6 shows that the odds of black entry are higher in those tracts that already had a higherblack population (although they were below the threshold for black presence in 1980). Intracts that added black presence, the average black increase was about 7 percentage points,from 2% to 9%. All of these tracts began with a significant Asian and Hispanic presence.Beyond that threshold, having a larger share of Hispanics or Asians did not affect blackentry. Tracts with a higher proportion of foreign-born residents had reduced odds of blackentry. In this respect, the “global” composition of the neighborhood is an obstacle to greaterdiversity.
Income and home ownership have no effect. More female headship and an older populationcomposition favor black entry. Blacks are more likely to enter in tracts with more recentlyarrived residents during 1975–80 and faster growth during 1980–2000. In both respects,population flux facilitates greater diversity. Creation of WBHA neighborhoods through thispath is much more likely in central city locations and in the South. Contrary to the invasion-succession model, there is no effect of adjacency to an all-minority tract. Adjacency to anexisting WBHA tract favors entry of blacks (so that the WHA tract becomes more like itsneighbor). Surprisingly, being adjacent to another WHA tract decreases the odds of blackentry.
The model for white exodus (again in contrast to remaining WHA) might be expected to bethe inverse of the one for black entry. It is only partly so. Whites are more likely to lose theirpresence in tracts with higher shares of each of the three minority groups. Intuitively, onemight interpret this as exodus because whites were barely above the threshold in 1980, and,thus, even a random change could result in dropping below the threshold level. But thereduction was typically more substantial than that. For example, tracts that changed fromWHA to HA averaged about 32% white in 1980 but fell to below 8% white in 2000.
Of the socioeconomic variables, tracts with lower income and more female-headedhouseholds—but higher home ownership—were more likely to lose whites. There is noeffect of nativity, age composition, transient population, or growth. The location variablesshow white exodus to be more common in North Central metropolitan regions, with no city-suburb differential. The only spatial variable with a significant effect is adjacency to anotherWHA tract, which decreases the odds of white exit (i.e., the WHA tract remains more likeits neighbor).
WBHA TractsWith WBHA tracts, our principal interest is in white exodus, and the model here is abinomial logit that compares this outcome with no change. Again, when tracts lost whitepresence the change was substantial, not simply variation close to the threshold. In WBHAtracts that changed to BHA, for example, the average white share dropped from 40% in 1980to 8% in 2000. Bivariate analyses showed that WBHA tracts that lost whites began in 1980with a lower but still substantial share of white residents (39%, compared to about 65% inother WBHA tracts). They also had lower median family incomes (about $43,000, comparedto over $50,000 for other tracts in this category), and they had lower standing on othersocioeconomic indicators.
Similar to white exodus from WHA tracts, the model shows strong positive effects of thesize of each minority group on the odds of white loss (and here Hispanic population share ismore consequential than black share). White exodus is also positively associated withdiversity as represented by the percentage foreign born. Socioeconomic variables have
Logan and Zhang Page 17
AJS. Author manuscript; available in PMC 2013 September 05.
NIH
-PA Author Manuscript
NIH
-PA Author Manuscript
NIH
-PA Author Manuscript
mixed effects. Surprisingly, whites were more likely to leave higher-income tracts, but theywere also more likely to leave tracts with more female headship. There is no effect of homeownership or age composition. Population growth has no effect, but white exodus is greaterin areas with a more transient pre-1980 population. There is a strong positive effect on whiteexodus of adjacency to an all-minority tract, but white exodus is surprisingly less likely incentral cities. WBHA tracts in Southern metropolitan regions are more likely to experiencewhite exodus.
All-White TractsTable 6 also evaluates predictors of change in tracts that were all white in 1980. As shownabove, the number of such tracts declined rapidly. The multinomial logit model predicts twopaths of change. One path adds an Asian or a Hispanic presence; this is the most commontransition. The other adds blacks, alone or in combination with other minorities. Note thatall-white tracts averaged above 95% white in 1980; in 2000 they averaged 90% white intracts that became WA, 83% white in those that became WH, and only 70%–80% incategories that included blacks.
All-white tracts that added Asians or Hispanics only tended initially to have a higher shareof Hispanics than did those that remained all white. They also had a higher initial share offoreign-born residents. In terms of socioeconomic status, they had fewer homeowners andmore female-headed households, but their income levels were not different from those thatstayed all white. Their level of pre-1980 residential stability was higher, and they grew morerapidly during the period. There are also some significant locational differences. All-whitetracts adjacent to other all-white tracts were less likely to add Asians or Hispanics, but thoseadjacent to WHA tracts were more likely to do so.
All-white tracts that added blacks had a higher share of black residents to begin with. Theyalso had more Hispanics (possibly suggestive of buffering), but the effect of percentageAsian is not significant, nor is the effect of nativity. They tended to have lower incomes andhigher female headship. They also grew more rapidly than those that remained all whiteduring the period.
Adjacency to an all-minority tract has a surprising negative effect. Adjacency to an all-whitetract reduced the odds of black entry, but adjacency to a WHA or WBHA tract and centralcity location increased the likelihood of black entry. Black entry is more likely in theNortheast, North Central, and especially in Southern states, compared to that in the West.
Summary of Predictors of ChangeOne purpose of these models is to test whether minority entry or white exit are associatedwith the market weakness posited by invasion succession. The answer is mostly negative.Important signs of market weakness, including a high share of elderly residents, a transientpopulation, and slow population growth, do not have the predicted effects. Black entry intoWHA tracts and both Asian/Hispanic and black entry into all-white tracts are in fact morelikely in places with growing populations, contradicting invasion succession. A fewcoefficients are in the expected direction. Higher female headship predicts greater likelihoodof Asian/Hispanic or black entry into all-white tracts, and minority entry is less likely intracts with more home ownership (Hispanic/Asian entry) or higher income (black entry). Butof these indicators, only female headship, not income or ownership, is related to black entryinto WHA tracts, and this finding raises the possibility that the presence of Hispanics orAsians in these tracts (or buffering) changes the traditional dynamic.
The main expectation based on the buffering hypothesis is that black entry would befacilitated by greater Asian and Hispanic presence and that white exodus from integrated
Logan and Zhang Page 18
AJS. Author manuscript; available in PMC 2013 September 05.
NIH
-PA Author Manuscript
NIH
-PA Author Manuscript
NIH
-PA Author Manuscript
tracts would be less likely where there are more Asian and Hispanic residents. Evidence forsuch effects is slim, although it must be acknowledged that each model was tested within aselection of tracts that already closely resembled one another in terms of racial composition.In a broader analysis, we would have looked for disproportionate black entry into WHAtracts compared to other types of tracts. In this analysis, Hispanic share predicts black entryinto all-white tracts. But white exodus increases with the share of Asians, Hispanics, andblacks. This apparent white avoidance of minorities is more compatible with the invasion-succession model than with buffering.
Other predictions are about metropolitan location. Note that these are characteristics of thetracts’ spatial embedment in the urban zone, independent of their own populationcomposition. There are multiple spatial effects that mostly are consistent with spatialclustering, showing a tendency of tracts to remain or become similar to adjacent tracts. Asanticipated by invasion succession, whites are more likely to leave WBHA tracts adjacent toall-minority tracts, and black entry to all-white tracts is more likely in central cities. Butblacks are more likely to enter all-white neighborhoods that are adjacent to WHA andWBHA tracts, as anticipated by buffering.
CONCLUSIONIn certain parts of the country, in metropolitan regions that are home to over 60 millionAmericans, large-scale immigration is creating a context of global neighborhoods where thetraditional black-white color line is replaced by a more complex array of whites, blacks,Hispanics, and Asians. Our research question is how this influx affects long-establishedpatterns of residential segregation and processes of neighborhood racial change.
Other scholars have grappled with this question. Several prior studies unsuccessfully soughta direct connection between the ethnic diversity of the metropolitan population and the levelof black-white segregation. Growing awareness of the multigroup context of segregation hasencouraged scholars to work with segregation measures where a single index value for awhole metropolitan region is intended to reflect the degree to which all groups tend to bepresent within the same tract in that region. These measures can generally distinguishbetween metropolitan regions where single-group tracts or combinations of two groups arepredominant versus those where more complex combinations are found. But they do notprovide information about which groups are found together or how particular combinationsof groups shift over time. The approach taken here is to identify categories of neighborhoodsand observe how they change. This approach corresponds better than simpler summarymeasures to the conceptual question of what groups are found together.
Critical to dealing with such questions is our finding that invasion succession and someaspects of ethnic buffering coexist. In global neighborhoods, we find contradictory patternsof change that both reduce and reproduce segregation. From the perspective of intergroupexposure, the good news is a powerful trend toward representation of all four main racial/ethnic groups in highly diverse neighborhoods: neighborhoods that come close to mirroringthe composition of these diverse metropolitan areas as a whole. Blacks often enter diverseneighborhoods when the way has been prepared by the presence of Hispanics and Asians.What is more, in a considerable number of census tracts this form of diversity has enduredacross two decades, while it continues to emerge in others. For the often-asked question ofwhether stable integration is possible, the experience of global neighborhoods suggests thata route exists. In this way, our findings offer the first strong empirical support for theconjecture that immigration diminishes the color line in the metropolis. The all-whiteneighborhood is becoming a relic of the past, and most whites (and most Asians, as well asmany Hispanics and blacks) live in neighborhoods with high levels of diversity.
Logan and Zhang Page 19
AJS. Author manuscript; available in PMC 2013 September 05.
NIH
-PA Author Manuscript
NIH
-PA Author Manuscript
NIH
-PA Author Manuscript
What is more, the processes creating these mixed neighborhoods are unlike those thatunderpinned black invasion and succession in the past. Minority entry or white exodus inglobal neighborhoods is not closely associated with community disadvantage or marketweakness in the way that black population growth and white decline are explained in theusual neighborhood life-cycle model. There are some indications that a larger Hispanic/Asian presence in the neighborhood or in adjacent areas can facilitate black entry intoneighborhoods where whites remain, as anticipated by the buffering hypothesis.
Although the invasion-succession model does not help much to explain which tracts willexperience racial transitions, we have documented continuing white flight, even in the lasttwo decades and even from neighborhoods where Hispanics and Asians are available as asocial buffer between whites and blacks. The more blacks, Hispanics, or Asians in a tract,the more likely that whites will leave. Most important, the large expanses of metropolitanspace that became all-minority neighborhoods during the 20th century are not attractingwhite residents. To be sure, there remains considerable racial heterogeneity in such areas,but it is mainly expressed in new relationships between blacks, Hispanics, and—to a lesserextent—Asians. Blacks, in particular, continue to have a heavy concentration in theselocales. Hence, the new diversity turns out to be consistent with sustained high levels ofsegregation, especially between blacks and whites.
This is a disturbing conclusion from a policy perspective because it implies that there is noroute to a fully integrated metropolis. Because white flight continues to create new all-minority neighborhoods and because the minority zone is an “absorbing state,” a growingshare of metropolitan space has little future prospect of white entry. One could imagine thatat some point the demand for locations with good access to central business districts maybegin to pull white households back into this zone. Parts of the South Bronx have beendescribed as an example where once-minority, now-vacant space can become desirable forredevelopment. But this rarely happened during 1980–2000, and there are obstacles to itsoccurrence on a large scale. First, although black residents have tended to leave these areas(as shown in table 3), the continued arrival of Hispanics and Asians prevents them fromdepopulating. Second, although we have not presented the evidence here, this is also thespace that offers the least opportunities for residents (e.g., it has the highest levels ofconcentrated poverty and the other social and health conditions associated with inner-citypoverty, regardless of whether they are actually located in the urban core). Despite thepopularity of accounts of widespread urban gentrification, there is no process currentlyunderway that is likely to bring whites into such neighborhoods.
Thinking of paths of change as a transition matrix allows us to raise different questions thanthe standard approach of ranking metropolitan areas on a scale of neighborhood diversity,entropy, or segregation. How do neighborhood trajectories differ across metropolitan areaswith different local histories? Are there perceptible shifts in paths of change even inmetropolitan regions with less diverse populations? Where in the metropolis are variouscategories of tracts or transitions more likely to be found, and how does the spatial model forglobal neighborhoods correspond to the concentric zone model that proved so useful to theChicago school ecologists? What neighborhood conditions and community resources areavailable to people in one sort of neighborhood or another, and if neighborhooddisadvantage becomes less important as a determinant of changing racial composition, willgroup inequalities in locational resources diminish? How does neighborhood diversitytranslate into opportunities for public education? How is diversity related to disparities inpublic health or criminal victimization?
If the all-minority neighborhood is a permanent fixture in urban America, more attentionneeds to be given to the quality of life in this zone. Again speaking from a policy
Logan and Zhang Page 20
AJS. Author manuscript; available in PMC 2013 September 05.
NIH
-PA Author Manuscript
NIH
-PA Author Manuscript
NIH
-PA Author Manuscript
perspective, it is illegitimate to acquiesce to a situation of both separate and unequal. And ifthere is to be any hope for future integrated neighborhoods in this large slice of themetropolis, these communities must achieve some minimum standard of livability. We havenot studied the predictors of white entry into minority neighborhoods because this has beensuch a rare occurrence. But almost certainly the quality of life, opportunities, and publicservices in these neighborhoods are currently a deterrent to whites.
The neighborhoods where whites and minorities do increasingly live together pose differentquestions. What is the capacity of these neighborhoods to grow and to accommodate risingnumbers of minorities? Under what conditions could there be a white backlash andacceleration of white flight? Alternatively, is there a point at which whites’ experience withdiversity will actually undermine the color line, as buffering appears to do, so that whites’evident reluctance to be less than a population majority in their neighborhoods has lessimpact on their residential choices?
We hesitate to extrapolate from the transitions found in the last two decades to those thatwill occur in the future or from the very diverse metropolitan regions studied here to otherparts of the country. We suspect that there are metropolitan regions where the Hispanicpopulation alone can play the same buffering role that we found for Hispanics and Asianstogether in this study. We also suspect that stable integration involving whites and blackswill be less likely in the many metropolitan regions (especially in the Midwest and theSouth) where an influx of Hispanics and Asians is only a recent phenomenon and where thepattern of white-black segregation has a long history. Indeed, in such areas the new groupsmay themselves tend to be more residentially segregated as they grow in numbers. We donot foresee a return to the form of segregation typified by all-white neighborhoods becausethere are now well-established processes for minority entry. But a scenario that has alreadyemerged in the metropolitan regions studied here is a new type of polarization: one notsimply between blacks and whites but between a zone of increasing diversity and a minorityzone where whites are unlikely ever to venture.
ReferencesAlba, Richard D.; Denton, Nancy A.; Leung, Shuyin; Logan, John R. Neighborhood Change under
Conditions of Mass Immigration: The New York City Region, 1970–1990. International MigrationReview. 1995; 29:625–56.
Aldrich, Howard. Ecological Succession in Racially Changing Neighborhoods: A Review of theLiterature. Urban Affairs Quarterly. 1975; 10:327–48.
Denton, Nancy A.; Massey, Douglas S. Residential Segregation of Blacks, Hispanics, and Asians bySocioeconomic Status and Generation. Social Science Quarterly. 1988; 69:797–817.
Denton, Nancy A.; Massey, Douglas S. Patterns of Neighborhood Transition in a Multiethnic World:U.S. Metropolitan Areas, 1970–1980. Demography. 1991; 28:41–63. [PubMed: 2015944]
Duncan, OD.; Duncan, Beverly. The Negro Population of Chicago. Chicago: University of ChicagoPress; 1957.
Ellen, Ingrid Gould. Stable Racial Integration in the Contemporary United States: An EmpiricalOverview. Journal of Urban Affairs. 1998; 20:27–42.
Ellen, Ingrid Gould. Sharing America’s Neighborhoods: The Prospects for Stable Racial Integration.Cambridge, Mass: Harvard University Press; 2000.
Farley, Reynolds; Frey, William. Changes in the Segregation of Whites from Blacks during the 1980s:Small Steps toward a More Integrated Society. American Sociological Review. 1994; 59:23–45.
Fasenfest, David; Booza, Jason; Metzger, Kurt. Living Cities Census Series. Washington, D.C:Brookings; 2004. Living Together: A New Look at Racial and Ethnic Integration in MetropolitanNeighborhoods, 1990–2000.
Logan and Zhang Page 21
AJS. Author manuscript; available in PMC 2013 September 05.
NIH
-PA Author Manuscript
NIH
-PA Author Manuscript
NIH
-PA Author Manuscript
Fong, Eric; Shibuya, Kumiko. Multiethnic Cities in North America. Annual Review of Sociology.2005; 31:285–304.
Frey, William; Farley, Reynolds. Latino, Asian, and Black Segregation in U.S. Metropolitan Areas:Are Multi-Ethnic Metros Different? Demography. 1996; 33:35–50. [PubMed: 8690139]
Friedman, Samantha. Do Declines in Residential Segregation Mean Stable Neighborhood RacialIntegration in Metropolitan America? A Research Note. Social Science Research. 2008; 37(3):920–33.
Guest, Avery. The Changing Racial Composition of the Suburbs, 1950–1970. Urban Affairs Quarterly.1978; 14:195–206. [PubMed: 12262812]
Guest, Avery M.; Zuiches, James J. Another Look at Residential Turnover in Urban Neighborhoods: ANote on ‘Racial Change in a Stable Community’ by Harvey Molotch. American Journal ofSociology. 1971; 77:457–67.
Hoover, Edgar; Vernon, Raymond. Anatomy of a Metropolis. Cambridge, Mass: Harvard UniversityPress; 1959.
Iceland, John. Beyond Black and White: Metropolitan Residential Segregation in Multi-EthnicAmerica. Social Science Research. 2004; 33:248–71.
Lee, Barret A.; Wood, Peter B. Is Neighborhood Racial Succession Place-Specific? Demography.1991 Feb.28:21–40. [PubMed: 2015943]
Logan, John R.; Alba, Richard D.; McNulty, Tom; Fisher, Brian. Making a Place in the Metropolis:Locational Attainment in Cities and Suburbs. Demography. 1996; 33:443–53. [PubMed: 8939417]
Logan, John R.; Schneider, Mark. Racial Segregation and Racial Change in American Suburbs, 1970–1980. American Journal of Sociology. 1984; 89:874–88.
Logan, John R.; Stults, Brian; Farley, Reynolds. Segregation of Minorities in the Metropolis: TwoDecades of Change. Demography. 2004; 41:1–22. [PubMed: 15074122]
Maly, Michael T. The Neighborhood Diversity Index: A Complementary Measure of RacialResidential Settlement. Journal of Urban Affairs. 2002; 22:37–47.
Maly, Michael T. Beyond Segregation: Multiracial and Multiethnic Neighborhoods in the UnitedStates. Philadelphia: Temple University Press; 2005.
Massey, Douglas; Denton, Nancy. American Apartheid: Racial Segregation and the Making of theUnderclass. Cambridge, Mass: Harvard University Press; 1993.
Molotch, Harvey L. Managed Integration: Dilemmas of Doing Good in the City. Berkeley: Universityof California Press; 1972.
Nyden, Philip; Lukehart, John; Maly, Michael; Peterman, William. Racial and Ethnic Diversity in U.S.Cities. Cityscape: A Journal of Policy Development and Research. 1998; 4(2):1–17.
Ottensman J, Gleason M. The Movement of Whites and Blacks into Racially Mixed Neighborhoods,Chicago 1960–1980. Social Science Quarterly. 1992; 73:645–62.
Saltman, J. A Fragile Movement: The Struggle for Neighborhood Stabilization. New York:Greenwood; 1990.
Sanjek, Roger. The Future of Us All: Race and Neighborhood Politics in New York City. Ithaca, N.Y:Cornell University Press; 1998.
Sassen, Saskia. The Global City: New York, Tokyo, London. Princeton, N.J: Princeton UniversityPress; 1991.
Schwirian, Kent. Models of Neighborhood Change. Annual Review of Sociology. 1983; 9:83–102.
Taeuber, Karl; Taeuber, AF. Negroes in Cities. Chicago: Aldine; 1965.
Tatian, PA. Census CD Neighborhood Change Database (NCDB) 1970–2000 Tract Data: Data User’sGuide, Long Form Release. Washington, D.C: Urban Institute in collaboration with GeoLytics;2003.
White, Michael. Segregation and Diversity Measures in Population Distribution. Population Index.1986; 52:198–221. [PubMed: 12340704]
Logan and Zhang Page 22
AJS. Author manuscript; available in PMC 2013 September 05.
NIH
-PA Author Manuscript
NIH
-PA Author Manuscript
NIH
-PA Author Manuscript
APPENDIX
Comparisons among Different Threshold CriteriaWhen there is not a well-established criterion for classification to rely on, a natural questionis to what degree the results depend on the criteria that are employed. This appendixpresents two sorts of comparisons. The first comparison is based on the “relative presence”criterion used in this study; here we vary the degree of presence that is demanded. Thesecond compares the 25% “relative presence” criterion with the alternative of a fixedabsolute number of residents; following Alba et al. (1995), we use 100 as the threshold forgroup presence. In both cases, we calculate the distribution of census tracts across tract typesin 1980, 1990, and 2000.
Table A1 presents three different criteria for relative presence. The most demanding is 50%(i.e., the share of group members in the tract is at least half as large as the group’s share inthe total population of the multiethnic metropolitan regions in the study). At this level,whites are counted as present in a tract only if they are above 32.6% of residents in 1980,28.9% in 1990, or 24.6% in 2000. The 15% criterion is the least demanding, with whitescounted as present at only 9.8% in 1980, 8.7% in 1990, and 7.4% in 2000. Using any ofthese criteria, a higher share of whites than of any other group is required to establishpresence, while the threshold for Asians is the lowest. Also, the white threshold drops overtime, while the Hispanic and Asian thresholds rise substantially. These are all consequencesof our decision to use proportional representation as the basis for classification.
TABLE A1
Distribution of Tracts by Racial Composition by Decade and Threshold of Group Presence
The table also presents the number of tracts in the 24 metropolitan regions that meet thesecriteria. The number of tracts that we classify in each category depends on the criterion. At50% in a given year, there are many more tracts classified as all white, all black, or allHispanic, as well as many more tracts in specific two-group categories, including HispanicAsian, white Asian, and white Hispanic. And there are more tracts where whites are theabsent group (BHA). At 15% in any given year, all of these types are less common, and byfar the largest numbers of tracts have multiple groups, especially WBHA and WHA.
Evidently, any statement about the preponderance of single-group versus more diverseneighborhoods is contingent on the definition. The same data could lead to the conclusionthat groups tend to be rather separated in these metropolitan areas or highly intermingled,depending on what constitutes separation or intermingling. Much more uniform are thetrends over time. Even using the strictest 50% criterion, we find that in some respectsdiversity is increasing. The number of all-white tracts is much lower in 2000 than in 1980,while the number of WBHA tracts is greater. However, the number of all-Hispanic tractsincreased, some combinations that lack whites (e.g., HA, BH, and BHA) also increased, andthere was a sharp decline in one of the more diverse categories, WHA. These trends arefound in table A1, regardless of which criterion is used.
TABLE A2
Distribution of Tracts by Racial Composition by Decade and Criterion of Group Presence
Table A2 provides a comparison of the 25% relative presence criterion with one based on a100-person threshold. Some trends are seen in both halves of the table. Two suggest agrowing diversity: (1) a sharp decline in the number of all-white tracts and (2) a largeincrease in WBHA tracts. However, using either criterion shows an increase in the numberof all-minority tracts of various kinds, especially H, BH, and BHA tracts. The total numberof all-minority tracts increased from 1,820 to 2,915, using the relative presence criterion,and from 892 to 1,355, using the absolute presence criterion.
There are, nevertheless, some appreciable differences between these approaches. Theabsolute presence criterion yields a much larger number of WBHA tracts (and a largerpercentage increase in their number between 1980 and 2000). This is mainly because manytracts with at least 100 whites, blacks, and Hispanics also have very low proportions of thosegroups. In a typical tract with a population of 4,500, the 100-person threshold is equal to2.2% only—the minimum for the relative presence criterion for Asians in 2000 but wellbelow the relative presence criterion for the other groups in any year. Conversely, using the100-person criterion yields a much smaller number of all-minority tracts. The relativepresence criterion would require a white share of at least 12.3% (in 2000), equal to morethan 500 persons in a typical 4,500-person tract.
These results support two main conclusions regarding classification criteria. First, regardlessof the criteria, there was a large increase in racial diversity corresponding with the decline ofall-white neighborhoods during 1980–2000, countered by persistence or growth in thenumber of each type of all-minority neighborhood. Second, the choice of criteria has a largeeffect on the frequency distribution at any given time, and the choice of a relative orabsolute criterion also affects the direction and magnitude of change in some aspects of thisdistribution over time.
Logan and Zhang Page 25
AJS. Author manuscript; available in PMC 2013 September 05.
NIH
-PA Author Manuscript
NIH
-PA Author Manuscript
NIH
-PA Author Manuscript
Fig. 1.U.S. population percentage foreign born
Logan and Zhang Page 26
AJS. Author manuscript; available in PMC 2013 September 05.
NIH
-PA Author Manuscript
NIH
-PA Author Manuscript
NIH
-PA Author Manuscript
Fig. 2.1980–2000 percentage increase of whites in WBHA tracts and associated decline insegregation.
Logan and Zhang Page 27
AJS. Author manuscript; available in PMC 2013 September 05.
NIH
-PA Author Manuscript
NIH
-PA Author Manuscript
NIH
-PA Author Manuscript
Fig. 3.1980–2000 percentage increase of blacks in WBHA tracts and associated decline insegregation.
Logan and Zhang Page 28
AJS. Author manuscript; available in PMC 2013 September 05.
NIH
-PA Author Manuscript
NIH
-PA Author Manuscript
NIH
-PA Author Manuscript
NIH
-PA Author Manuscript
NIH
-PA Author Manuscript
NIH
-PA Author Manuscript
Logan and Zhang Page 29
TAB
LE 1
Ave
rage
Com
posi
tion
of M
etro
polit
an A
reas
in th
e U
nite
d St
ates
1980
1990
2000
%SD
%SD
%SD
Non
-His
pani
c w
hite
. . .
82.7
14.2
80.2
15.3
74.8
16.7
Non
-His
pani
c bl
ack
. . .
9.5
9.8
9.9
10.0
10.9
10.6
His
pani
c. .
. . .
. . .
. . .
. . .
. .5.
911
.67.
312
.89.
914
.3
Asi
an .
. . .
. . .
. . .
. . .
. . .
. . .
.1.
13.
52.
04.
12.
94.
8
Oth
er .
. . .
. . .
. . .
. . .
. . .
. . .
..8
.9.7
1.8
1.5
2.0
T
otal
. . .
. . .
. . .
. . .
. . .
. . .
100
100
100
AJS. Author manuscript; available in PMC 2013 September 05.
NIH
-PA Author Manuscript
NIH
-PA Author Manuscript
NIH
-PA Author Manuscript
Logan and Zhang Page 30
TAB
LE 2
Ave
rage
Com
posi
tion
of T
ract
s by
Typ
e in
200
0 (2
5% C
rite
rion
)
1980
1990
2000
WB
HA
WB
HA
WB
HA
A .
. . .
. . .
. . .
9.7
1.0
2.6
87.3
8.0
1.1
2.5
88.8
6.3
1.2
2.5
86.2
H .
. . .
. . .
. .8.
7.7
89.9
.37.
5.6
91.1
.66.
1.8
92.4
.7
HA
. . .
. . .
.7.
9.8
80.8
10.3
8.2
1.3
75.0
15.7
6.7
1.4
71.6
20.3
B .
. . .
. . .
. . .
2.5
95.7
1.5
.12.
195
.81.
6.2
1.8
94.8
2.6
.4
BA
. . .
. . .
. .
5.4
88.3
2.3
3.8
5.0
82.2
3.0
9.6
3.5
81.6
3.9
10.5
BH
. . .
. . .
.5.
163
.930
.3.2
4.0
58.0
37.2
.43.
648
.447
.0.8
BH
A .
. . .
. .7.
554
.732
.74.
76.
538
.445
.29.
66.
430
.749
.912
.5
W .
. . .
. . .
. .97
.0.5
1.9
.495
.8.6
2.7
.693
.7.9
3.8
1.1
WA
. . .
. . .
.93
.5.9
2.2
3.2
89.2
1.1
3.2
6.4
83.7
1.3
4.2
10.5
WH
. . .
. . .
.77
.5.8
20.7
.473
.21.
124
.3.8
62.7
1.3
34.2
1.1
WH
A .
. . .
.75
.61.
317
.65.
069
.31.
619
.98.
961
.61.
724
.611
.7
WB
. . .
. . .
.71
.325
.82.
2.3
72.7
23.1
3.2
.664
.430
.04.
3.9
WB
A .
. . .
.78
.215
.22.
63.
875
.514
.23.
66.
472
.012
.74.
910
.0
WB
H .
. . .
.52
.526
.120
.6.3
52.0
21.6
25.1
.744
.020
.134
.31.
1
WB
HA
. . .
59.2
15.0
18.5
6.8
54.8
13.2
21.9
9.7
47.9
13.1
26.7
11.9
Not
e.—
A =
Asi
an; B
= b
lack
; H =
His
pani
c; W
= w
hite
.
AJS. Author manuscript; available in PMC 2013 September 05.
NIH
-PA Author Manuscript
NIH
-PA Author Manuscript
NIH
-PA Author Manuscript
Logan and Zhang Page 31
TAB
LE 3
Popu
latio
n of
Tra
cts
in F
our
Cat
egor
ies,
198
0 an
d 20
00
All
Min
orit
y in
198
0W
hite
s P
rese
nt in
198
0
All
Min
orit
y in
200
0A
dded
Whi
tes
Tot
alW
hite
Exo
dus
in 2
000
Whi
tes
Rem
aine
dT
otal
Popu
latio
n:
19
80 .
. . .
6,43
2,34
724
2,94
16,
675,
288
4,25
7,38
934
,586
,763
38,8
44,1
52
20
00 .
. . .
6,45
9,39
227
4,14
36,
733,
535
5,71
3,17
547
,830
,414
53,5
43,5
89
Whi
tes:
19
80 .
. . .
321,
701
25,7
4434
7,44
51,
549,
855
27,8
03,0
1229
,352
,867
20
00 .
. . .
160,
676
71,1
5323
1,82
942
0,19
928
,671
,006
29,0
91,2
05
Bla
cks:
19
80 .
. . .
4,22
1,97
313
0,41
84,
352,
391
831,
416
1,65
0,36
02,
481,
776
20
00 .
. . .
3,40
2,49
810
3,35
93,
505,
857
1,36
4,43
33,
902,
091
5,26
6,52
4
His
pani
cs:
19
80 .
. . .
1,73
2,99
673
,340
1,80
6,33
61,
634,
364
3,72
1,12
45,
355,
488
20
00 .
. . .
2,66
5,65
672
,275
2,73
7,93
13,
322,
606
10,5
95,0
7313
,917
,679
Asi
ans:
19
80 .
. . .
133,
286
12,3
4114
5,62
722
1,36
11,
265,
114
1,48
6,47
5
20
00 .
. . .
215,
533
25,7
3224
1,26
558
9,13
24,
489,
381
5,07
8,51
3
AJS. Author manuscript; available in PMC 2013 September 05.
NIH
-PA Author Manuscript
NIH
-PA Author Manuscript
NIH
-PA Author Manuscript
Logan and Zhang Page 32
TAB
LE 4
Tra
nsiti
on M
atri
x fo
r T
ract
Rac
ial/E
thni
c C
ompo
sitio
n, 1
980–
2000
Cat
egor
y in
198
0
Tra
ct C
ateg
ory
in 2
000
Tot
alA
HH
AB
BA
BH
BH
AW
WA
WH
WH
AW
BW
BA
WB
HW
BH
A
A .
. . .
. . .
. . .
. . .
. . .
. . .
. . .
. . .
. . .
. . .
. .2
00
01
01
02
00
00
00
6
H .
. . .
. . .
. . .
. . .
. . .
. . .
. . .
. . .
. . .
. . .
. .0
599
01
51
00
31
00
15
85
HA
. . .
. . .
. . .
. . .
. . .
. . .
. . .
. . .
. . .
. . .
.1
3854
00
69
01
00
00
00
109
B .
. . .
. . .
. . .
. . .
. . .
. . .
. . .
. . .
. . .
. . .
. .0
10
383
2310
725
10
02
46
22
556
BA
. . .
. . .
. . .
. . .
. . .
. . .
. . .
. . .
. . .
. . .
.0
00
219
109
00
00
02
010
61
BH
. . .
. . .
. . .
. . .
. . .
. . .
. . .
. . .
. . .
. . .
.0
71
619
420
931
01
01
211
1061
7
BH
A .
. . .
. . .
. . .
. . .
. . .
. . .
. . .
. . .
. . .
.0
416
2410
142
165
00
01
01
715
385
W .
. . .
. . .
. . .
. . .
. . .
. . .
. . .
. . .
. . .
. . .
.0
00
11
02
333
301
137
166
4146
5812
41,
210
WA
. . .
. . .
. . .
. . .
. . .
. . .
. . .
. . .
. . .
. . .
.0
00
21
00
112
706
3324
017
112
1820
91,
450
WH
. . .
. . .
. . .
. . .
. . .
. . .
. . .
. . .
. . .
. . .
090
131
020
545
4634
535
34
1213
927
01,
343
WH
A .
. . .
. . .
. . .
. . .
. . .
. . .
. . .
. . .
. . .
182
161
41
1449
2229
219
31,
424
548
109
1,30
13,
706
WB
. . .
. . .
. . .
. . .
. . .
. . .
. . .
. . .
. . .
. . .
00
013
25
213
103
836
2939
4420
4
WB
A .
. . .
. . .
. . .
. . .
. . .
. . .
. . .
. . .
. . .
00
08
28
14
190
821
8820
112
291
WB
H .
. . .
. . .
. . .
. . .
. . .
. . .
. . .
. . .
. . .
05
319
512
044
35
2417
1010
224
190
679
WB
HA
. . .
. . .
. . .
. . .
. . .
. . .
. . .
. . .
. .
17
4922
692
315
637
1413
76
7515
51,
500
2,42
2
T
otal
. . .
. . .
. . .
. . .
. . .
. . .
. . .
. . .
. .
529
330
655
971
949
721
540
1,41
975
32,
357
145
431
783
3,79
213
,124
AJS. Author manuscript; available in PMC 2013 September 05.
NIH
-PA Author Manuscript
NIH
-PA Author Manuscript
NIH
-PA Author Manuscript
Logan and Zhang Page 33
TAB
LE 5
Tra
nsiti
on P
roba
bilit
ies
for
1980
–90
and
1990
–200
0: N
umbe
r an
d Pe
rcen
tage
of
Tra
cts
Follo
win
g E
ach
Path
Typ
e
1980
1990
2000
No.
Typ
eN
o.%
Typ
eN
o.%
WH
A3,
705
WH
A2,
018
54.5
WH
A1,
196
59.3
WB
HA
508
25.2
WA
116
5.7
Oth
er19
89.
8
WB
HA
888
24.0
WB
HA
707
79.6
WH
A79
8.9
Oth
er10
211
.5
WH
253
6.8
WH
100
39.5
WH
A82
32.4
Oth
er71
28.1
WA
236
6.4
WA
143
60.6
WH
A48
20.3
Oth
er45
19.1
Oth
er31
08.
4
WB
HA
2,42
2W
BH
A1,
771
73.1
WB
HA
1,34
075
.7
BH
A18
310
.3
Oth
er24
814
.0
WB
H17
77.
3W
BH
7240
.7
WB
HA
6335
.6
Oth
er42
23.7
BH
A15
96.
6B
HA
103
64.8
BH
2817
.6
Oth
er28
17.6
WH
A12
45.
1W
HA
5846
.8
WB
HA
3528
.2
Oth
er31
25.0
Oth
er19
17.
9
W1,
210
W56
646
.8W
280
49.5
AJS. Author manuscript; available in PMC 2013 September 05.
NIH
-PA Author Manuscript
NIH
-PA Author Manuscript
NIH
-PA Author Manuscript
Logan and Zhang Page 34
Typ
e
1980
1990
2000
No.
Typ
eN
o.%
Typ
eN
o.%
WA
128
22.6
WH
6411
.3
Oth
er94
16.6
WA
289
23.9
WA
143
49.5
WH
A55
19.0
Oth
er91
31.5
WH
114
9.4
WH
4842
.1
WH
A27
23.7
Oth
er39
34.2
WH
A99
8.2
WH
A42
42.4
WB
HA
2626
.3
Oth
er31
31.3
Oth
er14
211
.7
AJS. Author manuscript; available in PMC 2013 September 05.
NIH
-PA Author Manuscript
NIH
-PA Author Manuscript
NIH
-PA Author Manuscript
Logan and Zhang Page 35
TAB
LE 6
Mul
tinom
ial L
ogit
Mod
els
Pred
ictin
g C
hang
e in
WH
A, W
BH
A, a
nd W
Tra
cts
(Com
pare
d to
No
Cha
nge)
WH
A T
ract
sW
BH
A T
ract
sW
Tra
cts
Bla
ck E
ntry
Whi
te E
xodu
sW
hite
Exo
dus
Asi
an o
r H
ispa
nic
Ent
ryB
lack
Ent
ry
Cha
nge
SEC
hang
eSE
Cha
nge
SEC
hang
eSE
Cha
nge
SE
Min
ority
pre
senc
e:
%
non
-His
pani
c bl
ack
. . .
. . .
. . .
. . .
. . .
. . .
. . .
.679
***
.049
.296
**.0
99.0
66**
*.0
06.1
47.1
24.7
43**
*.1
34
%
His
pani
c . .
. . .
. . .
. . .
. . .
. . .
. . .
. . .
. . .
. . .
. . .
..0
02.0
05.1
03**
*.0
08.0
73**
*.0
07.3
68**
*.0
85.2
64**
.103
%
Asi
an .
. . .
. . .
. . .
. . .
. . .
. . .
. . .
. . .
. . .
. . .
. . .
. ..0
11.0
10.0
73**
*.0
13.0
23*
.011
.330
.306
.241
.377
Nat
ivity
(%
for
eign
bor
n) .
. . .
. . .
. . .
. . .
. . .
. . .
−.0
46**
*.0
07−
.007
.010
.044
***
.008
.054
*.0
22.0
17.0
26
Med
ian
fam
ily in
com
e (i
n $1
,000
) . .
. . .
. . .
. .
−.0
06.0
10−
.085
*.0
34.0
46**
.018
.022
.011
−.0
39*
.017
% h
omeo
wne
r . .
. . .
. . .
. . .
. . .
. . .
. . .
. . .
. . .
. . .
. . .
.001
4.0
03.0
19*
.007
.004
.004
−.0
14*
.007
−.0
12.0
08
% f
emal
e-he
aded
hou
seho
ld .
. . .
. . .
. . .
. . .
. . .
..1
14**
*.0
32.1
11*
.056
.091
**.0
31.2
39**
*.0
71.3
47**
*.0
83
Age
(%
ove
r 65
) . .
. . .
. . .
. . .
. . .
. . .
. . .
. . .
. . .
. . .
.2.
121*
.911
−1.
952
2.44
52.
300
1.53
6.0
281.
068
−.5
781.
614
% r
esid
ent l
ess
than
5 y
ears
. . .
. . .
. . .
. . .
. . .
. .
.018
***
.004
.012
.011
.015
*.0
07−
.027
**.0
08−
.016
.010
Popu
latio
n gr
owth
rat
e, 1
980–
2000
. . .
. . .
. .
.001
***
.000
2.0
01.0
006
.000
.000
4.0
03**
*.0
007
.003
***
.000
7
Met
ropo
litan
loca
tion:
A
djac
ent t
o al
l-m
inor
ity tr
act .
. . .
. . .
. . .
. .
−.2
52.1
59−
.360
.245
.317
*.1
49−
.327
.340
−.9
07*
.440
A
djac
ent t
o al
l-w
hite
trac
t . .
. . .
. . .
. . .
. . .
. .−
.135
.181
−.2
84.6
39−
.550
.350
−.8
05**
*.2
29−
1.27
3***
.268
A
djac
ent t
o W
BH
A tr
act .
. . .
. . .
. . .
. . .
. . .
..5
30**
*.0
94.2
20.2
00−
.165
.312
.043
.224
.677
**.2
51
A
djac
ent t
o W
HA
trac
t . .
. . .
. . .
. . .
. . .
. . .
. .−
.877
***
.261
−.9
75*
.431
−.2
18.1
42.6
71**
*.1
85.6
82**
.225
C
entr
al c
ity .
. . .
. . .
. . .
. . .
. . .
. . .
. . .
. . .
. . .
. . .
. ..3
65**
*.1
01−
.181
.230
−.3
13*
.157
−.1
10.2
18.5
78*
.255
Reg
ion
(com
pare
d to
Wes
t):
N
orth
east
. . .
. . .
. . .
. . .
. . .
. . .
. . .
. . .
. . .
. . .
. . .
. .
.229
.178
.478
.357
.324
.214
.075
.341
1.18
5*.4
92
N
orth
Cen
tral
. . .
. . .
. . .
. . .
. . .
. . .
. . .
. . .
. . .
. . .
.360
.201
1.01
8**
.382
−.1
14.3
74.4
33.2
921.
710*
**.4
40
So
uth
. . .
. . .
. . .
. . .
. . .
. . .
. . .
. . .
. . .
. . .
. . .
. . .
. . .
..9
59**
*.1
65.3
83.4
141.
431*
**.2
20.4
45.2
642.
267*
**.3
75
Inte
rcep
t . .
. . .
. . .
. . .
. . .
. . .
. . .
. . .
. . .
. . .
. . .
. . .
. . .
.−
1.90
2**
.616
−5.
203*
**1.
392
−7.
597*
**.9
44.3
241.
118
−1.
032
1.41
5
Lik
elih
ood
ratio
. . .
. . .
. . .
. . .
. . .
. . .
. . .
. . .
. . .
. . .
7,01
5.9
3,49
8.9
2,04
8.4
AJS. Author manuscript; available in PMC 2013 September 05.
NIH
-PA Author Manuscript
NIH
-PA Author Manuscript
NIH
-PA Author Manuscript
Logan and Zhang Page 36* P
< .0
5.
**P
< .0
1.
*** P
< .0
01.
AJS. Author manuscript; available in PMC 2013 September 05.